Phase I Trials Today

Published on 09/04/2015 by admin

Filed under Hematology, Oncology and Palliative Medicine

Last modified 22/04/2025

Print this page

rate 1 star rate 2 star rate 3 star rate 4 star rate 5 star
Your rating: none, Average: 2.5 (2 votes)

This article have been viewed 3632 times

Figure 48-1 The traditional “3 + 3” Phase I clinical trial design. The initial 3-patient cohort begins at a predefined dose. If no DLTs are observed, escalation to the next higher dose will occur. If a single DLT is observed, expansion of the cohort to a total of six patients occurs. If more than 1 DLT is observed, de-escalation to the next lowest dose will occur for a total of six patients treated at that dose. Termination of the study will occur if more than one DLT is observed at the starting dose. The MTD is defined as the highest dose level for which no more than one patient out of six experiences a DLT.
The rolling six design (RSD) has been used by the Children’s Oncology Group as an alternative design to the 3+3 design. 22,23 Because ethical considerations of informed consent almost always preclude a first-in-human trial in a pediatric population, the RSD is used to reduce trial interruptions and delays where there is prior human experience. The RSD begins like the 3+3 design and enrolls a cohort of 3 subjects on a dose. A fourth subject can be enrolled if at least one of the first 3 patients has not fully completed the initial first-dose evaluation for toxicity and no more than 1 of the previous 3 subjects has experienced a DLT. A fifth (sixth) patient can be enrolled if at least 1 of the first 4 (5) subjects has not completed the initial observation period and no more than 1 DLT has been observed. If not more than 1 fully evaluable patient at a specific dose cohort experiences a DLT, the study enrolls a new cohort of patients on the next highest dose. If at any time, 2 of 2 to 6 patients receiving the same dose experience a DLT, the study enrolls a new cohort of subjects on the next lowest dose. If 6 patients were already entered at the next lowest dose, that next lowest dose is selected as the MTD. The RSD allows for temporal overlap of the two cohorts of 3 subjects used in the 3+3 design. Hence, the probability of trial suspension to further accrual is lower in the RSD design as compared to the 3+3 design. 22

Table 48-1

Dose Escalation/De-escalation Decisions Associated with Toxicity Outcomes at a Given Dose for a Popular Version of the 3 + 3 Design

No. of Patients with Dose-Limiting Toxicity Decision
0/3 Escalate one level
1/3 Treat 3 more at same level
1/3 + 0/3 Escalate one level
1/3 + 1/3 Stop and choose previous dose as the MTD
1/3 + (2/3 or 3/3) Stop and choose previous dose as the MTD
2/3 or 3/3 Stop and choose previous dose as the MTD

Note that those rows with number of toxicities equal to 1/3 + t/3 (for t = 0, . . . , 3) corresponds to situations in which one toxicity is observed in the first cohort of 3 patients enrolled at the current dose and t toxicities are observed in the second cohort of patients enrolled at that dose.

Modifications to the Traditional Design

A fundamental conflict in Phase I trial design exists between escalating too quickly, resulting in the potential exposure of patients to excessive toxicity, and escalating too slowly, resulting in the treatment of patients at doses too low to be efficacious. 19 A major criticism of the traditional Phase I design is that the potential exists for many patients to be treated at subtherapeutic dose levels. In addition, the length of time these studies often take can inhibit the ability to rapidly bring new agents to subsequent Phase II and Phase III studies. Several variations to the traditional design have been developed in order to reduce the number of patients treated at doses below the biologically active level and to improve on the precision of the MTD definition. Some of the most commonly used types of modified traditional designs include those proposed by Storer 24 and by Simon and colleagues. 18
The Storer BD design uses a two-stage approach. 24 In the first stage, only a single patient is entered at each dose level. Dose escalation continues with one-patient cohorts until a DLT is observed. Accrual to the second stage then begins at one lower dose level and follows the traditional (three-patient cohort) design. Such a scheme allows fewer patients to be treated at dose levels less likely to be efficacious. Storer also proposed defining the MTD by fitting the first-course toxicity data to a logistic dose-toxicity curve and letting the MTD be defined as the dose level associated with a target DLT rate (e.g., 20% to 30%). 24 This allows for a more precise MTD definition.
Simon described three types of accelerated titration designs that were modifications of the traditional design (referred to by Simon as Design 1). 18 The Simon Design 2 is similar to the Storer design in that it uses single-patient cohorts during the initial stage, but the switch to the second stage (the traditional design) occurs when either the first instance of first course DLT is observed or if two patients exhibit grade 2 toxicity, as defined by the CTCAE, during their first course of treatment. 18 The Simon Design 3 mimics Design 2, except for the incorporation of more rapid dose escalation by using double-dose steps during the single-patient cohort stage. Finally, the Simon Design 4 is similar to Design 3, except switching to the second (three-patient cohort) stage may occur when either the first instance of a DLT occurs or the second instance of grade 2 toxicity is observed in any course of treatment. The three Simon accelerated titration designs also allow for intrapatient dose escalation, permitting escalation for an individual patient if toxicity during their previous course was less than grade 2 as defined by the CTCAE and did not result in a DLT. Accelerated titration designs have become very popular, as they can dramatically reduce the number of patients required, shorten the duration of the trial, and provide a great deal of information about cumulative toxicity, interpatient variability, and steepness of the dose-toxicity curve. 25 Most importantly, they provide all patients a maximum opportunity to be treated at a therapeutic dose. In reviewing several accelerated titration–design Phase I trials, it was identified that the advantages of its use from a prospective perspective were a minimal amount of patients needed to reach the MTD, a lower percentage of patients treated at potentially subtherapeutic doses or with an ineffective agent, and cost containment. 2630 However, accelerated titration designs did not expedite the speed of completion of studies overall, relative to traditional designs when compared to matching studies done in high-throughput Phase I centers.

Cytotoxic versus Targeted Design

One of the assumptions inherent in the traditional Phase I design is that both toxicity and clinical benefit will increase as the dose of an agent increases. For cytotoxic therapeutic agents, this assumption usually holds true. Recently, however, several agents have been developed that target specific tumor characteristics, such as receptor function, and these agents may not follow the standard efficacy/toxicity model. Specifically, targeted agents may demonstrate a plateau on the dose-efficacy curve, meaning higher doses will not improve clinical benefit. In addition, toxicity occurring with the use of these agents, if it occurs at all, may not necessarily increase as the dose increases. For drugs of this type, determining the MTD may not be feasible or useful. For targeted agents that do not produce immediate or consistent drug-related toxicity, three categories of alternative endpoints have been considered: (1) measuring inhibition of a target, (2) plasma drug levels that are biologically relevant, and (3) surrogate markers of biologic activity in nontumoral tissues. 31
Several Phase I trial designs have been developed for studies examining targeted, noncytotoxic agents. 3234 Hunsberger and colleagues proposed several designs based on the assumption that there is a binary (positive or negative) response that is measured in each patient after treatment with an agent; this response indicates whether or not the desired effect has been achieved. 32 The simplest of these designs mimics the traditional 3+3 design but adapts it to examine response rather than toxicity. The goal of this design is to recommend the lowest dose meeting a predefined level of activity (response) for further testing. Dose escalation occurs when a predefined number of responses are not observed. Dose de-escalation will occur if the predefined level of activity has been exceeded.

Pharmacokinetically Guided Dose-Escalation Method (PGDE)

The pharmacokinetically guided dose-escalation (PGDE) method of clinical trial design was proposed by Collins and associates as a more informative and efficient alternative to the traditional design. 19,35 The authors retrospectively analyzed the results of several Phase I studies of chemotherapeutic agents and demonstrated that observed toxicity was not a function of the dose administered to the patient, but rather was a function of the area under the curve (AUC) of plasma drug concentration measured over time of exposure. The PGDE Phase I clinical trial design targets the AUC associated with the mouse LD10. Patients are treated at one-tenth of the mouse LD10, as in the traditional method, but escalation to the next dose and subsequent doses is based on the distance of the observed AUC in humans to the target mouse LD10 AUC. The retrospective analysis performed by Collins and colleagues indicated that the sample size of Phase I clinical trials could be reduced by as much as 50% by using the PGDE over the traditional design. 19 Although several studies have reported success with the PGDE design, it is still not widely used in the drug development community. 36 One reason for the lack of use is the presence of large interpatient variability in AUC for the same administered dose. 25 For some drugs (e.g., antimetabolites and vinca alkaloids), toxicity is a function of exposure time above a threshold rather than AUC, and the use of a PGDE design is not justified. 37 Finally, the requirement of real-time pharmacokinetic monitoring inherent in the PGDE design has been considered a limitation to its use. 36,38 Pharmacokinetic correlative studies, however, have become standard measurements in almost all oncology Phase I trials as they help to better understand Phase I trial outcomes.

Continual Reassessment Method (CRM)

O’Quigley and co-workers proposed the Continual Reassessment Method (CRM) as an alternative Phase I study design. This Phase I design uses formal statistical methods of dose-toxicity modeling to guide dose escalation. 39 The CRM is considered superior by many because it allows the use of toxicity information gained at earlier time points of the study to assign subsequent doses. The CRM design is considered less likely to treat patients at toxic doses and more likely to treat patients at doses considered efficacious. 40 The CRM, as originally designed, works by fitting a dose-toxicity curve to the available toxicity data and assigns subsequent patients to the dose most likely to be associated with a predefined target toxicity level. Therefore, the MTD is defined as the dose estimated to produce a desired predefined toxicity rate. The estimated dose-toxicity curve is refitted after the outcome of each individual patient is determined, and the next patient is assigned the dose estimated to be nearest the MTD based on the new data. 40 Because of its complexity, involvement of a capable statistician is necessary in the design and execution of a CRM-designed clinical trial.

Statistical Considerations of Phase I Studies

There are many designs available to estimate the MTD, as discussed earlier. Two of the main design types used in practice are either algorithmic in nature (e.g., the previously described 3+3 design) or model-based designs (i.e., designs based on a statistical model). The purpose of the 3+3 design is not to produce accurate estimates of the probability of toxicity at a given dose but to quickly identify a dose level that does not exhibit too much toxicity. An alternative to algorithmic approaches such as the 3+3 design, and one more amenable to the goal of precisely estimating (i.e., estimating with more certainty) the MTD, is model-based methods. The conceptual framework for most model-based Phase I designs is Bayesian. Bayesian designs treat the probability that a patient will experience toxicity at a given dose as a quantity about which the investigator has some degree of uncertainty. Moreover, this uncertainty is quantified via probability. The Bayesian framework provides a means by which one can learn about the toxicity rates at the different doses and naturally make decisions based on the data observed in a sequential manner.
Using these model-based designs requires that the investigator explicitly specify a target probability of toxicity. The target probability of toxicity represents the rate of toxicity acceptable to the investigator (the 3+3 design has an implicit target rate of toxicity of approximately 17%). For compounds associated with very severe life-threatening toxicities, the target probability may be set by the investigator at 0.10 (i.e., 10%), whereas for other compounds with more mild toxicities it may be acceptable to set the target probability of toxicity at 0.35. As with algorithmic designs, patients are sequentially enrolled into the trial in cohorts of patients. After each cohort of patients has been evaluated for toxicity, the decision to escalate, stay, or de-escalate from the current dose is based on the dose that has the expected probability of toxicity closest to the target toxicity.
An important advantage of model-based Phase I designs is that they allow one to combine information from patients treated at different dose levels, that is, to “borrow strength,” in order to more reliably predict what may occur at a particular dose given to a future patient. A second advantage is the ability to adjust the target probability of toxicity to match the characteristics of the compound under investigation. A third advantage of model-based methods is that, unlike the 3+3 design, the cohort size is not limited to 3 patients and, more importantly, a variable cohort size may be used. Although one could argue that algorithmic designs can also use alternative cohort sizes, the complication associated with changing the cohort size when using “X+X” algorithmic approaches (e.g., 2+2, 4+4, 5+5) is that the implicit targeted rate toxicity changes with the size of the cohort. We should note that there are other algorithmic designs which do not tie the implicit target toxicity rate to the cohort size but these methods are very rarely used and tend to place too many patients on doses that are too toxic (reviewed in Ivanova and colleagues 41 ).
Although model-based designs have been available since the early 1990s, these methods have not gained as wide an audience as biostatisticians would like. This is because it can be difficult to explain these methods to nonstatisticians, and the methods are difficult to implement. 42 These difficulties are being addressed by making computer code available to investigators and by providing innovative designs that target endpoints other than the typical endpoint in a classical implementation of a Phase I oncology design.

Pharmacodynamic Markers in Phase I Studies: Tissue Analysis

Overview of Pharmacodynamic Markers in Tissues

In recent years, there has been significant progress in the development of drug-targeted therapies, particularly those that target receptor tyrosine kinases (RTKs). 43,44 The emergence of molecularly targeted agents against numerous targets offers potentially greater anticancer efficacy with fewer side effects. Despite these recent advances, assessing the effects of these agents individually or in combination, or combined with conventional therapies, has created significant challenges for basic scientists and clinical investigators to effectively integrate molecular targeted therapies into clinical practice. 45 Because the number of possible drug-target combinations is enormous, better strategies are needed to understand the pharmacodynamic effects of investigational agents in tumors. 46 One of the most informative approaches is to implement correlative tissue-based analyses in clinical studies. 47 This section discusses the development of reliable assays for quantifying pharmacodynamic effects in tissues, the effects of different agents on various markers and their correlation with clinical outcome, and issues that pose challenges for incorporating tumor tissue analysis into clinical trials.

Quantitative Analysis of Pharmacodynamic Markers in Tissues

Investigators typically rely on immunohistochemistry (IHC) assays to measure the pharmacodynamic effects of molecular targeted therapies in tissues. The majority of these studies use chromogenic or immunoperoxidase staining, which are semiquantitative and have other limitations. 48 In contrast, immunofluorescence (IF) detection methods can provide simultaneous labeling of multiple proteins in one sample and a quantitative assessment using a continuous scale. 49 Recent research efforts have focused on the development of IF-based assays to quantify protein expression patterns and apoptosis in tissues for Phase I studies (Figure 48-2 ). 50,51 Initially, this work focused on developing a method to detect apoptosis in endothelial cells, which requires three fluorochromes to visualize the total cell nuclei, endothelial cells, and terminal deoxynucleotidyl transferase-dUTP nick end labeling (TUNEL)-positive cells. 52 Hence, multiple labeling techniques can facilitate visualization of specific cell types by eye as a result of colocalization of different fluorochromes (see Figure 48-2). However, manual quantification is limited to enumerating “positive” and “negative” cells in random microscopic fields using a categorical score and may not be able to detect subtle but significant changes. 53
Various platform technologies have been developed to facilitate quantitative in situ assessment of protein expression. 54 Most of these systems are designed for standard IHC assays using chromogenic substrates. Measuring the pharmacodynamic effects of molecular targeted therapies requires the ability to detect specific cell types, such as endothelial cells, and quantify their protein expression patterns. One platform technology capable of quantifying multiple fluorochromes in fixed tissue specimens is the laser scanning cytometer (LSC). The LSC platform is an automated analysis system described as a cross between a flow and a static image cytometer. Lasers are used to simultaneously excite different fluorochromes in cellular specimens that emit discrete wavelengths detected by a set of photomultiplier tubes. Together these features permit the ability to generate high-content stoichiometric data on heterogeneous populations of large numbers of cells. Thus, the LSC is used much like a flow cytometer to obtain multicolor immunofluorescence intensity information on fixed specimens.
image
Figure 48-2 Pharmacodynamic analysis of molecular targeted therapies in tumor tissues. Correlative tissue studies may help determine the pharmacodynamic effects of targeted therapies on receptor tyrosine kinase phosphorylation, growth factors, signal transduction, and apoptosis in Phase I studies. Immunofluorescence detection permits the analysis of biomarkers in specific cell types, such as phosphorylation of PDGFR-β in endothelial cells. Measuring endpoints that include target or pathway inhibition linked to apoptosis may provide better evidence of the biological effects of the drug in the tumor and correlation with clinical outcome. (Red, endothelium; green, protein expression or terminal deoxynucleotidyl transferase-dUTP nick end labeling (TUNEL); yellow, colocalization of endothelium and protein or TUNEL.)
Several Phase I studies have incorporated LSC-mediated analysis to determine drug-target interactions, effects on downstream signaling pathways, and rates of apoptosis in skin and tumor tissues. 4951,55 Because the LSC is a platform technology, many different applications can be developed to exploit its inherent capabilities. Research efforts have been focused on developing specific tissue-based applications using LSC technology in an attempt to standardize the methodology for consistent data generation that can be compared between different tissue specimens and molecular targeted therapies. Although LSC-mediated data acquisition is automated, the process requires a systematic interactive approach to maintain high quality-control standards and ensure consistent data generation (Figure 48-3 ). Pharmacodynamic data generated using a process to analyze markers in entire tumor tissue cross sections has consistently provided biological evidence of the effects of targeted therapies and correlation with clinical outcome. 49,56,57

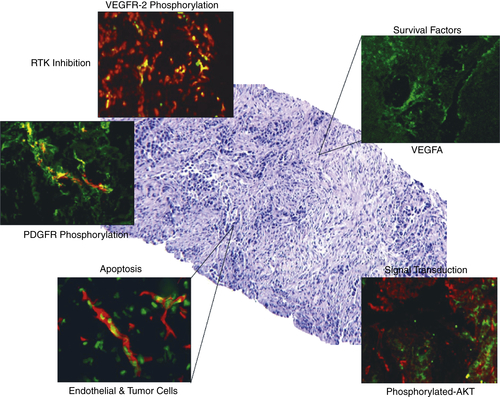
Pharmacodynamic Analysis of Receptor Tyrosine Kinase Targeted Therapies
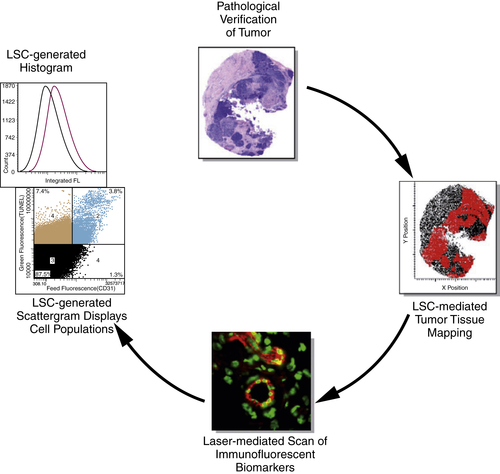
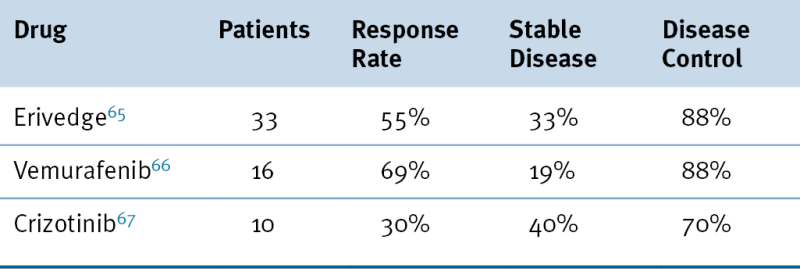
Aberrant expression of cell-surface RTKs, such as epidermal growth factor receptor (EGFR), plays a pivotal role in the progression of cancer. 58 Drugs that target RTKs are designed to block the intrinsic enzymatic activity that catalyzes the transfer of the gamma-phosphate of ATP to tyrosine residues in protein substrates. 59 Inhibiting phosphorylation of these tyrosine residues prevents downstream signaling events, which affect cellular function (e.g., proliferation, differentiation, migration, or apoptosis). 60 Thus, the ability to measure phosphorylation status and signal-transduction pathways has become an important pharmacodynamic endpoint in clinical studies.
image
Figure 48-3 Quantitative analysis of pharmacodynamic effects in tissues using LSC technology. Pathological verification of biopsy samples is essential for mapping tumor regions and excluding normal and necrotic regions from the analysis. Lasers detect individual cells within the mapped region of interest based on immunofluorescence staining. LSC-generated scattergrams display the percentage of cell populations based on user-defined gating using controls, e.g., apoptotic endothelial cells. Alternatively, protein expression levels, such as phosphorylated VEGF receptor-2, measured by mean fluorescent intensity may be determined as shown in the histogram. (Immunofluorescent image appears with permission of Eaton Publishing, Westborough, MA 01581, USA; Cover, BioTechniques, Vol. 28, No. 6 (June 2000)).

Table 48-2

Recent Successful Phase I Trials

image

Gefitinib

Gefitinib (Iressa, ZD1839) was the first in a new class of small, molecular targeted therapies against EGFR to gain market approval (based on two Phase II studies) for non–small-cell lung cancer. 61,62 Although the Phase II studies did not incorporate correlative tissue studies, it was demonstrated in two different Phase I studies of gefitinib that pharmacodynamic endpoints can be measured in both tumor and skin tissues. In a metastatic colorectal cancer trial, total EGFR levels; phosphorylation of EGFR, AKT, and ERK; p27 levels; beta-catenin expression; and apoptosis were assayed before and after treatment in tumor biopsies, with interesting results in only a small number of patients. In another Phase I study of gefitinib in metastatic breast cancer, comparison of pre- and posttreatment ERBB2 and EGFR values was not statistically significant between the subgroups of patients regarding responsiveness to treatment. 63
Serial skin biopsies have been analyzed as potential surrogate tissues for monitoring the biologic effects of molecular targeted therapies. A Phase I study of gefitinib in advanced solid malignancies incorporated skin, but not tumor, biopsies to determine the effects on EGFR signaling. 64 Levels of phosphorylated-EGFR expression were completely inhibited; however, no changes in total EGFR expression were observed after treatment. Other downstream markers in the EGFR network were affected by ZD1839, including phosphorylated-Ras-mitogen-activated protein kinase (MAPK) and STAT3, Ki67, p27(kip1), and apoptosis (Table 48-2 ). 6567 Although significant changes were observed in almost all of the markers when comparing pre- and posttreatment skin biopsies in small numbers of patients, none of the changes correlated with dose or clinical response.

Pharmacodynamic Analysis of Signal Transduction Inhibitors and Other Targets

Vemurafenib

Vemurafenib (PLX4032, Zalboraf) is an ATP-dependent serine/threonine kinase inhibitor approved for use in patients with stage IV melanoma with BRAF(V600E) mutations. Forty percent to 60% of melanomas, and 7% to 8% of all cancers, carry an activating mutation in B-RAF. Ninety percent of reported BRAF mutations result in a substitution of glutamic acid for valine at amino acid 600—the V600 mutation. This BRAF mutation constitutively activates BRAF and downstream signal transduction in the MAP kinase pathway. Preclinical studies showed that vemurafenib inhibits the kinase activity of BRAF with the V600 mutation at low nanomolar concentrations, abrogates signaling through the MAP kinase pathway, and blocks proliferation of cells carrying BRAF with the V600 mutation in vitro at high nanomolar concentrations.
In the Phase I clinical trial, the extent of pathway inhibition and tumor responses correlated with higher plasma drug exposures. Patients with vemurafenib plasma exposures (AUC0→24) less than 300 mM hr experienced no measurable tumor responses, whereas 24 of 32 patients treated at the MTD/RP2D of 960 mg BID had PRs or CRs, where the AUC0→24 was 1741 μM hr. Paired biopsies were taken from selected patients, at baseline and after 14 days of exposure. Decreases in cytoplasmic, though not nuclear, pERK correlated well with tumor response. Greater than 80% inhibition of cytoplasmic ERK phosphorylation was observed in responding patients, which suggests that near-total inhibition of BRAF signaling is required for clinical benefit. 68
Aflibercept (VEGF-trap, Eylea) is a recombinant protein consisting of segments of the extracellular domains of human vascular endothelial growth factor receptors 1 (VEGFR1) and 2 (VEGFR2) fused to the constant region (Fc) of human IgG1. Aflibercept functions as a soluble decoy receptor, binding to blood vascular endothelial growth factors (VEGFs) and preventing VEGFs binding to the VEGFR-1, -2 receptors. Aflibercept is approved for use in age-related macular degeneration and in combination with chemotherapy for colorectal cancer. In Phase I clinical trials in cancer patients, the saturation of aflibercept by circulating VEGF was used to determine the appropriate dose for Phase II/III trials. Preclinical studies demonstrated a requirement for free aflibercept to exceed the VEGF-aflibercept complexes for antitumor activity. At doses of 2 mg/kg 69 and 800 mg, 70 there was no further increase in complex formation, and free drug levels remained in excess of bound aflibercept levels. These concentrations correlated with DCE-MRI effects on tumor perfusion (see later discussion), immunologic evidence of VEGF binding, and clinical outcome, thus allowing selection of a biologically active dose on a rational basis.

Recent Therapeutic Successes with Phase I Trials

Although the traditional role for Phase I studies has been the evaluation of toxicity of the MTD and RP2D, with efficacy evaluated in expansion cohorts and Phase II trials, recent studies with enriched populations for specific targets have shown significant responses, followed by successful randomized Phase III trials and FDA approval, although the approval occasionally occurred even before or in the absence of the Phase III trial (see Table 48-2). Erivedge (GDC0449) received FDA approval after remarkable results from the Phase I trial, where responses were seen in 18 (55%) of 33 patients with locally advanced or metastatic basal cell carcinomas, with an additional 11 (33%) patients achieving stable disease; progression was seen in only 4 patients. 65 In the Phase I trial of vemurafenib (PLX4032), in patients with melanoma harboring the BRAF V600E mutation, complete or partial responses were observed in 11 (69%) of the 16 patients treated in the dose-escalation phase and 26 (81%) of the 32 patients treated at the extension phase with the recommended Phase II doses. 66 Vemurafenib was subsequently approved after the results of a randomized Phase III trial showing improved overall survival compared to dacarbazine in patients with BRAF V600E mutated in previously untreated patients with metastatic melanoma. 71 In the Phase I trial of crizotinib (PF-20341066), there were 3 responders and 4 patients with stable disease, including 3 patients with tumor reduction of 20% and one with stable disease for 28 weeks, among the 10 patients with ALK rearranged non–small-cell lung cancer. 67 The promising results were confirmed in the Phase II study, where 47 (57%) of 82 patients with ALK rearrangement achieved partial response, and 27 (33%) had stable disease, mostly by tumor shrinkage that did not meet criteria for partial response. 72 These highly successful drugs may change the paradigm in Phase I studies, bypassing Phase II studies to move directly into randomized Phase III studies in an attempt to allow rapid access to drugs with the potential to significantly improve survival in selected patient populations.

Challenges and Perspectives

There are many challenges involved in successfully incorporating tissue analysis in the design of a clinical study. Acquiring the tissue alone requires the commitment of the sponsor, scientists, oncologists, interventional radiologists, committees, and patients. Standardization of tumor sampling, tissue procurement, and storage procedures is critical to ensure that quality tumor tissue is being evaluated. A lack of quantitative standardization among different assays may lead to unintentional interpretation and variability among laboratories. Other issues that may affect interpretation of pharmacodynamic data are intra- and intertumor heterogeneity, tissue microenvironment (skin versus tumor), compensatory mechanisms, and timing of biopsies after initiation of therapy and after the last dose. It is worth emphasizing that few studies have attempted to link target or pathway inhibition with tumor-cell apoptosis. It is possible that some agents may demonstrate transient target inhibition, but fail to induce apoptosis. 49 Thus, measuring pharmacodynamic endpoints that include target or pathway inhibition linked to cellular fate, such as apoptosis, may provide better evidence of the biological effects of the drug in the tumor.
Pharmacodynamic analysis of tumor tissues can provide direct proof of whether an investigational agent affected its intended target and downstream consequences on signal transduction and apoptosis; however, such studies are limited. Recent studies have demonstrated that skin may serve as a surrogate tissue to confirm drug-target inhibition, signal transduction, and kinetics in clinical studies. However, analysis of biomarkers in tumor tissues may better represent the biological effects of a targeted therapy, as tumor cells often respond differently compared to normal cells. More quantitative studies are needed to identify reliable biomarkers and the correlation between the effects in skin, tumor, and clinical outcome. Another promising surrogate source that could potentially be used to assess the effects of targeted agents is the circulating tumor cell or endothelial cell. These cells may better represent the tumor microenvironment and are now being routinely isolated for a variety of applications. 73 Ongoing research efforts are aimed at developing assays to analyze the pharmacodynamic effects of drugs on circulating tumor and endothelial cells. Furthermore, pharmacodynamic studies in tumor tissue may also identify the genomic and proteomic profile of the population with the greatest chance to benefit from treatment. For example, the therapeutic activity of trastuzumab (Herceptin) would likely have been missed if patients had not been preselected based on their HER2 status.
Clearly, there is a need for better strategies to assess the effects of molecular targeted therapies early in clinical development. For example, in a Phase I trial of bevacizumab, no objective responses were observed out of 25 patients. 74 Not until a series of randomized Phase II and III trials over a period of more than 5 years was the clinical activity of bevacizumab established. However, it is generally not practical to perform large randomized trials for drugs without evidence of biological activity early in their development, and therefore, many promising drugs may not be developed. Given the large number of targeted therapies entering clinical testing, it is crucial that Phase I studies incorporate correlative endpoints to determine biological activity and optimal dosing and scheduling for Phase II and III trials. Ultimately, clinical development of targeted therapies would benefit if the recommended dose was identified early and actually known to inhibit the target for which it was designed.

Imaging Techniques in Phase I Studies

A variety of imaging techniques can play an important role in Phase I studies of anticancer drugs when used as an objectively measured indicator of a biological/pathobiological process or pharmacologic response to treatment (i.e., as a biomarker 75 ). Imaging biomarkers can be used to determine if the drug is hitting the target and if it has the anticipated biological activity, and they can also provide an early indication of whether or not the new agent has clinical activity. 76 The information provided by imaging biomarkers, taken together with information from molecular biomarkers and clinical pharmacology, provides the input required to determine how aggressively to pursue the development of a particular drug or a backup drug for a given target. In addition, imaging biomarkers can assist in the selection of the dose and/or schedule for Phase II studies. 77
The ability to detect a labeled drug at one thousandfold lower concentrations than needed to produce pharmacodynamic effects makes nuclear medicine the modality best suited for determining if the drug is hitting the target. 78 A number of imaging modalities can be used to determine if the drug has the anticipated biological or antitumor activity. The more commonly used methods are dynamic contrast-enhanced magnetic resonance imaging (DCE-MRI) and [18F]fluoro-2-deoxyglucose (FDG) positron emission tomography (PET). DCE-MRI, which employs a commonly used contrast agent (gadopentetate dimeglumine), has been implemented in several Phase I studies to quantify the effects of antivascular agents on the tumor blood supply within hours to days after the start of treatment. 79 Further research will be needed to determine if it is a suitable marker for predicting clinical activity.
FDG-PET uses an 18F-labeled glucose analog (FDG) that is transported into cells by GLUT-1 and GLUT-3 and phosphorylated by hexokinase. Because FDG-6-P is a poor substrate for glucose-6-phosphatase, there is little dephosphorylation, and the radioactivity is trapped in the cell. 8082 Glucose metabolism is quantified as the activity in the tumor, normally restricted to the region of highest activity, relative to the amount of activity injected and patient’s body weight, the so-called Standardized Uptake Value (SUV). The potential for FDG-PET to assess drug-induced biological effects before a change in tumor size was illustrated clearly in patients with advanced gastrointestinal stromal tumors treated with imatinib mesylate. 83 Tumor FDG activity decreased markedly from baseline as early as 24 hours after a single dose of imatinib in all patients demonstrating a response by computed tomography (CT) or MRI weeks later. Conversely, increased tumor FDG activity, activity at new sites, or both were seen in all patients with disease progression evident at a later date by conventional means. In patients with progressive disease after treatment with imatinib, FDG-PET metabolic response, defined as SUV decrease or increase by 25% from baseline at 4 weeks, provided an early prediction of response to sunitinib. 84 Although a variety of treatment regimens result in reduced FDG activity following the first cycle of therapy, after macrophage activity (which can result in increased FDG uptake) has subsided, yet before response is evaluable by standard methods, 80 such dramatic effects are not generally observed so early after treatment. Nonetheless, FDG-PET shows considerable promise to provide an indication of decreased tumor viability earlier than conventional methods and may provide a valuable downstream biomarker for biologic activity in Phase I trials.
Although it is not reasonable to expect clinical efficacy in the advanced-stage patients entered into Phase I trials and assessment of clinical response is not a primary focus of Phase I trials, any indication that the drug/target affects tumor growth is beneficial. Typically, tumor burden is assessed using either CT or MRI data. The method most commonly used to assess clinical effect is based on Response Evaluation Criteria in Solid Tumors (RECIST), which was put forth in 2000 as a simpler way to measure the response of tumors to experimental treatments. 85 The recently updated criteria (RECIST 1.1) include important changes such as the inclusion of cystic bone lesions with identifiable soft tissue components and progressing previously irradiated lesions as measurable disease, definition of measurable lymph nodes as those with shortest axis at least 1.5 cm, and progressive disease by PET scan defined as the presence of positive PET in a previously negative area. 86 It should be noted that, in practice, RECIST are generally modified to address some of the concerns raised by the International Cancer Imaging Society (ICIS) regarding the strengths and weaknesses of using the RECIST criteria and what other issues should potentially be added to a response criterion. 87 Nonetheless, even with these changes, concerns remain regarding RECIST, especially in the context of early-phase trials. 88 One point of particular concern is whether the single longest tumor dimension, determined in an axial plane, accurately represents changes in tumor burden, because most tumors grow and regress irregularly. 89 Another concern is how relevant the categorical response assessments (complete response, partial response, stable disease, and progressive disease), which were originally based on the error in oncologists’ physical measurements of solid spheres arranged in random size order on a soft mattress and covered with a layer of foam rubber, are in the context of early-phase trials. 90,91 It seems an alternative model, where response is considered a continuous variable, the change in tumor size (estimated as the single longest dimension, the cross product of the longest dimension and the perpendicular longest dimension, or volume) after treatment, 92 would be much more useful for evaluating clinical effect in Phase I trials. Some of the limitations from the RECIST criteria, including the evaluation of targeted therapies that frequently cause disease stabilization instead of objective response, may be addressed with the proposed PET response criteria in solid tumors (PERCIST), which classifies the metabolic response into complete (CMR), partial (PMR), stable (SMD), or progressive (PMR) based on complete resolution of FDG uptake in the measurable target lesions, reduction of at least 30% of the FDG uptake, changes from 29% decrease to 30% increase in FDG uptake, or increase of at least 30% in the FDG uptake, respectively. 93
image
Figure 48-4 An algorithm comprising relevant proteomic, clinical and imaging factors plus genomic factors all indicating a poor prognosis (metastasis) and best choice of molecular-targeted chemotherapy.

Conclusion

Cancer is and will be a major cause of death and morbidity in the United States and worldwide. Despite significant improvements in diagnosis, surgical techniques, general patient care, and local and systemic therapies, most deaths from cancer are still due to metastases that are resistant to conventional treatment. Novel therapeutic approaches are critically needed if we are to improve patient outcome. Phase I studies are the critical link in targeting cancer, because they represent the first translation of years of laboratory/preclinical studies to the patient.
As drug development has evolved to a more tumor-targeted or tumor-specific focus, so has the evolution of Phase I trials moved from the more generic, mathematical modeling to a more rational design. In addition, it is increasingly being recognized that incorporation of select endpoints relative to patient eligibility in Phase I trials is needed to more effectively and efficiently develop drugs clinically. Although the classification of most cancers is still based in large part on tissue type, tumor size, nodal status, and metastatic sites, there has been a rapid progress in the molecular characterization of solid tumors. Several Phase I designs are incorporating these tools, not so much as response predictors, but to help determine feasibility and to develop diagnostic/predictive tools for future clinical use. The hope is that a more personalized approach to clinical care will increase the efficacy of treatment, while decreasing its toxicity and cost. The end result is the development of Phase I trials aimed not only at defining dose and safety, but also at assisting in target validation while increasing the probability of benefit through the use of enriched populations (Figure 48-4 ). Recent studies have shown that effective drugs can be more expeditiously approved if used in a molecularly defined patient population, with a rapid transition from Phase I studies to proof-of-concept Phase II and randomized Phase III trials, with more rapid introduction into clinical practice.
References

1. Horstmann E. , McCabe M.S. , Grochow L. et al. Risks and benefits of phase 1 oncology trials, 1991 through 2002 . N Engl J Med . 2005 ; 352 : 895 904 .

2. Trump D.L. Hospice benefits and phase I cancer trials . Ann Intern Med . 2004 ; 140 : 70 71 author reply 71 .

3. Travis K. For phase I studies, ethical and practical concerns abound . J Natl Cancer Inst . 2004 ; 96 : 1354 1355 .

4. Agrawal M. , Emanuel E.J. Ethics of phase 1 oncology studies: reexamining the arguments and data . JAMA . 2003 ; 290 : 1075 1082 .

5. Roberts D. , Lockley W. Radiosynthesis—a vital role supporting drug development? Drug Discov World . 2004 ; 5 : 59 62 .

6. Rudin M. , Weissleder R. Molecular imaging in drug discovery and development . Nat Rev . 2003 ; 2 : 123 131 .

7. Kelloff G.J. , Krohn K.A. , Larson S.M. et al. The progress and promise of molecular imaging probes in oncologic drug development . Clin Cancer Res . 2005 ; 11 : 7967 7985 .

8. Rahman A. , White R.M. Cytotoxic anticancer agents and renal impairment study: the challenge remains . J Clin Oncol . 2006 ; 24 : 533 536 .

9. Takimoto C.H. , Mita A.C. Design, conduct, and interpretation of organ impairment studies in oncology patients . J Clin Oncol . 2006 ; 24 : 3509 3510 author reply 3510-3501 .

10. Ramanathan R.K. , Remick S.C. , Mulkerin D. et al. P-5331: a phase I pharmacokinetic (PK) study of STI571 in patients (pts) with advanced malignancies and varying degrees of liver dysfunction (LD) . Proc Am Soc Clin Oncol . 2003 ; 502 : 22 abstr .

11. Remick S.C. , Ramanathan R.K. , Mulkerin D. et al. P-5340: a phase I pharmacokinetic study of STI-571 in patients (pts) with advanced malignancies and varying degrees of renal dysfunction . Proc Am Soc Clin Oncol . 2003 : 22 abstr 503 .

12. Doroshow J.H. , Synold T.W. , Gandara D. et al. Pharmacology of oxaliplatin in solid tumor patients with hepatic dysfunction: a preliminary report of the National Cancer Institute Organ Dysfunction Working Group . Semin Oncol . 2003 ; 30 ( 4 suppl 15 ) : 14 19 .

13. Takimoto C.H. , Remick S.C. , Sharma S. et al. Dose-escalating and pharmacological study of oxaliplatin in adult cancer patients with impaired renal function: a National Cancer Institute Organ Dysfunction Working Group Study . J Clin Oncol . 2003 ; 21 : 2664 2672 .

14. Takimoto C.H. , Remick S.C. , Sharma S. et al. Administration of oxaliplatin to patients with renal dysfunction: a preliminary report of the national cancer institute organ dysfunction working group . Semin Oncol . 2003 ; 30 ( 4 suppl 15 ) : 20 25 .

15. LoRusso P.M. , Venkatakrishnan K. , Ramanathan R.K. et al. Pharmacokinetics and safety of bortezomib in patients with advanced malignancies and varying degrees of liver dysfunction: phase I NCI Organ Dysfunction Working Group Study NCI-6432 . Clin Cancer Res . 2012 ; 18 : 2954 2963 .

16. Cavero I. , Crumb W. The use of electrocardiograms in clinical trials: a public discussion of the proposed ICH E14 regulatory guidance April 11-12, 2005, Bethesda, MD, USA . Expert Opin Drug Saf . 2005 ; 4 : 795 799 .

17. LoRusso P.M. , Heath E. , Valdivieso M. et al. Phase I evaluation of AZD2171, a highly potent and selective inhibitor of VEGFR signaling, in combination with selected chemotherapy regimens in patients with advanced solid tumors . J Clin Oncol 2006 ASCO Annu Meeting Proc Part I . 2006 ; 24 : 3034 (June 20 Supplement) .

18. Simon R. , Freidlin B. , Rubinstein L. , Arbuck S.G. , Collins J. , Christian M.C. Accelerated titration designs for phase I clinical trials in oncology . J Natl Cancer Inst . 1997 ; 89 : 1138 1147 .

19. Collins J.M. , Zaharko D.S. , Dedrick R.L. , Chabner B.A. Potential roles for preclinical pharmacology in phase I clinical trials . Cancer Treatment Rep . 1986 ; 70 : 73 80 .

20. Omura G.A. Modified Fibonacci search . J Clin Oncol . 2003 ; 21 : 3177 .

21. Schneiderman M.A. Mouse to man: statistical problems in bringing a drug to clinical trial . Proceedings of the Fifth Berkeley Symposium on Mathematical Statistics and Probability . ; vol IV Berkeley : University of California Press ; 1967 : 855–866 .

22. Zhao L. , Lee J. , Mody R. , Braun T.M. The superiority of the time-to-event continual reassessment method to the rolling six design in pediatric oncology Phase I trials . Clin Trials . 2011 ; 8 : 361 369 .

23. Skolnik J.M. , Barrett J.S. , Jayaraman B. , Patel D. , Adamson P.C. Shortening the timeline of pediatric phase I trials: the rolling six design . J Clin Oncol . 2008 ; 26 : 190 195 .

24. Storer B.E. Design and analysis of phase I clinical trials . Biometrics . 1989 ; 45 : 925 937 .

25. Rubinstein L. , Simon R. Phase 1 clinical trial design . In: Budman D.R. , Calvert A.H. , Rowinsky E.K. , eds. Handbook of Anticancer Drug Development . Baltimore, MD : Lippincott Williams & Wilkins ; 2003 : 297 308 .

26. Alousi A.M. , Parchment R. , Boinpally R. et al. Phase I clinical trial of XK469 in patients with chemo-refractory solid tumors . J Clin Oncol (Meeting Abstracts) . 2004 ; 22 ( 14 suppl ) : 2020 .

27. Gadgeel S.M. , Boinpally R.R. , Heilbrun L.K. et al. A phase I clinical trial of spicamycin derivative KRN5500 (NSC 650426) using a phase I accelerated titration “2B” design . Invest New Drugs . 2003 ; 21 : 63 74 .

28. Gadgeel S.M. , Wozniak A. , Boinpally R.R. et al. Phase I clinical trial of BMS-247550, a derivative of epothilone B, using accelerated titration 2B design . Clin Cancer Res . 2005 ; 11 : 6233 6239 .

29. LoRusso P.M. , Foster B.J. , Wozniak A. et al. Phase I pharmacokinetic study of the novel antitumor agent SR233377 . Clin Cancer Res . 2000 ; 6 : 3088 3094 .

30. LoRusso P.M. , Prakash S. , Wozniak A. et al. Phase I clinical trial of 5-fluoro-pyrimidinone (5FP), an oral prodrug of 5-fluorouracil (5FU) . Invest New Drugs . 2002 ; 20 : 63 71 .

31. Eisenhauer E.A. Phase I and II trials of novel anti-cancer agents: endpoints, efficacy and existentialism. The Michel Clavel Lecture, held at the 10th NCI-EORTC Conference on New Drugs in Cancer Therapy, Amsterdam, 16-19 June 1998 . Ann Oncol . 1998 ; 9 : 1047 1052 .

32. Hunsberger S. , Rubinstein L.V. , Dancey J. , Korn E.L. Dose escalation trial designs based on a molecularly targeted endpoint . Stat Med . 2005 ; 24 : 2171 2181 .

33. Korn E.L. Nontoxicity endpoints in phase I trial designs for targeted, non-cytotoxic agents . J Natl Cancer Inst . 2004 ; 96 : 977 978 .

34. Zhang W. , Sargent D.J. , Mandrekar S. An adaptive dose-finding design incorporating both toxicity and efficacy . Stat Med . 2006 ; 25 : 2365 2383 .

35. Collins J.M. , Grieshaber C.K. , Chabner B.A. Pharmacologically guided phase I clinical trials based upon preclinical drug development . J Natl Cancer Inst . 1990 ; 82 : 1321 1326 .

36. Collins J.M. Innovations in phase 1 trial design: where do we go next? Clin Cancer Res . 2000 ; 6 : 3801 3802 .

37. Fuse E. , Kobayashi T. , Inaba M. , Sugiyama Y. Prediction of the maximal tolerated dose (MTD) and therapeutic effect of anticancer drugs in humans: integration of pharmacokinetics with pharmacodynamics and toxicodynamics . Cancer Treatment Rev . 1995 ; 21 : 133 157 .

38. Dees E.C. , Whitfield L.R. , Grove W.R. , Rummel S. , Grochow L.B. , Donehower R.C. A phase I and pharmacologic evaluation of the DNA intercalator CI-958 in patients with advanced solid tumors . Clin Cancer Res . 2000 ; 6 : 3885 3894 .

39. O’Quigley J. , Pepe M. , Fisher L. Continual reassessment method: a practical design for phase 1 clinical trials in cancer . Biometrics . 1990 ; 46 : 33 48 .

40. Garrett-Mayer E. The continual reassessment method for dose-finding studies: a tutorial . Clin Trials (Lond) . 2006 ; 3 : 57 71 .

41. Ivanova A. , Montazer-Haghighi A. , Mohanty S.G. , Durham S.D. Improved up-and-down designs for phase I trials . Stat Med . 2003 ; 22 : 69 82 .

42. Rosenberger W.F. , Haines L.M. Competing designs for phase I clinical trials: a review . Stat Med . 2002 ; 21 : 2757 2770 .

43. Piccart-Gebhart M.J. , Procter M. , Leyland-Jones B. et al. Trastuzumab after adjuvant chemotherapy in HER2-positive breast cancer . N Engl J Med . 2005 ; 353 : 1659 1672 .

44. Kabbinavar F. , Hurwitz H.I. , Fehrenbacher L. et al. Phase II, randomized trial comparing bevacizumab plus fluorouracil (FU)/leucovorin (LV) with FU/LV alone in patients with metastatic colorectal cancer . J Clin Oncol . 2003 ; 21 : 60 65 .

45. Dancey J.E. , Chen H.X. Strategies for optimizing combinations of molecularly targeted anticancer agents . Nat Rev . 2006 ; 5 : 649 659 .

46. Davis D.W. , McConkey D.J. , Abbruzzese J.L. , Herbst R.S. Surrogate markers in antiangiogenesis clinical trials . Br J Cancer . 2003 ; 89 : 8 14 .

47. Dowlati A. , Haaga J. , Remick S.C. et al. Sequential tumor biopsies in early phase clinical trials of anticancer agents for pharmacodynamic evaluation . Clin Cancer Res . 2001 ; 7 : 2971 2976 .

48. Rimm D.L. What brown cannot do for you . Nat Biotechnol . 2006 ; 24 : 914 916 .

49. Davis D.W. , Takamori R. , Raut C.P. et al. Pharmacodynamic analysis of target inhibition and endothelial cell death in tumors treated with the vascular endothelial growth factor receptor antagonists SU5416 or SU6668 . Clin Cancer Res . 2005 ; 11 ( 2 Pt 1 ) : 678 689 .

50. Davis D.W. , Shen Y. , Mullani N.A. et al. Quantitative analysis of biomarkers defines an optimal biological dose for recombinant human endostatin in primary human tumors . Clin Cancer Res . 2004 ; 10 ( 1 Pt 1 ) : 33 42 .

51. Herbst R.S. , Mullani N.A. , Davis D.W. et al. Development of biologic markers of response and assessment of antiangiogenic activity in a clinical trial of human recombinant endostatin . J Clin Oncol . 2002 ; 20 : 3804 3814 .

52. Shaheen R.M. , Davis D.W. , Liu W. et al. Antiangiogenic therapy targeting the tyrosine kinase receptor for vascular endothelial growth factor receptor inhibits the growth of colon cancer liver metastasis and induces tumor and endothelial cell apoptosis . Cancer Res . 1999 ; 59 : 5412 5416 .

53. Berger A.J. , Davis D.W. , Tellez C. et al. Automated quantitative analysis of activator protein-2alpha subcellular expression in melanoma tissue microarrays correlates with survival prediction . Cancer Res . 2005 ; 65 : 11185 11192 .

54. Cregger M. , Berger A.J. , Rimm D.L. Immunohistochemistry and quantitative analysis of protein expression . Arch Pathol Lab Med . 2006 ; 130 : 1026 1030 .

55. Xiong H.Q. , Herbst R. , Faria S.C. et al. A phase I surrogate endpoint study of SU6668 in patients with solid tumors . Invest New Drugs . 2004 ; 22 : 459 466 .

56. Davis D.W. , Buchholz T.A. , Hess K.R. , Sahin A.A. , Valero V. , McConkey D.J. Automated quantification of apoptosis after neoadjuvant chemotherapy for breast cancer: early assessment predicts clinical response . Clin Cancer Res . 2003 ; 9 : 955 960 .

57. Davis D.W. , McConkey D.J. , Heymach J.V. et al. Pharmacodynamic analysis of target receptor tyrosine kinase activity and apoptosis in GIST tumors responding to therapy with SU11248 . Proc Am Soc Clin Oncol . 2005 : 23 Abstr 3006 .

58. Mendelsohn J. , Baselga J. Epidermal growth factor receptor targeting in cancer . Semin Oncol . 2006 ; 33 : 369 385 .

59. Hubbard S.R. Structural analysis of receptor tyrosine kinases . Prog Biophys Mol Biol . 1999 ; 71 : 343 358 .

60. Bernatchez P.N. , Soker S. , Sirois M.G. Vascular endothelial growth factor effect on endothelial cell proliferation, migration, and platelet-activating factor synthesis is Flk-1-dependent . J Biol Chem . 1999 ; 274 : 31047 31054 .

61. Fukuoka M. , Yano S. , Giaccone G. et al. Multi-institutional randomized phase II trial of gefitinib for previously treated patients with advanced non-small-cell lung cancer (The IDEAL 1 Trial) [corrected] . J Clin Oncol . 2003 ; 21 : 2237 2246 .

62. Kris M.G. , Natale R.B. , Herbst R.S. et al. Efficacy of gefitinib, an inhibitor of the epidermal growth factor receptor tyrosine kinase, in symptomatic patients with non-small cell lung cancer: a randomized trial . JAMA . 2003 ; 290 : 2149 2158 .

63. Gasparini G. , Sarmiento R. , Amici S. et al. Gefitinib (ZD1839) combined with weekly epirubicin in patients with metastatic breast cancer: a phase I study with biological correlate . Ann Oncol . 2005 ; 16 : 1867 1873 .

64. Albanell J. , Rojo F. , Averbuch S. et al. Pharmacodynamic studies of the epidermal growth factor receptor inhibitor ZD1839 in skin from cancer patients: histopathologic and molecular consequences of receptor inhibition . J Clin Oncol . 2002 ; 20 : 110 124 .

65. Von Hoff D.D. , LoRusso P.M. , Rudin C.M. et al. Inhibition of the hedgehog pathway in advanced basal-cell carcinoma . N Engl J Med . 2009 ; 361 : 1164 1172 .

66. Flaherty K.T. , Puzanov I. , Kim K.B. et al. Inhibition of mutated, activated BRAF in metastatic melanoma . N Engl J Med . 2010 ; 363 : 809 819 .

67. Kwak E.L. , Camidge D.R. , Clark J. et al. Clinical activity observed in a phase I dose escalation trial of an oral c-met and ALK inhibitor, PF-02341066 . ASCO Meeting Abstracts . 2009 ; 27 ( 15S ) : 3509 .

68. Bollag G. , Hirth P. , Tsai J. et al. Clinical efficacy of a RAF inhibitor needs broad target blockade in BRAF-mutant melanoma . Nature . 2010 ; 467 : 596 599 .

69. Lockhart A.C. , Rothenberg M.L. , Dupont J. et al. Phase I study of intravenous vascular endothelial growth factor trap, aflibercept, in patients with advanced solid tumors . J Clin Oncol . 2010 ; 28 : 207 214 .

70. Tew W.P. , Gordon M. , Murren J. et al. Phase 1 study of aflibercept administered subcutaneously to patients with advanced solid tumors . Clin Cancer Res . 2010 ; 16 : 358 366 .

71. Chapman P.B. , Hauschild A. , Robert C. et al. Improved survival with vemurafenib in melanoma with BRAF V600E mutation . N Engl J Med . 2011 ; 364 : 2507 2516 .

72. Kwak E.L. , Bang Y.J. , Camidge D.R. et al. Anaplastic lymphoma kinase inhibition in non-small-cell lung cancer . N Engl J Med . 2010 ; 363 : 1693 1703 .

73. O’Hara S.M. , Moreno J.G. , Zweitzig D.R. , Gross S. , Gomella L.G. , Terstappen L.W. Multigene reverse transcription-PCR profiling of circulating tumor cells in hormone-refractory prostate cancer . Clin Chem . 2004 ; 50 : 826 835 .

74. Gordon. Phase I trial of recombinant humanized monoclonal anti-vascular endothelial growth factor (anti-VEGF MAB) in patients (PTS) with metastatic cancer (Meeting abstract) 1998.

75. Biomarkers Definitions Working Group . Biomarkers and surrogate endpoints: preferred definitions and conceptual framework . Clin Pharmacol Ther . 2001 ; 69 : 89 95 .

76. Frank R. , Hargreaves R. Clinical biomarkers in drug discovery and development . Nat Rev . 2003 ; 2 : 566 580 .

77. Collins J.M. Functional imaging in phase I studies: decorations or decision making? J Clin Oncol . 2003 ; 21 : 2807 2809 .

78. Bergstrom M. , Grahnen A. , Langstrom B. Positron emission tomography microdosing: a new concept with application in tracer and early clinical drug development . Eur J Clin Pharmacol . 2003 ; 59 : 357 366 .

79. Galbraith S.M. MR in oncology drug development . NMR Biomed . 2006 ; 19 : 681 689 .

80. Kelloff G.J. , Hoffman J.M. , Johnson B. et al. Progress and promise of FDG-PET imaging for cancer patient management and oncologic drug development . Clin Cancer Res . 2005 ; 11 : 2785 2808 .

81. Mochizuki T. , Tsukamoto E. , Kuge Y. et al. FDG uptake and glucose transporter subtype expressions in experimental tumor and inflammation models . J Nucl Med . 2001 ; 42 : 1551 1555 .

82. de Geus-Oei L.-F. , van Krieken J.H. , Aliredjo R.P. et al. Biological correlates of FDG uptake in non-small cell lung cancer . Lung Cancer . 2007 ; 55 : 79 87 .

83. Demetri G.D. , von Mehren M. , Blanke C.D. et al. Efficacy and safety of imatinib mesylate in advanced gastrointestinal stromal tumors . N Engl J Med . 2002 ; 347 : 472 480 .

84. Prior J.O. , Montemurro M. , Orcurto M.V. et al. Early prediction of response to sunitinib after imatinib failure by 18F-fluorodeoxyglucose positron emission tomography in patients with gastrointestinal stromal tumor . J Clin Oncol . 2009 ; 27 : 439 445 .

85. Therasse P. , Arbuck S.G. , Eisenhauer E.A. et al. New guidelines to evaluate the response to treatment in solid tumors . National Cancer Institute of the United States, National Cancer Institute of Canada European Organization for Research and Treatment of Cancer . J Natl Cancer Inst . 2000 ; 92 : 205 216 .

86. Eisenhauer E.A. , Therasse P. , Bogaerts J. et al. New response evaluation criteria in solid tumours: revised RECIST guideline (version 1.1) . Eur J Cancer . 2009 ; 45 : 228 247 .

87. Husband J.E. , Schwartz L.H. , Spencer J. et al. Evaluation of the response to treatment of solid tumours—a consensus statement of the International Cancer Imaging Society . Br J Cancer . 2004 ; 90 : 2256 2260 .

88. Twombly R. Criticism of tumor response criteria raises trial design questions . J Natl Cancer Inst . 2006 ; 98 : 232 234 .

89. Schwartz L.H. , Mazumdar M. , Wang L. et al. Response assessment classification in patients with advanced renal cell carcinoma treated on clinical trials . Cancer . 2003 ; 98 : 1611 1619 .

90. Moertel C.G. , Hanley J.A. The effect of measuring error on the results of therapeutic trials in advanced cancer . Cancer . 1976 ; 38 : 388 394 .

91. Michaelis L.C. , Ratain M.J. Measuring response in a post-RECIST world: from black and white to shades of grey . Nat Rev Cancer . 2006 ; 6 : 409 414 .

92. Lavin P.T. An alternative model for the evaluation of antitumor activity . Cancer Clin Trials . 1981 ; 4 : 451 457 .

93. Verweij J. , Therasse P. , Eisenhauer E. Cancer clinical trial outcomes: any progress in tumour-size assessment? Eur J Cancer . 2009 ; 45 : 225 227 .