[level-membership-for-basic-science-category]
Chapter 2 Pharmacokinetics
Basic Concepts
Drug Transfer
Active Transport
ATP Dependence

 Examples of the ATP binding cassette group of transporters include the multidrug resistance transporters (MDR transporters) such as P-glycoprotein (Pgp, MDR1 or ABCB1).
 P-glycoprotein is an efflux transporter that transports drugs out of cell to the extracellular space.
 P-glycoprotein plays an important role in drug pharmacokinetics and in drug interactions.
Drug Properties
Drug Formulations (Table 2-1)
 Solid formulations (e.g., tablets, capsules, suppositories) must disintegrate to release the drug. Disintegration of the dosage form may be compromised under certain conditions (e.g., dry mouth caused by aging, disease, or concurrent drug treatment slows dissolution of nitroglycerin tablets). On the other hand, drugs may be specifically formulated to allow disintegration only in certain sections of the gastrointestinal (GI) tract (e.g., enteric-coated tablets disintegrate in the small intestine), for the purpose of protecting the drug from destruction by gastric acid of the stomach (e.g., erythromycin) or protecting the stomach from an irritant drug (e.g., enteric-coated aspirin). Tablets and capsules may also be formulated to slowly release drugs (controlled-release, extended-release, or sustained-release formulations) and prolong their duration of action. Sustained-release formulations are particularly useful for drugs that have very short durations of action (see Table 2-1).


TABLE 2-1 Pharmacokinetic Characteristics of Different Drug Formulations
| Drug Formulations | Examples | General Pharmacokinetic Characteristics |
|---|---|---|
| Solids |
Drug Chemistry
 Molecular size and shape. Smaller molecules are absorbed more readily. Drug shape affects affinity of the drug for carrier molecules or other binding sites such as plasma proteins or tissue. Drugs of similar structure may exhibit competition for such binding sites, which can affect their pharmacokinetics.

Effect of pH
 For drugs that are weak acids, the following equation applies, where HA = drug with proton, which is therefore nonionized. H+ = proton, and A− is the ionized drug.


 The relationship between the pH of the drug’s environment and the degree of its ionization is determined by the Henderson-Hasselbalch equation:
Henderson-Hasselbalch Equation Applied to Acidic Drugs


 The relationship between the pH of the drug’s environment and the degree of its ionization is determined by the Henderson-Hasselbalch equation:
Henderson-Hasselbalch Equation Applied to Basic Drugs
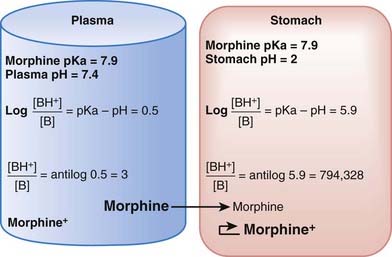
The practical implications are as follows: The ionized form of the drug may become stranded in certain locations. This effect, referred to as ion trapping or pH trapping, occurs when drugs accumulate in a certain body compartment because they can diffuse into this area, but then become ionized owing to the prevailing pH and are unable to diffuse out of this location. An example, shown in Figure 2-1, is the trapping of basic drugs (e.g., morphine, pKa 7.9) in the stomach. The drug is approximately 50% nonionized in the plasma (pH approximately 7.4) because it is in an environment with a pH close to its pKa. In the stomach (pH approximately 2), the drug is highly ionized (approximately 200,000×), it cannot diffuse across the cells lining the stomach, and the drug molecules are trapped in the stomach.
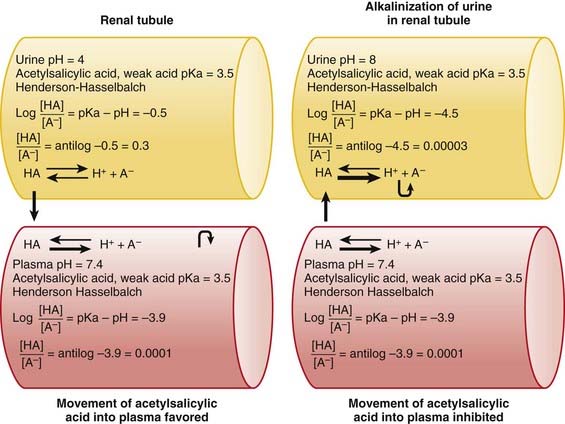
The concepts of acidic and basic drugs and their relative ionization at different pH values can be used clinically. For example, acidification of the urine is used to increase the elimination of amphetamine, a basic drug with pKa approximately 9.8. Rendering the urine acidic increases the amount of amphetamine in the ionized state, preventing its reabsorption from the urine into the bloodstream. Conversely, alkalinization of the urine is used to increase the excretion of acetylsalicylic acid (aspirin), an acidic drug. Increasing the pH of urine above the pKa of acetylsalicylic acid increases the proportion of the drug in the ionized state by about 10,000 times. The ionized form of the drug is not able to be reabsorbed across the renal tubule into the bloodstream. Moreover, the low concentration of the non-ionized form in the renal tubule compared with that in the blood favors diffusion of the non-ionized drug into the renal tubules (see Figure 2-2).
Absorption
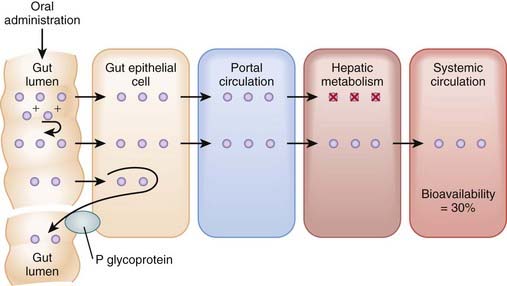
Bioavailability will be influenced by any factors that impede the active drug from reaching the systemic circulation (Figure 2-3). These include diffusion across physiologic barriers, the effect of transporters that prevent accumulation of drug in the blood, and metabolism of the drug before it reaches the systemic circulation. For example, after oral administration, a drug may have low bioavailability if:


Routes of Administration
Enteral Administration
 Oral (PO) administration is the most frequently used route of administration because of its simplicity and convenience, which improve patient compliance. Bioavailability of drugs administered orally varies greatly. This route is effective for drugs with moderate to high oral bioavailability and for drugs of varying pKa because gut pH varies considerably along the length of the GI tract. Administration via this route is less desirable for drugs that are irritating to the GI tract or when the patient is vomiting or unable to swallow. Drugs given orally must be acid stable or protected from gastric acid (e.g., by enteric coatings). Additional factors influencing absorption of orally administered drugs include the following:
 Gastric emptying time. For most drugs the greatest absorption occurs in the small intestine owing to its large surface. More rapid gastric emptying facilitates their absorption because the drug is delivered to the small intestine more quickly. Conversely, factors that slow gastric emptying (e.g., food, anticholinergic drugs) generally slow absorption.


Parenteral Administration
 IV administration is the most reliable method for delivering drug to the systemic circulation because it bypasses many of the absorption barriers, efflux pumps, and metabolic mechanisms. In fact, by definition, bioavailability of drugs is 100% by IV injection because the drug is administered directly into the vascular space. It is also one of the preferred routes of administration to rapidly achieve therapeutically effective drug concentrations. IV infusions may be used to achieve a constant level of drug in the bloodstream. Drugs must be in aqueous solution or very fine suspensions to avoid the possibility of embolism. Caution must be used with drugs or drug combinations with the propensity to form precipitates.


Drug Distribution
Initial Drug Distribution


Drug Redistribution


Effect of Drug Binding on Distribution
Plasma Protein Binding
 Plasma proteins, such as albumin, α-glycoprotein, and steroid hormone binding globulins, exhibit affinity for a number of drugs.


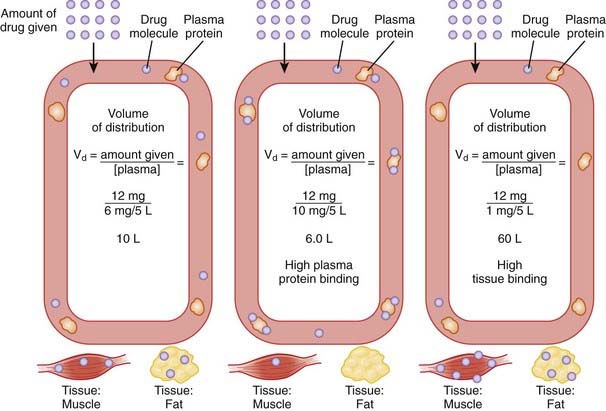
Volume of Distribution
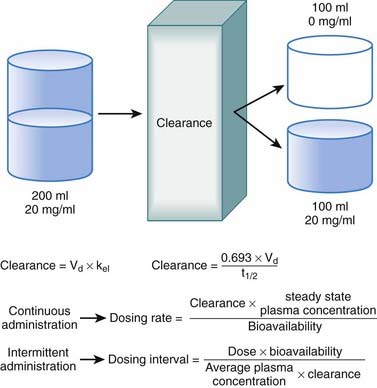
The volume of distribution represents the theoretical volume in liters (therefore also called apparent volume of distribution) into which a drug is dissolved to produce the plasma concentration observed at steady state. Volume of distribution is calculated as the quotient of the amount of drug administered and the steady state plasma concentration (Figure 2-4).


Drug Elimination
Biotransformation (Metabolism)
Many drugs are lipophilic molecules that resist excretion via the kidney or gut because they can readily diffuse back into the circulation. Biotransformation is an essential step in eliminating these drugs by converting them to more polar water-soluble compounds. There are several different biotransformation pathways that drug molecules may follow (Figure 2-5). Biotransformation:


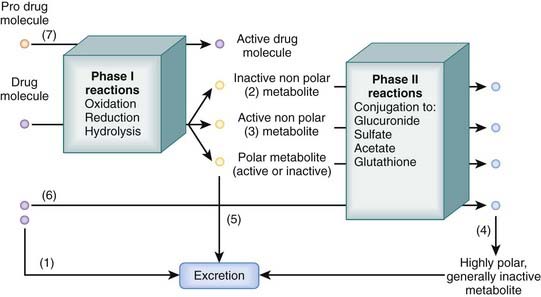
Two major processes contribute to biotransformation of drugs.
Phase I Reactions
Phase I reactions are also called oxidation-reduction reactions or handle reactions.
 These reactions uncover or add a reactive group to the drug molecule through oxidation, reduction, or hydrolysis.
Oxidation
Oxidation accounts for a large proportion of drug metabolism.
 It is mediated primarily by mixed function oxygenases (monooxygenases; microsomal mixed function oxidases) located in endoplasmic reticulum, which include the following:


 The cytochrome P-450 family accounts for over 80% of drug oxidation. In this group of enzymes:


 Interaction at CYPs is an important pharmacokinetic mechanism that can affect clinical use of drugs. Knowledge of CYP isoforms involved in metabolism of drugs and the type of interaction can guide clinical selection of drugs and explain adverse drug interactions. Interactions may take the form of competition, inhibition, or induction.


 Examples of clinically important CYP isoforms include the following:

 CYP2D6


Drug Excretion
Renal Excretion
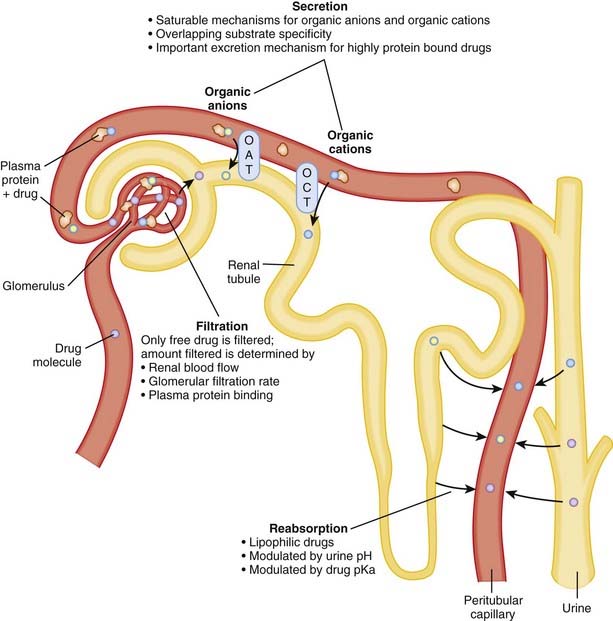
Renal excretion is quantitatively the most important route of excretion for most drugs and drug metabolites. Renal excretion involves three processes: glomerular filtration, tubular secretion, and/or tubular reabsorption (Figure 2-6). The sum of these processes determines the extent of net renal drug excretion.
 Glomerular filtration
 The kidney filters approximately 180 L of fluid per day; thus there is a large capacity for drug excretion via this route.

 Factors influencing the amount of drug excreted by filtration include the following:
 Tubular secretion
 Secretory mechanisms in the renal tubules actively transport endogenous substances and drug molecules from the plasma in peritubular capillaries to the tubular lumen.

 Tubular transporters exhibit:


 Tubular secretion is:


Clinical Pharmacokinetics
Plasma Concentration Curves
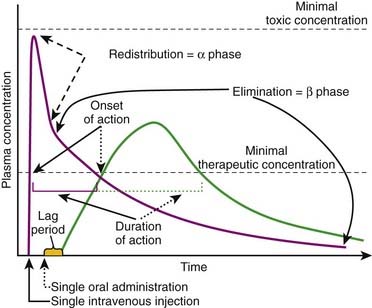
Plasma concentration curves depict the plasma concentration of drugs over time (Figure 2-7). These curves are useful in illustrating several important principles. Although the different phases of the plasma drug profile will be discussed sequentially, it is important to note that the processes of absorption, distribution, and elimination occur simultaneously. As soon as a drug reaches the systemic circulation (absorption), it is also being distributed and eliminated.
 Plasma concentrations that exceed the minimally therapeutic concentration will exert a pharmacologic effect. The point at which plasma concentrations exceed this level represents the onset of action of the drug. The duration of action of the drug is the time over which the plasma concentrations exceed the minimally therapeutic concentration. Plasma concentrations that exceed the minimally toxic concentration will produce toxic effects. An important goal of pharmacotherapy is to maintain plasma concentrations between the minimally therapeutic and minimally toxic concentrations.
 Oral or other nonvascular routes of administration result in a delayed peak plasma concentration.


The Drug Elimination or β Phase
Elimination Kinetics
First-Order Kinetics
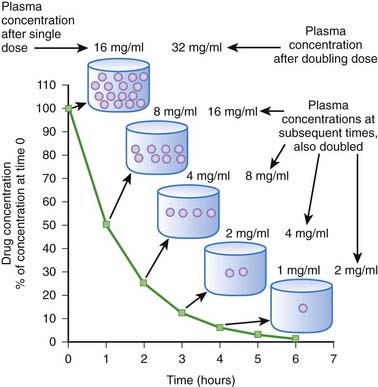
When drug elimination proceeds by first-order kinetics, a constant proportion or fraction of drug is eliminated per unit time (e.g., 25%/hr). As a result, plasma drug concentrations decline exponentially. This occurs because the elimination mechanisms adjust their activity to the prevailing drug concentration. When drug concentrations increase, elimination mechanisms can accept more drug. Conversely, when plasma concentrations decline, the elimination mechanisms process less drug. Important: as long as elimination proceeds by first-order kinetics the fraction of drug eliminated per unit time remains constant regardless of the starting concentration. An example is shown in Figure 2-8. In this example 50% of the drug is eliminated in 1 hour. One hour after the peak concentration of 16 mg/mL, the drug concentration is 8 mg/mL. After 1 additional hour, the plasma concentration has been reduced to 50% of 8 mg/mL, and so on for each additional hour. An important feature of first-order kinetics is that the proportion of drug eliminated is independent of the starting concentration. If the dose of drug was doubled and peak concentration reached 32 mg/mL, 50% of the drug would still be eliminated each hour. The constant proportionality of first-order elimination allows relatively accurate prediction of plasma concentrations over time. Doubling of the dose results in a doubling of plasma concentrations at any time point. As a result, for drugs that are eliminated by first-order kinetics:


Zero-Order Kinetics
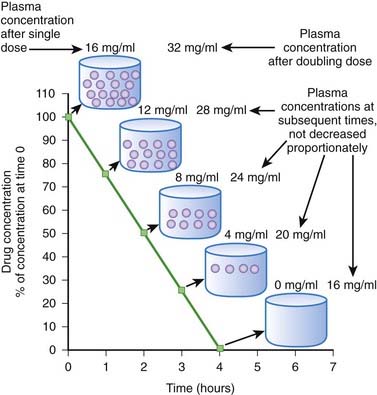
Zero-order kinetics is also called saturation kinetics. In this case, elimination mechanisms become saturated and unable to process more drug when drug concentrations rise. Consequently, for drugs that are eliminated by zero-order kinetics, a constant amount of drug is eliminated per unit time (e.g., 5 mg/hr) regardless of drug plasma concentration. Plasma concentrations decline in linear fashion (Figure 2-9). As a result, a progressively smaller proportion of drug is eliminated as plasma concentrations increase. In other words, the proportion of drug eliminated depends on the starting concentration. Zero-order kinetics makes prediction of drug concentrations over time problematic. In the example shown in Figure 2-9, 4 mg/mL of drug is eliminated per hour. In the case of a dose that produced a starting concentration of 16 mg/mL, plasma concentrations will have declined to 4 mg/mL in 3 hours. However if the dose is doubled to achieve initial plasma concentrations of 32 mg/mL, after 3 hours plasma concentrations would be 20 mg/mL or 5 times higher than the lower dose at a comparable time, a much greater level than we would have predicted by doubling the dose. Thus, the effects of changing dosage can be quite unpredictable for drugs that are eliminated by zero-order kinetics. For drugs that are eliminated by zero-order kinetics:
 The time to completely eliminate the drug is dependent on dose. This make repetitive administration complicated.
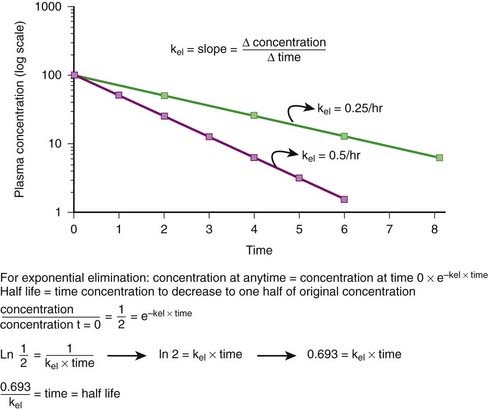
The majority of drugs are eliminated by first-order kinetics. For drugs that exhibit first-order kinetics, the β phase is used to obtain several important parameters (Figure 2-10).
Elimination Rate Constant (kel, ke)
First-order kinetics dictate that plasma concentrations fall exponentially during the elimination phase. It is typical to plot these data on a semilogarithmic scale to linearize the plasma concentration time curve. The slope of this curve is the elimination rate constant (kel). The elimination rate constant describes the fraction of drug eliminated per unit of time or the rate at which plasma concentrations will decline during the elimination phase. For example (see Figure 2-10), if 25% of a drug were eliminated per hour, then kel would be 0.25/hr. The value for kel is estimated as the slope of the elimination phase of the plasma concentration curve. Note that kel is independent of the dose or starting concentration for drugs that follow first-order kinetics. As long as elimination mechanisms are not saturated, in our example, 25% of the starting concentration will be eliminated per hour whether the starting concentration (dose) is 10 units or 100 units. The elimination rate constant (proportion per unit time) can be used to calculate the time necessary to eliminate a certain proportion of drug (inverse of rate constant). Clinically, a very useful time interval is the time necessary to reduce drug concentration by one half—in other words, the half-life.
 Half-life (t1/2) is the time for plasma concentrations to decline to one half their starting value. Half-life is calculated as:
where 0.693 is a constant derived from the natural log (ln) (because the decay is exponential for first-order kinetics) of the ratio of drug concentration at the beginning and end of one half-life, which by definition is 2 (100%/50%) (ln 2 = 0.693).
 Thus the half-life is inversely related to the elimination rate constant because t1/2 estimates the time needed to eliminate a specific proportion (50%) of drug. This makes the t1/2 a very useful parameter that can be used to estimate the:


Clearance
Clearance is another index of the ability of the body to eliminate drug. Rather than describing the amount of drug eliminated, clearance describes the volume of plasma from which drug would be totally removed per unit time. Clearance can be visualized as the circulation consisting of units or packets of blood containing a given concentration of drug. Clearance removes all of the drug from a certain unit of plasma in a given period of time (Figure 2-11). Although somewhat difficult conceptually, clearance is very valuable practically. Having an idea of how much plasma is cleared of drug over time allows estimation of how much drug must be given to maintain a constant plasma concentration.


Administration Protocols
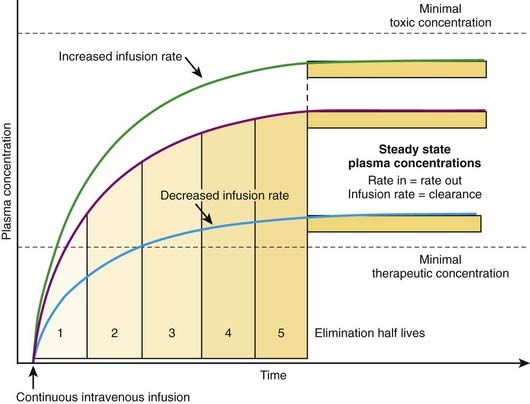
Continuous Administration
The most effective way to achieve a desired steady state drug concentration with minimal fluctuations is to administer the drug as a continuous infusion. Figure 2-12 illustrates that plasma drug concentrations begin to rise with the onset of an IV infusion because drug is continually delivered directly into the circulation. As plasma concentrations begin to increase with onset of the infusion, drug elimination will also begin to occur. Thus, simultaneously, drug is being added to the circulation and drug is being taken away. Plasma drug concentrations will continue to rise as long as the rate of drug delivery exceeds the rate of drug elimination until a point is reached at which the clearance of the drug from plasma is equal to the delivery of new drug into the plasma. At this point the rate of drug delivery equals the rate of elimination, and steady state has been achieved. This balance between drug in and drug out, or steady state, will be achieved in four to five half-lives. A change in the infusion rate will result in a change in the steady state plasma concentrations; however, the time to reach steady state will still be four to five half-lives. Plasma drug concentrations will remain stable unless the rate of infusion or the clearance is altered in some way (e.g., by induction of metabolic enzymes).


Intermittent Administration
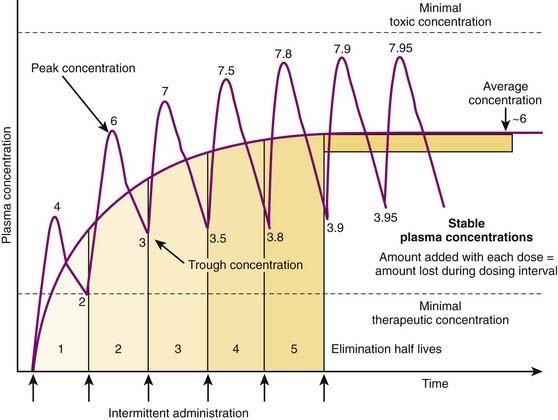
Although there are many examples in which continuous administration of drug is practiced, drugs are usually administered on an intermittent basis. Intermittent administration will result in much greater fluctuations in plasma drug concentrations. Plasma concentrations will rise in the absorptive phase to reach a peak and then decrease in the redistribution and elimination phases to reach a trough concentration until the next dose is given (Figure 2-13). In keeping with the general principle discussed earlier, stable average plasma drug concentrations will be reached when the amount of drug added in the next dose equals the amount eliminated during the interval between doses. For drugs that obey first-order kinetics, stable average drug concentrations will be achieved in 4 to 5 half-lives. Thus, the clinician must estimate a dose and administration interval to attain the desired steady state concentration of drug while once again minimizing the fluctuations in drug concentrations to avoid potential toxicity or lack of efficacy. An additional factor to consider is patient compliance. It would be possible to closely approximate a continuous infusion and very steady plasma concentrations using very small doses administered very frequently. However, most patients would not readily accept such a regimen. Thus dosage schedules should also be designed to provide convenient intervals to promote patient compliance. For intermittent dosage regimens:
 The plasma concentration of drug is constantly changing, rising to a peak value sometime after absorption and falling to a trough value immediately before the next dose.


 The time to reach a stable average concentration will be determined by clearance and half-life. As described earlier, 4 to 5 half-lives will be required to reach a stable average drug concentration regardless of the dose or dosage interval. In practice:
 For a drug with a t1/2 of 5 hours, stable average plasma concentrations will be obtained in about a day (20 to 25 hours).
 Figure 2-14 illustrates the effect of altering dosage intervals on a drug that is eliminated by first-order kinetics. Note that in all cases the initial dose produces approximately equivalent plasma concentrations. However, plasma concentrations at subsequent doses differ greatly based on how much time is available for drug elimination during the dosage interval. Halving the dosage interval (purple curve) approximately doubles the average plasma concentration. Peak concentrations of drug exceed the minimal toxic concentrations and may be associated with adverse effects. Conversely, when the dosage interval is doubled (yellow curve), the peak concentrations initially exceed the minimal therapeutic concentrations but fall below that level during the dosage interval. The average plasma concentration also falls below therapeutic levels, and the drug is not effective. In both cases, the time to achieve stable average concentrations is approximately 4 to 5 half-lives.

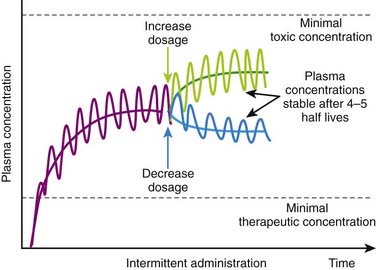
 Basic pharmacokinetic principles can also predict the effect of changes in dosage or in dosage interval that occur during maintenance therapy. An increase or decrease in dosage will be associated with changes in peak, trough, and average plasma concentrations. An increase in dosage will cause peak concentrations to increase progressively with each dose until elimination mechanisms match the new increment in plasma concentrations at each administration. Conversely, with a reduction in dosage, trough concentration will progressively decrease until elimination matches the new, lower amount of drug added to the circulation at each administration. In both cases, peak, trough, and average plasma concentrations will stabilize over the course of 4 to 5 half-lives (Figure 2-15).
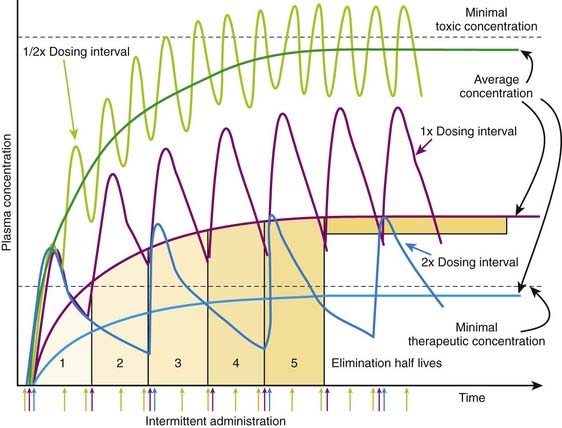
Loading Doses
 Loading doses are useful in emergency situations in which it is important to achieve a drug effect as soon as possible—for example, the administration of an anticonvulsant medication during a seizure. In these cases the drug would be given directly into the circulation to eliminate the time needed for absorption.


[/level-membership-for-basic-science-category][not-level-membership-for-basic-science-category]
Chapter 2 Pharmacokinetics
Basic Concepts
Drug Transfer
Active Transport
ATP Dependence
Examples of the ATP binding cassette group of transporters include the multidrug resistance transporters (MDR transporters) such as P-glycoprotein (Pgp, MDR1 or ABCB1).
P-glycoprotein is an efflux transporter that transports drugs out of cell to the extracellular space. P-glycoprotein plays an important role in drug pharmacokinetics and in drug interactions.
Drug Properties
Drug Formulations (Table 2-1)
Solid formulations (e.g., tablets, capsules, suppositories) must disintegrate to release the drug. Disintegration of the dosage form may be compromised under certain conditions (e.g., dry mouth caused by aging, disease, or concurrent drug treatment slows dissolution of nitroglycerin tablets). On the other hand, drugs may be specifically formulated to allow disintegration only in certain sections of the gastrointestinal (GI) tract (e.g., enteric-coated tablets disintegrate in the small intestine), for the purpose of protecting the drug from destruction by gastric acid of the stomach (e.g., erythromycin) or protecting the stomach from an irritant drug (e.g., enteric-coated aspirin). Tablets and capsules may also be formulated to slowly release drugs (controlled-release, extended-release, or sustained-release formulations) and prolong their duration of action. Sustained-release formulations are particularly useful for drugs that have very short durations of action (see Table 2-1).TABLE 2-1 Pharmacokinetic Characteristics of Different Drug Formulations
| Drug Formulations | Examples | General Pharmacokinetic Characteristics |
|---|---|---|
| Solids |
Drug Chemistry
Molecular size and shape. Smaller molecules are absorbed more readily. Drug shape affects affinity of the drug for carrier molecules or other binding sites such as plasma proteins or tissue. Drugs of similar structure may exhibit competition for such binding sites, which can affect their pharmacokinetics.Effect of pH
For drugs that are weak acids, the following equation applies, where HA = drug with proton, which is therefore nonionized. H+ = proton, and A− is the ionized drug.
The relationship between the pH of the drug’s environment and the degree of its ionization is determined by the Henderson-Hasselbalch equation:
Henderson-Hasselbalch Equation Applied to Acidic Drugs
The relationship between the pH of the drug’s environment and the degree of its ionization is determined by the Henderson-Hasselbalch equation:
Henderson-Hasselbalch Equation Applied to Basic Drugs
The practical implications are as follows: The ionized form of the drug may become stranded in certain locations. This effect, referred to as ion trapping or pH trapping, occurs when drugs accumulate in a certain body compartment because they can diffuse into this area, but then become ionized owing to the prevailing pH and are unable to diffuse out of this location. An example, shown in Figure 2-1, is the trapping of basic drugs (e.g., morphine, pKa 7.9) in the stomach. The drug is approximately 50% nonionized in the plasma (pH approximately 7.4) because it is in an environment with a pH close to its pKa. In the stomach (pH approximately 2), the drug is highly ionized (approximately 200,000×), it cannot diffuse across the cells lining the stomach, and the drug molecules are trapped in the stomach.
The concepts of acidic and basic drugs and their relative ionization at different pH values can be used clinically. For example, acidification of the urine is used to increase the elimination of amphetamine, a basic drug with pKa approximately 9.8. Rendering the urine acidic increases the amount of amphetamine in the ionized state, preventing its reabsorption from the urine into the bloodstream. Conversely, alkalinization of the urine is used to increase the excretion of acetylsalicylic acid (aspirin), an acidic drug. Increasing the pH of urine above the pKa of acetylsalicylic acid increases the proportion of the drug in the ionized state by about 10,000 times. The ionized form of the drug is not able to be reabsorbed across the renal tubule into the bloodstream. Moreover, the low concentration of the non-ionized form in the renal tubule compared with that in the blood favors diffusion of the non-ionized drug into the renal tubules (see Figure 2-2).
Absorption
Bioavailability will be influenced by any factors that impede the active drug from reaching the systemic circulation (Figure 2-3). These include diffusion across physiologic barriers, the effect of transporters that prevent accumulation of drug in the blood, and metabolism of the drug before it reaches the systemic circulation. For example, after oral administration, a drug may have low bioavailability if:
Routes of Administration
Enteral Administration
Oral (PO) administration is the most frequently used route of administration because of its simplicity and convenience, which improve patient compliance. Bioavailability of drugs administered orally varies greatly. This route is effective for drugs with moderate to high oral bioavailability and for drugs of varying pKa because gut pH varies considerably along the length of the GI tract. Administration via this route is less desirable for drugs that are irritating to the GI tract or when the patient is vomiting or unable to swallow. Drugs given orally must be acid stable or protected from gastric acid (e.g., by enteric coatings). Additional factors influencing absorption of orally administered drugs include the following:
Gastric emptying time. For most drugs the greatest absorption occurs in the small intestine owing to its large surface. More rapid gastric emptying facilitates their absorption because the drug is delivered to the small intestine more quickly. Conversely, factors that slow gastric emptying (e.g., food, anticholinergic drugs) generally slow absorption.Parenteral Administration
IV administration is the most reliable method for delivering drug to the systemic circulation because it bypasses many of the absorption barriers, efflux pumps, and metabolic mechanisms. In fact, by definition, bioavailability of drugs is 100% by IV injection because the drug is administered directly into the vascular space. It is also one of the preferred routes of administration to rapidly achieve therapeutically effective drug concentrations. IV infusions may be used to achieve a constant level of drug in the bloodstream. Drugs must be in aqueous solution or very fine suspensions to avoid the possibility of embolism. Caution must be used with drugs or drug combinations with the propensity to form precipitates.