[level-membership-for-pathology-category]
CHAPTER 3 Normal bone marrow histology
Normal bone marrow – generalities and function
The term ‘bone marrow’ (BM) refers to the tissue occupying the cavities under the cortex within the honeycomb of trabecular bone. Normal marrow is either red, consisting of the hematopoietic tissue, or yellow, composed mainly of fat cells (adipose tissue). In children most bones contain hematopoietic marrow, almost to the exclusion of fat cells. In the adult, red marrow is found in the skull, sternum, scapulae, vertebrae, ribs, pelvic bones and the proximal ends of the long bones (e.g. femora and humeri). The hematopoietic marrow produces the mature blood cells, which have a finite life span and must be constantly replaced (see Chapter 2). The weight of the total BM is 1600–3700 g. The BM is composed of:
Bone marrow trephine biopsy
The process of obtaining a bone marrow trephine biopsy (BMTB) originates in the ancient procedure of trepanning.1 Prior to the advent of BMTB needles, clot preparations of aspirated marrow were prepared for diagnostic purposes. BM biopsies were obtained only as a means of diagnosis if marrow was inaspirable, a ‘dry tap’. The modification of needles by Jamshidi in the 1970s revolutionized the process of obtaining intact cores of bone and bone marrow for examination, primarily from the pelvis. The most common site biopsed is the posterior superior iliac crest. Other sites which can be biopsied include the anterior superior iliac crest, tibia, and vertebrae. Biopsy of the sternum is contraindicated due to the significant morbidity and mortality associated with this practice. The optimal length of a BMTB is 2–3 cm; shorter biopsies may not be representative and may not detect diseases that have a focal or patchy pattern of BM involvement.2
Processing and stains
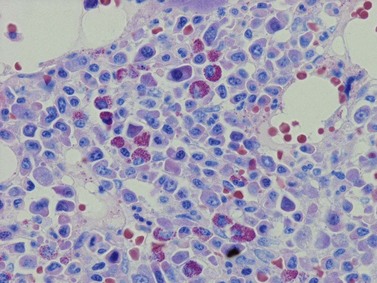
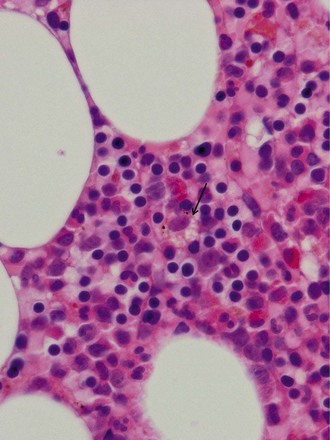
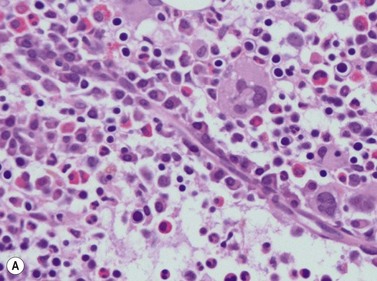
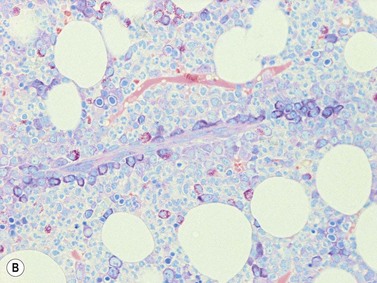
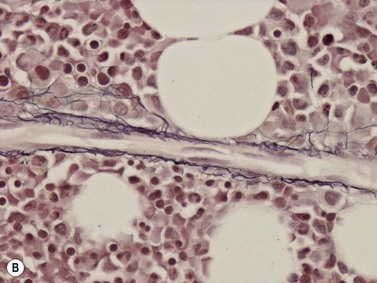
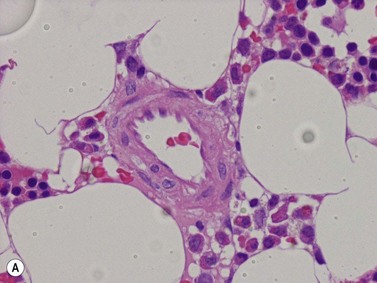
A number of methods are available for fixation, decalcification and embedding of the BMTB2 (Table 3.1). For optimal evaluation, sections are cut at a thickness of 1–3 µm. Conventional stains are hematoxylin and eosin (H&E) (Fig. 3.1A) and Giemsa (Fig. 3.1B) stains. Giemsa staining generally gives better discrimination of cell types based on cytoplasmic staining characteristics, that is:
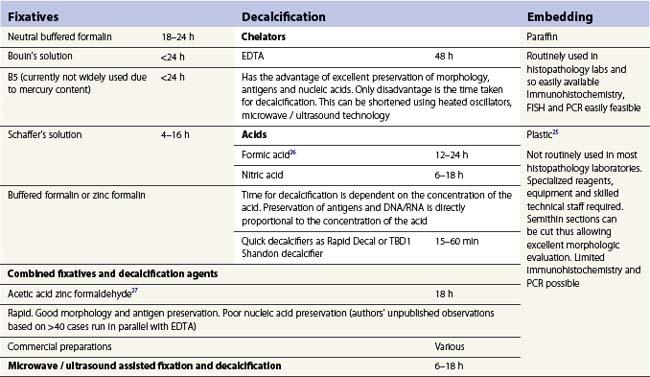
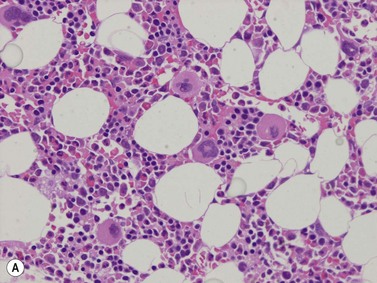
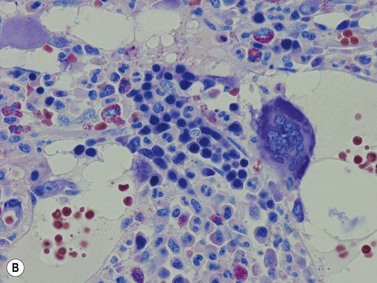
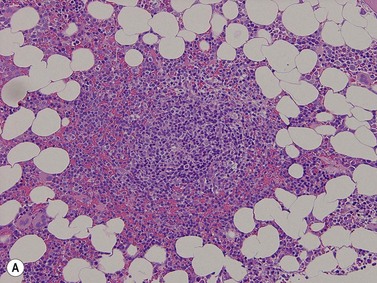
Fig. 3.1 (A, B) Normal bone marrow biopsy showing normal marrow cellularity and architecture. (A) Hematoxylin & Eosin stain. × 200. (B) Giemsa stain. × 400.
Other stains commonly used include the Perls stain for iron, silver stains for reticulin and Masson’s trichrome stain or Martius scarlet blue stain for collagen. Immunohistochemistry (IHC) using monoclonal or polyclonal antibodies, and in situ hybridization using nucleic acid probes can be used to identify specific cell types and genetic aberrations; these are discussed in sections below.3
Marrow cellularity
The BMTB is particularly useful for the assessment of marrow cellularity. This is the relative amount of BM cells to adipocytes, which is assessed subjectively and should be interpreted in the context of the age of the patient. The terms normocellular (normal for age), hypercellular (increased cellularity for age) and hypocellular (reduced cellularity for age) are used. Cellularity reduces with increasing age (Table 3.2).4,5 In practice, the formula (cellularity = 100 − patient age) can be applied for adults; however, it does not correlate with cellularity at the extremes of the age range. The intertrabecular spaces adjacent to the marrow cortex tend to be hypocellular and should not be assessed when determining overall BM cellularity.
| Age | Cellularity |
|---|---|
| Newborn to 3 months | 80–100% |
| Childhood | 60–80% |
| 20–40 years | 60–70% |
| 40–70 years | 40–50% |
| >70 years | 30–40% |
Marrow architecture
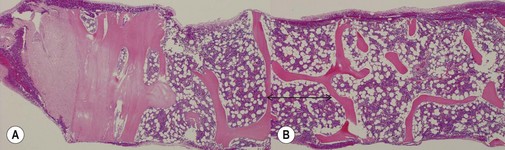
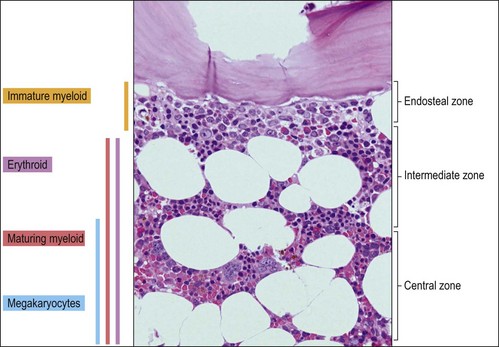
The BMTB enables the assessment of bone marrow architecture, the distribution of cellular elements and the bone and stromal cells. The outermost elements of the biopsy are composed of collagenous periosteal connective tissue, followed by a zone of cartilage or cortical bone (depending on the age of the patient). After this the bone breaks up into a meshwork of trabeculae, between which are the intertrabecular spaces. Hemopoietic cells are present within these intertrabecular spaces and are supported by fat cells, stromal cells, histiocytes extracellular matrix and blood vessels (Fig. 3.2). The hemopoietic cells are located within the intertrabecular spaces. The intertrabecular areas can be divided into three zones which contain different hemopoietic cell types (Fig. 3.3):
Hemopoiesis
The process of formation of blood elements from hemopoietic stem cells has been described in detail in Chapter 2. The BMTB enables the visualization of the spatial localization of the individual cell lineages during their development. Hemopoietic progenitors are present in cords, islands or clusters. Fully mature erythroid and granulocytic cells and platelets migrate through the sinusoidal endothelial cells to enter the bloodstream.
Erythropoiesis
Erythroid progenitors are found in small and large ‘islands’ called erythroid colonies within the intermediate and central zones of the marrow cavity. Erythroid islands are made up of concentric circles of immature erythroblasts (proerythroblasts) and a spectrum of maturing erythroid precursors leading to the late erythroblasts. Each erythroid island has a central iron-containing macrophage. The most primitive erythroid progenitor cells are present centrally around the macrophage and the maturing forms towards the periphery6 (Fig. 3.4). The central macrophage possesses dendritic processes, which extend between the maturing erythroid precursors. Its function is to support and nurture the erythroblasts, act as a source of iron and remove debris from dying cells and extruded nuclei. The central macrophage is often difficult to identify in histologic sections. Erythroid precursors are easily identified by being in distinct islands with cells of varying maturity, their almost perfectly round nuclei and by a perinuclear halo, an artifact of fixation and processing.
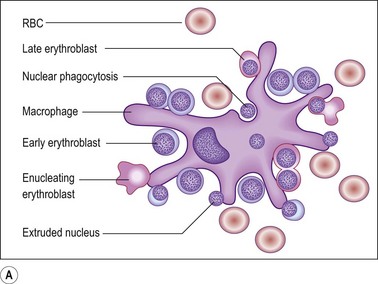
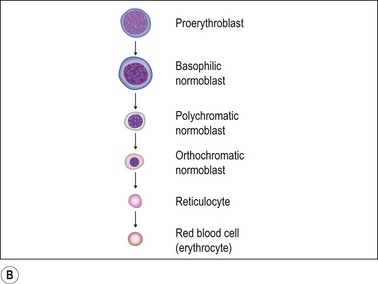
Fig. 3.4 (A, B) Erythropoiesis: organization of the erythroid colony and stages of erythroid maturation.
((A) Modified from Erythroblastic islands: niches for erythropoiesis. Blood 2008; 112: 470; (B) http://www.healthsystem.virginia.edu/internet/haematology/hessimages/erythropoiesis.jpg.)
Proerythroblast. The earliest recognizable erythroid precursors (proerythroblasts) are medium to large round cells with minimal cytoplasm, large round nuclei with dispersed or open chromatin, many small nucleoli and a crisp nuclear membrane. A rim of weakly basophilic cytoplasm with a halo is also present (Fig. 3.5A).
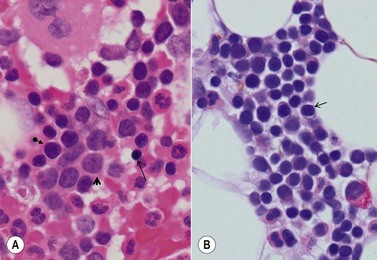
Maturing erythroblast (also called normoblast). These are smaller than proerythroblasts, and differ in their nuclear and cytoplasmic characteristics. As a rule, with maturation, nuclear size reduces and the amount of cytoplasm increases. The nuclear chromatin becomes more condensed and acquires a uniform, condensed, hyperchromatic ‘ink dot’ appearance. It is this nuclear characteristic that enables late normoblasts to be distinguished from lymphocytes. As hemoglobin forms, the cells acquire rims of pale pink cytoplasm (orthochromatic erythroblast) which with further maturation acquires the crisp orangiophilia of mature RBCs (Fig. 3.5B).
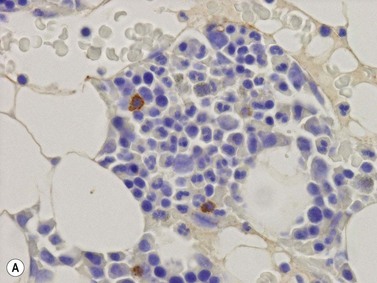
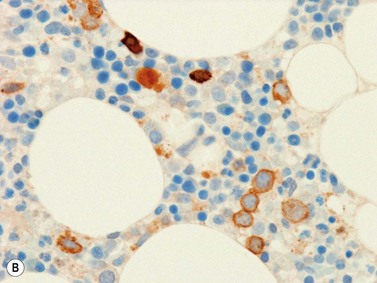
Erythroid cells can be identified by IHC using antibodies to glycophorin A (CD235) or C and intracellular hemoglobin. Glycophorin A highlights both nucleated erythroid precursors and RBCs (Fig. 3.6) while hemoglobin A tends to be restricted to hemoglobinized nucleated erythroid precursors. In situ hybridization can also be performed using probes for hemoglobin A.
Granulopoiesis
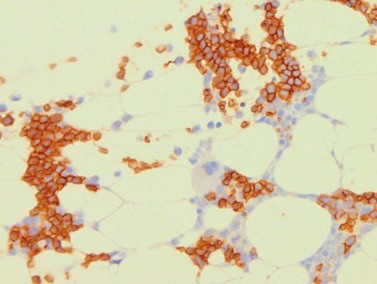
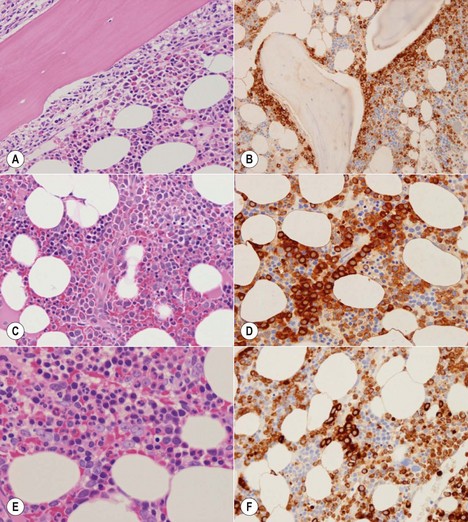
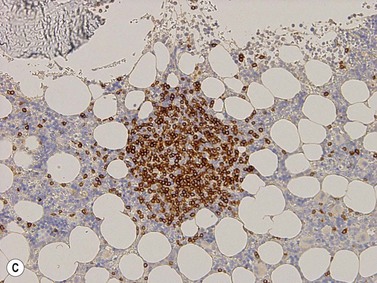
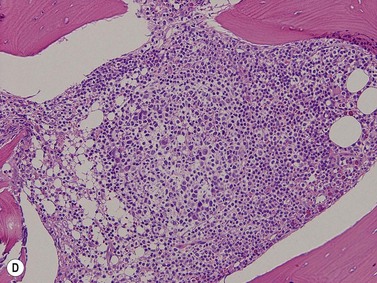
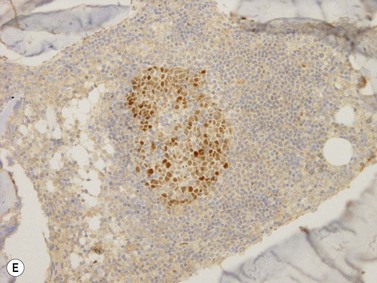
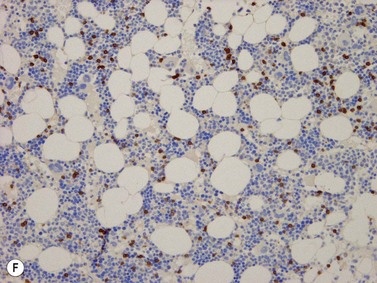
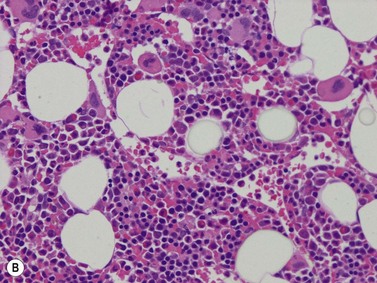
The granulocytic series consists of neutrophils, eosinophils, basophils and mast cells. All the morphologic stages of myeloid maturation as seen in the BM aspirate can be identified on trephine sections. Most immature granulocytic cells (myeloblasts and promyelocytes) are arranged along the endosteal surface (paratrabecular zone) (Fig. 3.7A, B) or as periarteriolar cuffs (Fig. 3.7C, D); these constitute the granulocytic ‘generation zones’; however, precursors are also scattered throughout the rest of the marrow as is often seen on myeloperoxidase (MPO) staining (Fig. 3.7E, F). Maturing granulocytic cells occur in the intermediate and central intertrabecular zones.
Myeloblast. This is the earliest recognizable granulocytic cell in the BMTB. It is a medium sized cell with a centrally placed round-ovoid nucleus, with very open, pale-staining chromatin which contains one or more fine eosinophilic nucleoli. A small amount of cytoplasm is often present; granules are difficult to identify (Fig. 3.8A).
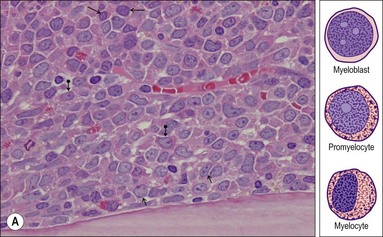
Promyelocyte. This is a slightly larger cell than the myeloblast with an ovoid nucleus and usually a single, prominent eosinophilic nucleolus. Promyelocytes have moderate amounts of heavily granulated cytoplasm. Promyelocytes often have a paranuclear pale-staining hof and are located in the endosteal zone (Fig. 3.8A).
Myelocyte. Myelocytes are seen in the intermediate zone of the intertrabecular space. They are smaller than promyelocytes with a smaller round to ovoid nucleus with coarser chromatin, and abundant granulated cytoplasm. Myelocytes do not have a nucleolus (Fig. 3.8B).
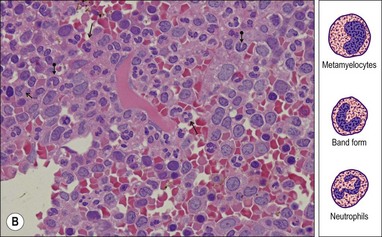
Metamyelocyte and band form. These are smaller than myelocytes and have an indented or horseshoe-shaped nucleus. Myelocytes and band forms are predominantly located in the central zone of the marrow (Fig. 3.8B).
Neutrophil. Neutrophils are also predominantly located in the central zone and can be identified by their small size and segmented nucleus. Histologically, one is usually able to identify about three segments per neutrophil (Fig. 3.8B). The granulation seen on Romanowsky-stained smears is not appreciable on H&E-stained biopsy sections.
Eosinophils and their precursors. These account for about 1–3% of all BM cells. Mature eosinophils are 10–12 µm sized cells with bi-segmented nuclei. They can be identified by their abundant, coarse eosinophilic cytoplasmic granules, which tend to be refractile. Eosinophil precursors follow the same morphologic maturation pathway as myeloid cells and eosinophil myelocytes and metamyelocytes are easily identified in sections (Fig. 3.9).
Basophils and their precursors. These account for <1% of all bone marrow cells and are difficult to identify on BMTB sections. Basophil granules are water-soluble and therefore do not stain up as one would expect on H&E-stained slides. IHC for CD123 expression highlights basophils and specific antibodies for basophils (2D7, BB1) are available if these need to be visualized on sections.7
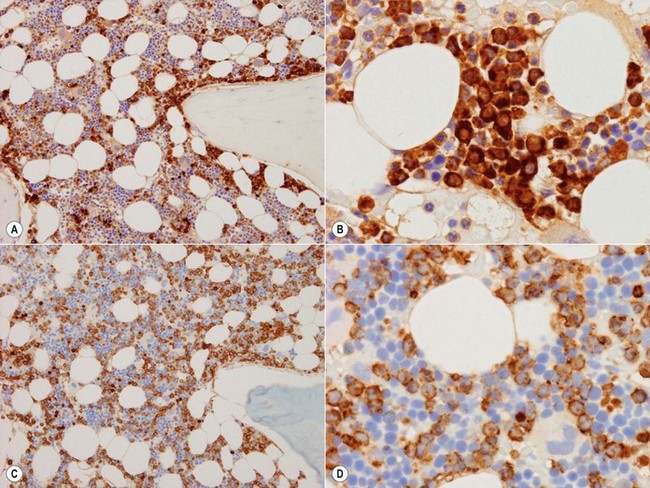
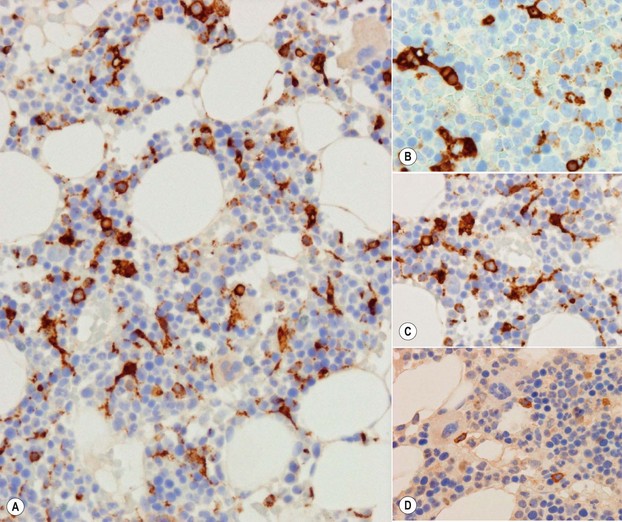
By immunohistochemistry, myeloid cells are positive for MPO, CD15, CD13, and CD33 (the latter two antibodies are available for use in paraffin sections but CD13 gives better results in flow cytometry). MPO is expressed weakly in myeloblasts, but is prominently expressed from the promyelocyte stage. Therefore, MPO preferentially highlights the immature myeloid precursors in the form of crisp, dense cytoplasmic staining, which allows easy visualization of their non-segmented nuclei. MPO staining is preferentially seen in the granulocytic cells that are distributed around the bony trabeculae and as cuffs around blood vessels (Fig. 3.7). Small groups of immature myeloid cells are also often seen in the interstitium away from both the trabeculae and vessels; these can present as cells of very large size with prominent nucleoli and should not be overinterpreted as atypical localization of immature precursors (ALIPs). Terminally differentiated myeloid cells express relatively lower amounts of MPO and thus the intermediate and central region of the intertrabecular space appears to stain weakly. CD15, in contrast, highlights the differentiated forms avidly and the intertrabecular area is therefore more intensely stained (Fig. 3.10A–D).
Myeloid : erythroid ratio
The myeloid : erythroid (M : E) ratio can be assessed in the BMTB on standard stains or with the aid of IHC. In the neonate, the M : E ratio is 1 : 3–4. During life there is an increase in granulocytic cells and reduction in erythroid precursors. In normal adults, the ratio is usually 2–5 : 1. Staining for CD15 is helpful in assessing this ratio as it rather uniformly stains all myeloid cells and if one mentally excludes the small number of megakaryocytes present, most of the remaining negative cells are erythroid cells (Fig. 3.10C).
Megakaryopoiesis
These are the largest cells normally present in the BM (Fig. 3.11). They range from 12 to 150 µm and show considerable variation in shape, size and nuclear configuration. The smaller ones are difficult to identify without IHC. As megakaryocytes develop, DNA synthesis proceeds as polyploidization goes through 8, 16, 32 or 64 n, while lobulation may continue after that; 95% of platelet-shedding megakaryocytes are 16–32 n.8,9 Megakaryocytes and their precursors are located centrally, within the BM intermediate and central zones. They are uniformly distributed as single cells and do not normally form clusters.
In sections of normal BM, the following differentiation stages can be recognized.
Mature megakaryocytes. These are large cells with abundant eosinophilic cytoplasm, a large nucleus with vesicular chromatin and small often inconspicuous nucleoli. The nucleus is multi-lobated in 3 dimensional studies and this can usually be appreciated in two dimensional histologic sections. However, depending on which part of the megakaryocyte is present in the plane of the section, the cells can appear spuriously small and the nuclei may appear mono- or hypolobated (Fig. 3.12). While this raises questions about the absolute definition of dysplastic megakaryocytes, the practical way to go about this is to see whether the change is uniform across megakaryocytes within the biopsy – if not then the changes are unlikely to represent dysmegakaryopoesis. Topographically, megakaryocytes are dispersed singly within the intermediate and central zones of the intertrabecular spaces and typically they abut or project into the sinusoids allowing direct platelet shedding. The presence of paratrabecular megakaryocytes indicates a marrow abnormality. Whole megakaryocytes or portions of their cytoplasm may also enter the sinuses and fragment in the vascular system.
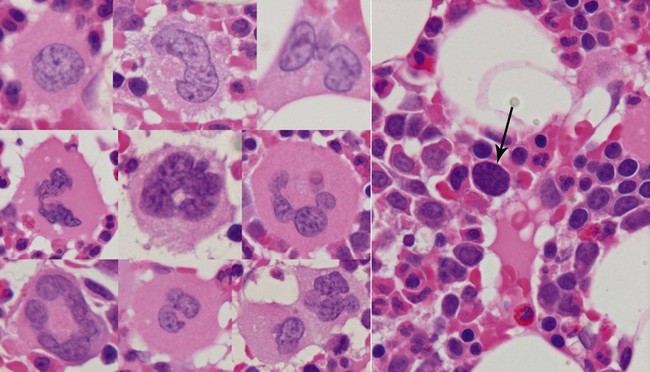
Senescent megakaryocyte. After the megakaryocyte has finished shedding its cytoplasm as platelets, all that remains is a round hyperchromatic nucleus with inconspicuous cytoplasm around it. These senescent end-stage megakaryocytes appear as ‘naked’ or ‘bare’ nuclei in the central zones (Fig. 3.12).
Micromegakaryocyte. This is a small mono- or binucleate megakaryocyte, approximately the size of a promyelocyte. These may be found in small numbers in biopsies from elderly patients and are characteristic in myelodysplasia (see Chapter 20).
There are also some morphologic changes which are uncommonly seen in normal BM. Emperipolesis, the presence of other intact cells (erythroblasts, granulocytes, lymphocytes) within megakaryocyte cytoplasm, may be found in megakaryocytes of any size. The ‘engulfed’ cells have not been phagocytosed but are passaging through the megakaryocyte cytoplasm (see Chapter 2). This is a benign reactive change with no specific association. Emperipolesis is increasingly common with age; it should not be interpreted as myelodysplasia unless florid or accompanied by other features of dysplasia.
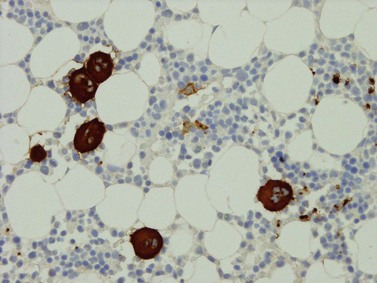
Megakaryocytes have intense cytoplasmic positivity with CD61, CD41 and CD42 antibodies by immunohistochemistry (Fig. 3.13A). Platelets are also positive with these antibodies and these may be seen in the interstitium or vessels (Fig. 3.13B). Platelets can completely surround myeloid and erythroid precursors; these should not be interpreted as micromegakaryocytes or megakaryoblasts. The latter show either intense cytoplasmic staining with a small eccentric nucleus or a crisp membrane stain with negligible cytoplasm and all nucleus.
Macrophages, monocytes and dendritic cells
Macrophages (histiocytes) are present throughout the marrow, where they store and deliver iron to erythroid progenitors (Fig. 3.14) and remove cellular debris by phagocytosis. There are two main types of histiocytic cells in the marrow, the roving monocyte and the fixed, stroma-based dendritic histiocyte (Fig. 3.15A).
Monocyte. Although produced in the BM these are not easily recognized, as they are difficult to distinguish from granulocytic precursors. Monocytes are medium sized cells with oval to kidney-shaped vesicular nuclei and abundant eosinophilic cytoplasm with no or variable granulation.10 Monocytes can be identified using IHC for CD68 (PGM1 clone, Fig. 3.15B) and CD14.11
Dendritic macrophage. These are large, fixed, stroma based macrophages. CD68 or CD163 highlight their large size and extensively dendritic nature.12 The dendritic processes of these cells insinuate between hemopoietic cells to form a meshwork which adds to the reticulin based support system (Fig. 3.15C). They have various functions, most revolving around phagocytosis of cellular debris (nuclei, cell membranes, granules, lipid) and iron storage. In cases where the macrophages are activated, CD68 highlights a more bubbly pattern of staining due to the increased number and size of cytoplasmic lysosomal vacuoles.
Iron-containing macrophage. These are responsible for iron storage and release to developing erythroblasts (Fig. 3.14). There are about 16 iron-containing macrophages per mm2 of BM.11 Iron is well demonstrated on H&E as golden brown hemosiderin pigment or on special stains as an olive green pigment (Giemsa) or blue colored reaction product (Perls stain). Iron within tissue reacts with decalcifying agents and biopsies which are decalcified using acids lose iron and are therefore unsuitable for exact quantitation of iron stores.13 An increased number of iron-laden macrophages is a common finding in post-therapy biopsies and in cases of unsuspected hemachromatosis.
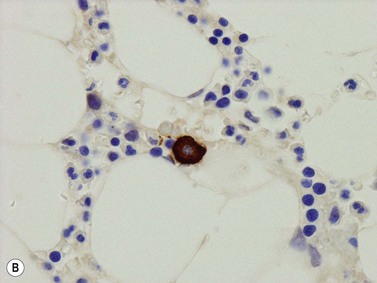
Plasmacytoid dendritic cell. These medium sized cells with vescicular nuclei are difficult to identify on conventional stains. They can be highlighted by CD123 which picks up a few cells in every intertrabecular space (Fig. 3.15D). CD123 is also co-expressed in a subset of granulopoietic precursors and basophils.
Mast cells
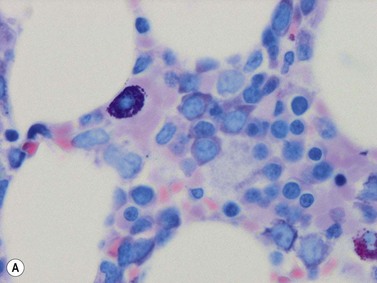
Mast cells are distributed throughout the BM; they lie adjacent to the endothelial cells of sinusoids, at the endosteal surface of the trabecular bone, in the periosteum, in the walls of small arteries, scattered in the BM, and frequently at the edges of and within lymphoid aggregates or nodules. Mast cells are round or oval cells characterized by medium sized oval to round hyperchromatic nuclei and moderate to abundant cytoplasm, which is densely packed with granules. The latter are eosinophilic on H&E staining, reddish – purple on Giemsa staining (Fig. 3.16A) and metachromatically purple on Toluidine blue staining. Mast cells can be identified using antibodies to mast cell tryptase and CD117 (Fig. 3.16B, C). Both of these stain normal mast cells in a granular cytoplasmic fashion. The granularity is better appreciated if the mast cell is partly degranulated. Within the periosteum or within zones of fibrosis, normal mast cells may be compressed into a spindle shape, thereby resembling neoplastic mast cells. The paucity of such cells and lack of CD25 and CD2 expression can be used to distinguish between benign and neoplastic cells (see Chapter 26).
Lymphocytes
Lymphoid cells are part of the normal BM population and may constitute 10–15% of the nucleated cells. This is slightly lower than what one sees in aspirates as there is contamination with peripheral blood in those samples. In newborns between 30% and 60% of the nucleated cells in the marrow may be lymphocytes; this figure reduces in adult life and increases again in the elderly, predominantly as a consequence of reduced hemopoiesis and appearance of reactive lymphoid nodules. In children, B-cells are numerous and most are CD10+ precursors. In adults, most marrow lymphocytes are T-cells with few B-lymphocytes present. The B-cell : T-cell ratio is approximately 1 : 4.14–16 Lymphocytes are rather inconspicuous on conventional stains and their number and distribution are only obvious on immunohistochemistry.
T-lymphocytes. The majority of BM lymphocytes are of T-cell origin (CD3 positive) (Fig. 3.17F). The ratio between CD4 (T-helper) and CD8 (cytotoxic) is variable. Normally CD4+ cells are mostly found in lymphoid aggregates and CD8+ cells are diffusely distributed in the BM. It should be noted that weak CD4 staining can also be seen in monocytes/macrophages and in some granulopoietic precursors. In reactive BM there is often a predominance of cytotoxic CD8+ T-cells and very few CD4+ T-cells. Other T-cell markers (i.e. CD2, CD5, CD7) are positive on most BM T-cells. The cytotoxic molecules TIA-1, granzyme B and perforin may be expressed in a significant number of BM lymphocytes; they are negative on some CD8+ cells. CD25 stains very occasional lymphocytes within the intertrabecular space.
Lymphoid nodules. These are nodular aggregates of lymphocytes seen within the interstitium and are often termed as ‘nodular interstitial lymphoid aggregates’ (NILA). Their incidence increases with age, and it is estimated that biopsies from about 30–40% of elderly patients harbor these; especially females and those suffering from autoimmune conditions. All lymphoid nodules show an increased reticulin fiber content.17 Three types are recognized:
Plasma cells
Plasma cells account for about 2–4% of all BM nucleated cells and are found perivascularly, as single scattered cells, or as small groups of 2–3 cells within the interstitium (Fig. 3.18).18 Plasma cells have an eccentric nucleus with a coarse cart-wheel chromatin pattern, a perinuclear hof and mildly basophilic or amphophilic cytoplasm. Immunohistochemically, normal plasma cells express CD19 (membrane), CD79a (intense cytoplasmic), CD138 (membrane) and MUM-1 (strong nuclear positivity with a lighter cytoplasmic blush); they are CD20 and CD45 negative. Plasma cells express cytoplasmic immunoglobulin heavy chains in the following proportion: IgG > IgA > IgM > IgD. Kappa and lambda light chains are expressed in a 2–3 : 1 ratio.
Hemopoietic stem cells and early precursor cells
These are pluripotent hemopoietic cells which are capable of self-replication or generating more differentiated hemopoietic cells (see Chapter 2 for details). These are difficult to identify on standard morphology as they make up only <1–4% of cells and do not have distinctive features. They are medium sized cells with a high nuclear : cytoplasmic ratio and inconspicuous or small nucleoli. Stem cell markers include CD34, CD117, HLA-DR and TdT. Evaluation of the normal BM with these antibodies highlights variable numbers and types of cells.
CD34. This is the most useful marker for stem cells but also stains endothelial cells. Staining is granular and cytoplasmic and highlights medium sized, often ovoid cells scattered within the interstitium (Fig. 3.19A). Studies have shown that small numbers of these cells are found in normal and reactive marrows with an average of 1 cell for every 4–5 high power fields.19,20 In normal BM, CD34+ cells account for <1% of all nucleated cells. In children, CD34+ cells are more numerous due to the presence of CD34-positive B-cell precursors. Interestingly, the positive cells are located interstitially and are not associated with either erythroid colonies or early myeloid progenitors on the endosteal surface.
CD117. Expression is seen in stem cells, promyelocytes and early erythroid precursors. Staining is membranous and usually highlights large cells which morphologically equate to erythroblasts and promyelocytes (Fig. 3.19B). These usually account for 1–3% of nucleated bone marrow cells. CD117 also stains some plasma cells (membrane or cytoplasmic staining, especially in myeloma) and mast cells (granulated forms: dense cytoplasmic positivity; degranulated forms: weak granular cytoplasmic positivity to rare membranous positivity).
Lymphoblasts or immature lymphoid cells. Lymphoblasts, or hematogones, are identified in large numbers in marrows from infants and children (324/mm2) but the numbers reduce markedly in adult life (6/mm2). Biopsies following therapy or transplantation characteristically show larger numbers of these cells. They can be identified by their expression of TdT (nuclear stain)21 and in the adult marrow are seen as a few singly scattered interstitial cells without nodule formation. They also variably express CD34, CD38, CD79a, CD10 and PAX5 antigens but only small fractions are positive for CD20. Diagnostic difficulties arise while assessing post-therapy staging marrows from acute lymphoblastic leukemia patients. Nodule formation and an aberrant phenotype are useful indicators of relapsed disease.22
Reticulin
Hemopoietic cells are supported by a fine meshwork of reticulin fibers which act as scaffolding within the intertrabecular space. The fibers, which are produced by elongated fibroblasts, span the intertrabecular space and are tethered to the endosteal surface of the bone. They also form cuffs around blood vessels, provide the structural framework for sinusoids and frame adipocytes (Fig. 3.20). Reticulin fibers are best visualized by silver staining (Gömöri stain) and in sections of the normal marrow are seen as short, single, thin fibers which abruptly terminate without intersecting with other fibers (an artifact of section thickness) (Fig. 3.20). The amount of reticulin is graded semi-quantitatively; there is little reticulin in normal BM and the amount should be related to the total BM cellularity.
Collagen
In normal BM collagen is found around blood vessels and in the bone trabeculae. Masson’s trichrome stain (Fig. 3.21) and Martius scarlet blue do not reveal any collagen fibers within the interstitium (i.e. in between hemopoetic cells).
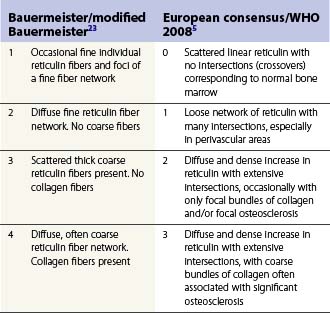
Reticulin and collagen grading
The reticulin and collagen fiber content of BM is graded semi-quantitatively. The reticulin content may be increased or is the defining feature of various disease processes. Several scoring systems have been devised of which two are commonly used (Table 3.3).5,23,24 There are several issues to be considered while evaluating reticulin fibers. Demonstration of cuffs of reticulin fibers around blood vessels and at the endosteal surface of bone where the fibers are easily visualized is evidence that the stain has worked appropriately. Only areas containing hemopoietic cells should be graded; fibers around blood vessels, framing adipocytes, and those in or around lymphoid nodules should not be evaluated. Assesment of whether stains for collagen have worked is best done by looking for arterial blood vessels which always have a peripheral cuff of collagen.
Blood vessels
The medullary arteries enter via the cortical bone and branch within the BM and the trabeculae. The smaller branches divide into arterioles, then into capillaries and into the sinusoids. The sinusoidal wall is thin consisting of a single layer of endothelial cells, an incomplete outer covering of adventitia and, when large, a very loose network of reticulin fibers (Fig. 3.22). The sinusoids are present throughout the BM and drain into the periosteal veins. The endothelial cells of post-capillary, or post-sinusoidal venules may be plump, with vesicular nuclei and distinct nucleoli. The endothelium forms the interface between the intra- and the extravascular compartments through which the blood cells enter the circulation, and the sinus endothelial cells possibly contribute to regulation of entry of mature cells into the circulation. In histologic sections, megakaryocytes can often be seen close to the sinusoids into which they discharge platelets. Sinusoids are often difficult to identify in histologic sections as they are collapsed. They are easily identified by the Gömöri stain which highlights the rim of reticulin fibers around the sinusoids. Immunohistochemically, endothelial cells express vascular markers, that is, CD34 and CD31. Blood vessels may supply additional information in diseases which affect them, especially amyloidosis.
Bone
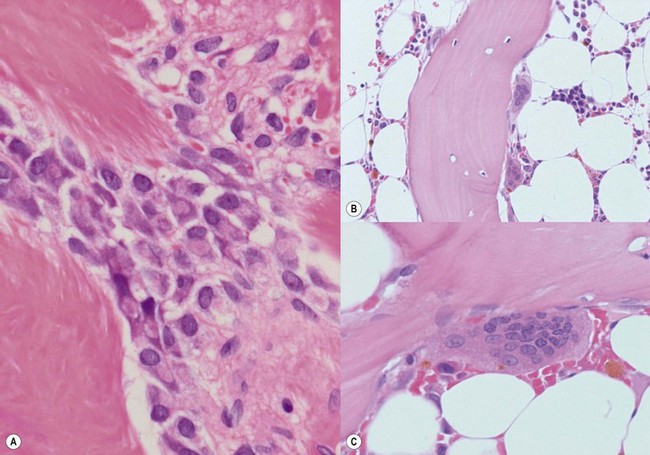
The bone is covered externally by a layer of dense collagenous tissue, the periosteum. This abuts a layer of cortical bone or cartilage (the latter is invariably seen in children and often in elderly patients). It is beyond the scope of this chapter to discuss the normal architecture of bone, but a few comments will be made about bone forming and resorbing cells. Trabeculae are composed of lamellar bone. Osteoblasts (Fig. 3.23A) produce new bone and are often seen lining the bone trabeculae when the latter are subject to stress. They are large cells with abundant eosinophilic cytoplasm, a prominent paranuclear hof and an eccentric vesicular nucleus and a prominent nucleolus. Osteoclasts (Fig. 3.23B, C) are very large multinucleated cells which resorb bone and are often seen in indentations of the trabeculae known as Howship lacunae. They have abundant cytoplasm and possess multiple small nuclei with nucleoli. The portion of the cytoplasm abutting bone is often ruffled and the bone surface is also ragged, thus illustrating the resorptive function of these cells. Osteocytes are present within bone and are seen within lacunae and have densely stained nuclei.
1 Parapia LA. Trepanning or trephines: a history of bone marrow biopsy. Br J Haematol. 2007;139:14-19.
2 Lee SH, Erber WN, Porwit A, et al. ICSH guidelines for the standardization of bone marrow specimens and reports. Int J Lab Hematol. 2008;30:349-364.
3 Torlakovic EE, Naresh K, Kremer M, et al. Call for a European programme in external quality assurance for bone marrow immunohistochemistry; report of a European Bone Marrow Working Group pilot study. J Clin Pathol. 2009;62:547-551.
4 Foucar K. Bone Marrow Pathology, 2nd ed. Chicago, USA: ASCP Press; 2001.
5 Thiele J, Kvasnicka HM, Facchetti F, et al. European consensus on grading bone marrow fibrosis and assessment of cellularity. Haematologica. 2005;90:1128-1132.
6 Chasis JA, Mohandas N. Erythroblastic islands: niches for erythropoiesis. Blood. 2008;112:470-478.
7 Agis H, Krauth MT, Mosberger I, et al. Enumeration and immunohistochemical characterisation of bone marrow basophils in myeloproliferative disorders using the basophil specific monoclonal antibody 2D7. J Clin Pathol. 2006;59:396-402.
8 Kaushansky K. Historical review: megakaryopoiesis and thrombopoiesis. Blood. 2008;111:981-986.
9 Deutsch VR, Tomer A. Megakaryocyte development and platelet production. Br J Haematol. 2006;134:453-466.
10 Dale DC, Boxer L, Liles WC. The phagocytes: neutrophils and monocytes. Blood. 2008;112:935-945.
11 Naresh KN. Morphological evaluation of monocytes and monocyte precursors in bone marrow trephine biopsies – need for establishing diagnostic criteria. Haematologica. 2009;94:1623-1624.
12 Thiele J, Braeckel C, Wagner S, et al. Macrophages in normal human bone marrow and in chronic myeloproliferative disorders: an immunohistochemical and morphometric study by a new monoclonal antibody (PG-M1) on trephine biopsies. Virchows Arch A Pathol Anat Histopathol. 1992;421:33-39.
13 Stuart-Smith SE, Hughes DA, Bain BJ. Are routine iron stains on bone marrow trephine biopsy specimens necessary? J Clin Pathol. 2005;58:269-272.
14 Horny HP, Engst U, Walz RS, Kaiserling E. In situ immunophenotyping of lymphocytes in human bone marrow: an immunohistochemical study. Br J Haematol. 1989;71:313-321.
15 Horny HP, Wehrmann M, Griesser H, et al. Investigation of bone marrow lymphocyte subsets in normal, reactive, and neoplastic states using paraffin-embedded biopsy specimens. Am J Clin Pathol. 1993;99:142-149.
16 Thaler J, Greil R, Dietze O, Huber H. Immunohistology for quantification of normal bone marrow lymphocyte subsets. Br J Haematol. 1989;73:576-577.
17 Thiele J, Zirbes TK, Kvasnicka HM, Fischer R. Focal lymphoid aggregates (nodules) in bone marrow biopsies: differentiation between benign hyperplasia and malignant lymphoma – a practical guideline. J Clin Pathol. 1999;52:294-300.
18 Kass L, Kapadia IH. Perivascular plasmacytosis: a light-microscopic and immunohistochemical study of 93 bone marrow biopsies. Acta Haematol. 2001;105:57-63.
19 Soligo D, Delia D, Oriani A, et al. Identification of CD34+ cells in normal and pathological bone marrow biopsies by QBEND10 monoclonal antibody. Leukemia. 1991;5:1026-1030.
20 Horny HP, Wehrmann M, Schlicker HU, et al. QBEND10 for the diagnosis of myelodysplastic syndromes in routinely processed bone marrow biopsy specimens. J Clin Pathol. 1995;48:291-294.
21 Wolf E, Harms H, Winkler J, et al. Terminal deoxynucleotidyl transferase-positive cells in trephine biopsies following bone marrow or peripheral stem cell transplantation reflect vigorous B-cell generation. Histopathology. 2005;46:442-450.
22 Rimsza LM, Larson RS, Winter SS, et al. Benign hematogone-rich lymphoid proliferations can be distinguished from B-lineage acute lymphoblastic leukemia by integration of morphology, immunophenotype, adhesion molecule expression, and architectural features. Am J Clin Pathol. 2000;114:66-75.
23 Bauermeister DE. Quantitation of bone marrow reticulin – a normal range. Am J Clin Pathol. 1971;56:24-31.
24 Kuter DJ, Bain B, Mufti G, et al. Bone marrow fibrosis: pathophysiology and clinical significance of increased bone marrow stromal fibres. Br J Haematol. 2007;139:351-362.
25 Krenacs T, Bagdi E, Stelkovics E, et al. How we process trephine biopsy specimens: epoxy resin embedded bone marrow biopsies. J Clin Pathol. 2005;58:897-903.
26 Wickham CL, Sarsfield P, Joyner MV, et al. Formic acid decalcification of bone marrow trephines degrades DNA: alternative use of EDTA allows the amplification and sequencing of relatively long PCR products. Mol Pathol. 2000;53:336.
27 Naresh KN, Lampert I, Hasserjian R, et al. Optimal processing of bone marrow trephine biopsy: the Hammersmith Protocol. J Clin Pathol. 2006;59:903-911.
[/level-membership-for-pathology-category][not-level-membership-for-pathology-category]
CHAPTER 3 Normal bone marrow histology
Normal bone marrow – generalities and function
The term ‘bone marrow’ (BM) refers to the tissue occupying the cavities under the cortex within the honeycomb of trabecular bone. Normal marrow is either red, consisting of the hematopoietic tissue, or yellow, composed mainly of fat cells (adipose tissue). In children most bones contain hematopoietic marrow, almost to the exclusion of fat cells. In the adult, red marrow is found in the skull, sternum, scapulae, vertebrae, ribs, pelvic bones and the proximal ends of the long bones (e.g. femora and humeri). The hematopoietic marrow produces the mature blood cells, which have a finite life span and must be constantly replaced (see Chapter 2). The weight of the total BM is 1600–3700 g. The BM is composed of:
Bone marrow trephine biopsy
The process of obtaining a bone marrow trephine biopsy (BMTB) originates in the ancient procedure of trepanning.1 Prior to the advent of BMTB needles, clot preparations of aspirated marrow were prepared for diagnostic purposes. BM biopsies were obtained only as a means of diagnosis if marrow was inaspirable, a ‘dry tap’. The modification of needles by Jamshidi in the 1970s revolutionized the process of obtaining intact cores of bone and bone marrow for examination, primarily from the pelvis. The most common site biopsed is the posterior superior iliac crest. Other sites which can be biopsied include the anterior superior iliac crest, tibia, and vertebrae. Biopsy of the sternum is contraindicated due to the significant morbidity and mortality associated with this practice. The optimal length of a BMTB is 2–3 cm; shorter biopsies may not be representative and may not detect diseases that have a focal or patchy pattern of BM involvement.2
Processing and stains
A number of methods are available for fixation, decalcification and embedding of the BMTB2 (Table 3.1). For optimal evaluation, sections are cut at a thickness of 1–3 µm. Conventional stains are hematoxylin and eosin (H&E) (Fig. 3.1A) and Giemsa (Fig. 3.1B) stains. Giemsa staining generally gives better discrimination of cell types based on cytoplasmic staining characteristics, that is:
Fig. 3.1 (A, B) Normal bone marrow biopsy showing normal marrow cellularity and architecture. (A) Hematoxylin & Eosin stain. × 200. (B) Giemsa stain. × 400.
Other stains commonly used include the Perls stain for iron, silver stains for reticulin and Masson’s trichrome stain or Martius scarlet blue stain for collagen. Immunohistochemistry (IHC) using monoclonal or polyclonal antibodies, and in situ hybridization using nucleic acid probes can be used to identify specific cell types and genetic aberrations; these are discussed in sections below.3
Marrow cellularity
The BMTB is particularly useful for the assessment of marrow cellularity. This is the relative amount of BM cells to adipocytes, which is assessed subjectively and should be interpreted in the context of the age of the patient. The terms normocellular (normal for age), hypercellular (increased cellularity for age) and hypocellular (reduced cellularity for age) are used. Cellularity reduces with increasing age (Table 3.2).4,5 In practice, the formula (cellularity = 100 − patient age) can be applied for adults; however, it does not correlate with cellularity at the extremes of the age range. The intertrabecular spaces adjacent to the marrow cortex tend to be hypocellular and should not be assessed when determining overall BM cellularity.
| Age | Cellularity |
|---|---|
| Newborn to 3 months | 80–100% |
| Childhood | 60–80% |
| 20–40 years | 60–70% |
| 40–70 years | 40–50% |
| >70 years | 30–40% |
Marrow architecture
The BMTB enables the assessment of bone marrow architecture, the distribution of cellular elements and the bone and stromal cells. The outermost elements of the biopsy are composed of collagenous periosteal connective tissue, followed by a zone of cartilage or cortical bone (depending on the age of the patient). After this the bone breaks up into a meshwork of trabeculae, between which are the intertrabecular spaces. Hemopoietic cells are present within these intertrabecular spaces and are supported by fat cells, stromal cells, histiocytes extracellular matrix and blood vessels (Fig. 3.2). The hemopoietic cells are located within the intertrabecular spaces. The intertrabecular areas can be divided into three zones which contain different hemopoietic cell types (Fig. 3.3):
Hemopoiesis
The process of formation of blood elements from hemopoietic stem cells has been described in detail in Chapter 2. The BMTB enables the visualization of the spatial localization of the individual cell lineages during their development. Hemopoietic progenitors are present in cords, islands or clusters. Fully mature erythroid and granulocytic cells and platelets migrate through the sinusoidal endothelial cells to enter the bloodstream.
Erythropoiesis
Erythroid progenitors are found in small and large ‘islands’ called erythroid colonies within the intermediate and central zones of the marrow cavity. Erythroid islands are made up of concentric circles of immature erythroblasts (proerythroblasts) and a spectrum of maturing erythroid precursors leading to the late erythroblasts. Each erythroid island has a central iron-containing macrophage. The most primitive erythroid progenitor cells are present centrally around the macrophage and the maturing forms towards the periphery6 (Fig. 3.4). The central macrophage possesses dendritic processes, which extend between the maturing erythroid precursors. Its function is to support and nurture the erythroblasts, act as a source of iron and remove debris from dying cells and extruded nuclei. The central macrophage is often difficult to identify in histologic sections. Erythroid precursors are easily identified by being in distinct islands with cells of varying maturity, their almost perfectly round nuclei and by a perinuclear halo, an artifact of fixation and processing.
Fig. 3.4 (A, B) Erythropoiesis: organization of the erythroid colony and stages of erythroid maturation.
((A) Modified from Erythroblastic islands: niches for erythropoiesis. Blood 2008; 112: 470; (B) http://www.healthsystem.virginia.edu/internet/haematology/hessimages/erythropoiesis.jpg.)
Proerythroblast. The earliest recognizable erythroid precursors (proerythroblasts) are medium to large round cells with minimal cytoplasm, large round nuclei with dispersed or open chromatin, many small nucleoli and a crisp nuclear membrane. A rim of weakly basophilic cytoplasm with a halo is also present (Fig. 3.5A).
Maturing erythroblast (also called normoblast). These are smaller than proerythroblasts, and differ in their nuclear and cytoplasmic characteristics. As a rule, with maturation, nuclear size reduces and the amount of cytoplasm increases. The nuclear chromatin becomes more condensed and acquires a uniform, condensed, hyperchromatic ‘ink dot’ appearance. It is this nuclear characteristic that enables late normoblasts to be distinguished from lymphocytes. As hemoglobin forms, the cells acquire rims of pale pink cytoplasm (orthochromatic erythroblast) which with further maturation acquires the crisp orangiophilia of mature RBCs (Fig. 3.5B).
Erythroid cells can be identified by IHC using antibodies to glycophorin A (CD235) or C and intracellular hemoglobin. Glycophorin A highlights both nucleated erythroid precursors and RBCs (Fig. 3.6) while hemoglobin A tends to be restricted to hemoglobinized nucleated erythroid precursors. In situ hybridization can also be performed using probes for hemoglobin A.
Granulopoiesis
The granulocytic series consists of neutrophils, eosinophils, basophils and mast cells. All the morphologic stages of myeloid maturation as seen in the BM aspirate can be identified on trephine sections. Most immature granulocytic cells (myeloblasts and promyelocytes) are arranged along the endosteal surface (paratrabecular zone) (Fig. 3.7A, B) or as periarteriolar cuffs (Fig. 3.7C, D); these constitute the granulocytic ‘generation zones’; however, precursors are also scattered throughout the rest of the marrow as is often seen on myeloperoxidase (MPO) staining (Fig. 3.7E, F). Maturing granulocytic cells occur in the intermediate and central intertrabecular zones.
Myeloblast. This is the earliest recognizable granulocytic cell in the BMTB. It is a medium sized cell with a centrally placed round-ovoid nucleus, with very open, pale-staining chromatin which contains one or more fine eosinophilic nucleoli. A small amount of cytoplasm is often present; granules are difficult to identify (Fig. 3.8A).
