[level-membership-for-pathology-category]
CHAPTER 20 Myelodysplastic syndromes
The first report of a patient with myelodysplastic syndrome (MDS) dates from 1900, when Leube described a patient with severe megaloblastic anemia preceding development of overt leukemia.1 This description was followed by several reports of patients characterized by cytopenia, disturbed maturation of bone marrow (BM) precursors, an increase of blasts and a significant risk of evolving to acute myeloid leukemia (AML).1 The first international classification of MDS was developed by the French-American-British (FAB) Group2 (Table 20.1) and extended by the World Health Organization (WHO) 2001 and WHO 2008 (Table 20.2) classifications.3–5 The diagnosis of MDS is an effort that requires clinical, cytogenetic and pathological expertise, and often also repeated BM studies.
Table 20.1 French-American-British (FAB) group classification of myelodysplastic syndromes2
| Type | Peripheral blood | Bone marrow |
|---|---|---|
| RA | <1% blasts | Dyshemopoiesis in one, two or all three lineages; <5% blasts |
| RARS | <1% blasts | As RA with ring sideroblasts (RS) comprising >15% erythroblasts |
| RAEB | <20% blasts | As RA with 5–20% blasts in BM, +/− RS |
| RAEBt | >30% blasts | As RA with 20–30%* blasts in BM or as RAEB with Auer rods |
| CMML | As any of the above plus >1 × 10⁹/l monocytes/promonocytes in blood | |
RA, refractory anemia; RARS, RA with ring sideroblasts; RAEB, RA with excess of blasts; RAEBt, RAEB in transformation; CMML, chronic myelomonocytic leukemia.
Variants that do not fit well into this classification include hypoplastic MDS, fibrotic MDS and juvenile myelomonocytic leukemia.
* Cases with >30% blasts were classified as acute leukemia.
Table 20.2 WHO 2008 classification of myelodysplastic syndromes4
| Disease | Blood findings | Bone marrow findings |
|---|---|---|
| Refractory cytopenia with unilineage dysplasia (RCUD): | Unicytopenia or bicytopenia1 | Unilineage dysplasia: ≥10% of the cells in one myeloid lineage |
| [Refractory anemia (RA); refractory neutropenia (RN); | No or rare blasts (<1%)2 | <5% blasts |
| Refractory thrombocytopenia (RT)] | <15% of erythroid precursors are ring sideroblasts | |
| Refractory anemia with ring sideroblasts (RARS) | ||
| Refractory cytopenia with multilineage dysplasia (RCMD) | ||
| Refractory anemia with excess blasts-1 (RAEB-1) | ||
| Refractory anemia with excess blasts-2 (RAEB-2) | ||
| Myelodysplastic syndrome – unclassified (MDS-U) | ||
| MDS associated with isolated del(5q) |
Although the finding of 5–19% blasts in the blood is, in itself, diagnostic of RAEB-2, cases of RAEB-2 may have less than 5% blasts in the blood if they have Auer rods and/or 10–19% blasts in the marrow. Similarly, cases of RAEB-2 may have less than 10% blasts in the marrow but may be diagnosed by the other two findings, Auer rod+ and/or 5–19% blasts in the blood.
1 Bicytopenia may occasionally be observed. Cases with pancytopenia should be classified as MDS-U.
2 If the marrow myeloblast percentage is less than 5% but there are 2–4% myeloblasts in the blood, the diagnostic classification is RAEB 1. Cases of RCUD and RCMD with 1% myeloblasts in the blood should be classified as MDS-U.
3 Cases with Auer rods and <5% myeloblasts in the blood and <10% in the marrow should be classified as RAEB-2.
Definition
According to the WHO 2008 classification, MDS may be defined as a group of clonal hematopoeitic stem cell disorders characterized by cytopenia(s), dysplasia in one or more of the major myeloid cell lines, ineffective hematopoiesis and increased risk of AML development.5 The BM is usually hypercellular. Myelodysplasia, i.e. abnormal maturation in hematopoiesis, is a hallmark of MDS (Table 20.3). However, myelodysplasia is not definitive evidence of MDS and may be present as a result of various nutritional, toxic, infectious and other factors (Table 20.4). Moreover, a presumptive diagnosis of MDS may be made in a patient with unexplained cytopenia(s) in the absence of overt myelodysplasia if certain defining cytogenetic abnormalities are present (Table 20.5).
Table 20.3 Morphologic signs of dysplasia in blood and bone marrow cells in MDS
| Lineage | Blood | Bone marrow |
|---|---|---|
| Erythropoiesis | Macrocytes Aniso-poikilocytosis Dimorphic picture Polychromasia Punctate basophilia Normoblasts Reticulocytopenia |
Erythroid hypercellularity Multinuclearity Dyskaryorrhexis Megaloblasts Cytoplasmic vacuoles Howell–Jolly bodies Ring sideroblasts |
| Granulopoiesis | Hypogranular neutrophils Unilobed or bilobed neutrophils (Pelger cells) Hypersegmented neutrophils Monocytosis (often with multiple, elongated nuclear lobes) Promonocytes (with fine azurophil granules) Degranulated eosinophils |
Hypogranularity of myeloid precursors Increased promonocytes Increased blast cells (type I with scanty agranular cytoplasm and type II with sparse granules) |
| Thrombopoiesis | Agranular platelets | Micromegakaryocytes |
| Giant platelets | Large megakaryocytes with single round or oval nucleus | |
| Megakaryocyte fragments | Large megakaryocytes with multiple small round nuclei Megakaryoblasts |
Table 20.4 Non-clonal causes of dysplasia
| Dyserythropoiesis |
Epidemiology
American studies report the median age of MDS patients at diagnosis as 76 years.6 In Asian countries the median age at diagnosis is 10 years lower.7 The incidence is higher in men than in women (4.5 vs 2.7 cases/100 000 population/year, respectively). Incidence increases with age with 86% of MDS patients being older than 60 years of age. A prevalence of 1 in 500 in the population over 60 years of age has been suggested.8 In patients over 85 years, MDS represents about a quarter of all hematologic malignancies. Although studies point towards an increasing incidence, this may at least in part reflect a greater willingness to perform BM investigations in the elderly and increased reporting.9
Etiology of primary MDS is still poorly understood. Certain genetic disorders and exposure to pesticides, organic solvents or ionizing radiation have been implicated as risk factors.10,11 A large prospective study indicated obesity and smoking as modifiable, although weak, risk factors, while intake of alcohol, meat, fruit and vegetables, and physical activity did not influence the risk of MDS.12 Secondary MDS, which tends to occur in younger people, develops after exposure to certain chemicals and cytotoxic drugs, especially alkylating agents.13,14 The younger age at presentation of idiopathic MDS in developing countries suggests a less rigorous control of noxious chemicals in these communities.15 Childhood MDS is very rare (1.8 cases/1 000 000 population/year).16 Familial MDS is also very rare and occurs at a younger age.17
Classification
The ‘minimal’ morphologic criteria for MDS diagnosis according to WHO classification is the presence of at least 10% dysplastic forms in at least one hematopoietic lineage (erythroid, granulocytic or megakaryocytic), in an appropriate clinical setting.4 The FAB classification (Table 20.1) applied the arbitrary limit of 30% blasts for diagnosis of AML, while this limit has been changed to 20% in the WHO classification abolishing the former category of RAEBt. There is still ongoing debate as to how patients with a blast count between 20% and 30% should be classified.4 Of note, patients with specific translocations such as t(8;21), inv.16 and t(15;17) are classified as AML even if numbers of blasts are below 20%. This rule does not apply to cases of AML with t(9;11)(p22;q23), t(6;9)(p23;q34), inv.3(3)(q21q26.2), t(3;3)(q21;q26.2) and t(1;22)p(13;q13) that are considered as MDS if the number of blasts does not reach 20% within 2 months’ follow-up time. Some AML cases may be recognized as myelodysplasia-related, which should be stated in the report (see Chapter 18). Some of these cases would have been previously diagnosed as RAEB in transformation (RAEBt) and some would have been called AML. It is probable that a large proportion of AML cases in the elderly will fall into AML myelodysplasia-related category.
The 2001 WHO classification took into consideration the extent of dysplasia (unilineage vs multilineage), which has been proven to be of prognostic significance.18,19 WHO 2008 (Table 20.2) extended the definition of cases with unilineage dysplasia, adding two other categories to refractory anemia (RA): refractory neutropenia (RN) and refractory thrombocytopenia (RT). In WHO 2008, the presence of ring sideroblasts is only of significance in the context of unilineage erythroid dysplasia (RA vs RA with ring sideroblasts, RA-RS). Patients with multilineage dysplasia and less than 5% blasts are diagnosed as refractory cytopenia with multilineage dysplasia (RCMD) independent of the presence of sideroblasts. Refractory anemia with excess of blasts (RAEB) is separated into RAEB I with 5–9% blast cells and RAEB II with 10–19% blast cells in BM smears. WHO 2008 has also stressed the significance of the presence of blasts in peripheral blood (PB), since patients with 2–4% PB blasts and <5% BM blasts are now categorized as RAEB-1.4 It is important to note that most of these qualitative and quantitative parameters have been derived from blood and aspirated BM appearances. Correlation with their assessment by BM trephine biopsy (BMTB) histology has only a limited evidence base.
The revised WHO classification of 2008 has also recognized differences between MDS in adults and in children. The latter usually present with leukopenia and/or thrombocytopenia and less often with anemia. A provisional entity ‘refractory cytopenia of childhood’ (RCC) has been introduced, which includes childhood presentations with multilineage dysplasia, <2% blasts in PB, <5% blasts in BM and persistent cytopenia. Childhood MDS patients who have increased numbers of blasts should be classified in the same way as adults.4,5
Diagnosis
Symptoms of anemia (tiredness, breathlessness and lassitude), thrombocytopenia (bruising or bleeding), or neutropenia (recurrent infections, mouth ulcers) are most common. A large fraction of patients with MDS are asymptomatic and may be diagnosed incidentally when a blood test, performed for an unrelated reason, shows macrocytic anemia. Extramedullary involvement (such as lymphadenopathy and/or splenomegaly) is relatively rare and possibility of MDS/MPN should be first excluded in these patients. Approximately 10% of patients display autoimmune symptoms such as vasculitis, arthritis, polyneuropathy and connective tissue disease-like presentations. The tumor suppressor gene interferon regulatory factor-1 (IRF-1) has been implicated in the pathophysiology of MDS-associated autoimmune deregulation.20
A full blood count may reveal anemia, neutropenia, thrombocytopenia or multiple cytopenias. The recommended level for defining anemia is hemoglobin <10 g/l. Neutropenia is defined by absolute neutrophil count <1.8 × 10⁹/l and thrombocytopenia by platelet count <100 × 109/l. A raised mean cell volume (MCV) is frequently found and may be the only abnormality in the blood count. However, anemia may also be normocytic or microcytic. There is almost always reticulocytopenia. In patients with bone marrow fibrosis, a leukoerythroblastic picture may be found. In cases with del(5q), there may be a slightly elevated platelet count. Other tests are usually normal, but in some patients increased levels of lactate dehydrogenase (LDH) may be present, as a result of increased cell death in BM. High LDH levels carry a poor prognosis. Serum B12 levels are usually high, but coincident pernicious anemia has also been reported.21 A positive direct antiglobulin test, with signs of hemolysis, is found in 8% of patients.22 Both leukocyte and platelet function tests may be impaired,23,24 as well as the growth of BM progenitor cells in short-term and long-term cultures.25 Recent studies stress decreased numbers of early multilineage precursors and erythroid progenitors as characteristics of MDS.26
Diagnosis of MDS depends on BM examination and cytogenetics. However, some patients with persistent mild cytopenia and/or mild dysplasia do not fulfill minimal criteria for MDS and should be followed. For these patients, the terms idiopathic cytopenia of undetermined significance (ICUS) or idiopathic dysplasia of undetermined significance (IDUS) may be applied;27 some of these patients will, with time, develop MDS.
Blood film examination
Blood films should be prepared fresh since blood samples exposed to anticoagulants are unsatisfactory for accurate morphology. The ability to diagnose MDS depends crucially on optimal staining of PB and BM films. Staining varies enormously between laboratories, so observers should become familiar with their own laboratory’s stains. Films sent for a second opinion should be sent unstained. Blood films are most commonly stained using the May–Grünewald–Giemsa or Wright method.28 It is important that the stain used picks up granularity in neutrophils well and also reveals basophilic stippling in red cells.
Erythrocytes
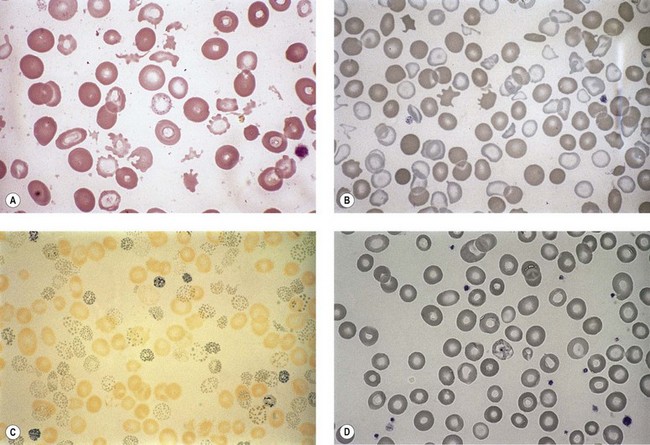
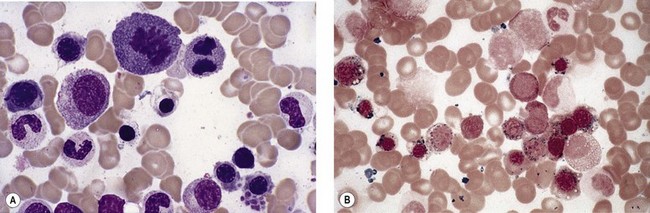
Anemia is the most common feature of MDS but it is not an obligatory finding. Usually the red cells are large, but they may be of normal size and occasionally are small. Many textbooks list sideroblastic anemia among the causes of a low MCV but this may be misleading, since it only applies to the rare hereditary form. The MDS category of refractory anemia with ring sideroblasts (RA-RS) is associated with a raised or normal MCV. Frequently, red cells in MDS vary in size and shape (aniso-/poikilocytosis). Oval macrocytes are common. When these are accompanied by small hypochromic cells, giving a dimorphic picture, RA-RS should be suspected (Fig. 20.1A). However, small hypochromic red cell fragments may be seen in all forms of MDS. A preponderance of small hypochromic red cells is rarely seen and should suggest acquired hemoglobin H (HbH) disease (Fig. 20.1B). This is a very rare finding in MDS and may be revealed with supravital staining (Fig. 20.1C).29 Poikilocytosis refers to several types of shape changes: dacrocytes (tear-drop shaped cells), acanthocytes (spur-spike cells), and cell fragments are all frequently seen. MDS is a rare cause of elliptocytosis (small, oval erythrocytes). However, red cell size and shape may be normal. Howell–Jolly bodies are occasionally seen but rather more common is basophilic stippling, which may be fine or coarse (Fig. 20.1D). Fine basophilic stippling confined to large, misshapen, hypochromic cells usually indicates RA-RS.
Leukocytes
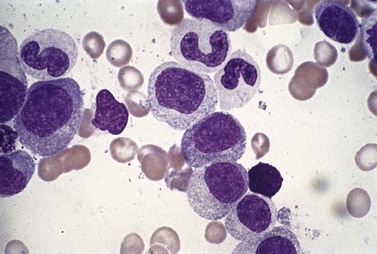
Neutropenia is very common in MDS. Although it may already be severe at diagnosis, it is frequently mild or may develop later in the course of the disease. Abnormalities in granularity of neutrophils are important features. Classically, there are few if any neutrophil granules (Fig. 20.2A) but sometimes hypergranularity is seen (Fig. 20.2B). The leukocyte alkaline phosphatase (LAP) score may be low.30 Rarely, giant granules typical of those seen in Chediak–Higashi syndrome have been identified. Auer rods are sometimes seen and, when present, should lead to classification of the disease as RAEB-2, due to their reported negative prognostic significance.31 Accurate enumeration of blast cells in blood has been stressed in WHO 2008. Cases with 2–4% blast cells in blood are classified as RAEB-1, even if the fraction in BM smears is <5%.4 Cases with 1% blast cells in blood and <5% in BM are MDS-unclassified.
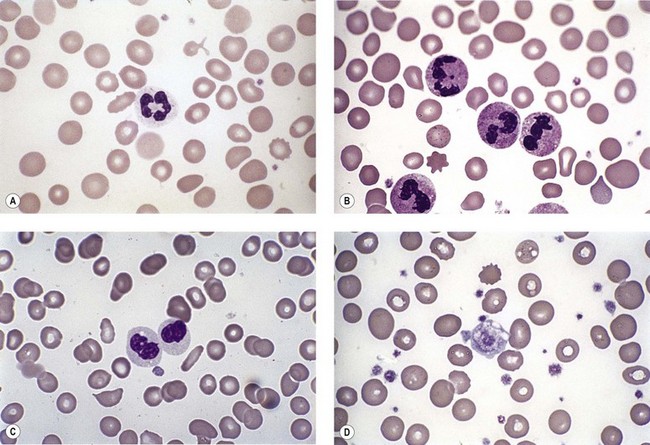
Abnormal neutrophil nuclear lobation is the other feature to observe. Pseudo-Pelger cells are neutrophils with unilobated or bilobed nuclei with normal condensation of the nuclear chromatin (Fig. 20.2C). It is important to distinguish these cells from myelocytes and metamyelocytes, in which the chromatin remains relatively uncondensed. Frequently, pseudo-Pelger cells display hypogranular cytoplasm and, occasionally, neutrophils with hyperlobated nuclei are seen. An unusual feature is arachnoid lobation, with the nuclear lobes looking like the segments of a spider’s leg.
A relative increase of monocytes can be seen in MDS due to neutropenia while chronic myelomonocytic leukemia (currently classified by the WHO as a myelodysplastic/myeloproliferative neoplasm, see Chapter 27) is a differential diagnosis in patients with a total monocytosis >1 × 10⁹/l. Degranulated eosinophils are sometimes a feature of MDS. Eosinophils with basophilic granules, or vice versa, are sometimes seen. Significant eosinophilia and/or basophilia is seen in approximately 12% of MDS patients and predicts poorer prognosis.32
Platelets
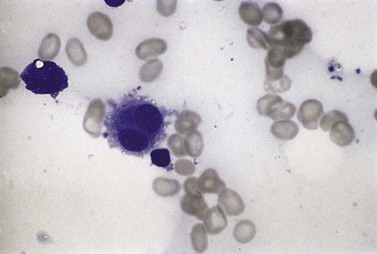
Thrombocytopenia is common. Giant platelets or megakaryocyte fragments may circulate in MDS (Fig. 20.2D) and agranular platelets may also be seen.
Thrombocytosis is rare, but occurs in MDS with del(5q). It is important to distinguish myeloproliferative thrombocythemia from the thrombocytosis of MDS. The former should not have dysplastic features, although anemia with ring sideroblasts has been described accompanying marked thrombocytosis, histological BM features resembling essential thrombocythemia and (in most cases) presence of JAK2V617F mutation (see Chapter 27).
Bone marrow examination
Bone marrow aspirate
Erythropoiesis
All of the features seen in PB may be present but the BM aspirate gives the opportunity of examining the whole sequence of erythropoiesis. In many cases there is erythroid hyperplasia. Pure red cell aplasia is a rare finding. Frequently, the red cell precursors appear megaloblastic. Multinucleated forms are common and megaloblastic anemia is one of the main differential diagnoses. Mitotic figures are common and there is frequently dyskaryorrhexis (literally, abnormal bursting of a cell nucleus). Pyknosis, nuclear budding and intranuclear bridging are also seen frequently. There is often asynchrony between the maturation of nucleus and cytoplasm, with fully hemoglobinized cells retaining uncondensed nuclear chromatin (Fig. 20.3A).
Sideroblasts are red cell precursors with an accumulation of iron in their mitochondria, which stains blue with Perls stain (‘Prussian blue’) and appears granular. To be termed ring sideroblasts, the abnormal cells should have at least five siderotic granules in a perinuclear distribution. These granules may surround the entire nucleus, be localized to portions of the perinuclear area or cover at least one-third of the nucleus.33 Over half of MDS cases have some sideroblasts. Arbitrarily, when ring sideroblasts comprise >15% of the total erythroblast population the disease is designated with ring sideroblasts, (+RS) (Fig. 20.3B).
Granulopoiesis
All of the features seen in peripheral blood may be present in BM smears. Absence of secondary granules may be a feature of all myeloid precursor cells (Fig. 20.4) but primary azurophil granules are usually present in promyelocytes and some myeloblasts. Of interest, it is very unusual for the myeloid cells in MDS not to stain with myeloperoxidase, albeit the staining may be less dense than in controls.
An accurate blast cell count is important prognostically. The FAB group recognized two types of blast cells. Type I blast cells are myeloblasts of variable size, without granules or Auer rods. The nuclear chromatin is uncondensed and there are usually one or two nucleoli. A type II blast cell is usually larger, with rather more cytoplasm, and contains a few azurophil granules. Type II blast cells can be distinguished from promyelocytes, which have a slightly eccentric nucleus with more condensed chromatin and less distinct nucleoli, and have also an obvious Golgi zone. Abnormal promyelocytes may also have excessive granules (more than six) resembling those seen in acute promyelocytic leukemia, although without the bilobed or monocytoid nuclear features of the latter. Goasguen and colleagues34 later described a type III blast cell with more than 20 azurophil granules but without a visible Golgi zone.
The International Working Group on Morphology of Myelodysplastic Syndrome (IWGM-MDS) agreed on a set of recommendations, including those for the definition and enumeration of blast cells.33 It has been recommended that agranular or granular blast cells are recognized (replacing the previous type I, II and III blasts) and dysplastic promyelocytes are distinguished from cytologically normal promyelocytes and from granular blast cells. It has been stressed that sufficient cells must be counted (at least 500), to give a precise blast cell percentage, particularly at thresholds that are important for diagnosis or prognosis.33
Thrombopoiesis
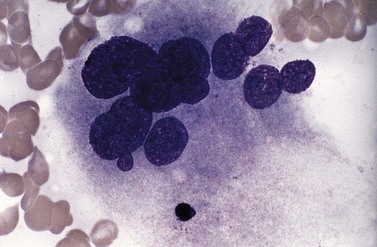
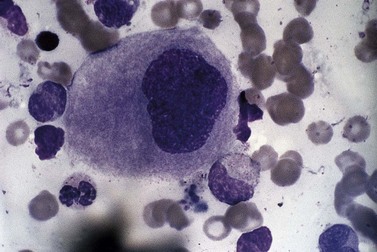
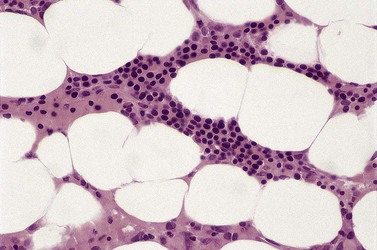
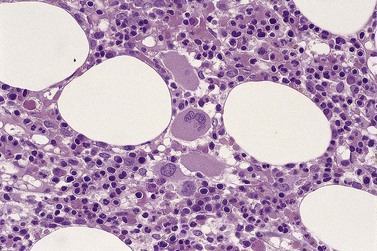
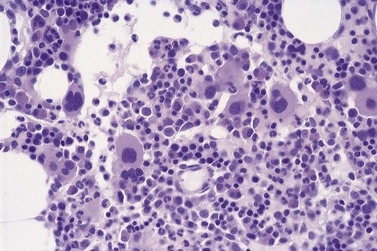
Usually, numbers of megakaryocytes in MDS correspond to bone marrow cellularity. However, megakaryocytes may also be numerous (often in association with altered histotopography and/or fibrosis) or, less often, decreased in numbers. There are characteristically three types of abnormal megakaryocytes: micromegakaryocytes (Fig. 20.5), giant megakaryocytes with multiple dispersed nuclei (Fig. 20.6), and moderate-sized megakaryocytes with a single round eccentric nucleus (monolobated megakaryocytes, Fig. 20.7). The latter are characteristic of the MDS with del(5q), but are not specific for this entity.
Bone marrow trephine
General histologic features of myelodysplastic syndromes
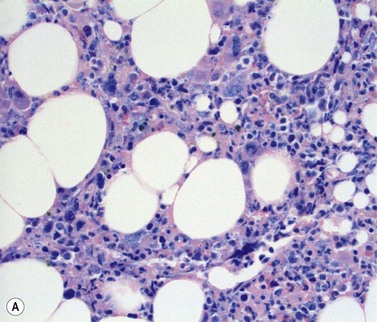
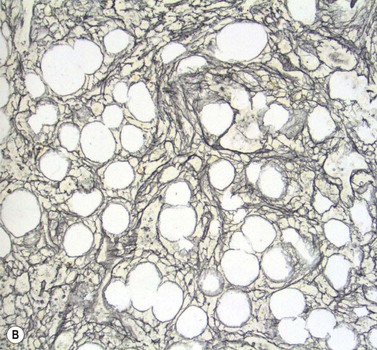
Stromal components of the BM usually appear relatively normal in MDS although there may be a slight increase in reticulin. Disturbances of trabecular bone remodeling, including new bone formation, are rare. Moderate to severe increases in reticulin, sometimes including collagen formation, is seen in approximately 10–20% of MDS cases and referred to as MDS with fibrosis35 (Fig. 20.8A, B). Fibrosis may cause difficulties in obtaining representative blast counts from aspirate films and in classification of MDS. It has been shown that patients who have MDS with fibrosis have a worse prognosis than those without.36 Also, development of fibrosis is regarded as a sign of progress. Fibrosis is often accompanied by increased vascularity.
Assessment of spatial distribution of hemopoiesis in MDS
As mentioned above, BMTB sections have the particular value in MDS, allowing assessment of the spatial distribution of hemopoietic cells. In normal BM, there is a specific topographic distribution of hematopoiesis (described in detail in Chapter 3). Both in primary MDS and in secondary forms of myelodysplasia, this topographic arrangement is disturbed. Displacement of early granulocyte precursors from trabecular margins is a frequent finding and, accompanying this, scattered metamyelocytes and neutrophil polymorphs may be found immediately adjacent to trabecular margins. The presence of myeloblasts and promyelocytes in groups in the central parts of intertrabecular spaces is less common. Such abnormal localization of immature precursors (ALIP) (Fig. 20.9), which may be reflected by the presence of aggregates (3–5 cells) and/or clusters (>5 cells),37 is usually seen in the context of an increased blood or BM blast cell count. In cases of MDS with fibrosis, the presence of ALIP will draw attention to increased numbers of blast cells.38 It should also be noted that ALIP is not a phenomenon specific to MDS. It can be seen in reactive conditions and myeloproliferative neoplasms, and after treatment with G-CSF. Clusters of other hematopoietic cells may mimic ALIP (e.g. erythropoiesis in B12/folate deficiency, monocytes in chronic myelomonocytic leukemia, large lymphoid cells in lymphoma infiltrates). Immunohistochemical (IHC) stains may be necessary for definite diagnosis.38
Spatial disorganization of erythropoiesis is represented by erythroid cell clusters occupying paratrabecular areas of the marrow and also by loss of the normal organization within individual clusters. The clusters are frequently enlarged, with increased numbers of proerythroblasts and early normoblasts. The cells in some clusters may appear synchronous, rather than reflecting a normal spectrum of maturational stages of erythropoiesis (Fig. 20.10). Neighboring clusters may differ markedly from one another, some containing predominantly cells of earlier stages and some predominantly cells showing more advanced maturation. In some patients, erythropoiesis may appear dispersed, with absent or infrequent formation of cell clusters.
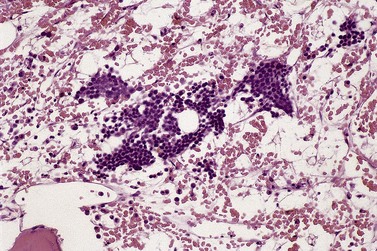
Assessment of megakaryocyte morphology and distribution is critical to the interpretation of BMTB histology in MDS.38,39 Cytologic features are discussed below but spatial distribution of megakaryocytes, as for other hemopoietic lineages, is often highly abnormal. Because of their relatively large size and distinctive morphology, it is usually easy to detect clustering of megakaryocytes (Fig. 20.11) and their displacement from perisinusoidal to paratrabecular locations. Occasional small clusters of 2–3 megakaryocytes may be found in normal or reactive bone marrow but larger groupings are highly atypical and indicate pathology. Paratrabecular location of megakaryocytes has similar significance and is extremely rare in other contexts, unless the BM is severely hypoplastic for unrelated reasons. Even in the latter situation, the possibility of hypoplastic MDS should be considered carefully.
Cytologic features in trephine biopsy sections in MDS
One important aspect of cytology in myelodysplasia, which is often only appreciable in BMTB sections and not in aspirate films, is the increased apoptotic activity that contributes to ineffective hemopoiesis in patients with MDS.40,41 Apoptotic nuclei, recognizable by their characteristic patterns of nucleic acid condensation, can be seen scattered throughout the hemopoietic tissue and sometimes clustered inside the cytoplasm of stromal macrophages. However, increased apoptotic activity also occurs in other conditions involving increased cell turnover in the BM, including hyperplastic states (e.g. associated with septicemia or in response to malignant disease elsewhere in the body), inflammatory myelopathies such as those associated with HIV infection and systemic lupus erythematosus (SLE), myeloproliferative neoplasms and acute leukemias. Undue significance should not be attributed to finding increased apoptotic activity in BMTB sections if other features of dysplasia are absent or if other features of inflammation are present.
Characteristic features of MDS subtypes
Findings in blood and BM smears diagnostic for various MDS subtypes are summarized in Table 20.2.4 In patients with refractory cytopenia with unilineage dysplasia, BM is usually hypercellular, but may be normo- or hypocellular. It is important to assess megakaryocyte morphology in trephine sections as well as aspirate films before diagnosis of RA or RN is made for differentiation with RCMD subtype of MDS. At least 30 megakaryocytes should be assessed. In RA, hyperplastic erythropoiesis is prominent. In RN and RT, erythropoiesis may be normal or decreased. Large clusters of normally-maturing erythroid cells may represent the only pathological features in many patients with RARS, in whom BMTB histology may be otherwise lack dysplastic features in granulopoiesis and megakaryocytes. In MDS with del(5q), erythropoiesis is frequently hypoplastic. Small megakaryocytes with monolobated nuclei are particularly associated with MDS with del(5q) (Fig. 20.12) but may also be present, together with a heterogeneous population of less distinctive dysplastic megakaryocytes, in other forms of myelodysplasia. In RCMD type of MDS, BM is usually hypercellular. Dysplasia may be most prominent in one of the hematopoietic lineages, but it has to be present in at least one more lineage. Before making the RCMD diagnosis, it is important to assess percentage of blast cells in blood and BM films. Ring sideroblasts may be present in RCMD. In MDS of RAEB type, BM is usually also hypercellular, displays multilineage dysplasia and the signs of abnormal spatial distribution of hematopoiesis. ALIP are often present, especially in RAEB-2. The enumeration of blast cells in BMTB may be very important in cases with fibrosis (Fig. 20.8A, B), where their numbers in films may not exceed 5%.
Myelodysplasia in hypoplastic bone marrow
Assessment of myelodysplasia in hypocellular BM specimens poses particular difficulties due to the paucity of hemopoietic tissue available for assessment. Aspiration may have been unsuccessful or may have yielded a suboptimal sample, so that BMTB combined with IHC stains has an important role.42 The differential diagnosis includes primary MDS, secondary myelodysplasia, and disorders such as hypoplastic/aplastic anemia, paroxysmal nocturnal hemoglobinuria and hypoplastic acute myeloid leukemia.43 The same criteria should be applied in assessing hemopoietic cell distribution and cytologic features as in normocellular or hypercellular BMTB sections. Even with very little hemopoietic tissue to evaluate, it should be possible to determine whether BMTB sections show: (1) hypoplastic normal hemopoiesis; (2) hypoplastic dysplastic hemopoiesis with evidence of at least partial maturation within each hemopoietic lineage; or (3) hypoplastic acute leukemia with predominance of blast cells and minimal or no evidence of maturation.
Histologic features of secondary myelodysplasia
Dysplastic hemopoiesis may occur in response to a variety of often poorly characterized systemic diseases and toxic insults to the bone marrow. A familiar example is the myelopathy associated with infection by the human immunodeficiency virus (HIV).44 A similar inflammatory myelopathy can accompany systemic autoimmune conditions, particularly SLE. Hemopoietic recovery following cytotoxic chemotherapy is also often transiently dysplastic,45 in addition to the predictable megaloblastosis caused by use of folate antagonists.
It is not always possible to determine by BM examination whether dysplasia is primary or secondary but BMTB histology provides important clues to indicate the likelihood of one versus the other. The main features that indicate a secondary origin for myelodysplasia are abnormalities of the BM stroma, reflecting toxic or inflammatory injury of stromal cells, occurring in addition to hemopoietic cell damage. At the least, mildly increased stromal reticulin is usually present. In addition, there is often stromal edema, indicated by separation of hemopoietic cells in the interstitium and widening of sinusoidal lumens (Fig. 20.13), frequently accompanied by interstitial leakage of red blood cells. In more severe injury, gelatinous change occurs; evidence for this may be found in aspirate films as well as in histologic preparations, with irregular masses eosinophilic, periodic acid-Schiff (PAS)-positive material in particles and trails. In histologic sections, distinction between severe edema and gelatinous change can be confirmed by Alcian blue staining; edema fluid remains unstained but, in gelatinous change, the stroma stains turquoise/blue. Stromal injury is occasionally sufficiently severe to cause collagen fibrosis, particularly if necrosis has occurred. Evidence of previous necrosis may be found in the form of dead bone trabeculae or fragments of amorphous debris in the fibrotic stroma showing dystrophic calcification. Recent severe systemic illness or exposure to cytotoxic agents may leave a distinct cement line within many bone trabeculae, reflecting transient inhibition of normal bone remodeling. Stromal injury may also lead to new bone formation; this is usually only focal and minor in extent but rare patients, for unknown reasons, respond to toxic BM injury with florid neo-osteogenesis.
Other features suggesting a secondary origin for dysplasia are:
If lymphoid nodules are seen, it should be remembered that such aggregates, sometimes with atypical features, might also occur in association with primary MDS. The differential diagnosis must include, in addition, BM involvement by lymphoma provoking secondary myelodysplasia (see Chapter 29). Distinguishing between these alternatives can be extremely difficult and requires integration of all clinical, hematologic, cytogenetic and molecular genetic information available for the individual patient under consideration. Even with such information, it may be necessary to follow the patient’s subsequent progress, including repeated biopsy, to establish the nature and clinical significance of such abnormalities.
Use of immunohistochemistry and fluorescent in situ hybridization (FISH) in trephine biopsy sections in myelodysplasia
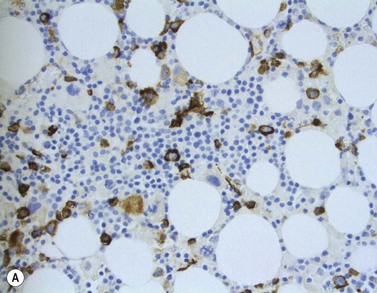
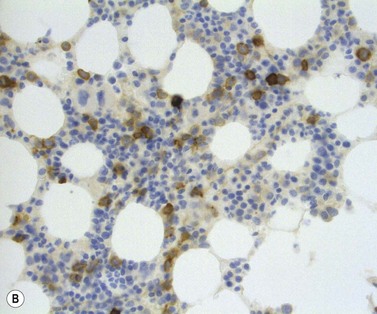
The main application of IHC stains in MDS has been enumeration of CD34+ hemopoietic stem cells in BMTB sections. The CD34+ count assessed in this way has prognostic value, with higher counts and clusters being of negative prognostic significance.36,46 Evaluation of CD34 positivity in BMTB sections must be undertaken with care to exclude capillary endothelial cells. Endothelial cells express this antigen strongly and, particularly when cut in cross-section, cannot always be seen to be associated with a vascular lumen. With experience, hemopoietic cells can be recognized by their characteristic granular IHC staining pattern with monoclonal antibodies reactive with class I CD34 (Fig. 20.14A). Another antigen of help in recognition of ALIP is CD117 (c-kit receptor) (Fig. 20.14B).47 However, the prognostic significance of enumerating CD117+ hemopoietic precursors has not yet been established and the staining may be more difficult to interpret than for CD34.
Immunohistochemistry can also be helpful in interpreting BMTB histology in myelodysplastic conditions when cytologic abnormalities cause difficulty in recognizing cells belonging to the various hemopoietic lineages.38,48,49 Cells of the granulocytic series, at all stages of maturation, can be demonstrated by immunostaining for myeloperoxidase, muramidase (lysozyme) or the CD68 epitope recognized by monoclonal antibody KP1. Use of neutrophil elastase as a target antigen for IHC may be unreliable in MDS if hypogranularity of granulocytes is a feature; otherwise, it can be useful to demonstrate the distribution of promyelocytes and myelocytes. Later granulocytes (metamyelocytes and neutrophil polymorphs) express CD15, CD10 and the calprotectin molecule recognized by monoclonal antibody Mac387. Monocytes and macrophages can be assessed by immunostaining with antibodies to CD14 and CD68R (PG-M1).49 The use of CD14 is preferred for monocyte recognition since these cells are rarely present in great abundance and CD68R is expressed strongly by the normal population of stromal macrophages.
With increasing understanding of the genetic basis of hemopoietic disorders, including primary MDS, there is a growing interest in demonstrating cytogenetic abnormalities in situ in BMTB. Despite the limitations of visualizing signals in sectioned nuclei, in which only part of the chromosomal complement of any cell is represented, methodology has been developed for successful demonstration of numerical chromosomal abnormalities and translocations by FISH in trephine biopsy sections. Application of FISH to the standard assessment of histologic preparations in suspected MDS has, as yet, been limited.50,51
Flow cytometry in diagnosis of MDS
Several studies have shown that flow cytometry (FCM) may contribute significantly to diagnosis and prognosis in MDS (reviewed in 52). Abnormal development of erythroid, myeloid and monocytic cells, identified as phenotypic abnormalities by FCM in MDS correlates with prognostic scoring systems, transfusion dependency, and time to progression to advanced MDS/AML, as well as with outcome after hemopoietic stem cell transplantation. The most widely seen features are:
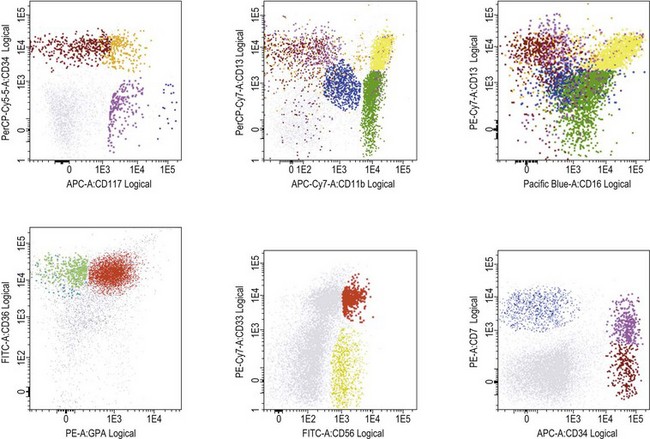
Published studies have employed a wide range of methods and reagents. Moreover, BM samples from patients with non-clonal dysplasia have not been sufficiently studied. Therefore, the WHO 2008 recommended that, if three or more phenotypic abnormalities are found involving one or more of the myeloid lineages, the features can be considered as ‘suggestive’ of MDS.5 However, in the absence of conclusive morphologic and/or cytogenetic features, flow cytometric abnormalities alone are not diagnostic of MDS. Patients whose cells exhibit aberrant phenotypic features suggesting MDS should be followed carefully to determine whether morphologic features emerge that are sufficient to substantiate the diagnosis. Efforts within the European Leukemia Network (ELNet) to standardize FCM method and reagents for MDS assessment are undertaken to establish its role and provide robust guidelines for its use in this context.52
Genetics
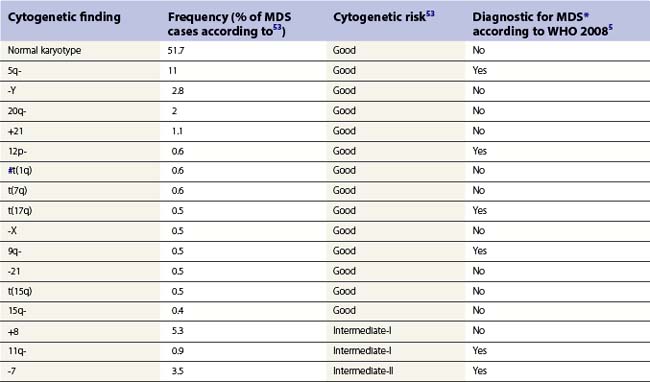
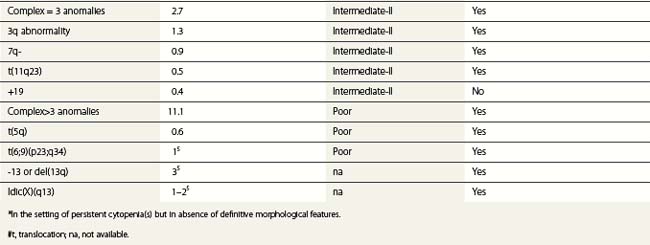
Whenever possible, direct chromosomal analysis of BM cells should be performed in patients with suspected MDS. Clonal cytogenetic abnormalities are found in approximately 50% of patients with primary MDS53 and more than 90% of patients with secondary MDS.54 The more advanced the disease, the greater the incidence of karyotypic abnormality. Even when a normal karyotype is found, monosomies and trisomies are sometimes detected by FISH. Cytogenetic abnormalities with prognostic relevance have been identified and incorporated into prognostic scoring (Tables 20.5 and 20.6). However, the prognostic relevance of many cytogenetic changes is still obscure.
By morphology, deletions of 5q are characterized by the presence of atypical megakaryocytes with monolobated nuclei 55 and deletions of 17p by small vacuolated pseudo-Pelger cells.56 Rearrangements of 3q26 are associated with raised platelet counts and micromegakaryocytes.57 Isolated del (20q) is found in patients with minimal dysplasia and thrombocytopenia, resembling idiopathic thrombocytopenia.58
Using array comparative genomic hybridization and single nucleotide polymorphism arrays, chromosomal aberrations undetectable by metaphase karyotype analysis have been found in 20–30% of MDS patients with normal karyotype. The potential clinical significance of these abnormalities was demonstrated by an adverse effect on overall survival.59,60
Molecular changes conferring better prognosis in MDS, independent of other risk factors, include recently identified mutations of the ten-eleven translocation 2 (TET2) gene located at 4q24 and found in approximately 20% of patients.61 Several other gene abnormalities have been reported in MDS, including mutations in genes coding for critical receptor kinases or downstream signaling molecules (KIT, G-CSFR, PDGFRb,FLT3, FMS, N-RAS, K-RAS, JAK2) or for certain transcription factors (RUNX1, CEBPA, PU.1, GATA-1, TP53, MLL). RAS mutations occur in about 10–15% of MDS cases, with N-RAS being the most frequently mutated and associated with worse prognosis.62
Several studies have attempted to look for critical genes in affected regions in recurring genetic changes in MDS. In MDS with del(5q), the major commonly deleted region (CDR) has been delineated at band 5q31.1. One of the genes in this region is the RPS14 gene encoding the ribosomal protein S14, a component of the 40S ribosome subunit. Haploinsufficiency of RPS14 leads to the characteristic 5q- phenotype with impaired expansion of erythroid progenitors and changes in megakaryopoiesis.63 Two micro-RNAs (miR), miR-145 and miR-146a are located at chr.5q33 and become haploinsufficient in patients with del(5q) MDS. Interestingly, mice studies have shown that down-regulation of these two miR inappropriately activates innate immune signaling and leads to slight thrombocytosis, as often observed in patients with del(5q) MDS. Moreover, this activation per se may increase long-term risk of bone marrow failure and leukemic evolution.64 The early-growth response gene 1 (EGR1) gene, involved in cellular responses to growth factors, mitogens, and stress stimuli, and the secreted protein acidic and rich in cysteine (SPARC) gene are other genes, in which abnormalities are implicated in pathogenesis of MDS with del(5q).
CDRs involved in aberrations of chromosome 7 have been less extensively studied. One proposed target is the homeobox (HOX) A9 gene, part of a cluster of homeobox genes encoding for DNA-binding transcription factors which have been implicated in differentiation and stem cell commitment in hematopoiesis. Molecular aberrations of the HOXA9 gene are associated with a poor prognosis in MDS.62
Pathogenesis
MDS is considered to be a clonal stem cell disorder and is viewed as the result of the cumulative acquisition of multiple genetic errors occurring over a long period. Some of these abnormalities may be congenital but most are acquired. The acquired genetic abnormalities may be random errors and some environmental insults increase the risk. Chief among these have been exposure to X-irradiation, alkylating agents and benzene and its derivatives. Some individuals may be more prone to acquiring genetic abnormalities in these contexts because they lack effective detoxifying enzymes.65,66
Several studies have shown that hematopoietic progenitors in MDS patients are more prone to apoptosis than those of healthy individuals.67 Dysregulation of proapoptotic pathway components, including tumor necrosis factor (TNF)-α, Fas-ligand, and/or TNF-related apoptosis-inducing ligand (TRAIL), probably through over-expression of FLICE (caspase8) inhibitory protein (FLIP), have been found. Proapoptotic members of Bcl-2 family, Bax and Bad, are also highly expressed, as well as members of inhibitors of apoptosis (IAP) family (survivin, cIAP, NAIP and XIAP). Constitutive activation of NF-κB has been proposed as another proapoptotic mechanism, since inhibition of NF-κB in CD34+ cells from patients with high-risk MDS resulted in apoptosis.67 Defects in mitochondrial function may be of importance in patients with RARS, who demonstrate a constitutive leakage of cytochrome C from mitochondria.68
In some MDS patients (especially those with hypoplastic MDS), clones carrying a mutation of the X-chromosome gene PIG-A, characteristic of paroxysmal nocturnal hemoglobinuria (PNH) have been found. Such mutations lead to absence of glycosylphosphatidylinositol (GPI) anchor protein expression by hematopoietic cells. Similar to individuals with PNH and aplastic anemia, these MDS patients have an over-representation of the HLA haplotype DR15. They have a lower rate of progression to AML than other MDS patients and may respond well to immunosuppressive therapy.69,70
Another subset of MDS patients present oligoclonal expansions of cytotoxic lymphoid cells, which may target hemopoietic cells. Activated T-cells and skewed use of TCR-Vβ have also been shown. Hypothetical models propose immune triggering of the patient’s lymphocytes, either by aberrantly expressed oncogenes and fusion gene products in hematopoietic progenitor cells or by super-antigens derived from bacteria or viruses.20,71
Clinical course and management
Although MDS in some individuals may follow an indolent course, in most patients the disease will eventually progress. Cytopenias will become worse and BM blast cell counts will increase. In this elderly group, approximately one third will develop acute leukemia, a third will die from the consequences of cytopenias and a third will die from an unrelated cause.72
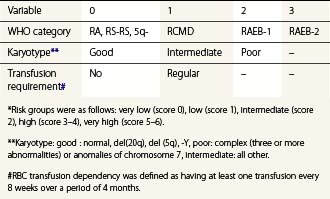
To compare results of treatment in various patient cohorts, clinical studies have widely applied the International Prognostic Scoring System (IPSS), developed 1997 by Greenberg and colleagues. IPSS is based on percentage of BM blast cells, karyotype findings and number of cytopenias.73 The recently developed WHO-classification-based Prognostic Scoring System (WPSS; Table 20.6) integrates WHO morphological criteria, karyotype and requirements for RBC transfusion to generate an indicator of symptomatic anemia.74 Applying the WPSS allows stratification of patients into five risk categories (Table 20.6) with significantly different survival outcomes. Other proposed risk models include age and performance status integrated with the number of blast cells, combinations of cytopenias, nature of karyotypic abnormalities and RBC transfusion requirements.75
Treatment for MDS is unsatisfactory. The keystone is good supportive care. Even in patients who develop AML, the course may be slow and indolent. Therefore, no attempt at aggressive therapy should be initiated until the pace of the disease is established. Judicious use of red cell transfusions with an aim to maintain a Hb level of 90–100 g/l and use of appropriate antibiotics in case of infections is essential. Some patients will require platelet transfusions. Patients expected to live for a considerable time with regularly repeated red cell transfusions will need to consider iron chelation therapy when the S-ferritin levels exceed 1500 ng/ml.72
In patients with MDS with del(5q) the immunomodulatory drug lenalidomide showed 67% major erythroid responses and 45% complete cytogenetic remissions, with median response duration above 2 years.76,77 Lenalidomide has been shown to up-regulate the tumor suppressor gene SPARC and the SPARC protein expression in erythroblasts in vitro. Patients with del(5q) MDS are haploinsufficient for SPARC, which makes it an interesting target for further investigation. Moreover, lenalidomide inhibits the cell cycle associated phosphatases CDC25C and PPA2, also located at chromosome 5q, which may further explain this drug efficacy in MDS with del(5q). However, due to an unexpectedly high rate of leukemic evolution in lenalidomide-treated patients, there is still a need for long-term studies evaluating the effects of this agent on survival in MDS with del(5q).78,79 There is some indication that lenalidomide may also be effective in other MDS categories.80
Low-dose chemotherapy with cytarabine produces responses in 16% of MDS patients but cytopenias are often prolonged and this treatment has fallen out of favor. The hypomethylating agents 5-azacytidine and decitabine show an overall response rate of 30–50% but the fraction of complete responses is low.81 A large phase 3 trial compared the outcome of high-risk MDS patients treated with 5-azacytidine, supportive care, and high-dose chemotherapy. 5-Azacytidine has significantly improved the outcome, extending the median survival from 15 to 25 months (hazard ratio 0.58). Hence, 5-azacytidine is currently considered as first-line therapy in high-risk MDS.82
High-dose chemotherapy has a dismal record. More than 80% of patients are >60 years of age and many are too frail to withstand the side-effects of this form of therapy. Complete responses occur but seldom last longer than a year. There are very few long-term survivors. Allogeneic stem cell transplantation may be curative and should be considered in younger patients who do not have a low-risk MDS category. Unfortunately, due to their high median age as a group, few MDS patients are suitable for this form of therapy. Decisions to attempt allografting and the type of conditioning (myeloablative or non-myeloablative) should be based on individual risk-assessment.83
Immunosuppression with anti-thymocyte globulin, with or without cyclosporine, is effective in younger MDS patients with normal karyotype and without long-standing transfusion requirement.84 Other experiment treatments include the use of thalidomide, which is believed to exert its effect via the BM stroma, and farnesyl transferase inhibitors, which act by interfering with the ras signaling pathway.85
1 Hellstrom-Lindberg E. Myelodysplastic syndromes: an historical perspective. Hematology Am Soc Hematol Educ Program. 2008:42.
2 Bennett JM, Catovsky D, Daniel MT, et al. Proposals for the classification of the myelodysplastic syndromes. Br J Haematol. 1982;51:189-199.
3 Harris NL, Jaffe ES, Diebold J, et al. World Health Organization classification of neoplastic diseases of the hematopoietic and lymphoid tissues: report of the Clinical Advisory Committee meeting – Airlie House, Virginia, November 1997. J Clin Oncol. 1999;17:3835-3849.
4 Vardiman JW, Thiele J, Arber DA, et al. The 2008 revision of the World Health Organization (WHO) classification of myeloid neoplasms and acute leukemia: rationale and important changes. Blood. 2009;114:937-951.
5 Swerdlow SH, Campo E, Harris NL, et al. WHO Classification of Tumours of Haematopoietic and Lymphatic Tissues. Lyon: IARC; 2008.
6 Ma X, Does M, Raza A, Mayne ST. Myelodysplastic syndromes: incidence and survival in the United States. Cancer. 2007;109:1536-1542.
7 Matsuda A, Germing U, Jinnai I, et al. Difference in clinical features between Japanese and German patients with refractory anemia in myelodysplastic syndromes. Blood. 2005;106:2633-2640.
8 Williamson PJ, Kruger AR, Reynolds PJ, et al. Establishing the incidence of myelodysplastic syndrome. Br J Haematol. 1994;87:743-745.
9 Aul C, Gattermann N, Schneider W. Age-related incidence and other epidemiological aspects of myelodysplastic syndromes. Br J Haematol. 1992;82:358-367.
10 Strom SS, Velez-Bravo V, Estey EH. Epidemiology of myelodysplastic syndromes. Semin Hematol. 2008;45:8-13.
11 Rollison DE, Howlader N, Smith MT, et al. Epidemiology of myelodysplastic syndromes and chronic myeloproliferative disorders in the United States, 2001–2004, using data from the NAACCR and SEER programs. Blood. 2008;112:45-52.
12 Ma X, Lim U, Park Y, et al. Obesity, lifestyle factors, and risk of myelodysplastic syndromes in a large US cohort. Am J Epidemiol. 2009;169:1492-1499.
13 Natelson EA. Benzene exposure and refractory sideroblastic erythropoiesis: is there an association? Am J Med Sci. 2007;334:356-360.
14 Czader M, Orazi A. Therapy-related myeloid neoplasms. Am J Clin Pathol. 2009;132:410-425.
15 Gologan R, Georgescu D, Tatic A, et al. Epidemiological data from the registry of patients with myelodysplastic syndrome in a single hospital center of Romania. Leuk Res. 2009;33:1556-1561.
16 Niemeyer CM, Baumann I. Myelodysplastic syndrome in children and adolescents. Semin Hematol. 2008;45:60-70.
17 Owen C, Barnett M, Fitzgibbon J. Familial myelodysplasia and acute myeloid leukaemia – a review. Br J Haematol. 2008;140:123-132.
18 Howe RB, Porwit-MacDonald A, Wanat R, et al. The WHO classification of MDS does make a difference. Blood. 2004;103:3265-3270.
19 Germing U, Strupp C, Kuendgen A, et al. Prospective validation of the WHO proposals for the classification of myelodysplastic syndromes. Haematologica. 2006;91:1596-1604.
20 Voulgarelis M, Giannouli S, Ritis K, Tzioufas AG. Myelodysplasia-associated autoimmunity: clinical and pathophysiologic concepts. Eur J Clin Invest. 2004;34:690-700.
21 Drabick JJ, Davis BJ, Byrd JC. Concurrent pernicious anemia and myelodysplastic syndrome. Ann Hematol. 2001;80:243-245.
22 Mufti GJ, Figes A, Hamblin TJ, et al. Immunological abnormalities in myelodysplastic syndromes. I. Serum immunoglobulins and autoantibodies. Br J Haematol. 1986;63:143-147.
23 Kohno T, Katamine S, Moriuchi R, et al. Activity of Fgr protein-tyrosine kinase is reduced in neutrophils of patients with myelodysplastic syndromes and chronic myelogenous leukemia. Leuk Res. 1996;20:221-227.
24 Mittelman M, Zeidman A. Platelet function in the myelodysplastic syndromes. Int J Hematol. 2000;71:95-98.
25 Richert-Boe KE, Bagby GCJr. In vitro hematopoiesis in myelodysplasia: liquid and soft-gel culture studies. Hematol Oncol Clin North Am. 1992;6:543-556.
26 Vercauteren SM, Bashashati A, Wu D, et al. Reduction in multi-lineage and erythroid progenitors distinguishes myelodysplastic syndromes from non-malignant cytopenias. Leuk Res. 2009;33:1636-1642.
27 Valent P, Horny HP. Minimal diagnostic criteria for myelodysplastic syndromes and separation from ICUS and IDUS: update and open questions. Eur J Clin Invest. 2009;39:548-553.
28 Houwen B. Blood film preparation and staining procedures. Clin Lab Med. 2002;22:1-14. v
29 Steensma DP, Gibbons RJ, Higgs DR. Acquired alpha-thalassemia in association with myelodysplastic syndrome and other hematologic malignancies. Blood. 2005;105:443-452.
30 Bendix-Hansen K, Bergmann OJ. Evaluation of neutrophil alkaline phosphatase (NAP) activity in untreated myeloproliferative syndromes and in leukaemoid reactions. Scand J Haematol. 1985;35:219-224.
31 Willis MS, McKenna RW, Peterson LC, et al. Low blast count myeloid disorders with Auer rods: a clinicopathologic analysis of 9 cases. Am J Clin Pathol. 2005;124:191-198.
32 Matsushima T, Handa H, Yokohama A, et al. Prevalence and clinical characteristics of myelodysplastic syndrome with bone marrow eosinophilia or basophilia. Blood. 2003;101:3386-3390.
33 Mufti GJ, Bennett JM, Goasguen J, et al. Diagnosis and classification of myelodysplastic syndrome: International Working Group on Morphology of myelodysplastic syndrome (IWGM-MDS) consensus proposals for the definition and enumeration of myeloblasts and ring sideroblasts. Haematologica. 2008;93:1712-1717.
34 Goasguen JE, Bennett JM, Cox C, et al. Prognostic implication and characterization of the blast cell population in the myelodysplastic syndrome. Leuk Res. 1991;15:1159-1165.
35 Lambertenghi-Deliliers G, Orazi A, Luksch R, et al. Myelodysplastic syndrome with increased marrow fibrosis: a distinct clinico-pathological entity. Br J Haematol. 1991;78:161-166.
36 Della Porta MG, Malcovati L, Boveri E, et al. Clinical relevance of bone marrow fibrosis and CD34-positive cell clusters in primary myelodysplastic syndromes. J Clin Oncol. 2009;27:754-762.
37 Tricot G, de Wolf-Peeters C, Vlietinck R, Verwilghen RL. Bone marrow histology in myelodysplastic syndromes. II. Prognostic value of abnormal localization of immature precursors in MDS. Br J Haematol. 1984;58:217-225.
38 Orazi A. Histopathology in the diagnosis and classification of acute myeloid leukemia, myelodysplastic syndromes, and myelodysplastic/myeloproliferative diseases. Pathobiology. 2007;74:97-114.
39 Thiele J, Quitmann H, Wagner S, Fischer R. Dysmegakaryopoiesis in myelodysplastic syndromes (MDS): an immunomorphometric study of bone marrow trephine biopsy specimens. J Clin Pathol. 1991;44:300-305.
40 Thiele J, Zirbes TK, Wiemers P, et al. Incidence of apoptosis in HIV-myelopathy, myelodysplastic syndromes and non-specific inflammatory lesions of the bone marrow. Histopathology. 1997;30:307-311.
41 Westwood NB, Mufti GJ. Apoptosis in the myelodysplastic syndromes. Curr Hematol Rep. 2003;2:186-192.
42 Orazi A, Albitar M, Heerema NA, et al. Hypoplastic myelodysplastic syndromes can be distinguished from acquired aplastic anemia by CD34 and PCNA immunostaining of bone marrow biopsy specimens. Am J Clin Pathol. 1997;107:268-274.
43 Barrett J, Saunthararajah Y, Molldrem J. Myelodysplastic syndrome and aplastic anemia: distinct entities or diseases linked by a common pathophysiology? Semin Hematol. 2000;37:15-29.
44 Thiele J, Zirbes TK, Bertsch HP, et al. AIDS-related bone marrow lesions – myelodysplastic features or predominant inflammatory-reactive changes (HIV-myelopathy)? A comparative morphometric study by immunohistochemistry with special emphasis on apoptosis and PCNA-labeling. Anal Cell Pathol. 1996;11:141-157.
45 Wilkins BS, Bostanci AG, Ryan MF, Jones DB. Haemopoietic regrowth after chemotherapy for acute leukaemia: an immunohistochemical study of bone marrow trephine biopsy specimens. J Clin Pathol. 1993;46:915-921.
46 Soligo DA, Oriani A, Annaloro C, et al. CD34 immunohistochemistry of bone marrow biopsies: prognostic significance in primary myelodysplastic syndromes. Am J Hematol. 1994;46:9-17.
47 Naresh KN, Lampert IA. CD117 Expression as an aid to identify immature myeloid cells and foci of ALIP in bone marrow trephines. Am J Hematol. 2006;81:79.
48 Mangi MH, Mufti GJ. Primary myelodysplastic syndromes: diagnostic and prognostic significance of immunohistochemical assessment of bone marrow biopsies. Blood. 1992;79:198-205.
49 Torlakovic EE, Naresh KN, Brunning RD. Bone Marrow Immunohistochemistry. Chicago: American Society for Clinical Pathology Press; 2009.
50 Thiele J, Schmitz B, Fuchs R, et al. Detection of the bcr/abl gene in bone marrow macrophages in CML and alterations during interferon therapy – a fluorescence in situ hybridization study on trephine biopsies. J Pathol. 1998;186:331-335.
51 Wilkins BS, Clark DM. Making the most of bone marrow trephine biopsy. Histopathology. 2009;55:631-640.
52 van de Loosdrecht AA, Alhan C, Bene MC, et al. Standardization of flow cytometry in myelodysplastic syndromes: report from the first European Leukemia Net working conference on flow cytometry in myelodysplastic syndromes. Haematologica. 2009;94:1124-1134.
53 Haase D. Cytogenetic features in myelodysplastic syndromes. Ann Hematol. 2008;87:515-526.
54 Smith SM, Le Beau MM, Huo D, et al. Clinical-cytogenetic associations in 306 patients with therapy-related myelodysplasia and myeloid leukemia: the University of Chicago series. Blood. 2003;102:43-52.
55 Mahmood T, Robinson WA, Hamstra RD, Wallner SF. Macrocytic anemia, thrombocytosis and nonlobulated megakaryocytes: the 5q-syndrome, a distinct entity. Am J Med. 1979;66:946-950.
56 Jary L, Mossafa H, Fourcade C, et al. The 17p-syndrome: a distinct myelodysplastic syndrome entity? Leuk Lymphoma. 1997;25:163-168.
57 Secker-Walker LM, Mehta A, Bain B. Abnormalities of 3q21 and 3q26 in myeloid malignancy: a United Kingdom Cancer Cytogenetic Group study. Br J Haematol. 1995;91:490-501.
58 Gupta R, Soupir CP, Johari V, Hasserjian RP. Myelodysplastic syndrome with isolated deletion of chromosome 20q: an indolent disease with minimal morphological dysplasia and frequent thrombocytopenic presentation. Br J Haematol. 2007;139:265-268.
59 Gondek LP, Tiu R, O’Keefe CL, et al. Chromosomal lesions and uniparental disomy detected by SNP arrays in MDS, MDS/MPD, and MDS-derived AML. Blood. 2008;111:1534-1542.
60 Starczynowski DT, Vercauteren S, Telenius A, et al. High-resolution whole genome tiling path array CGH analysis of CD34+ cells from patients with low-risk myelodysplastic syndromes reveals cryptic copy number alterations and predicts overall and leukemia-free survival. Blood. 2008;112:3412-3424.
61 Kosmider O, Gelsi-Boyer V, Cheok M, et al. TET2 mutation is an independent favorable prognostic factor in myelodysplastic syndromes (MDSs). Blood. 2009;114:3285-3291.
62 Nolte F, Hofmann WK. Myelodysplastic syndromes: molecular pathogenesis and genomic changes. Ann Hematol. 2008;87:777-795.
63 Ebert BL. Deletion 5q in myelodysplastic syndrome: a paradigm for the study of hemizygous deletions in cancer. Leukemia. 2009;23:1252-1256.
64 Starczynowski DT, Kuchenbauer F, Argiropoulos B, et al. Identification of miR-145 and miR-146a as mediators of the 5q- syndrome phenotype. Nat Med. 2010;16:49-58.
65 Sutton JF, Stacey M, Kearns WG, et al. Increased risk for aplastic anemia and myelodysplastic syndrome in individuals lacking glutathione S-transferase genes. Pediatr Blood Cancer. 2004;42:122-126.
66 Takeuchi J, Ly H, Yamaguchi H, et al. Identification and functional characterization of novel telomerase variant alleles in Japanese patients with bone-marrow failure syndromes. Blood Cells Mol Dis. 2008;40:185-191.
67 Kerbauy DB, Deeg HJ. Apoptosis and antiapoptotic mechanisms in the progression of myelodysplastic syndrome. Exp Hematol. 2007;35:1739-1746.
68 Tehranchi R, Invernizzi R, Grandien A, et al. Aberrant mitochondrial iron distribution and maturation arrest characterize early erythroid precursors in low-risk myelodysplastic syndromes. Blood. 2005;106:247-253.
69 Stern M, Buser AS, Lohri A, et al. Autoimmunity and malignancy in hematology – more than an association. Crit Rev Oncol Hematol. 2007;63:100-110.
70 Xiao L, Qiong L, Yan Z, et al. Experimental and clinical characteristics in myelodysplastic syndrome patients with or without HLA-DR15 allele. Hematol Oncol. 2010;28(2):98-103.
71 Chamuleau ME, Westers TM, van Dreunen L, et al. Immune mediated autologous cytotoxicity against hematopoietic precursor cells in patients with myelodysplastic syndrome. Haematologica. 2009;94:496-506.
72 Jadersten M, Hellstrom-Lindberg E. Myelodysplastic syndromes: biology and treatment. J Intern Med. 2009;265:307-328.
73 Greenberg PL. Risk factors and their relationship to prognosis in myelodysplastic syndromes. Leuk Res. 1998;22(Suppl. 1):S3-S6.
74 Malcovati L, Germing U, Kuendgen A, et al. Time-dependent prognostic scoring system for predicting survival and leukemic evolution in myelodysplastic syndromes. J Clin Oncol. 2007;25:3503-3510.
75 Kantarjian H, O’Brien S, Ravandi F, et al. Proposal for a new risk model in myelodysplastic syndrome that accounts for events not considered in the original International Prognostic Scoring System. Cancer. 2008;113:1351-1361.
76 List A, Kurtin S, Roe DJ, et al. Efficacy of lenalidomide in myelodysplastic syndromes. N Engl J Med. 2005;352:549-557.
77 Ades L, Boehrer S, Prebet T, et al. Efficacy and safety of lenalidomide in intermediate-2 or high-risk myelodysplastic syndromes with 5q deletion: results of a phase 2 study. Blood. 2009;113:3947-3952.
78 Jadersten M, Saft L, Pellagatti A, et al. Clonal heterogeneity in the 5q- syndrome: p53 expressing progenitors prevail during lenalidomide treatment and expand at disease progression. Haematologica. 2009;94:1762-1766.
79 Gohring G, Giagounidis A, Busche G, et al. Patients with del(5q) MDS who fail to achieve sustained erythroid or cytogenetic remission after treatment with lenalidomide have an increased risk for clonal evolution and AML progression. Ann Hematol. 2010 Apr;89(4):365-374.
80 Raza A, Reeves JA, Feldman EJ, et al. Phase 2 study of lenalidomide in transfusion-dependent, low-risk, and intermediate-1 risk myelodysplastic syndromes with karyotypes other than deletion 5q. Blood. 2008;111:86-93.
81 Nimer SD. Myelodysplastic syndromes. Blood. 2008;111:4841-4851.
82 Fenaux P, Mufti GJ, Hellstrom-Lindberg E, et al. Efficacy of azacitidine compared with that of conventional care regimens in the treatment of higher-risk myelodysplastic syndromes: a randomised, open-label, phase III study. Lancet Oncol. 2009;10:223-232.
83 Cutler CS, Lee SJ, Greenberg P, et al. A decision analysis of allogeneic bone marrow transplantation for the myelodysplastic syndromes: delayed transplantation for low-risk myelodysplasia is associated with improved outcome. Blood. 2004;104:579-585.
84 Sloand EM, Wu CO, Greenberg P, Young N, Barrett J. Factors affecting response and survival in patients with myelodysplasia treated with immunosuppressive therapy. J Clin Oncol. 2008;26:2505-2511.
85 Kasner MT, Luger SM. Update on the therapy for myelodysplastic syndrome. Am J Hematol. 2009;84:177-186.
86 Malcovati L, Nimer SD. Myelodysplastic syndromes: diagnosis and staging. Cancer Control. 2008;15(Suppl.):4-13.
[/level-membership-for-pathology-category][not-level-membership-for-pathology-category]
CHAPTER 20 Myelodysplastic syndromes
The first report of a patient with myelodysplastic syndrome (MDS) dates from 1900, when Leube described a patient with severe megaloblastic anemia preceding development of overt leukemia.1 This description was followed by several reports of patients characterized by cytopenia, disturbed maturation of bone marrow (BM) precursors, an increase of blasts and a significant risk of evolving to acute myeloid leukemia (AML).1 The first international classification of MDS was developed by the French-American-British (FAB) Group2 (Table 20.1) and extended by the World Health Organization (WHO) 2001 and WHO 2008 (Table 20.2) classifications.3–5 The diagnosis of MDS is an effort that requires clinical, cytogenetic and pathological expertise, and often also repeated BM studies.
Table 20.1 French-American-British (FAB) group classification of myelodysplastic syndromes2
| Type | Peripheral blood | Bone marrow |
|---|---|---|
| RA | <1% blasts | Dyshemopoiesis in one, two or all three lineages; <5% blasts |
| RARS | <1% blasts | As RA with ring sideroblasts (RS) comprising >15% erythroblasts |
| RAEB | <20% blasts | As RA with 5–20% blasts in BM, +/− RS |
| RAEBt | >30% blasts | As RA with 20–30%* blasts in BM or as RAEB with Auer rods |
| CMML | As any of the above plus >1 × 10⁹/l monocytes/promonocytes in blood | |
RA, refractory anemia; RARS, RA with ring sideroblasts; RAEB, RA with excess of blasts; RAEBt, RAEB in transformation; CMML, chronic myelomonocytic leukemia.
Variants that do not fit well into this classification include hypoplastic MDS, fibrotic MDS and juvenile myelomonocytic leukemia.
* Cases with >30% blasts were classified as acute leukemia.
Table 20.2 WHO 2008 classification of myelodysplastic syndromes4
| Disease | Blood findings | Bone marrow findings |
|---|---|---|
| Refractory cytopenia with unilineage dysplasia (RCUD): | Unicytopenia or bicytopenia1 | Unilineage dysplasia: ≥10% of the cells in one myeloid lineage |
| [Refractory anemia (RA); refractory neutropenia (RN); | No or rare blasts (<1%)2 | <5% blasts |
| Refractory thrombocytopenia (RT)] | <15% of erythroid precursors are ring sideroblasts | |
| Refractory anemia with ring sideroblasts (RARS) | ||
| Refractory cytopenia with multilineage dysplasia (RCMD) | ||
| Refractory anemia with excess blasts-1 (RAEB-1) | ||
| Refractory anemia with excess blasts-2 (RAEB-2) | ||
| Myelodysplastic syndrome – unclassified (MDS-U) | ||
| MDS associated with isolated del(5q) |
Although the finding of 5–19% blasts in the blood is, in itself, diagnostic of RAEB-2, cases of RAEB-2 may have less than 5% blasts in the blood if they have Auer rods and/or 10–19% blasts in the marrow. Similarly, cases of RAEB-2 may have less than 10% blasts in the marrow but may be diagnosed by the other two findings, Auer rod+ and/or 5–19% blasts in the blood.
1 Bicytopenia may occasionally be observed. Cases with pancytopenia should be classified as MDS-U.
2 If the marrow myeloblast percentage is less than 5% but there are 2–4% myeloblasts in the blood, the diagnostic classification is RAEB 1. Cases of RCUD and RCMD with 1% myeloblasts in the blood should be classified as MDS-U.
3 Cases with Auer rods and <5% myeloblasts in the blood and <10% in the marrow should be classified as RAEB-2.
Definition
According to the WHO 2008 classification, MDS may be defined as a group of clonal hematopoeitic stem cell disorders characterized by cytopenia(s), dysplasia in one or more of the major myeloid cell lines, ineffective hematopoiesis and increased risk of AML development.5 The BM is usually hypercellular. Myelodysplasia, i.e. abnormal maturation in hematopoiesis, is a hallmark of MDS (Table 20.3). However, myelodysplasia is not definitive evidence of MDS and may be present as a result of various nutritional, toxic, infectious and other factors (Table 20.4). Moreover, a presumptive diagnosis of MDS may be made in a patient with unexplained cytopenia(s) in the absence of overt myelodysplasia if certain defining cytogenetic abnormalities are present (Table 20.5).
Table 20.3 Morphologic signs of dysplasia in blood and bone marrow cells in MDS
| Lineage | Blood | Bone marrow |
|---|---|---|
| Erythropoiesis | Macrocytes Aniso-poikilocytosis Dimorphic picture Polychromasia Punctate basophilia Normoblasts Reticulocytopenia |
Erythroid hypercellularity Multinuclearity Dyskaryorrhexis Megaloblasts Cytoplasmic vacuoles Howell–Jolly bodies Ring sideroblasts |
| Granulopoiesis | Hypogranular neutrophils Unilobed or bilobed neutrophils (Pelger cells) Hypersegmented neutrophils Monocytosis (often with multiple, elongated nuclear lobes) Promonocytes (with fine azurophil granules) Degranulated eosinophils |
Hypogranularity of myeloid precursors Increased promonocytes Increased blast cells (type I with scanty agranular cytoplasm and type II with sparse granules) |
| Thrombopoiesis | Agranular platelets | Micromegakaryocytes |
| Giant platelets | Large megakaryocytes with single round or oval nucleus | |
| Megakaryocyte fragments | Large megakaryocytes with multiple small round nuclei Megakaryoblasts |
Table 20.4 Non-clonal causes of dysplasia
| Dyserythropoiesis |
Epidemiology
American studies report the median age of MDS patients at diagnosis as 76 years.6 In Asian countries the median age at diagnosis is 10 years lower.7 The incidence is higher in men than in women (4.5 vs 2.7 cases/100 000 population/year, respectively). Incidence increases with age with 86% of MDS patients being older than 60 years of age. A prevalence of 1 in 500 in the population over 60 years of age has been suggested.8 In patients over 85 years, MDS represents about a quarter of all hematologic malignancies. Although studies point towards an increasing incidence, this may at least in part reflect a greater willingness to perform BM investigations in the elderly and increased reporting.9
Etiology of primary MDS is still poorly understood. Certain genetic disorders and exposure to pesticides, organic solvents or ionizing radiation have been implicated as risk factors.10,11 A large prospective study indicated obesity and smoking as modifiable, although weak, risk factors, while intake of alcohol, meat, fruit and vegetables, and physical activity did not influence the risk of MDS.12 Secondary MDS, which tends to occur in younger people, develops after exposure to certain chemicals and cytotoxic drugs, especially alkylating agents.13,14 The younger age at presentation of idiopathic MDS in developing countries suggests a less rigorous control of noxious chemicals in these communities.15 Childhood MDS is very rare (1.8 cases/1 000 000 population/year).16 Familial MDS is also very rare and occurs at a younger age.17
Classification
The ‘minimal’ morphologic criteria for MDS diagnosis according to WHO classification is the presence of at least 10% dysplastic forms in at least one hematopoietic lineage (erythroid, granulocytic or megakaryocytic), in an appropriate clinical setting.4 The FAB classification (Table 20.1) applied the arbitrary limit of 30% blasts for diagnosis of AML, while this limit has been changed to 20% in the WHO classification abolishing the former category of RAEBt. There is still ongoing debate as to how patients with a blast count between 20% and 30% should be classified.4 Of note, patients with specific translocations such as t(8;21), inv.16 and t(15;17) are classified as AML even if numbers of blasts are below 20%. This rule does not apply to cases of AML with t(9;11)(p22;q23), t(6;9)(p23;q34), inv.3(3)(q21q26.2), t(3;3)(q21;q26.2) and t(1;22)p(13;q13) that are considered as MDS if the number of blasts does not reach 20% within 2 months’ follow-up time. Some AML cases may be recognized as myelodysplasia-related, which should be stated in the report (see Chapter 18). Some of these cases would have been previously diagnosed as RAEB in transformation (RAEBt) and some would have been called AML. It is probable that a large proportion of AML cases in the elderly will fall into AML myelodysplasia-related category.
The 2001 WHO classification took into consideration the extent of dysplasia (unilineage vs multilineage), which has been proven to be of prognostic significance.18,19 WHO 2008 (Table 20.2) extended the definition of cases with unilineage dysplasia, adding two other categories to refractory anemia (RA): refractory neutropenia (RN) and refractory thrombocytopenia (RT). In WHO 2008, the presence of ring sideroblasts is only of significance in the context of unilineage erythroid dysplasia (RA vs RA with ring sideroblasts, RA-RS). Patients with multilineage dysplasia and less than 5% blasts are diagnosed as refractory cytopenia with multilineage dysplasia (RCMD) independent of the presence of sideroblasts. Refractory anemia with excess of blasts (RAEB) is separated into RAEB I with 5–9% blast cells and RAEB II with 10–19% blast cells in BM smears. WHO 2008 has also stressed the significance of the presence of blasts in peripheral blood (PB), since patients with 2–4% PB blasts and <5% BM blasts are now categorized as RAEB-1.4 It is important to note that most of these qualitative and quantitative parameters have been derived from blood and aspirated BM appearances. Correlation with their assessment by BM trephine biopsy (BMTB) histology has only a limited evidence base.
The revised WHO classification of 2008 has also recognized differences between MDS in adults and in children. The latter usually present with leukopenia and/or thrombocytopenia and less often with anemia. A provisional entity ‘refractory cytopenia of childhood’ (RCC) has been introduced, which includes childhood presentations with multilineage dysplasia, <2% blasts in PB, <5% blasts in BM and persistent cytopenia. Childhood MDS patients who have increased numbers of blasts should be classified in the same way as adults.4,5
Diagnosis
Symptoms of anemia (tiredness, breathlessness and lassitude), thrombocytopenia (bruising or bleeding), or neutropenia (recurrent infections, mouth ulcers) are most common. A large fraction of patients with MDS are asymptomatic and may be diagnosed incidentally when a blood test, performed for an unrelated reason, shows macrocytic anemia. Extramedullary involvement (such as lymphadenopathy and/or splenomegaly) is relatively rare and possibility of MDS/MPN should be first excluded in these patients. Approximately 10% of patients display autoimmune symptoms such as vasculitis, arthritis, polyneuropathy and connective tissue disease-like presentations. The tumor suppressor gene interferon regulatory factor-1 (IRF-1) has been implicated in the pathophysiology of MDS-associated autoimmune deregulation.20
A full blood count may reveal anemia, neutropenia, thrombocytopenia or multiple cytopenias. The recommended level for defining anemia is hemoglobin <10 g/l. Neutropenia is defined by absolute neutrophil count <1.8 × 10⁹/l and thrombocytopenia by platelet count <100 × 109/l. A raised mean cell volume (MCV) is frequently found and may be the only abnormality in the blood count. However, anemia may also be normocytic or microcytic. There is almost always reticulocytopenia. In patients with bone marrow fibrosis, a leukoerythroblastic picture may be found. In cases with del(5q), there may be a slightly elevated platelet count. Other tests are usually normal, but in some patients increased levels of lactate dehydrogenase (LDH) may be present, as a result of increased cell death in BM. High LDH levels carry a poor prognosis. Serum B12 levels are usually high, but coincident pernicious anemia has also been reported.21 A positive direct antiglobulin test, with signs of hemolysis, is found in 8% of patients.22 Both leukocyte and platelet function tests may be impaired,23,24 as well as the growth of BM progenitor cells in short-term and long-term cultures.25 Recent studies stress decreased numbers of early multilineage precursors and erythroid progenitors as characteristics of MDS.26
Diagnosis of MDS depends on BM examination and cytogenetics. However, some patients with persistent mild cytopenia and/or mild dysplasia do not fulfill minimal criteria for MDS and should be followed. For these patients, the terms idiopathic cytopenia of undetermined significance (ICUS) or idiopathic dysplasia of undetermined significance (IDUS) may be applied;27 some of these patients will, with time, develop MDS.
Blood film examination
Blood films should be prepared fresh since blood samples exposed to anticoagulants are unsatisfactory for accurate morphology. The ability to diagnose MDS depends crucially on optimal staining of PB and BM films. Staining varies enormously between laboratories, so observers should become familiar with their own laboratory’s stains. Films sent for a second opinion should be sent unstained. Blood films are most commonly stained using the May–Grünewald–Giemsa or Wright method.28 It is important that the stain used picks up granularity in neutrophils well and also reveals basophilic stippling in red cells.
Erythrocytes
Anemia is the most common feature of MDS but it is not an obligatory finding. Usually the red cells are large, but they may be of normal size and occasionally are small. Many textbooks list sideroblastic anemia among the causes of a low MCV but this may be misleading, since it only applies to the rare hereditary form. The MDS category of refractory anemia with ring sideroblasts (RA-RS) is associated with a raised or normal MCV. Frequently, red cells in MDS vary in size and shape (aniso-/poikilocytosis). Oval macrocytes are common. When these are accompanied by small hypochromic cells, giving a dimorphic picture, RA-RS should be suspected (Fig. 20.1A). However, small hypochromic red cell fragments may be seen in all forms of MDS. A preponderance of small hypochromic red cells is rarely seen and should suggest acquired hemoglobin H (HbH) disease (Fig. 20.1B). This is a very rare finding in MDS and may be revealed with supravital staining (Fig. 20.1C).29 Poikilocytosis refers to several types of shape changes: dacrocytes (tear-drop shaped cells), acanthocytes (spur-spike cells), and cell fragments are all frequently seen. MDS is a rare cause of elliptocytosis (small, oval erythrocytes). However, red cell size and shape may be normal. Howell–Jolly bodies are occasionally seen but rather more common is basophilic stippling, which may be fine or coarse (Fig. 20.1D). Fine basophilic stippling confined to large, misshapen, hypochromic cells usually indicates RA-RS.
Leukocytes
Neutropenia is very common in MDS. Although it may already be severe at diagnosis, it is frequently mild or may develop later in the course of the disease. Abnormalities in granularity of neutrophils are important features. Classically, there are few if any neutrophil granules (Fig. 20.2A) but sometimes hypergranularity is seen (Fig. 20.2B). The leukocyte alkaline phosphatase (LAP) score may be low.30 Rarely, giant granules typical of those seen in Chediak–Higashi syndrome have been identified. Auer rods are sometimes seen and, when present, should lead to classification of the disease as RAEB-2, due to their reported negative prognostic significance.31 Accurate enumeration of blast cells in blood has been stressed in WHO 2008. Cases with 2–4% blast cells in blood are classified as RAEB-1, even if the fraction in BM smears is <5%.4 Cases with 1% blast cells in blood and <5% in BM are MDS-unclassified.
Abnormal neutrophil nuclear lobation is the other feature to observe. Pseudo-Pelger cells are neutrophils with unilobated or bilobed nuclei with normal condensation of the nuclear chromatin (Fig. 20.2C). It is important to distinguish these cells from myelocytes and metamyelocytes, in which the chromatin remains relatively uncondensed. Frequently, pseudo-Pelger cells display hypogranular cytoplasm and, occasionally, neutrophils with hyperlobated nuclei are seen. An unusual feature is arachnoid lobation, with the nuclear lobes looking like the segments of a spider’s leg.
A relative increase of monocytes can be seen in MDS due to neutropenia while chronic myelomonocytic leukemia (currently classified by the WHO as a myelodysplastic/myeloproliferative neoplasm, see Chapter 27) is a differential diagnosis in patients with a total monocytosis >1 × 10⁹/l. Degranulated eosinophils are sometimes a feature of MDS. Eosinophils with basophilic granules, or vice versa, are sometimes seen. Significant eosinophilia and/or basophilia is seen in approximately 12% of MDS patients and predicts poorer prognosis.32
