Chapter 17 Magnetic resonance imaging of the liver, biliary tract, and pancreas
Magnetic resonance imaging (MRI) is a cross-sectional scanning technique that allows images to be taken in any plane (Fig. 17.1). MRI uses magnetic fields and radiofrequency pulses to generate images with outstanding tissue contrast and excellent spatial resolution. MR techniques are not new and were first described in the 1940s by Bloch and colleagues (1946) and Purcell and colleagues (1946) as a method for in vitro chemical analysis. Several decades later, Damadian (1972) and Lauterbur (1973) applied some of these basic principles to design an MRI technique capable of in vivo imaging. Today, MRI is used extensively as an imaging tool throughout the body to visualize and distinguish normal and pathologic tissue.
Magnetic Resonance Imaging Cholangiography
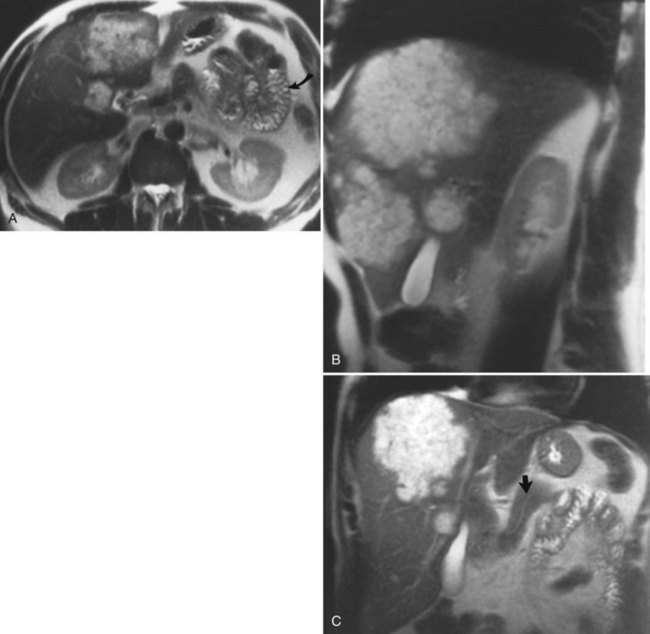
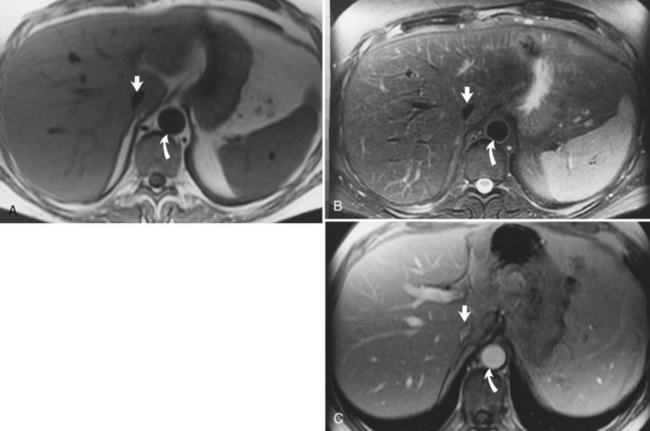
MRI cholangiography and MRI cholangiopancreatography (MRCP) are imaging techniques used to evaluate the biliary system. Heavily T2-weighted images are used to provide an overview of the biliary system and pancreatic duct. Excellent diagnostic-quality images are obtainable, with high sensitivity and specificity for evaluation of biliary duct dilation, strictures, and intraductal abnormalities (Sandrasegaran et al, 2010; Palmucci et al, 2010a; Palmucci et al, 2010b; Hekimoglu et al, 2008). Cross-sectional images and projection images (Fig. 17.2) may be produced easily with current MRCP techniques, and the projection images are similar to direct contrast-enhanced cholangiograms obtained with either endoscopic retrograde cholangiopancreatography (ERCP) or percutaneous transhepatic cholangiography (PTC; see Chapter 18).
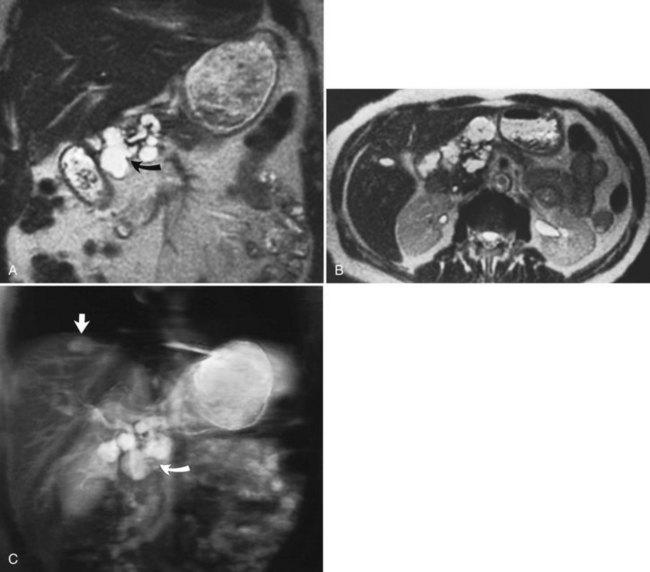
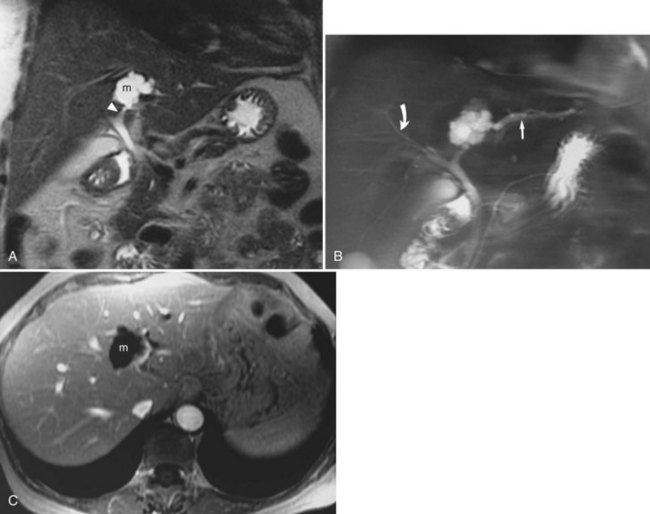
FIGURE 17.2 Cross-sectional images and projection image of the same patient as in Figure 17-1. A, Cross-sectional coronal image obtained at a slice thickness of 4 mm. A focal mass (arrow) in the pancreas is hyperintense and composed of multiple cysts. B, Axial image through the pancreas also shows the mass. C, Projection of the abdomen obtained at a slice thickness of 40 mm. The cystic mass within the pancreas (curved arrow) is easily identified. Fluid-containing structures and lesions that act like fluid are easily seen with this technique. Note a small hemangioma at the hepatic dome (straight arrow).
The basic principle of MRCP is to use T2-weighted images, in which stationary or slowly moving fluid, including bile, is high in signal intensity; all the surrounding tissues, including retroperitoneal fat and the solid visceral organs, are lower in signal. MR-specific techniques for obtaining cholangiographic images include two-dimensional and three-dimensional sequences, breath-hold or non–breath-hold techniques, and respiratory gated techniques. MRCP plays an important role in imaging benign disorders of the biliary and pancreatic system, and it is part of a comprehensive imaging evaluation of malignancies of the biliary system (Kim et al, 2002b; Lee et al, 2003; Vaishali et al, 2004). MRCP is noninvasive, eliminating the morbidity associated with ERCP or PTC (Zhong et al, 2004). An additional advantage of MRCP includes visualization of the extrabiliary anatomy, allowing for exclusion or inclusion of alternative diagnoses. Surgical clips may create an artifact known as susceptibility, which may obscure the region of interest by producing areas of signal void. This artifact may mimic a stone, so caution must be used in evaluating MRCP images in postoperative patients to avoid a false-positive diagnosis.
Magnetic Resonance Imaging Contrast Agents
MRI contrast agents work by altering the T1 and T2 relaxation times of various tissue types. In the hepatobiliary system, MRI contrast agents can potentially improve the detection of liver lesions and improve the characterization of focal liver abnormalities. MRI contrast agents for hepatobiliary imaging are divided into two basic categories: intracellular and extracellular agents. The most commonly used contrast agents are the extracellular agents, such as gadopentetate dimeglumine (gadolinium diethylenetriaminepentaacetic acid [Gd-DTPA]), which is distributed within the intravascular compartment initially and rapidly diffuses through the extravascular space, similar to the action of iodinated contrast agents in computed tomography (CT; see Chapter 16). Agents such as gadolinium require fast MRI pulse sequences to preferentially enhance either tumor or normal tissue, so that the difference between the two tissues is great. Metastatic liver lesions enhance irregularly, predominantly in the periphery of the lesion, and slowly; the central portion may or may not accumulate contrast material. Using extracellular contrast agents such as gadolinium and dynamic fast scanning, hepatic hemangiomas can be differentiated from other tumors by their characteristic enhancement patterns. Hepatic hemangiomas fill in slowly (5 to 20 minutes) from the periphery with a nodular appearance (see Chapter 79A, Chapter 79B ). An advantage of gadolinium over iodinated CT contrast agents is the lack of renal toxicity even at high doses (Prince et al, 1996). This fact has clinical implications in patients with decreased renal function or in those at risk for potential nephrotoxic effects of iodinated contrast agents.
Several new hepatobiliary-specific contrast agents have been developed to overcome some of the limitations associated with the general extracellular contrast agents. These hepatobiliary-specific contrast agents are taken up to varying degrees by functioning hepatocellular tissue and are excreted at least partially in the bile. They function because of their paramagnetic properties, which cause T1 shortening both of the liver and biliary tree. Hepatobiliary-specific agents include mangafodipir trisodium, gadopentetate dimeglumine, and gadoxetic acid, and both gadobentate dimeglumine (Gd-BOPTA) and gadolinium-ethoxybenzyl-diethylenetriamine pentaacetic acid (Gd-EOB-DPTA) have been approved in the United States. These contrast agents are all administered intravenously, although the dose and duration of the administration are different. These two agents are sometimes referred to as combination agents because of their dual capacity for imaging both in the dynamic phase and in the delayed, hepatocyte-specific phase. These agents have the potential to provide extensive and comprehensive information about the lobes of the liver, bile ducts, and liver vasculature. (Giovagnoni & Paci, 1996; Iman & Bluemke, 2000; Stern et al, 2000).
Normal Hepatic Appearance on Magnetic Resonance Imaging
Hepatic MRI is a sensitive technique to evaluate diffuse and focal abnormalities. In normal hepatic parenchyma on T1-weighted images, the liver is brighter (hyperintense) than the spleen. Depending on the specific technique chosen, the vessels may appear dark (flow voids on spin-echo technique), or they may be bright (gradient-echo technique). On T2-weighted images, the spleen is relatively brighter than the liver (Fig. 17.3). Fluid is dark on T1-weighted images and bright on T2-weighted images as a result of long T1 and T2 values. Although many hepatic lesions are low in signal intensity on T1-weighted images, they may be of variable intensity on T2-weighted images, depending on their water content.
Diffuse Hepatic Disease
Fatty Infiltration of the Liver
Fat may accumulate within hepatocytes for many reasons, including alcohol abuse, diabetes, drugs, and obesity (see Chapter 65). Fatty change may be diffuse, patchy, or focal. The pattern of fatty infiltration is related to regional differences in perfusion. It is often difficult to distinguish fatty infiltration from focal hepatic lesions on CT, because both appear low in attenuation. Additionally, focal fatty sparing may appear similar to a vascular neoplasm on contrast-enhanced CT. It is easy, however, to distinguish these entities on MRI because of different signal characteristics. On T1-weighted images, areas of fatty infiltration appear bright because of the low T1 value of fat. The appearance on T2-weighted images depends on the specific type of T2-weighted sequence acquired. Conventional spin-echo T2-weighted sequences are relatively insensitive to the presence of fat (Wenker et al, 1984). Areas of focal fatty infiltration may appear hyperintense to normal hepatic parenchyma on fast T2-weighted images because of the high signal intensity of fat in these sequences. Using chemically selective fat suppression techniques, these areas of focal fatty infiltration appear dark.
Chemical shift imaging is another technique that allows differentiation of the signals from fat and water protons. These chemical shift techniques are the most sensitive techniques for distinguishing fatty infiltration (Fig. 17.4; Mitchell et al, 1991; Siegelman, 1997; Springer et al, 2010). Chemical shift imaging techniques rely on the different resonant frequencies present in fat and water protons. Using fast imaging techniques, the signal emanating from fat and water protons may be equal but opposite. Tissues that have relatively equal quantities of fat and water appear dark, because the signals from fat and water cancel each other out. Areas of fatty sparing remain relatively hyperintense to the fatty infiltrated regions. Focal fatty infiltration should not enhance after gadolinium administration. A lesion with characteristic signal intensity findings on T1, T2, and gradient-echo opposed-phase imaging is diagnostic of fatty infiltration (Kreft et al, 1992; Mitchell et al, 1991). Any one of these sequences alone is not characteristic, because other lesions, including hepatocellular carcinoma (HCC) and adenoma, may contain small quantities of fat within them (see Chapter 78, Chapter 79A, Chapter 79B, Chapter 80 ).
Iron Deposition Disease
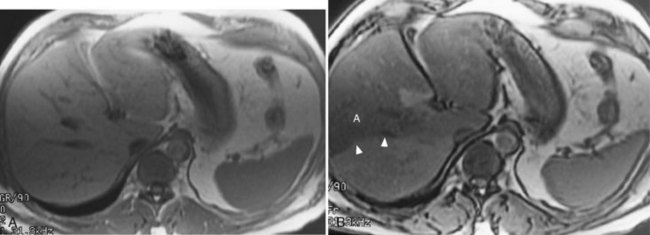
Hemochromatosis must be distinguished from hemosiderosis, which is not genetically linked but is associated with multiple blood transfusions; conversely, it has a benign course, with accumulation of hepatic iron in the reticuloendothelial system. MRI is excellent for identifying these entities, because iron changes the expected signal intensities of abdominal organs (Pomerantz & Siegelman, 2002; Queiroz-Andrade et al, 2009). In patients with hemochromatosis, the normal liver–spleen pattern is reversed on T1-weighted images. In more advanced stages, iron also is deposited in the pancreatic parenchyma. Hemosiderosis affects the spleen and bone marrow early on in the disease process, with the liver being affected later. These distinguishing characteristics, and the patient’s history, allow for correct differentiation; gradient-echo imaging is sensitive for the detection and characterization of these two processes (Fig. 17.5; Kim et al, 2002a; Rofsky & Fleishaker, 1995).
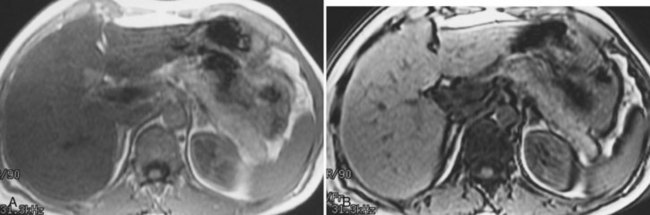
FIGURE 17.5 Hemochromatosis. A, T1-weighted in-phase gradient-echo image (TE 4.2) shows abnormal liver/spleen contrast. The liver is homogeneously darker than the spleen from preferential deposition of iron within the hepatic parenchyma. Note the difference from Figure 17.4. B, T1-weighted out-of-phase gradient-echo image (TE 1.8) shows the liver/spleen contrast returns to normal, with the liver being brighter than spleen. This is opposite from Figure 17.4 and shows early iron deposition disease within the liver.
Focal Hepatic Lesions
Cysts
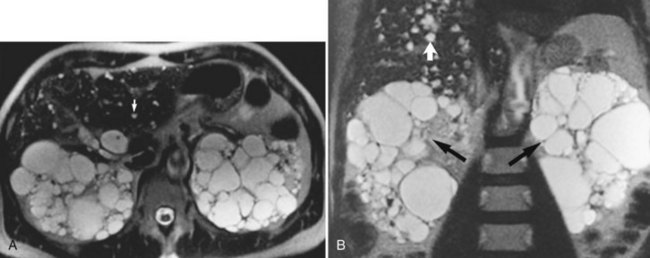
Cysts are common hepatic lesions that may be simple (see Chapter 69A, Chapter 69B ) or associated with polycystic disease of the kidney (Fig. 17.6). Small cysts (<1 cm) may be difficult to characterize on CT because of volume averaging. The MRI criteria for a simple cyst is a lesion that is homogeneously low in signal intensity on T1-weighted images and homogeneously bright on T2-weighted images. Lengthening the TE value on T2-weighted images allows for “heavier” T2 weighting. Cysts maintain their high signal on these heavy T2 images, and a cyst should not enhance after Gd-DTPA administration. Hepatic cysts may also be associated with infectious causes, such as echinococcal disease. Echinococcal cysts (see Chapter 68) have a different MRI appearance, are usually multiloculated and complex, and may have components that enhance (Mortele et al, 2009).
Hemangioma
Hepatic hemangiomas (see Chapter 79A, Chapter 79B ) are benign tumors of the liver found in 7.3% of autopsy specimens (Birnbaum et al, 1990; Ishak & Rabin, 1986). Most hemangiomas are found incidentally on other imaging studies, such as CT or ultrasound. MRI is ideal for characterizing hemangiomas and is the preferred modality for imaging. On T1-weighted images, hemangiomas are hypointense compared with the surrounding hepatic parenchyma; have smooth, well-marginated borders; and are frequently lobulated. Hemangiomas are hyperintense compared with normal liver on T2-weighted images and have a lobulated, well-demarcated border. Hemangiomas tend to retain their high signal on more heavily T2-weighted sequences. The presence of hyperintense peripheral nodular enhancement, especially when large, with either partial or complete filling in after gadolinium administration has been shown to be 100% specific, 84% sensitive, and 95% accurate for the diagnosis of hemangioma (Fig. 17.7; Silva et al, 2009; Mathieu et al, 1997; Semelka & Sofka, 1997).
Dynamic fast MRI after administration of intravenous gadolinium is useful for increasing the specificity of diagnosis of hepatic hemangioma and for differentiating this lesion from others, including metastases and HCCs (Yoon et al, 2003). Larger hemangiomas tend to follow these criteria more frequently, although giant hemangiomas also may have variable signal intensity (Danet et al, 2003; Yang et al, 2001). Problems arise with smaller hemangiomas, however, which may “flash fill” and appear as hypervascular lesions. These smaller lesions (usually <1 cm) may be distinguished by their T2 characteristics (Outwater et al, 1997). Hemangiomas also may be diagnosed after the administration of iron-based contrast agents (Harisinghani et al, 1997).
Focal Nodular Hyperplasia
Focal nodular hyperplasia (FNH; see Chapter 79A) is another common benign tumor of the liver, although it occurs less frequently than hemangioma. Pathologically, FNH contains all the elements of normal liver and may have a central fibrous scar surrounded by hepatocytes and small bile ducts. FNH is the second most common benign tumor of the liver, and it has been associated with oral contraceptive use (Christopherson et al, 1977). Most FNH lesions are isointense or slightly hypointense compared with the normal liver parenchyma on T1-weighted images, and they are either isointense or minimally hyperintense on T2-weighted images (Fig. 17.8A and B). Frequently, FNH is visualized by displacement of the normal hepatic vasculature, and classic FNH has an early arterial peak enhancement with dynamic administration of an intravenous contrast agent.
A common feature of FNH is the presence of a central scar. Generally, this scar is hypointense on T1-weighted images and hyperintense on T2-weighted images. The central scar shows contrast enhancement as well, but in a delayed fashion and with prolonged enhancement (Fig. 17.8C; Mortele et al, 2002). Superparamagnetic iron oxide contrast agents are taken up by FNH, because the FNH contains Kupffer cells. Many reports indicate that FNH takes up a significant percentage of superparamagnetic iron oxide particles after administration, showing signal loss (Grazioli et al, 2005). This finding is consistent with the experience of nuclear scanning with technetium 99m–sulfur colloid. Lesions of FNH can be characterized with a high degree of specificity using a variety of MRI techniques (Silva et al, 2009; see Chapter 79A).
Hepatic Adenoma
Hepatic adenomas (see Chapter 79A) also are benign lesions associated with the use of oral contraceptives. They are commonly large, may cause upper abdominal pain, and may rupture and bleed. Hepatocytes are present within adenomas; however, these lesions lack hepatic veins and bile ducts. In addition, there are only a few if any reticuloendothelial cells present, and iron oxide scans show less uptake than with scans of FNH. Hemorrhage, which is one of the most common causes of pain, may be life threatening if it extends into the peritoneum. MRI tissue characterization of hepatic adenomas varies, but they are generally hyperintense on T1-weighted images because of the presence of hemorrhage or fat. Infrequently, the T1-weighted images may show a low signal intensity pseudocapsule surrounding the adenoma, similar in appearance to HCC (Gabata et al, 1990). A central scar also may be seen within certain adenomas (Rummeny et al, 1989). Adenomas are hypervascular lesions that show enhancement during the arterial dominant phase of the contrast injection. Small adenomas without hemorrhage may be difficult to differentiate from FNH without a central scar and from well-differentiated HCC.
Hepatic Abscesses
CT is generally the modality of choice in recent postoperative patients in whom there is a clinical suspicion of a hepatic abscess (see Chapter 66). Patients with more atypical symptoms may present a diagnostic dilemma. Although some patients show symptoms suggesting abscesses, others do not, but patients suspicious for abscesses may be imaged with MRI. Abscesses are usually hyperintense on T2-weighted images with an irregular rim of intermediate signal intensity surrounding a hyperintense outer rim. Abscesses are generally hypointense on T1-weighted images, unless they have hemorrhage or proteinaceous debris within them. After administration of contrast material, the rim enhances, whereas the central portion does not enhance. The imaging findings may overlap with malignancies, including gallbladder cancer.
Hepatic Metastases
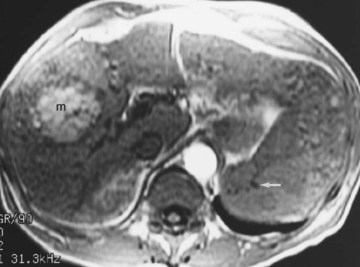
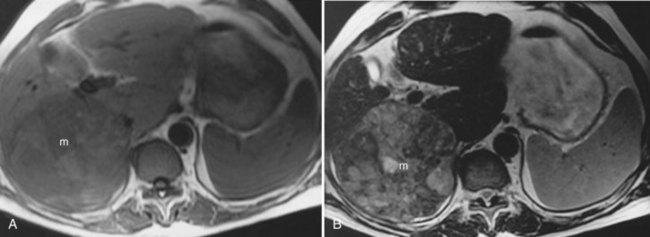
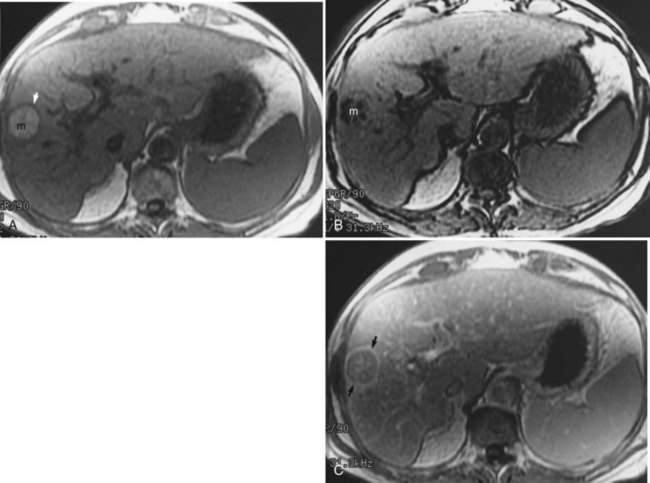
The liver is the most common site for the hematogenous spread of malignant neoplasms (see Chapter 81A, Chapter 81B, Chapter 81C ). Other hepatic lesions, including hemangiomas or fatty infiltration, may appear similar to metastases when imaged with CT or ultrasound. In addition, several types of lesions may coexist in the same patient, which may be challenging for the diagnostic radiologist. These lesions may be distinguished using MRI. In general, metastases are of low signal intensity on T1-weighted images and are hyperintense on T2-weighted images. Metastases tend not to be as bright on T2-weighted images as hemangiomas or cysts. Metastases also tend to have less well-defined borders than other benign lesions and may have peripheral high signal intensity, which has been shown to represent viable tumor (Fig. 17.9). During contrast administration, metastases may show early peripheral rim enhancement. This peripheral rim washes out and appears hypointense on delayed images (Fig. 17.10). Although this delayed hypointense rim is seen in only a few cases, it is 100% specific for the diagnosis of hepatic malignancy (Mahfouz et al, 1994). Larger metastases tend to have a thick irregular rim of enhancement representing viable tumor with areas of central necrosis. MRI is less invasive and more cost effective than CT arterial portography and is an excellent screening tool for staging hepatic metastases for surgical resection (Iman & Bluemke, 2000). In addition, MRI can easily map out hepatic vasculature and image in multiple planes—coronal, sagittal, and oblique—to allow for complete surgical planning.
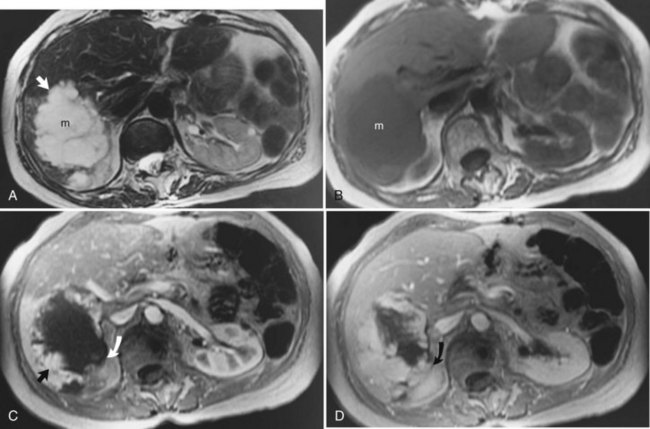
FIGURE 17.9 Hepatic metastasis from colorectal carcinoma. A, T1-weighted image shows a large, central, low signal intensity metastasis (m) with several smaller lesions within the liver. B, T2-weighted image shows the mass (m) is brighter than background hepatic parenchyma. The borders are ill defined, and there appear to be internal septations within this lesion. The periphery of the lesion is a rind of tissue (arrow) that is mildly hyperintense to liver but darker than the central portion of the mass. C, Pre–contrast-enhanced, T1-weighted gradient-echo image shows the large hepatic metastasis (m) in contrast to the normal hepatic parenchyma. D, Pre–contrast-enhanced, T1-weighted gradient-echo images fail to show the peripheral portion (arrow), and internal septations have enhanced, representing viable tumor, whereas the central necrotic portion (arrowhead) fails to enhance. Note the distinct difference in appearance from hemangioma (see Fig. 17.7).
Hepatocellular Carcinoma
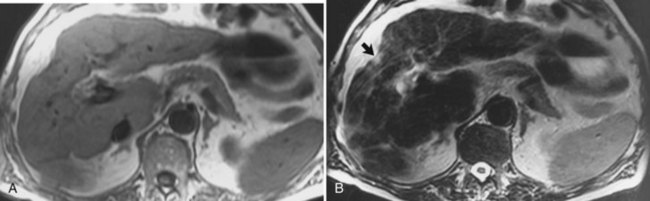
The diagnosis of HCC (see Chapter 80) on CT and ultrasound is difficult because of its association with chronic liver disease, which appears heterogeneous on CT and MRI (Fig. 17.11), making it difficult to distinguish focal hepatic lesions in these patients. The heterogeneity is created by the presence of a nodular configuration. These nodules may represent regenerative nodules, dysplastic nodules, or HCC. The advantage of MRI in the evaluation of HCC is that areas of carcinoma show signal intensity changes relative to areas of cirrhotic hepatic parenchyma. HCC generally is hypointense on T1-weighted images and hyperintense on T2-weighted images, although the signal intensity can be variable in these sequences (Silva et al, 2009). Well-differentiated HCC is hyperintense on T1-weighted images because of the presence of intracellular lipid (Fig. 17.12; Basaran et al, 2005). On T2-weighted images, large HCCs may have a “mosaic” appearance produced by multiple centers of growth interspersed with areas of necrosis and regenerating liver tissue (Fig. 17.13; Choi et al, 1990; Fujita et al, 1997; Lalonde et al, 1992). The fibrolamellar type of HCC may have a central scar. These fibrous scars tend to be low in signal intensity on T1-weighted and T2-weighted images. The presence of this fibrous scar cannot reliably distinguish between benign and malignant hepatic lesions, however, because FNH also may have a central scar (Kim et al, 2009).
Gradient echo (bright blood technique), MRI, and other flow-sensitive techniques are excellent for evaluating vascular hepatic tumor invasion. MRI is more sensitive than CT, sonography, or angiography for detecting vascular intrahepatic invasion (Itoh et al, 1987). Contrast-enhanced MRI with Gd-DTPA shows irregular and variable patterns of enhancement owing to the vascular nature of the tumor. Most HCCs are hypervascular in nature and show enhancement during the arterial dominant phase of the injection, in contrast to other nodules seen in cirrhotic livers. Those lesions tend to be isointense to the background liver parenchyma during the equilibrium phase of the examination. Although HCCs are typically hypervascular lesions, multiple dysplastic nodules appearing as hypervascular masses on CT and MRI has been reported (Krinsky et al, 1998; Taouli et al, 2004). MRI also is excellent for identifying additional characteristics that may aid in the diagnosis of HCC, including a capsule surrounding the lesion, which is low in signal intensity on the arterial dominant phase and enhances on delayed images (Fig. 17.14).
Less Common Hepatic Tumors
Lymphoma
Non-Hodgkin lymphoma accounts for most hepatic lymphomas. MRI shows masses of varying size, which are generally low in signal intensity on T1-weighted images and hyperintense on T2-weighted images (Rizzi et al, 2001). The degree of hyperintensity is not as great as with other focal benign hepatic lesions, such as hemangiomas or cysts. This difference in signal intensity makes it relatively easy to determine the malignant nature of the lesion but not the specific cause. The imaging characteristics of lymphoma overlap with other malignant hepatic lesions.
Mesenchymal Tumors
Rarely, tumors of mesenchymal origin—including angiosarcoma, leiomyosarcoma, and fibrous histiocytoma—may be present within the liver (Anderson et al, 2009). The MRI appearance of these tumors is nonspecific; they are generally of low intensity on T1-weighted images and hyperintense on T2-weighted images.
Epithelioid Hemangioendothelioma
Epithelioid hemangioendothelioma (EH) is a rare tumor of adults that should be distinguished from infantile hemangioendothelioma, which occurs in infants and children. The prognosis is better for EH than for other parenchymal tumors, such as sarcoma, although extrahepatic metastases do occur. EH is generally low in signal intensity on T1-weighted images and hyperintense on T2-weighted images, but not as hyperintense as hemangiomas. After Gd-DTPA administration, an irregular nodular and concentric enhancement may be seen. Capsular retraction also may be seen with EH, helping to elucidate the diagnosis (Lin et al, 2010).
Biliary Cystadenoma and Biliary Cystadenocarcinomas
Biliary cystadenomas and biliary cystadenocarcinomas are rare tumors of the liver that present as a predominantly cystic mass containing septations (Fig. 17.15; see Chapter 79B). These lesions may be of low, intermediate, or increased signal on T1-weighted images, depending on the protein content within the mass, and they are usually hyperintense on T2-weighted sequences. The malignant variety may show nodular or irregular internal soft tissue; however, distinction between the two is not always possible.
Biliary Tumors
Gallbladder Carcinoma
Gallbladder carcinoma (see Chapter 49) is well evaluated with MRI. This entity is best seen on T2-weighted images as thickening of the gallbladder wall, generally adjacent to multiple gallstones. Cholelithiasis is a predisposing condition. Evidence of liver invasion and spread to regional lymph nodes also may be identified with MRI, which is optimal for evaluation of these lesions because of its outstanding tissue contrast and ability to image directly in multiple planes (Dai et al, 2009; Schwartz et al, 2002; Sikora et al, 2006).
Bile Duct Cancer
Bile duct tumors (see Chapters 50A and 50B) are easily seen on MRI. Central lesions (hilar cholangiocarcinomas) are generally associated with biliary dilation, which is bright on T2-weighted images. The central tumors may be seen as areas of mildly hyperintense signal on T2-weighted images (Fig. 17.16), less so than the surrounding biliary dilation. The level of obstruction and continuity of the tumor with the vasculature are well evaluated with MRI (Lee et al, 2003; Schwartz et al, 2003). Peripheral or intrahepatic cholangiocarcinomas generally present as high signal intensity masses on T2-weighted images. They may appear similar to other malignant neoplasms of the liver, but they generally do not have capsules or areas of high signal intensity on T1-weighted images as may be seen in HCCs. Distinction of peripheral cholangiocarcinoma and confluent hepatic fibrosis is sometimes difficult; however, late enhancement is seen in the malignant lesion.
Benign Diseases of the Biliary Tract
Cholelithiasis
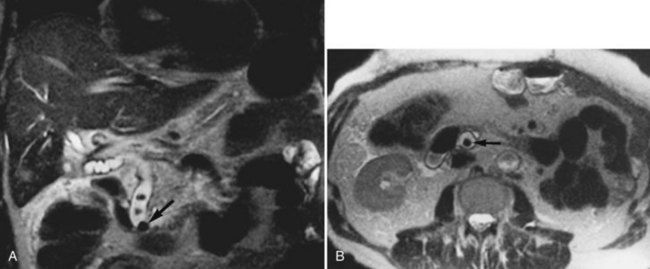
Gallstones are easily identifiable on T2-weighted images and on MRCP sequences (Fig. 17.17; see Chapter 30). They usually appear as low signal intensity structures in a fluid-filled gallbladder. MRI is usually not the modality of choice in the evaluation of cholelithiasis, because ultrasound is highly sensitive and less expensive in uncomplicated cases, but choledocholithiasis can be imaged effectively by MRI (Johnson et al, 2010; Samaraee et al, 2009). Common duct stones are relatively uncommon in children (Rescorla, 1997) but are more common in elderly patients (Catheline et al, 1998; Gonzalez et al, 1997). Direct coronal T2-weighted imaging, readily available with MRI, easily identifies common duct stones. In addition, if multiple stones are present in the common duct, they too should be identifiable by MRI (see Fig. 17.17). MRCP can also be obtained to evaluate whether retained stones are present after cholecystectomy. If no stones are present on MRCP, this may obviate the need for ERCP.
Choledochal Cysts
Choledochal cysts (see Chapter 46) represent dilation of the extrahepatic bile ducts with possible associated intrahepatic biliary duct dilation. This entity is a relatively uncommon congenital anomaly that usually presents before 10 years of age. The classic triad includes a palpable mass, abdominal pain, and jaundice. Five types of cysts have been described (Todani et al, 1977): type I has been subdivided into A, B, and C, in addition to types II, III, IVa and IVb, and V. MRI is well suited not only to diagnose these cysts but also to classify the type of cyst. Not only can MRI cholangiograms be generated to depict the normal and abnormal anatomy, but also direct coronal imaging can be obtained for clearer evaluation.
Postoperative Biliary Complications
Complications from surgical procedures include bile leaks, abscess formation, and biliary strictures (see Chapter 25, Chapter 42A, Chapter 42B ). Although using other imaging modalities in the immediate postoperative setting to assess for bile leaks and abscesses may be prudent, MRI is uniquely suited for the assessment of the postoperative biliary tract. Bile duct injuries after surgery can be caused by a number of things, but these may all lead to the same result—a stricture at the anastomotic site. MRI using long-echo train-length imaging (MRCP technique) is uniquely suited for addressing this problem. Surgical clips near the anastomosis may create streak artifacts during CT scanning. MRI has multiplanar capabilities and superior tissue contrast, and MRCP sequences can minimize susceptibility to artifacts, owing to multiple 180-degree refocusing pulses; this can allow for improved visualization of the region of the anastomosis and improved diagnostic confidence (Fig. 17.18; Coakley et al, 1998).
Pancreas
Pancreatic Cancer
Pancreatic carcinoma (see Chapter 58A, Chapter 58B ) is well evaluated on MRI and MRCP. The faster MRI sequences help stage patients with pancreatic cancer and help to characterize lesions of the pancreas. MRI is generally thought to be highly accurate in assessing for vascular invasion, local-regional tumor extension, and liver metastases (Hanninen et al, 2002). Similar to other modalities, accuracy is limited for assessment of lymph node metastases with conventional and fast MRI techniques. Newer lymph node–specific contrast agents may play a role in improving the specificity of MRI for detection of lymph node metastases.
Cystic Lesions of the Pancreas
Pancreatic cystic lesions (see Chapter 57) are relatively common imaging findings and are usually secondary to benign processes, but they may be malignant. Multiple imaging modalities may be used to identify and visualize pancreatic cystic lesions including ultrasound, CT, and MRI. Soft-tissue contrast is optimal with MRI imaging, which permits optimal depiction of the internal features of pancreatic cysts, such as septations, nodularity, and soft-tissue masses. One particularly useful sequence is the single-shot fast spin-echo sequence. Cystic lesions are high in T2 and are bright on these sequences (Zhang et al, 2002; Acar et al, 2010). Evaluation after contrast (Gd-DTPA) administration helps assess cyst wall irregularity or enhancement. Intraductal papillary mucinous tumors may be distinguished from other lesions on MRI by combining ductal visualization with postcontrast images (Lim et al, 2001).
Acar M, Tatli S. Cystic tumors of the pancreas: a radiological perspective. Diagn Interv Radiol. 2011;17(2):143-149.
Anderson SW, et al. Benign hepatic tumors and iatrogenic pseudotumors. Radiographics. 2009;29:211-229.
Basaran C, et al. Fat-containing lesions of the liver: cross-sectional imaging findings with emphasis on MRI. Am J Roentgenol. 2005;184:1103-1110.
Birnbaum BA, et al. Definitive diagnosis of hepatic hemangiomas: MR imaging versus Tc-99m-labeled red blood cell SPECT. Radiology. 1990;176:95-101.
Bloch F, et al. The nuclear induction experiment. Physical Rev. 1946;70:474-485.
Catheline JM, et al. Evaluation of the biliary tree during laparoscopic cholecystectomy: laparoscopic ultrasound versus intraoperative cholangiography: a prospective study of 150 cases. Surg Laparosc Endosc. 1998;8:85-91.
Choi BI, et al. Mosaic pattern of encapsulated hepatocellular carcinoma: correlation of magnetic resonance imaging and pathology. Gastrointest Radiol. 1990;15:238-240.
Christopherson WM, et al. Clinicopathologic study of steroid-related liver tumors. Am J Surg Pathol. 1977;1:31-41.
Coakley FV, et al. Complex postcholecystectomy biliary disorders: preliminary experience with evaluation by means of breath-hold MR cholangiography. Radiology. 1998;209:141-146.
Dai M, et al. Treatment of T3 gallbladder cancer. J Gastrointest Surg. 2009;13:2040-2042.
Damadian R. Tumor detection by nuclear magnetic resonance. Science. 1971;171(3976):1151-1153.
Danet IM, et al. Giant hemangioma of the liver: MR imaging characteristics in 24 patients. Magn Reson Imaging. 2003;21:95-101.
Fujita T, et al. High-resolution dynamic MR imaging of hepatocellular carcinoma with a phased-array body coil. Radiographics. 1997;17:315-335.
Gabata T, et al. MR imaging of hepatic adenoma. Am J Roentgenol. 1990;155:1009-1011.
Giovagnoni A, Paci E. Liver: III. Gadolinium-based hepatobiliary contrast agents (Gd-EOB-DTPA and Gd-BOPTA/dimeg). Magn Reson Imaging Clin North Am. 1996;4:61-72.
Gonzalez JJ, et al. Biliary lithiasis in the elderly patient: morbidity and mortality due to biliary surgery. Hepatogastroenterology. 1997;44:1565-1568.
Grazioli L, et al. Accurate differentiation of focal nodular hyperplasia from hepatic adenoma at gadobenate dimeglumine–enhanced MR imaging: prospective study. Radiology. 2005;236:166-177.
Hanninen EL, et al. Prospective evaluation of pancreatic tumors: accuracy of MR imaging with MR cholangiopancreatography and MR angiography. Radiology. 2002;224:34-41.
Harisinghani MG, et al. Differentiation of liver hemangiomas from metastases and hepatocellular carcinoma at MR imaging enhanced with blood-pool contrast agent Code-7227. Radiology. 1997;202:687-691.
Hekimoglu K, et al. MRCP vs. ERCP in the evaluation of biliary pathologies: review of current literature. J Dig Dis. 2008;9:162-169.
Iman K, Bluemke DA. MR imaging in the evaluation of hepatic metastases. Magn Reson Imaging Clin North Am. 2000;8:741-756.
Ishak KG, Rabin L. Benign tumors of the liver. Med Clin North Am. 1986;59:995-1013.
Itoh K, et al. Hepatocellular carcinoma: MR imaging. Radiology. 1987;164:21-25.
Johnson C, et al. Detection of gallstones in acute pancreatitis: when and how? Pancreatology. 2010;10:27-32.
Kim MJ, et al. Hepatic iron deposition on magnetic resonance imaging: correlation with inflammatory activity. J Comput Assist Tomogr. 2002;26:988-993.
Kim RK, et al. Diagnosis of intrahepatic stones: superiority of MR cholangiopancreatography over endoscopic retrograde cholangiopancreatography. AJR Am J Roentgenol. 2002;179:429-434.
Kim T, et al. Liver masses with central or eccentric scar. Semin Ultrasound CT MR. 2009;30:418-425.
Kreft BP, et al. Diagnosis of fatty liver with MR imaging. J Magn Reson Imaging. 1992;2:463-471.
Krinsky GA, et al. Dysplastic nodules in cirrhotic liver: arterial phase enhancement at CT and MR imaging—a case report. Radiology. 1998;209:461-464.
Lalonde L, et al. Capsule and mosaic pattern of hepatocellular carcinoma: correlation between CT and MR imaging. Gastrointest Radiol. 1992;17:241-244.
Lauterbur PC. Image formation by induced local interactions: examples employing nuclear magnetic resonance. Nature. 1973;242:190-191.
Lee MG, et al. Preoperative evaluation of hilar cholangiocarcinoma with contrast-enhanced three-dimensional fast imaging with steady-state precession magnetic resonance angiography: comparison with intraarterial digital subtraction angiography. World J Surg. 2003;3:278-283.
Lim JH, et al. Radiologic spectrum of intraductal papillary mucinous tumor of the pancreas. Radiographics. 2001;21:323-340.
Lin J, et al. CT and MRI diagnosis of hepatic epithelioid hemangioendothelioma. Hepatibiliary Pancreat Dis Int. 2010;9:154-158.
Mahfouz AE, et al. Peripheral washout: a sign of malignancy on dynamic gadolinium-enhanced MR images of focal liver lesions. Radiology. 1994;190:49-52.
Mathieu D, et al. Benign liver tumors. Magn Reson Imaging Clin North Am. 1997;5:255-288.
Mitchell DG, et al. Fatty liver: chemical shift phase-difference and suppression magnetic resonance imaging techniques in animals, phantoms, and humans. Invest Radiol. 1991;26:1041-1052.
Mortele KJ, et al. Focal nodular hyperplasia of the liver: detection and characterization with plain and dynamic-enhanced MRI. Abdom Imaging. 2002;27:700-707.
Mortele KJ, et al. Multimodality imaging of common and uncommon cystic focal liver lesions. Semin Ultrasound CT MR. 2009;30:368-386.
Outwater EK, et al. Rapidly enhancing hepatic hemangiomas at MRI: distinction from malignancies with T2-weighted images. J Magn Reson Imaging. 1997;7:1033-1039.
Palmucci S, et al. Magnetic resonance cholangiopancreatography and contrast-enhanced magnetic resonance cholangiopancreatography versus endoscopic ultrasonography in the diagnosis of extrahepatic biliary pathology. Radiol Med. 2010;115:732-746.
Palmucci S, et al, 2010b: Evaluation of the biliary and pancreatic system with 2D SSFSE, breathhold 3D FRFSE and respiratory-triggered 3D FRFSE sequences.
Pomerantz S, Siegelman ES. MR imaging of iron depositional disease. Magn Reson Imaging Clin North Am. 2002;10:105-120.
Prince MR, et al. Nephrotoxicity of high-dose gadolinium compared with iodinated contrast. J Magn Reson Imaging. 1996;6:162-166.
Purcell EM, et al. V. Resonance absorption by nuclear magnetic moments in a solid. Physical Rev. 1946;69:37.
Queiroz-Andrade M, et al. MR imaging findings of iron overload. Radiographics. 2009;29:1575-1589.
Rescorla FJ. Cholelithiasis, cholecystitis, and common bile duct stones. Curr Opin Pediatr. 1997;9:276-282.
Rizzi EB, et al. Non-Hodgkin’s lymphoma of the liver in patients with AIDS: sonographic, CT, and MRI findings. J Clin Ultrasound. 2001;29:125-129.
Rofsky NM, Fleishaker H. CT and MRI of diffuse liver disease. Semin Ultrasound CT MR. 1995;16:16-33.
Rummeny E, et al. MR imaging of liver neoplasms. AJR Am J Roentgenol. 1989;152:493-499.
Samaraee AI, et al. Preoperative diagnosis of choledocholithiasis: the role of MRCP. Br J Hosp Med. 2009;70:339-343.
Sandrasegaran K, et al. State-of-the-art pancreatic MRI. Am J Roentgenol. 2010;195:42-53.
Schwartz K, et al. Gallbladder carcinoma: findings at MR imaging with MR cholangiopancreatography. J Comput Assist Tomogr. 2002;26:405-410.
Schwartz LH, et al. Breath-hold magnetic resonance cholangiopancreatography in the evaluation of malignant pancreaticobiliary obstruction. J Comput Assist Tomogr. 2003;27:307-314.
Semelka RC, Sofka CM. Hepatic hemangiomas. Magn Reson Imaging Clin North Am. 1997;5:241-253.
Siegelman ES. MR imaging of diffuse liver disease: hepatic fat and iron. Magn Reson Imaging Clin North Am. 1997;5:347-365.
Sikora SS, et al. Surgical strategies in patients with gallbladder cancer: nihilism to optimism. J Surg Oncol. 2006;93:670-681.
Silva AC, et al. MR imaging of hypervascular liver masses: a review of current techniques. Radiographics. 2009;29:385-402.
Springer F, et al. Quantitative assessment of intrahepatic lipids using fat-selective imaging with spectral-spatial excitation and in opposed-phase gradient echo imaging techniques within a study population of extremely obese patients: feasibility on a short, wide-bore MR scanner. Invest Radiol. 2010;45:484-490.
Stern W, et al. Dynamic MR imaging of liver metastases with Gd-EOB-DTPA. Acta Radiol. 2000;41:255-262.
Taouli B, et al. Magnetic resonance imaging of hepatocellular carcinoma. Gastroenterology. 2004;127(5 Suppl 1):S144-S152.
Todani T, et al. Congenital bile duct cysts: classification, operative procedures, and review of thirty-seven cases including cancer arising from choledochal cyst. Am J Surg. 1977;134:263-269.
Vaishali MD, et al. Magnetic resonance cholangiopancreatography in obstructive jaundice. J Clin Gastroenterol. 2004;38:839-840.
Wenker JC, et al. Focal fatty infiltration of the liver: demonstration by magnetic resonance imaging. AJR Am J Roentgenol. 1984;143:5730-5734.
Yang DM, et al. Capsular retraction in hepatic giant hemangioma: CT and MR features. Abdom Imaging. 2001;26:36-38.
Yoon SS, et al. Diagnosis, management, and outcomes of 115 patients with hepatic hemangioma. J Am Coll Surg. 2003;197:392-402.
Zhang X, et al. Pancreatic cysts: depiction on single-shot fast spin-echo MR images. Radiology. 2002;223:547-553.
Zhong L, et al. Magnetic resonance cholangiopancreatography. Chin J Dig Dis. 2004;5:139-148.