Chapter 11 Focal Atrial Tachycardia
Classification of Atrial Tachycardias
Therefore, ECG-based classifications are obsolete for this purpose, and a mechanistic classification of ATs has been proposed (Table 11-1).1,2 If the mechanism of AT or AFL can be elucidated, either through conventional mapping and entrainment or with special multipoint mapping techniques, description of the mechanism should be stated. However, even when using this classification, there are other tachycardias described in the literature that cannot be well classified because of inadequate understanding of their mechanisms, including “type II” AFL, inappropriate sinus tachycardia, and fibrillatory conduction from a focal source with rapid, regular discharge.
| Focal Atrial Tachycardia | ||
Pathophysiology
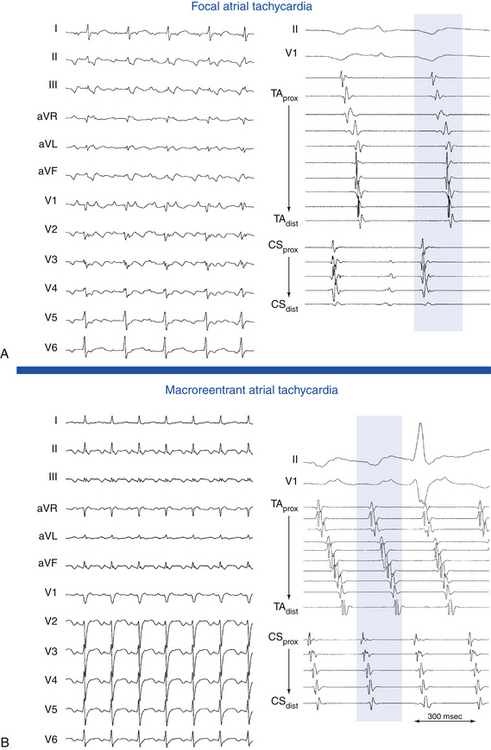
Focal AT is characterized by atrial activation starting rhythmically at a small area (focus), from which it spreads out centrifugally.1 “Focal” implies that the site of origin cannot be mapped spatially beyond a single point or a few adjacent points with the resolution of a standard 4-mm-tip catheter. In contrast, macroreentrant AT is defined by activation that can be recorded over the entire tachycardia CL around a large central obstacle, which is generally several centimeters in diameter.1 Relatively small reentry circuits may resemble focal AT, especially if limited numbers of endocardial recordings are collected. The term localized reentry has been used to refer to reentry in which the circuit is localized to a small area (covering a surface diameter of less than 3 cm) and does not have a central obstacle. Focal AT CL is usually longer than 250 milliseconds; however, it can be as short as 200 milliseconds. Over a prolonged period of observation (minutes to hours), the AT CL can exhibit significant variations.
Most focal ATs arise from the right atrium (RA), approximately two thirds of which are distributed along the long axis of the crista terminalis (cristal tachycardias) from the sinus node to the coronary sinus (CS) and atrioventricular (AV) junction (called the “ring of fire”), with an apparent gradation in frequency from superior to inferior.3,4 This particular anatomical distribution of ATs may be related to the marked anisotropy characterizing the region of the crista terminalis. Such anisotropy, which is related to the poor transverse cell-to-cell coupling, favors the development of microreentry by creating regions of slow conduction. Fractionated electrograms often seen at a successful AT ablation site may be markers of the requisite nonuniformly anisotropic substrate. In addition, the normal sinus pacemaker complex is distributed along the long axis of the crista terminalis. The presence of automatic tissue, together with relative cellular uncoupling, may be a requirement for abnormal automaticity such that a normal atrium is prevented from electrotonically inhibiting abnormal phase 4 depolarization. The presence of structural heart disease increases the probability of RA location of the AT, but from sites outside the crista terminalis.
The pulmonary vein (PV) ostia are the most common sites of origin of focal tachycardias within the left atrium (LA), and they account for between 3% and 29% of all focal ATs and approximately 67% of LA ATs.5–7 Other sites of AT clustering include the CS ostium (CS os),4,8–11 mitral and tricuspid annuli,3,5,12,13 bases of RA and LA appendages, para-Hisian region, and atrial septum. Experience gained during catheter ablation of atrial fibrillation (AF) has indicated that focal ATs also can arise within the vein of Marshall, superior vena cava (SVC),14 or inferior vena cava (IVC). ATs have been described originating from the noncoronary cusp of the aortic valve. The distribution of AT foci may differ, depending on the patient population.15,16
Available information suggests that focal activity can be caused by automaticity, triggered activity, or microreentry. There is some overlap based on the pharmacological characterization of these different AT mechanisms. Delineating the mechanism of focal AT, however, can be difficult, and the means of distinguishing focal AT mechanisms are fraught with exceptions.17 The major limiting factor in the analysis of mechanisms is the absence of a gold standard for determining the tachycardia mechanism, so these remain largely descriptive. In addition, there is a significant overlap in the EP characteristics of tachycardias with differing mechanisms.18 It is especially difficult to discriminate definitively between triggered activity and microreentry as a mechanism of focal AT; therefore, some investigators have classified focal ATs as automatic or nonautomatic.1 Furthermore, it is not clear that making such mechanistic distinctions among various types of focal ATs carries any clinical significance, although it is possible that such information could be useful in guiding drug therapy. In contrast, determination of the likely focal versus macroreentrant mechanism is critical for planning mapping and ablation strategy.
The term “incessant” is applied to an AT that is present for at least 50% of the time that a patient is monitored.19 Incessant AT frequently is automatic, but it can also be secondary to reentry or triggered activity. Incessant tachycardias occur in approximately 25% of patients with focal AT. Foci arising from the atrial appendages and PVs are frequently incessant.20
Arrhythmias originating from the PVs can have a critical role in the development of AF in susceptible individuals. Focal ATs arising from the PVs, however, appear to be a distinct clinical entity from the PV arrhythmias associated with AF. Patients with focal PV ATs do not seem to be at risk of AF in the long term; they resemble patients with focal ATs originating elsewhere with a localized isolated substrate that is successfully addressed with a focal ablative approach. Several potential explanations have been suggested for the different behavior. The underlying pathophysiological process in patients with AF is probably fundamentally different. It is a generalized process diffusely affecting the muscular sleeves in all four PVs, with frequently multiple PV foci originating distally (up to 2 to 4 cm) within the vein, compared with the focal nature of the process in patients with isolated PV tachycardia. Additionally, the CLs of the PV ATs are longer (mean CL 340 milliseconds) than the reported CLs of PV tachycardia in AF patients (130 milliseconds). The CL of AT also tends to be irregular in patients with AF but not in patients with PV AT. It is possible that foci with shorter CL and irregular activity may not conduct in a 1:1 fashion from the PV to the LA, with resulting fibrillatory conduction and AF. Furthermore, patients with AF tend to be older than those with PV AT and consequently more prone to more widespread atrial remodeling associated with age, hypertension, or other pathologic processes.6,7,21,22
Up to 10% of patients with focal AT have ATs with more than one focus. In these patients, the AT appears to have different EP characteristics from focal AT with a single focus, because it tends to involve the LA and has greater cardiovascular comorbidity, shorter CL, longer total activation time, and lower acute and long-term success rates of catheter ablation.23
Other forms of AT in which EP testing and catheter ablation are not indicated are beyond the scope of this chapter and are discussed briefly. Multifocal AT is usually caused by enhanced automaticity and is characterized by varying morphology of the P waves and the PR interval (Fig. 11-1). This finding suggests that the pacemaker arises in different atrial locations, but a single focus with different exit pathways or abnormalities in intraatrial conduction can produce identical electrocardiographic manifestations. Nonparoxysmal AT typically occurs in patients with significant heart disease or digitalis toxicity, or both. The latter may be caused by triggered activity. Repetitive automatic AT, also called repetitive focal AT, is thought to be caused in most cases by enhanced automaticity. It frequently occurs in patients with structural heart disease and is often related to some acute event, such as a myocardial infarction, pulmonary decompensation, infection, alcohol excess, hypokalemia, hypoxia, or use of stimulants, cocaine, or theophylline.
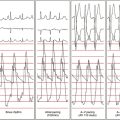
Early studies of sinus node function described the response to a single atrial extrastimulus (AES). The curve produced by plotting return cycles against the coupling interval could be divided into several phases, including compensatory pause, reset, interpolation, and reentry. Sinus node reentrant tachycardia was described on the basis of these findings as a tachycardia that could be induced and terminated by programmed electrical stimulation with a P wave morphology identical or similar to sinus P waves and tachycardia CLs of 350 to 550 milliseconds (see Fig. 16-3).24 There have been some reports of endocardial ablation of sinus node reentrant tachycardias identified by these criteria. However, the precise identification of sinus node reentrant tachycardia remains elusive. The mechanism of focal AT can be reentrant, and the CL of such ATs completely overlaps that described for sinus node reentrant tachycardia. The location of AT foci is often along the crista terminalis, very close to the supposed location of the sinus node. An added problem is that the origin of the sinus activation can be variable, according to epicardial mapping studies. Furthermore, endocardial origin of sinus activation during normal sinus rhythm (NSR) has not been systematically studied in humans, and specific criteria do not exist to pinpoint a specific sinus node area. Finally, reentry strictly limited to the sinus node area has never been demonstrated and has even been questioned.24
Clinical Considerations
Epidemiology
Nonsustained AT is frequently found on Holter recordings and is seldom associated with symptoms. Sustained focal ATs are relatively infrequent; they are diagnosed in approximately 5% to 15% of patients referred for catheter ablation of supraventricular tachycardia (SVT).25 However, ATs comprise a progressively greater proportion of paroxysmal SVTs with increasing age and account for 23% in patients older than 70 years. Age-related changes in the atrial EP substrate, including cellular coupling and autonomic influences, can contribute to the increased incidence of AT in older individuals.25 In adults, focal AT can occur in the absence of cardiac disease, but it is often associated with underlying cardiac abnormalities. Not infrequently, two or more foci of AT can be found in the same patient.26
Clinical Presentation
Focal ATs can manifest as paroxysmal or incessant tachycardias. When paroxysmal, AT manifests with the clinical syndrome of paroxysmal SVT (discussed in Chap. 20). Symptoms, however, may be more severe or associated with cardiac decompensation caused by the higher prevalence of structural heart disease in this group of patients. Incessant tachycardia can result in tachycardia-induced cardiomyopathy and manifest with symptoms of congestive heart failure. AT can also manifest as a frequently repetitive tachycardia, with frequent episodes of AT interrupted by short periods of NSR. The repetitive type may be tolerated well for years. It may cause symptoms only in cases of fast heart rates during phases of tachycardia, and it infrequently induces dilated cardiomyopathy.
In one study, tachycardia-induced ventricular cardiomyopathy occurred in 10% of the total population of patients with focal AT. Incessant tachycardia was necessary for the development of cardiomyopathy, and cardiomyopathy was observed in approximately one third of patients with incessant AT. Incessant tachycardias precipitating cardiomyopathy characteristically tend to have slower atrial rates as compared with ATs not associated with cardiomyopathy. In contrast to patients with rapid paroxysmal AT, incessant tachycardia may produce negligible symptoms and may go unrecognized by the patient until symptoms related to cardiomyopathy develop.20
Principles of Management
Short-Term Management
The usual acute therapy for AT consists of intravenous beta blockers or calcium channel blockers either to terminate the arrhythmia, which is rare, or to achieve rate control through AV block, which is often difficult.19 Direct suppression of the tachycardia focus may be achieved by the use of intravenous class IA and IC or class III agents. Intravenous class IA or IC agents may be taken by patients without heart failure, whereas intravenous amiodarone is preferred for those with poor LV function.19
Long-Term Management
As with other forms of SVT, AT is usually benign and associated with only mild to moderate symptoms. Thus, most patients with AT are treated initially with medical therapy. Patient preference and refractoriness to pharmacological therapy are reasonable indications for catheter ablation.19
The efficacy of antiarrhythmic drugs is poorly defined because the clinical definition of focal ATs is often not rigorous. No large studies have been conducted to assess the effect of pharmacological treatment in patients with focal ATs, but both paroxysmal and, especially, incessant ATs are reported to be difficult to treat medically. Available data support a recommendation for initial therapy with calcium channel blockers or beta blockers because these agents may prove to be effective and have minimal side effects. If these drugs are unsuccessful, then class IA agents, class IC (flecainide and propafenone) agents in combination with an AV node (AVN) blocking agent, or class III agents (sotalol and amiodarone) may be tried; however, the potential benefit should be balanced by the potential risks of proarrhythmia and toxicity. Because ATs often occur in older patients and in the context of structural heart disease, class IC agents should be used only after cardiomyopathy and coronary artery disease are excluded.19
For patients with drug-refractory AT or incessant AT, especially when tachycardia-induced cardiomyopathy has developed, the best therapy appears to be catheter ablation of the AT focus. In case reports and small series, patients with tachycardia-induced cardiomyopathy frequently have complete resolution of LV dysfunction with successful RF catheter ablation of the atrial focus.19,20 Regardless of whether the arrhythmia is caused by abnormal automaticity, triggered activity, or microreentry, focal AT is ablated by targeting the site of origin of the AT. Catheter ablation for focal AT carries a success rate of more than 90%, with a recurrence rate of 9%. The incidence of significant complications is relatively low (1% to 3%) in experienced centers.
Electrocardiographic Features
P Wave Morphology
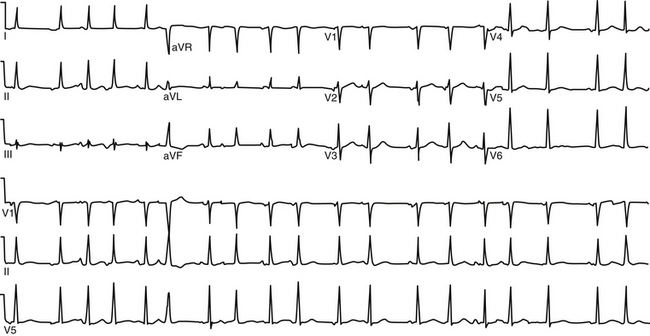
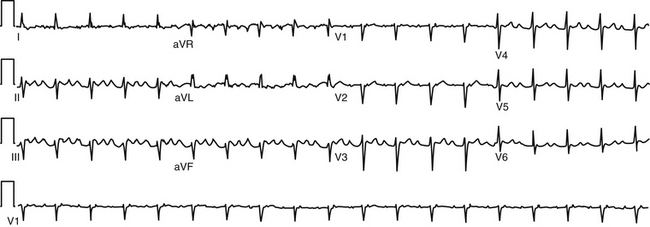
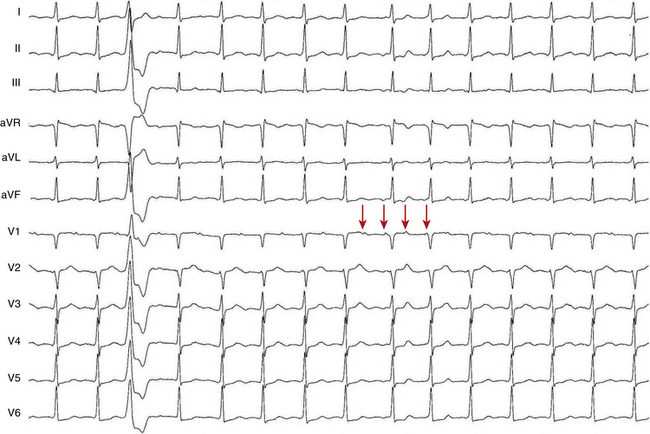
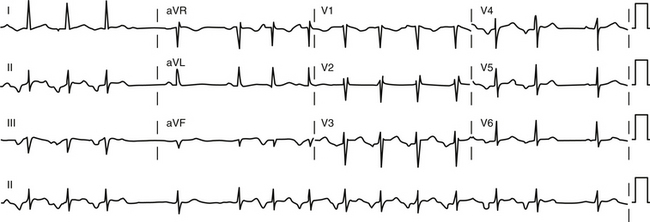
During AT, typically there are discrete P waves at rates of 130 to 240 beats/min, but possibly as slow as 100 beats/min or as fast as 300 beats/min. Antiarrhythmic drugs can slow the tachycardia rate without abolishing the AT. Classically, there are clearly defined isoelectric intervals between the P waves in all leads (Fig. 11-2). However, in the presence of rapid rates, intraatrial conduction disturbances, or both, the P waves can be broad, and there may be no isoelectric baseline. In these cases, the ECG shows an AFL pattern (continuous undulation without isoelectric baseline; Fig. 11-3).1 Nevertheless, one report demonstrated a high sensitivity (90%) and specificity (90%) of quantitative ECG indexes of shorter atrial activation and longer diastolic intervals in distinguishing focal from macroreentrant AT. This approach was effective in cases with and without 1:1 AV conduction and when the P or flutter waves overlay T waves.27
P wave morphology depends on the location of the atrial focus, and it can be used to localize the site of origin of the AT approximately. However, the P wave can be partially masked by the preceding ST segment or T wave, or both. Vagal maneuvers and adenosine infusion to provide transient AV block can be used to obtain a clear view of the P wave, assuming that the tachycardia does not terminate with AV block. The compensatory pause following a premature ventricular complex during the AT can also be used to delineate P wave morphology (Fig. 11-4). It has been suggested that the multilead body surface potential recording can be used to help localize the site of origin of the tachycardia.
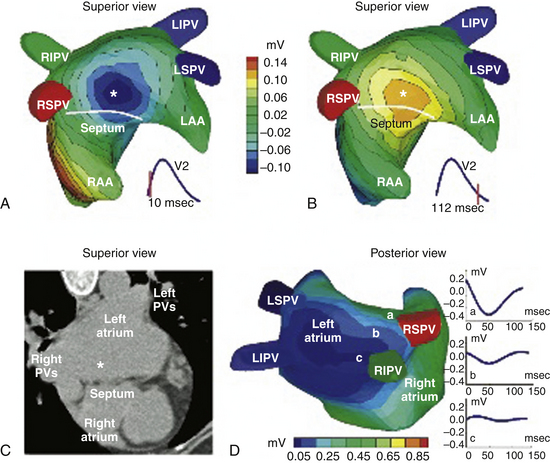
One report described a clinical application of ECG imaging (ECGI) as an adjunctive noninvasive technology to identify the site of origin of a focal AT accurately prior to catheter ablation (Fig. 11-5).28
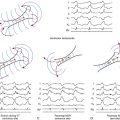
Focal automatic ATs start with a P wave identical to the P wave during the arrhythmia, and the rate generally increases gradually (warms up) over the first few seconds. In comparison, intraatrial reentry or triggered-activity AT is usually initiated by a P wave from a premature atrial complex (PAC) that generally differs in morphology from the P wave during the established arrhythmia (Fig. 11-6).
P/QRS Relationship
The atrial to ventricular relationship is usually 1:1 during ATs, but Wenckebach (Fig. 11-7) or 2:1 AV block (see Figs. 11-3 and 11-4) can occur at rapid rates, in the presence of AVN disease, or in the presence of drugs that slow AVN conduction. The presence of AV block during an SVT strongly suggests AT, excludes AV reentrant tachycardia (AVRT), and renders AVN reentrant tachycardia (AVNRT) unlikely.
Localization of the Atrial Tachycardia Site of Origin Using P Wave Morphology
General Observations Relating P Wave Morphology to Site of Origin of Atrial Tachycardia
P wave morphology provides a useful guide to the localization of focal AT in patients without structural heart disease. In patients with prior surgery or extensive atrial ablation or in those with significant structural heart disease, activation patterns can be altered, significantly rendering P wave morphology less helpful.29
ECG lead V1 is the most useful in identifying the likely anatomical site of origin for focal AT. Lead V1 is located to the right and anteriorly in relation to the atria, which should be considered anatomically as right anterior and left posterior structures. Thus, for example, tachycardias originating from the tricuspid annulus have negative P waves in lead V1 because of the anterior and rightward location of this structure (i.e., activation travels away from lead V1). The P wave in lead V1 is universally positive for tachycardias originating from the PVs because of the posterior location of these structures (i.e., the impulse travels toward lead V1).6,30,31
Several features of P wave morphology can help predict whether an AT is arising from the RA or the LA. In one report, a negative or biphasic (positive-negative) P wave in lead V1 was associated with 100% specificity, 100% positive predictive value, 69% sensitivity, and 66% negative predictive value for a tachycardia arising from the RA. Conversely, a positive or negative-positive biphasic P wave in lead V1 had 100% sensitivity, 81% specificity, 76% positive predictive value, and 100% negative predictive value for an LA origin. A positive or biphasic P wave in lead aVL predicted an RA focus; however, some patients with right superior PV foci had positive P waves in lead aVL. An isoelectric or negative P wave in lead I was 100% specific (but only 50% sensitive) for LA foci.6
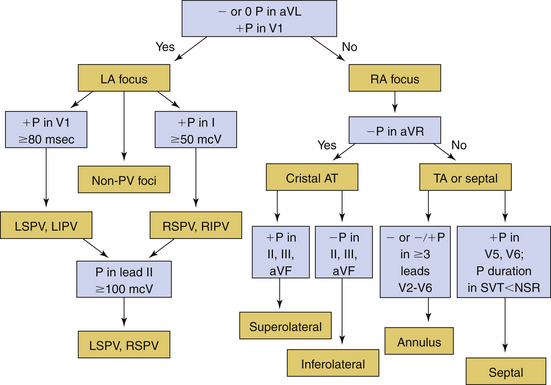
Several algorithms have been proposed for ECG localization of focal AT using P wave morphology. Figure 11-8 summarizes some of those algorithms.6
Right Atrial Tachycardias
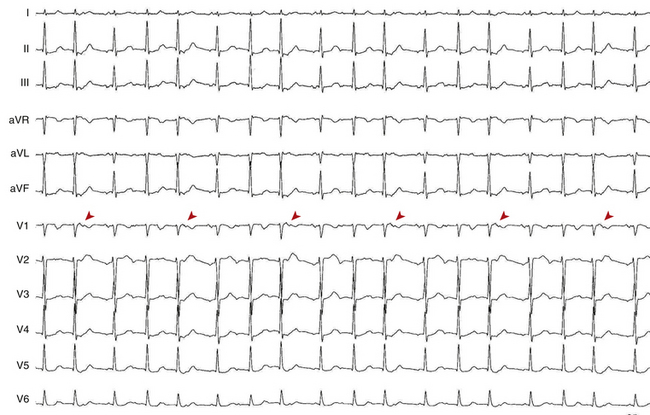
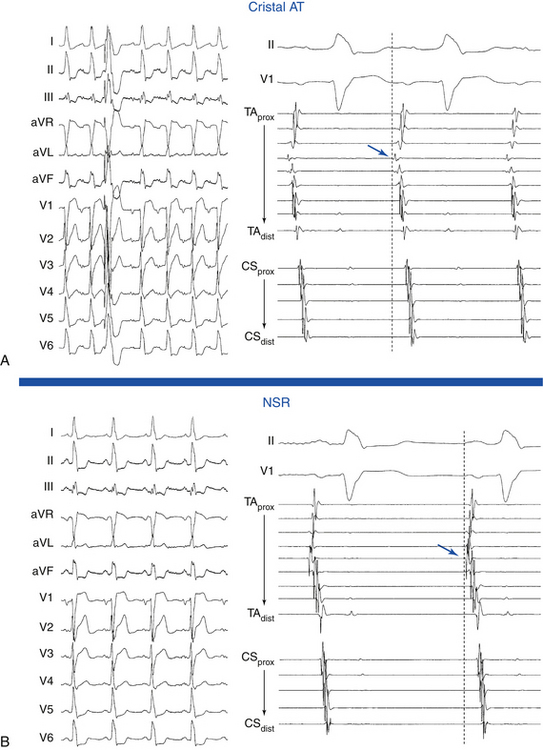
Cristal ATs (i.e., ATs arising from the crista terminalis) are characterized by right-to-left activation sequence resulting in P waves that are positive and broad in leads I and II, positive in lead aVL, and biphasic in lead V1 (Fig. 11-9). A negative P wave in lead aVR predicts a cristal origin compared with anterior RA foci with a sensitivity of 100% and specificity of 93%. Biphasic P waves (positive-negative) in lead V1 (or positive V1 during both tachycardia and sinus rhythm), positive P waves in leads I and II, and negative P waves in lead aVR predict a cristal origin with 93% sensitivity, 95% specificity, 84% positive predictive value, and 98% negative predictive value. Although there can be overlap in P wave morphology between the superior crista and the right superior PV as a result of the anatomical proximity of the two sites, these can be distinguishable on the basis of changes to the P wave morphology in lead V1 during tachycardia as compared with sinus P waves. In right superior PV AT, P waves in lead V1 are invariably upright during tachycardia and biphasic (positive-negative) in sinus rhythm. When cristal AT has an upright P wave in lead V1 (approximately 10%), it is invariably also upright during sinus rhythm. High, middle, or low cristal locations can be identified by P wave polarity in the inferior leads.29
In the setting of posteroseptal ATs (originating below and around the CS os), the P wave is positive in lead V1, negative in the inferior leads, and positive in leads aVL and aVR. Those ATs can mimic fast-slow AVNRT or orthodromic AVRT using a posteroseptal BT.
The circumference of the tricuspid annulus is the second most common site of origin for RA tachycardias. A common feature of tricuspid annular ATs is the presence of an inverted P wave in leads V1 and V2 with late precordial transition to an upright appearance. The nonseptal sites demonstrate negative P waves in lead V1, whereas anteroinferior sites tend to have inverted P waves across the precordial leads, and superior sites closer to the septum show transition from negative in lead V1 through biphasic to upright in the lateral precordial leads.3 In general, the polarity of leads II and III is deeply negative for an inferoanterior location and low amplitude, positive, or biphasic for a superior location. Additionally, tricuspid annular ATs typically have positive P waves in lead aVL and positive or isoelectric P waves in lead I.29
Focal ATs originating from the RA appendage typically originate from the lateral base of the appendage but are also well described from an apical location. Because of their close anatomical proximity, these tachycardias are generally indistinguishable from superior tricuspid annular foci; they exhibit negative P waves in leads V1 and V2 and variable precordial transition to positive in lead V6. P waves in the inferior leads characteristically have low positive amplitudes.29,32
Left Atrial Tachycardias
ATs arising from the PVs are characterized by entirely positive P waves in lead V1 (in 100% of cases) and across the precordial leads, isoelectric or negative waves in lead aVL in 86%, and negative waves in lead aVR in 96%. Lead aVL can be biphasic or positive in right-sided PV ATs.7 Compared with the right-sided PVs, the left-sided PV foci have several characteristics: positive notching in the P waves in two or more surface leads, an isoelectric or negative P wave in lead I, P wave amplitude in lead III/II ratio greater than 0.8, and broad P waves in lead V1 (Fig. 11-10). Right-sided PV foci usually have positive P waves in lead I. ATs arising from the superior PVs invariably have a positive P wave in the inferior leads. In contrast, ATs arising from the inferior PVs can have inverted, low-amplitude positive or isoelectric inferior P waves. However, because of the close proximity of the superior and inferior veins and marked anatomical variation, P wave morphology generally is of greater accuracy in distinguishing right-sided from left-sided PVs, in contrast to distinguishing superior from inferior PVs.
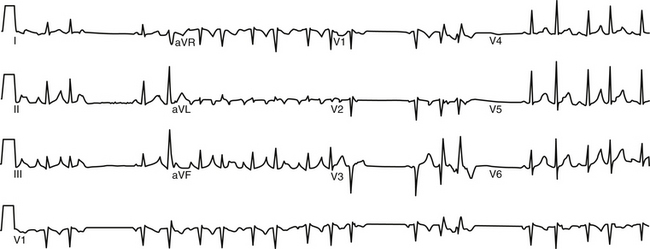
FIGURE 11-10 Surface ECG of nonsustained focal atrial tachycardia originating from the ostium of the left superior pulmonary vein.
ATs arising from the right superior PV are associated with P waves that are narrow and positive in the inferior leads, of equal amplitude in leads II and III, positive in lead V1, and isoelectric in lead I. The right superior PV is a common site of origin for LA ATs. It is only a few centimeters from the sinus node. Activation rapidly crosses the septum via Bachmann’s bundle to activate the RA in a fashion similar to NSR, a feature explaining the similarities in P wave morphology. However, whereas the P wave is biphasic in lead V1 during NSR, it is positive in that lead during right superior PV AT (Fig. 11-11).7
Despite prior posterior LA ablation, the surface ECG morphology of ATs originating from the PV ostia in patients with prior AF ablation procedures is similar to those in patients without prior ablation. However, ATs originating from the bottom of the right or left PVs after prior PV isolation can have a significant negative component or can be completely negative in the inferior leads. This may be related to prior ablation in the superoposterior LA or to a more inferior origin of the tachycardia after prior ablation outside the PV ostium.33
In the setting of LA appendage ATs, the P wave is positive in the inferior leads (more positive in lead III than in II), positive in lead V1, and negative in leads I and aVL. The LA appendage is closely approximated to the left superior PV, and, as such, ATs arising from those locations tend to have similar P wave morphologies. When P wave morphology suggestive of a left superior PV focus (broad upright and notched in lead V1 and in the inferior leads) exhibits a deeply inverted P wave in lead I, an origin from the LA appendage should be strongly suspected. P waves are typically more positive in lead III than in lead II. A negative P wave in leads I and aVL predicts an LA appendage focus with a sensitivity and specificity of 92% and 97%, respectively.29
Mitral annular ATs typically cluster at the superior aspect of the mitral annulus in close proximity to the aortomitral continuity. ATs originating in this circumscribed area are characterized by P waves with an initial narrow negative deflection in lead V1 followed by a positive deflection. The positivity of the P wave becomes progressively less from V1 through V6. The P wave is negative in leads I and aVL and isoelectric or slightly positive in the inferior leads.34
ATs arising from the CS musculature typically demonstrate deeply inverted P waves in the inferior leads. Lead V1 usually exhibits isoelectric-positive or biphasic (negative-positive) P waves, with variable precordial transition. P waves are invariably positive in leads aVL and aVR.4 Compared with AT originating from the CS os, AT originating from 3 to 4 cm into the body of the CS have broad and upright P waves in lead V1.29
ATs have been described originating from the noncoronary cusp of the aortic valve. Because of the close anatomical proximity, the P wave morphology is similar to that of ATs arising from the aortomitral continuity. The P waves in leads V1 and V2 are also characteristically negative. However, unlike aortomitral ATs, those arising from the noncoronary cusp demonstrate upright P waves in leads I and aVL. In the inferior leads, the P waves are biphasic negative-positive but of low amplitude.15,16,29
Electrophysiological Testing
Induction of Tachycardia
Frequently, AT foci can become inactive in the EP laboratory environment because of sedative medications, changes in autonomic tone that can be caused by prolonged supine position, patient anxiety, deviation from normal diet, or other changes in daily activities that can have an impact on the circadian variation of AT activity. Thus, in preparation for an AT ablation procedure, several measures should be undertaken. Antiarrhythmic drugs should be discontinued for at least five half-lives before the EP study. Sedation should be minimized throughout the procedure. It may be an appropriate policy to monitor the patient in the EP laboratory initially without sedation. If no spontaneous tachycardia is induced, isoproterenol is administered. If no AT can be induced, a single quadripolar catheter is placed in the RA, and programmed electrical stimulation is performed without and, if no AT is induced, with isoproterenol infusion. If AT remains quiescent, the procedure is aborted and retried at a future date. If AT is inducible at any step, the full EP catheter arrangement and EP study are undertaken (Table 11-2).17,24,31
TABLE 11-2 Programmed Electrical Stimulation Protocol for Electrophysiological Testing of Atrial Tachycardia
AES = atrial extrastimulation; CL = cycle length; CS = coronary sinus; ERP = effective refractory period; RA = right atrium; RV = right ventricle; VA = ventricular-atrial; VES = ventricular extrastimulation.
Initiation by Atrial Extrastimulation or Atrial Pacing
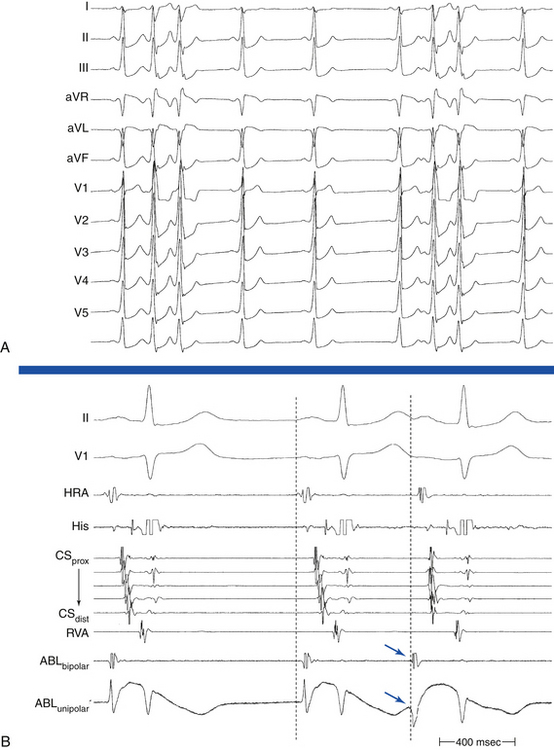
In the setting of microreentry and triggered activity, the first tachycardia P wave is different from subsequent P waves; the first P wave is usually a PAC or an AES that is necessary to start the AT (see Fig. 11-6). In contrast, the first tachycardia P wave and subsequent P waves during automatic AT are identical; the AT does not require a PAC to start (Fig. 11-12). Furthermore, the automatic AT CL tends to shorten progressively (warm up) for several beats until its ultimate rate is achieved.
No delay in the atrial–His bundle (HB) interval (AH interval) or PR interval is required for initiation of AT, although it can occur. AV block can also occur at initiation.24
Initiation by Ventricular Extrastimulation or Ventricular Pacing
It is uncommon to initiate AT with ventricular extrastimulation (VES) or ventricular pacing because decremental retrograde conduction over the AVN prevents adequate prematurity of atrial activation. However, in the presence of an AV BT, fast retrograde atrial activation mediates adequate prematurity of the conducted ventricular stimulus to the atrium, and AT may be induced.24
Tachycardia Features
Atrial Activation Sequence
P wave morphology and atrial activation sequence depend on the site of origin of the AT. Intracardiac mapping shows significant portions of the tachycardia CL without recorded atrial activity, and atrial activation time is markedly less than the tachycardia CL (see Fig. 11-2).24 However, in the presence of extensive atrial scarring or prior ablation, depolarization from the AT focus can occasionally be followed by very disordered and prolonged conduction so that activation of the entire chamber can extend over (or even exceed) the entire tachycardia CL, thus mimicking macroreentrant AT.12 Conversely, long isoelectric intervals can occur between the P waves during macroreentrant ATs and can incorrectly suggest a focal mechanism. This pattern is particularly observed for LA flutters in the presence of large areas of electrical scar. However, a thorough intracardiac activation map reveals atrial activation spanning the tachycardia CL. When mapping is limited to only the atrium contralateral to the origin of the macroreentrant circuit or to only parts of the ipsilateral atrium, a focal mechanism can be falsely implied.
Atrial-Ventricular Relationship
The AH and PR intervals during AT are appropriate for the AT rate and are usually longer than those during NSR. The faster the AT rate is, the longer the AH and PR intervals will be. Thus, the PR interval may be shorter than, longer than, or equal to the RP interval. The PR interval may also be equal to the RR, and the P wave may fall inside the preceding QRS, thereby mimicking typical AVNRT.24
Oscillation in the Tachycardia Cycle Length
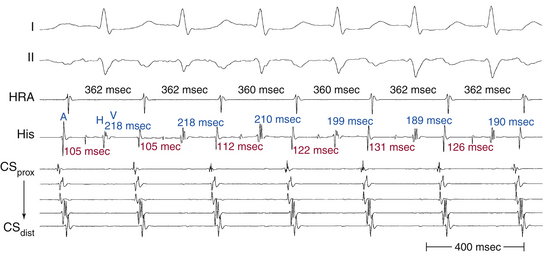
Oscillation of the ventricular CL occurs frequently during AT and is the result of changes either in the AT CL or in AVN conduction. When CL variability results from oscillation of the AT CL, changes in the atrial CL are expected to precede and predict similar changes in the ventricular CL. On the other hand, ventricular CL variability can be caused by changes in AV conduction instead of changes in the CL of the AT, in which setting ventricular CL variability is not predicted by a prior change in atrial CL. Because there is no VA conduction during AT, ventricular CL variability by itself is not expected to result in atrial CL variability during AT.35 Additionally, spontaneous changes in the PR and RP intervals with fixed A-A intervals favor AT over other types of SVT (Fig. 11-13).
In contrast to AT, typical AVNRT and orthodromic AVRT generally have CL variability caused by changes in anterograde AVN conduction. Because retrograde conduction through a fast AVN pathway or a BT generally is much less variable than the anterograde conduction through the AVN, the changes in ventricular CL that result from variability in anterograde AVN conduction are expected to precede the subsequent changes in atrial CL.35
Variation in the AT CL of more than 15% has been suggested as a reliable marker of a focal AT. In contrast, it is rare for macroreentrant ATs to display considerable variation in the CL. However, a regular AT can be either focal or macroreentrant.36
Effects of Bundle Branch Block
Bundle branch block may occur during AT but does not affect the tachycardia CL because the ventricles are not participants in AT.24
Termination and Response to Physiological and Pharmacological Maneuvers
In the setting of spontaneous termination, ATs terminate with a QRS complex following the last P wave of the tachycardia. Most ATs (50% to 80%) are terminated by adenosine; therefore, termination of an SVT in response to adenosine is not helpful in differentiating AT from other SVTs.24,37 Usually (in 80% of cases), termination of AT in response to adenosine occurs prior to the onset of AV block (i.e., termination occurs with a tachycardia P wave followed by a QRS). Reproducible termination with a P wave not followed by a QRS indicates other types of SVT because it occurs in AT only if adenosine terminates the AT at the same moment it causes AV block, an unlikely coincidence. In the atrium, adenosine produces antiadrenergic effects (presumably responsible for terminating triggered activity) and increases the acetylcholine- or adenosine-activated potassium (K+) current (Ikach). The results are shortening of the action potential duration and reduction of the resting membrane potential, which may be responsible for terminating atrial microreentry. Adenosine can also help identify automatic ATs, which are generally transiently slowed but not terminated, with gradual resumption of the AT rate.1
Carotid sinus massage, vagal maneuvers, and adenosine reproducibly slow or terminate sinus node reentrant tachycardia and 25% of microreentrant ATs (especially those with long tachycardia CLs and those arising in the RA). Spontaneous termination of AT is usually accompanied by progressive prolongation of the A-A interval, with or without changes in AV conduction. Triggered activity AT also can terminate in response to carotid sinus massage, vagal maneuvers, adenosine, verapamil, beta blockers, and sodium channel blockers. In contrast, although carotid sinus massage can cause AV block and adenosine can slow automatic AT, these interventions generally do not terminate the AT. Only beta blockers have been useful in termination of paroxysmal (but not incessant) automatic AT. Termination of automatic AT is usually preceded by a cool-down phenomenon of the AT rate.1
Diagnostic Maneuvers during Tachycardia
Atrial Extrastimulation and Atrial Pacing During Focal Atrial Tachycardia
Microreentrant Atrial Tachycardia
During entrainment of microreentrant AT, the return CL and post-pacing interval (PPI) are fixed regardless of the number of beats in the pacing train. AES and atrial pacing can almost always terminate microreentrant AT (especially sinus node reentrant tachycardia).24
Triggered-Activity Atrial Tachycardia
AES can reset triggered-activity AT (with a decreasing resetting response). However, triggered-activity AT cannot be entrained by atrial pacing. Following the delivery of an AES or atrial overdrive pacing during triggered-activity AT, the return CL tends to shorten with shortening of the AES coupling interval or pacing CL. AES and, more effectively, atrial pacing can usually terminate triggered-activity AT.24
Automatic Atrial Tachycardia
Automatic AT cannot be entrained by atrial pacing. Rapid atrial pacing results in overdrive suppression of the AT rate. The AT resumes after cessation of atrial pacing but at a slower rate and gradually speeds up (warms up) to return back to prepacing tachycardia CL. The tachycardia return CL following cessation progressively prolongs with increasing the duration of overdrive pacing. Occasionally, overdrive pacing produces no effect at all on automatic AT.24
Ventriculoatrial Linking
Following cessation of overdrive atrial pacing (with 1:1 AV conduction) during focal AT, the VA interval (the interval between the last captured QRS complex and the first AT complex) can vary significantly from the VA interval during AT, because the timing of the AT return cycle is not related to the preceding QRS. In contrast, in the setting of typical AVNRT and orthodromic AVRT, the post-pacing VA interval remains fixed and similar to that during tachycardia (with a less than 10-millisecond variation) after different attempts at SVT entrainment. VA linking occurs in the setting of typical AVNRT and orthodromic AVRT because the timing of atrial activation is related to or dependent on ventricular activation and is the result of retrograde VA conduction over the AVN fast pathway (during typical AVNRT) or the BT (during orthodromic AVRT).38,39
Differential-Site Atrial Pacing
Differential-site atrial pacing can help distinguish AT from other mechanisms of SVT. Overdrive pacing is performed during tachycardia from different atrial sites (high RA [HRA] and proximal CS) at the same pacing CL. Once the presence of 1:1 AV conduction during atrial pacing is verified and the SVT resumes following cessation of pacing, the maximal difference in the post-pacing VA intervals (the interval from the last captured ventricular electrogram to the earliest atrial electrogram of the initial tachycardia beat after pacing) among the different pacing sites is calculated (ΔVA interval). In one report, a ΔVA interval of more than 14 milliseconds was diagnostic of AT, whereas a ΔVA interval of less than 14 milliseconds favored AVNRT or orthodromic AVRT (with the sensitivity, specificity, and positive and negative predictive values all equal to 100%). In orthodromic AVRT and AVNRT, the initial atrial complex following cessation of atrial pacing entraining the SVT is linked to, and cannot be dissociated from, the last captured ventricular complex. In contrast, in the setting of AT, the first atrial return cycle following cessation of pacing is dependent on the distance between the AT origin and pacing site, atrial conduction properties, and mode of the resetting response of the AT, and it is not related to the preceding ventricular activation. Hence, the post-pacing VA intervals vary among the pacing sites, and the ΔVA interval is relatively large (more than 14 milliseconds).39
Variability in Post-Pacing Intervals
The global pattern of activation of an atrial arrhythmia can be rapidly determined by comparing the differences in PPIs obtained with overdrive pacing from a single site (proximal CS) at CLs 10, 20, and 30 milliseconds shorter than the tachycardia CL. Relative stability of the PPI, regardless of its relation to the tachycardia CL, is highly suggestive of circuitous activation of the atrium. High variability of the PPI, on the other hand, is nearly diagnostic of a centrifugal activation pattern. In fact, in one report, PPI variability was significantly shorter for macroreentrant ATs (6.0 ± 2.5 milliseconds) than for focal ATs (56.5 ± 20.6 milliseconds). A clinical prediction rule was derived wherein low PPI variability (less than 10 milliseconds) identified macroreentrant ATs with a sensitivity of 94% and a specificity of 100%, whereas high PPI variability (more than 30 milliseconds) identified focal ATs with a sensitivity of 93% and a specificity of 100%.40
In macroreentry, the PPI reflects the time required for the stimulated wavefront to travel to a reentrant circuit, revolve once around the circuit, and travel back to the pacing site. Because this distance remains unchanged, pacing at faster rates should theoretically not change the distance traveled, and thus the PPI remains stable (PPI variability should approach zero). Faster pacing rates, however, can decrease conduction velocity because of decremental tissue conduction leading to prolongation of the PPI. Nevertheless, this is less likely to occur when overdrive pacing CLs are limited to within 30 milliseconds of the tachycardia CL. In contrast, variability in the PPI is expected in the setting of automatic ATs; by virtue of the phenomenon of overdrive suppression, automatic foci tend to require more time for recovery as pacing rate or duration increases. Unexpectedly, however, large PPI variability was exhibited by all centrifugal tachycardias regardless of mechanism (including microreentry). By virtue of their small circuits, the microreentrant ATs have a short excitable gap; it is likely that the paced wavefront will penetrate the circuit during relative refractoriness, with decremental conduction resulting in progressive PPI prolongation.40
Ventricular Extrastimulation and Ventricular Pacing During Focal Atrial Tachycardia
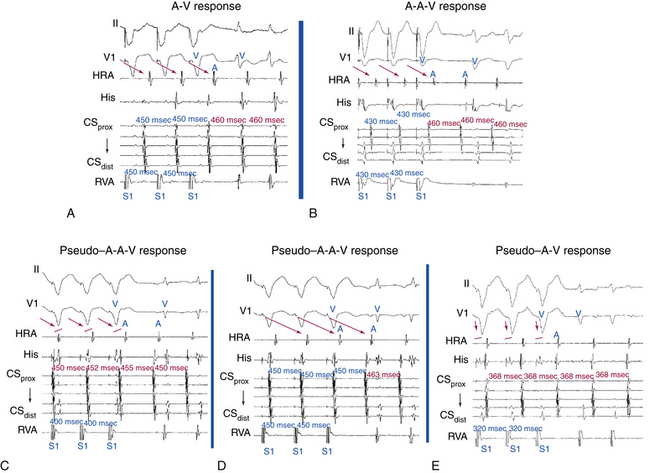
It is uncommon for VES or ventricular pacing to affect an AT unless rapid 1:1 VA conduction is present (especially in the presence of an AV BT) and the tachycardia CL is relatively long. Cessation of overdrive ventricular pacing during AT (with 1:1 VA conduction without terminating the tachycardia) results in an A-A-V pattern, which is suggestive of AT as the mechanism of the SVT and practically excludes AVNRT and orthodromic AVRT, whereas an A-V pattern is consistent with AVNRT or orthodromic AVRT and makes AT less likely.24
Atrial and Ventricular Electrogram Sequence Following Cessation of Ventricular Pacing
Technique
During SVT, ventricular pacing is initiated at a pacing CL 10 to 60 milliseconds shorter than the tachycardia CL until 1:1 VA conduction occurs, at which point pacing is discontinued. If pacing results in termination of the tachycardia, SVT is reinduced, and the maneuver is repeated. If ventricular pacing does not terminate the tachycardia and the presence of stable 1:1 VA conduction is verified, the electrogram sequence immediately after the last paced ventricular complex is categorized as atrial-ventricular (A-V) or atrial-atrial-ventricular (A-A-V) (Fig. 11-14).
Pitfalls
This pacing maneuver is not useful when 1:1 VA conduction during ventricular pacing is absent. Thus, when determining the response after ventricular pacing during SVT, the presence of 1:1 VA conduction must be confirmed. Isorhythmic VA dissociation can mimic 1:1 VA conduction, especially when the pacing train is not long enough or the pacing CL is too slow (see Fig. 11-14).
A pseudo–A-A-V response can occur during atypical AVNRT. Because retrograde conduction during ventricular pacing occurs through the slow pathway, the VA interval is long and can be longer than the pacing CL (V-V interval), so that the last paced QRS is followed first by the atrial complex resulting from slow VA conduction of the preceding paced QRS and then by the atrial complex resulting from the last paced QRS. Careful examination of the last atrial electrogram that resulted from VA conduction during ventricular pacing avoids this potential pitfall; the last retrograde atrial complex characteristically occurs at an A-A interval equal to the ventricular pacing CL, whereas the first tachycardia atrial complex usually occurs at a different return CL. A pseudo–A-A-V response may also occur when 1:1 VA conduction is absent during overdrive ventricular pacing, during typical AVNRT with long HB-ventricular (HV) intervals or short HA intervals whereby atrial activation may precede ventricular activation, and in patients with a bystander BT. Replacing ventricular activation with HB activation (i.e., characterizing the response as A-A-H or A-H instead of A-A-V or A-V, respectively) can be more accurate and can help eliminate the pseudo–A-A-V response in patients with AVNRT and long HV intervals, short HA intervals, or both.41
On the other hand, a pseudo–A-V response can occur with automatic AT when the maneuver is performed during isoproterenol infusion. Ventricular pacing with 1:1 VA conduction can result in overdrive suppression of the atrial focus, and isoproterenol may cause an increase in junctional automaticity, so that an apparent A-V response occurs. Therefore, when ventricular pacing is performed during an isoproterenol infusion, it is important to determine that the response after cessation of ventricular pacing is reproducible.39
A pseudo–A-V response can theoretically occur when AT coexists with retrograde dual AVN pathways or bystander BT. In such cases, the last retrograde atrial complex would have an alternative route for anterograde conduction to the ventricle, other than the one used for retrograde VA conduction during ventricular pacing, thus resulting in an A-V response. However, clinical occurrence of these theoretical scenarios has not been observed, probably because of retrograde penetration of both AVN pathways or of the AVN and the BT during ventricular pacing, so that both pathways are refractory to anterograde conduction on cessation of pacing.39
Exclusion of Other Arrhythmia Mechanisms
Focal AT should be differentiated from other SVTs, including AVNRT, orthodromic AVRT, and macroreentrant AT. Programmed electrical stimulation is usually adequate in excluding AVNRT and AVRT as the mechanism of SVT (Tables 11-3 and 11-4).24 Macroreentry, however, can be more difficult to exclude, and electroanatomical mapping is of value in some cases (Table 11-5).
TABLE 11-3 Exclusion of Atrioventricular Nodal Reentrant Tachycardia
| PARAMETER | FEATURES |
|---|---|
| Atrial activation sequence |
AH = atrial–His bundle interval; AV = atrioventricular; AVNRT = atrioventricular nodal reentrant tachycardia; CL = cycle length; NSR = normal sinus rhythm; SVT = supraventricular tachycardia.
TABLE 11-4 Exclusion of Orthodromic Atrioventricular Reentrant Tachycardia
AV = atrioventricular; AVRT = atrioventricular reentrant tachycardia; BT = bypass tract; CL = cycle length; NSR = normal sinus rhythm; RA = right atrium; SVT = supraventricular tachycardia; VA = ventriculoatrial; VES = ventricular extrastimulation.
TABLE 11-5 Exclusion of Macroreentrant Atrial Tachycardia
| PARAMETER | FEATURES |
|---|---|
| ECG | |
| Atrial activation sequence | |
| Programmed electrical stimulation | |
| Tachycardia CL variability | |
| Entrainment mapping |
• Focal AT cannot be entrained, except for microreentrant AT; in this case, because the microreentrant circuit is very small, only orthodromic capture is usually observed. In addition, constant or progressive fusion, as demonstrated by intermediate P wave morphologies on the ECG, cannot be demonstrated. • Macroreentrant AT is defined by demonstration of concealed or manifest entrainment of the tachycardia with atrial pacing. |
| PPI variability | |
| Electroanatomical three-dimensional mapping |
• Focal AT is suggested by electroanatomical maps demonstrating radial spreading of activation, from the earliest local activation site in all directions. • Macroreentrant AT is suggested by electroanatomical maps demonstrating continuous progression of colors around the RA with close proximity of earliest and latest local activation. |
| Response to adenosine |
AES = atrial extrastimulation; AT = atrial tachycardia; CL = cycle length; LA = left atrium; RA = right atrium.
Mapping
Activation Mapping
There is generally an electrically silent period in the atrial CL reflected by an isoelectric line between atrial deflections on the surface ECG. Intracardiac mapping typically shows significant portions of the tachycardia CL without recorded activity, even when recording from the entire RA, LA, or CS (see Fig. 11-2). However, in the presence of complex intraatrial conduction disturbances, intraatrial activation may extend over a large proportion of the tachycardia CL, and conduction spread may follow circular patterns suggestive of macroreentrant activation.17,24,31,42
As noted, the term localized reentry has been used to refer to reentry in which the circuit is localized to a small area and does not have a central obstacle. Thus, if activity accounting for more than 85% of the tachycardia CL is present in an area with a diameter of up to 3 cm, localized reentry is considered (Fig. 11-15).
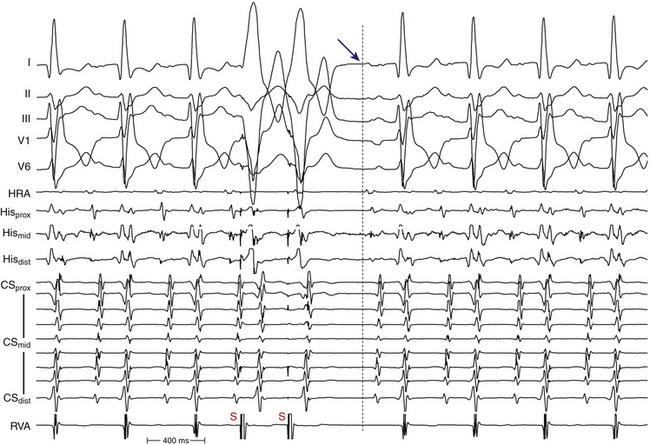
Determining the onset of the tachycardia P wave is important in activation mapping, but it may be impossible if the preceding T wave or QRS is superimposed. Thus, the P wave during AT should be assessed using multiple surface ECG leads and choosing the one with the earliest P onset. To facilitate visualization of the P wave, a VES (or a train of ventricular pacing) is delivered to accelerate ventricular activation and repolarization and permit careful distinction of the P wave onset. After determining P wave onset, a surrogate marker that is easier to track during mapping, such as an HRA or CS electrogram indexed to P wave onset where it is clearly seen, may be used, rather than the P wave onset on the surface ECG (Fig. 11-16).
A single roving catheter is used to find the site, with the earliest atrial electrogram using unipolar and bipolar recordings. Small movements of the catheter tip in the general target region are undertaken under the guidance of fluoroscopy until the site with the earliest possible atrial activation relative to the P wave is identified.17,24,31,42 Activation times are generally measured from the onset or the first rapid deflection of the atrial bipolar electrogram to the onset of the P wave or (preferably) surrogate marker during AT. Using the onset of the local bipolar electrogram is preferable, because it is easier to determine reproducibly when measuring heavily fractionated, low-amplitude atrial electrograms. On the recording system display, placing the intracardiac channel with the earliest local activation timing adjacent to the mapping catheter channel allows the operator to recognize early activation times immediately at sites sequentially visited by the mapping catheter by visual inspection, rather than having to pause and manually measure local activation times. A triggered sweep mode (constant temporal alignment of the display to a reference electrogram) can also be useful for rapid visual assessment of relative timing of mapped sites. The distal pole of the mapping catheter should be the one used for mapping for the earliest atrial activation site because it is the pole through which RF energy is delivered.
Unipolar recordings from the distal ablation electrode are used to supplement conventional bipolar activation mapping. Unipolar signals can be filtered or unfiltered, but unfiltered signals offer more directional information. Unipolar recordings are helpful by showing negative (QS) patterns with sharp initial deflections at the location of the focus (see Fig. 11-11). Timing of the unipolar electrograms can help ensure that the tip electrode, which is the ablation electrode, is responsible for the early component of the bipolar electrograms. The site of origin of the AT is defined as the site with the earliest presystolic (i.e., preceding the onset of the P wave on the surface ECG) bipolar recording in which the distal tip shows the earliest intrinsic deflection and QS unipolar electrogram configuration (see Fig. 11-11).
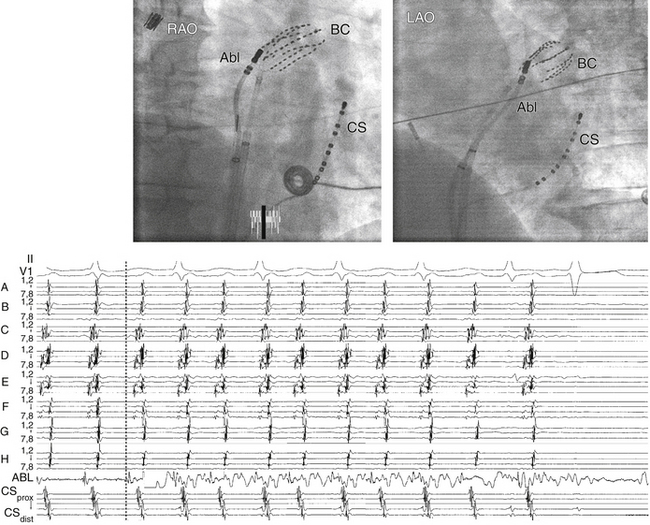
Assessment of simultaneous RA and CS activation sequences by using a multipolar catheter (e.g., duodecapolar or Halo catheters) in the RA around the tricuspid annulus and a decapolar catheter in the CS can facilitate mapping of ATs. In addition to predicting the likely origin of AT, it may facilitate recognition of transformation of the index tachycardia to a different morphology induced by catheter manipulation or by pacing maneuvers. This can be especially important when mapping nonsustained AT or PACs.
Occasionally, multiple unstable focal ATs or PACs can be encountered during mapping. In this setting, the goal should be to focus mapping on the most frequently encountered AT or PAC. Ablation of the most frequent AT often results in organization of the atria and allows for mapping and ablation of other successive ATs. Importantly, care has to be taken to ensure that the correct AT is being mapped and to avoid incorrect sampling of activation times during beats originating from the different foci, which can result in erroneous and confusing activation maps. This can be facilitated by careful attention to changes in P wave morphology or shifting of atrial activation sequences (in the RA or CS) or CLs, or both, during the mapping procedure.43
Special attention should be given to ATs mapped to the midseptum and the right anteroseptal region. For ATs mapped to the midseptum, especially if presystolic activity is not particularly early (i.e., less than 30 milliseconds presystolic), the electrogram is not fractionated, and multiple sites have similar activation times, exclusion of LA ATs using transseptal access to the LA is important (Fig. 11-17). For ATs arising from the PVs, CS activation times may not clearly indicate an LA site of origin. For ATs mapped to the right anteroseptal region (HB region), great care must be given to the anteromedial LA septum, right superior PV, and LA free wall because sites in these regions break through early to the right anteroseptal region, where ablation not only is unsuccessful but also can result in AV block.
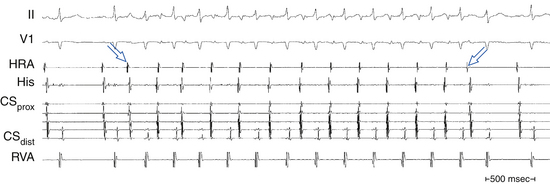
Endocardial atrial activation sequences from the RA, HB, and CS catheters can help predict the location of PAC or AT foci in the SVC versus the right superior PV before atrial transseptal puncture. In one report, the difference in interatrial conduction time (between the HRA and distal CS [CSdist] recording electrodes) during NSR versus PAC ([HRA − CSdist]NSR-PAC) was significantly larger for right superior PV tachycardias compared with SVC tachycardias, and a cutoff value of 20 milliseconds or more of the interatrial conduction time [HRA − CSdist]NSR-PAC was able to differentiate 100% between both locations. During SVC tachycardia, after exiting the SVC and entering the RA, the tachycardia wavefront activates the RA in a high-low sequence and at the same time propagates through the interatrial connection to the LA similar to the activation pathway in NSR. As a consequence, there is little change in the interatrial conduction time compared with that during NSR. Conversely, during right superior PV tachycardias, after leaving the vein and entering the LA, the tachycardia wavefront travels to the rest of the LA and simultaneously crosses the interatrial septum to activate the RA. Thus, the interatrial conduction time would be much shorter than that during NSR. As a consequence, the difference of interatrial conduction time [HRA − CSdist]NSR-PAC between the two groups of tachycardias can be a useful prospective method to define the sources of tachycardia before atrial transseptal puncture.44
Similarly, analyzing intraatrial conduction times can facilitate the distinction between PACs or ATs originating from the SVC and high crista terminalis from PV foci. The time interval between HRA and HB atrial activation during PACs originating from the SVC and crista terminalis is significantly longer than that of the sinus beats. A difference in intraatrial conduction time ([HRA − HB]NSR-PAC) of less than 0 milliseconds favors SVC or crista terminalis origin. The increased intraatrial conduction delay between HRA and HB recording electrodes is a physiological response to the PACs from the SVC and crista terminalis in the human atrium. In contrast, intraatrial conduction time between the HRA and HB electrodes is shortened in the setting of PV tachycardias because both locations are activated in parallel during PV tachycardias, but in sequence during NSR.45
Pace Mapping
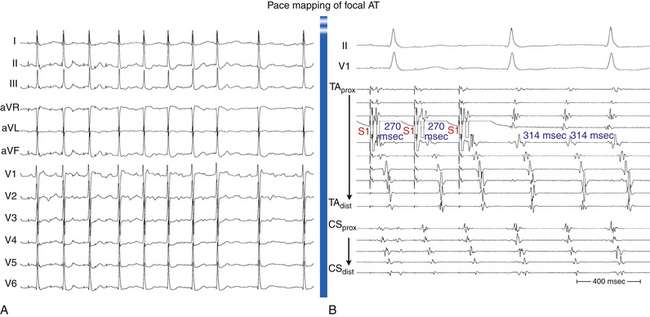
When atrial activation originates from a point-like source, such as during focal AT or during pacing from an electrode catheter, the resultant P wave recorded on the surface ECG is determined by the sequence of atrial activation, which depends to a large extent on the initial site of myocardial depolarization. Additionally, analysis of specific P wave configurations in multiple leads allows estimation of the pacing site location to within several square centimeters. Therefore, comparing the paced P wave configuration with that of AT is particularly useful for locating a small arrhythmia focus in a structurally normal heart.5,17,24
Pace mapping involves pacing from the distal tip of the mapping catheter at sites of interest. Initially, the exact morphology of the tachycardia complex should be determined and used as a template for pace mapping. Pace mapping during the tachycardia (at a pacing CL 20 to 40 milliseconds shorter than the tachycardia CL) is preferable whenever possible because it facilitates rapid comparison of tachycardia and paced complexes at the end of the pacing train. If sustained tachycardia cannot be induced, mapping is performed during spontaneous nonsustained runs or ectopic beats. Although it is preferable to match the pacing CL and coupling intervals of AESs to those of spontaneous tachycardia or PACs, some reports have suggested that it is not mandatory to stimulate exactly at the same tachycardia CL to reproduce a similar atrial activation sequence and P wave morphology. Pace mapping is preferably performed with unipolar stimuli (up to 10 mA, 2 milliseconds) from the distal electrode of the mapping catheter (cathode) and an electrode in the IVC (anode), or with closely spaced bipolar pacing at twice the diastolic threshold, to eliminate far-field stimulation effects.17
The greater the degree of concordance between the morphology during pacing and that during tachycardia, the closer the catheter will be to the site of origin of the tachycardia. Pace maps with identical or nearly identical matches of the tachycardia morphology in all 12 surface ECG leads and intracardiac atrial electrograms can be indicative of the site of origin of the tachycardia (Fig. 11-18).
Mapping Post-Pacing Intervals
Following overdrive atrial pacing from a given site during a relatively regular and stable focal AT, the PPI represents the sum of the conduction time to reach the perifocal tissue, the time required to penetrate the perifocal tissue and reset the focus, the tachycardia CL, and the conduction back to the pacing site. Consequently, if the pacing site is directly at the AT focus, the PPI should be equivalent to the AT CL as a result of the minimal perifocal conduction time between the pacing site and the AT focus. Conversely, pacing at sites distant from the AT focus results in a PPI that is greater than the AT CL as a result of conduction delay between the pacing site and the focus. In fact, the difference between the PPI and tachycardia CL ([PPI − AT CL] difference) after atrial overdrive pacing of a focal AT was found to have a direct relationship with proximity to the focus, regardless of whether or not the tachycardia was actually entrained. The [PPI − AT CL] difference approaches zero (and is no more than 20 milliseconds) when pacing directly at the focus of the tachycardia. There appears to be no significant overdrive suppression or acceleration of the AT when pacing at a rate just faster than the AT rate, regardless of the underlying AT mechanism. Therefore, the [PPI − AT CL] difference can be a useful adjunct to localize the AT focus and guide successful ablation sites.46
Additionally, the [PPI − AT CL] difference can be valuable in distinguishing AT in close proximity to the sinus node from sinus tachycardia. It appears that AT foci, unlike the sinus node, have a very short perifocal conduction time, a finding suggesting that there was little “perifocal tissue” as compared with the sinus node. As a consequence, the [PPI − AT CL] difference in the setting of focal AT is determined predominantly by the distance from the focus with minimal contribution of the time required to traverse any perifocal tissue, thus explaining the finding that the [PPI − AT CL] difference approaches zero when pacing is performed directly at the AT focus. In contrast, overdrive pacing during sinus tachycardia is associated with a PPI that always exceeds (by more than 80 milliseconds) the sinus CL, even when pacing is performed directly at the origin of the sinus impulse. This finding suggests significant perinodal conduction delay. The [PPI − AT CL] difference can therefore be used to distinguish perinodal focal AT from sinus tachycardia.46
Electroanatomical Mapping
Mapping Technique
Electromagnetic three-dimensional (3-D) mapping (CARTO mapping system [Biosense Webster, Diamond Bar, Calif.] or EnSite NavX system [St. Jude Medical, St. Paul, Minn.] uses a single mapping catheter attached to a system that can precisely localize the catheter tip in 3-D space and store activation time on a 3-D anatomical reconstruction.5,47 Initially, selection of the reference electrogram, positioning of the anatomical reference, and determination of the window of interest are undertaken. The reference catheter is usually placed in the CS (because of its stability) by using an electrode recording a prominent atrial electrogram and ensuring that the ventricular electrogram is not the one picked up by the system.
A 4-mm-tip mapping-ablation catheter is initially positioned, using fluoroscopy, at known anatomical points that serve as landmarks for the electroanatomical map. Anatomical and EP landmarks (IVC, SVC, CS, HB, and tricuspid annulus for RA mapping and the mitral annulus and PVs for LA mapping) are tagged. The catheter is then advanced slowly around the chamber walls to sample multiple points along the endocardium, thus sequentially acquiring the location of its tip together with the local electrogram (see Fig. 11-17 and Video 10). 
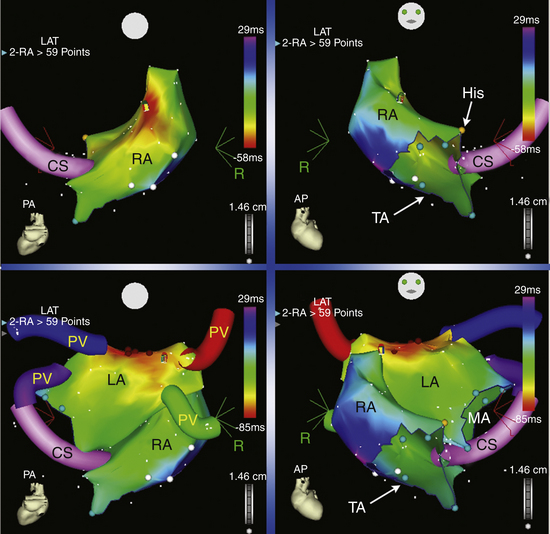
Activation maps display the local activation time by a color-coded overlay on the acquired 3-D geometry. The electroanatomical maps of focal ATs demonstrate radial spread of activation, from the earliest local activation site (red in CARTO, white in NavX) in all directions (a well-defined early activation site surrounded by later activation sites; see Figs. 11-17 and 6-16). In these cases, activation time—the total range of activation times, from earliest to latest—is usually markedly shorter than the tachycardia CL. Conversely, a continuous progression of colors (from red to purple in CARTO, white to purple in NavX), with close proximity of earliest and latest local activation, suggests the presence of a macroreentrant tachycardia. In these cases, total activation time is in a similar range to tachycardia CL (see Fig. 12-10).
A stepwise strategy for mapping of RA and LA focal tachycardias was described in a study using CARTO to avoid time-consuming whole-chamber maps.47 Using this approach, mapping is started with the acquisition of four or five anatomically defined sites at the superior and septal aspects of the tricuspid annulus, and the mapping procedure is strategically continued according to this initial activation sequence. If the initial four-point activation map shows the earliest atrial activation to be at the superior aspect of the tricuspid annulus, mapping is continued toward the free wall of the RA, including the crista terminalis. When the earliest atrial activation within the four-point area is found at the septal aspect of the tricuspid annulus, the map is expanded to the triangle of Koch and the paraseptal space. This strategy was found to differentiate reliably between ATs arising from the free wall of the RA, including the crista terminalis and RA appendage, from those arising from the triangle of Koch and paraseptal space, as well as from left-sided ATs. Once the general area of interest is identified, high-density mapping of this area is undertaken, together with conventional electrographic analysis (see earlier), to identify the site of the earliest activation within this target area. If the unipolar electrogram at the point of earliest activation at the RA septum or at the high posterior wall still shows a significant R wave, or if RF ablation at that site is unsuccessful, a left-sided AT origin is assumed, and the procedure is extended to the LA for dual-chamber maps.
Advantages
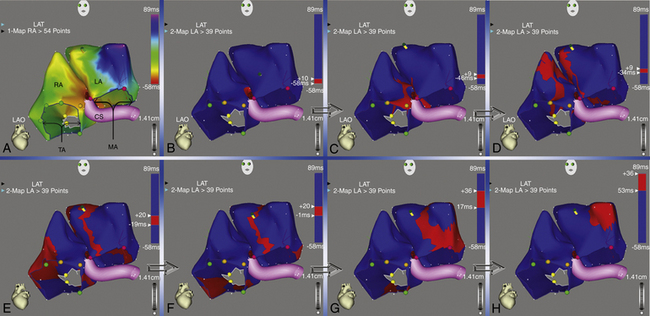
The capability of the mapping system to associate relevant EP information with the appropriate spatial location in the heart and the ability to study activation patterns (with high spatial resolution [less than 1 mm]) during tachycardia in relation to normal anatomical structures and areas of scar significantly facilitate the mapping and ablation procedure. It can suggest the mechanisms underlying the arrhythmia (distinguishing between a focal origin and macroreentrant tachycardia) and allows rapid visualization of the activation wavefront (propagation maps; Fig. 11-19), thus facilitating the identification of appropriate sites for entrainment mapping and pace mapping.
Both electroanatomical mapping systems (CARTO and NavX) provide the capability to create and tag several potential points of interest during the mapping process (e.g., double potentials and sites with good pace maps) and return to them with great precision. These features provide significant advantages over conventional techniques. The catheter can anatomically and accurately revisit a critically important recording site identified previously during the study, even if the tachycardia is no longer present or inducible and map-guided catheter navigation is no longer possible. This accurate repositioning can allow pace mapping from, or further application of, RF energy current to critically important sites that otherwise cannot be performed with a high degree of accuracy and reproducibility. Additionally, fluoroscopy time can be reduced via electromagnetic catheter navigation, and the catheter can be accurately guided to positions removed from fluoroscopic markers (see Fig. 11-17).
Limitations
The sequential data acquisition required for creation of the electroanatomical map remains time-consuming, because the process requires tagging many points, depending on the spatial details needed to analyze a given arrhythmia. Furthermore, because the acquired data are not coherent in time, multiple beats are required, and stable, sustained, or frequently repetitive arrhythmia is usually needed for creation of the activation map. Single PACs or nonsustained AT can be mapped, although at the expense of an appreciable amount of time. Unlike with the CARTO system, activation times can be acquired simultaneously by the EnSite NavX system from multiple poles on all catheters used during the study (and not just the mapping-ablation catheter).
Mapping Nonsustained Focal Atrial Tachycardia
Ensite Noncontact Mapping System
The EnSite 3000 noncontact mapping system (St. Jude Medical, St. Paul, Minn.) consists of a noncontact catheter with a multielectrode array surrounding a 7.5-mL balloon mounted at the distal end. Raw data detected by the multielectrode are transferred to a silicon graphics workstation via a digitalized amplifier system. The multielectrode array is used to construct a 3-D computer model of the virtual endocardium. The system is able to reconstruct more than 3000 unipolar electrograms simultaneously and superimpose them onto the virtual endocardium, thus producing isopotential maps with a color range representing voltage amplitude. Electrical potentials at the endocardial surface some distance away are calculated. Sites of early endocardial activity, which are likely adjacent to the origin of the AT, are usually identifiable. Noncontact mapping can rapidly identify AT foci and thus delineate starting points for conventional mapping.48,49
The main advantage of noncontact endocardial mapping is its ability to recreate the endocardial activation sequence from simultaneously acquired multiple data points over a few (theoretically one) tachycardia beats, without requiring sequential point-to-point acquisitions. Therefore, it can be of great value in mapping nonsustained arrhythmias, PACs, irregular ATs, and rhythms that are not hemodynamically stable.48,49
Technique
After the chamber geometry is determined, mapping of the arrhythmia can begin. The data acquisition process is performed automatically by the system, and all data for the entire chamber are acquired simultaneously. The system then reconstructs unipolar electrograms simultaneously and superimposes them onto the virtual endocardium, thus producing isopotential maps with a color range representing voltage amplitude. A default high-pass filter setting of 2 Hz is used to preserve components of slow conduction on the isopotential map. Color settings are adjusted so that the color range matches 1 to 1 with the millivolt range of the electrogram deflection of interest. The color scale for each isopotential map is set so that white indicates most negative potential and blue indicates least negative potential. Activation can be tracked on the isopotential map throughout the cycle to the onset of the tachycardia beat. Virtual electrograms are then reconstructed at sites of earliest activation on the isopotential maps to look for a unipolar QS pattern. If the atrial electrograms overlap with the T wave, a VES may be delivered to accelerate ventricular depolarization and repolarization and may reveal the following atrial complex without far-field interference.
Isochronal maps can also be created. These maps represent progression of activation throughout the chamber relative to a user-defined electrical reference timing point. Contact mapping using the conventional ablation catheter may also be performed at sites of interest to supplement noncontact mapping findings, and color-coded contact activation maps can be displayed on the same 3-D geometry. Once earliest activation is identified, the site is labeled on the 3-D map, and the locator signal is used to navigate the ablation catheter to it in real time during tachycardia or during normal rhythm when sustained tachycardia is not inducible.49
The origin of AT is defined as the earliest site showing a single spot on the isopotential map and a QS pattern on the noncontact unipolar electrogram. Early sites with an rS pattern can represent foci that are epicardial in origin or early activation sites in an adjacent structure. The earliest site that shows an rS pattern with a sudden increase of peak negative potential on the noncontact unipolar electrogram after the AT depolarizes is considered to represent the “break-out point” or “exit” from the tachycardia focus, and the path between the origin and the break-out point likely represents the preferential pathway of conduction from the origin of the AT. As such, the traditionally defined origin of focal AT (by contact mapping techniques), whereby centrifugal activation occurs, potentially represents the break-out point, rather than the real origin of the tachycardia. Ablation at the origin of tachycardia or along the proximal path to the break-out point typically eliminates the arrhythmia.49
Multielectrode Basket Catheter Mapping
Technique
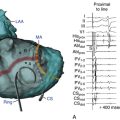
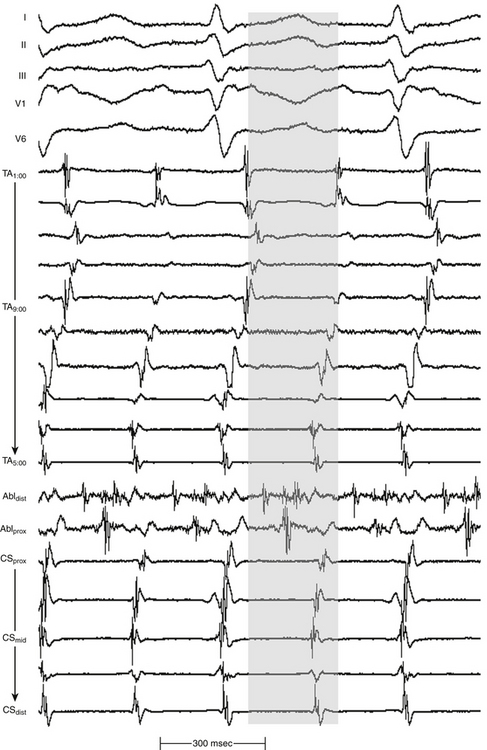
The size of the atrium is initially evaluated (usually with echocardiography) to help select the appropriate size of the basket catheter. The collapsed basket catheter is advanced under fluoroscopy guidance through an 11 Fr long sheath into the RA or LA; the catheter is then expanded (Fig. 11-20). Electroanatomical relations are determined by fluoroscopically identifiable markers (spline A has one marker and spline B has two markers located near the shaft of the basket catheter). Additionally, the electrical signals recorded from certain electrodes (e.g., annular or HB electrograms) can help identify the location of those particular splines.
After basket catheter deployment, the conventional catheters are introduced and placed in standard positions. The ablation catheter is placed in the region of earliest activity and is used for more detailed mapping of the site of origin of the AT (see Fig. 11-20). The Astronomer (Boston Scientific, Natick, Mass.) navigation system permits precise and reproducible guidance of the ablation catheter tip electrode to targets identified by the basket catheter.
Localized High-Density Mapping Catheter
The PentaRay (Biosense Webster, Diamond Bar, Calif.) is a high-density, multielectrode mapping catheter that may be used for mapping of focal AT. This 7 Fr steerable catheter (180 degrees of unidirectional flexion) has 20 electrodes distributed over 5 soft radiating spines (1-mm electrodes separated by 4-4-4 or 2-6-2 mm interelectrode spacing), allowing splaying of the catheter to cover a surface diameter of 3.5 cm. The spines have alphabetical nomenclature (A to E), with spines A and B recognized by radiopaque markers (see Fig. 6-3).50
Ablation
Target of Ablation
The site of origin (or focus) of focal AT is the target of ablation.31,42 Bipolar electrograms at the site of successful ablation are typically fractionated and demonstrate moderate to marked presystolic timing. Average presystolic intervals at sites of successful ablation are generally longer than 30 milliseconds (but not mid-diastolic, as in the case of macroreentrant AT). However, the key to successful mapping is finding the earliest site, because there is great variability in the presystolic interval that will be obtained at successful ablation sites (10 to 80 milliseconds). QS unipolar electrogram morphology is highly predictive of the successful ablation site and supplements findings of bipolar mapping. Timings of the earliest bipolar and unipolar electrogram should be in agreement (see Fig. 11-11).
Focal ATs arising from the PVs can be targeted by either focal ablation or electrical isolation of the culprit PV. The latter approach can potentially limit the risk of PV stenosis, especially when targeting more distal foci within the PV.21,22
Ablation Technique
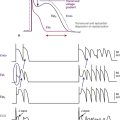
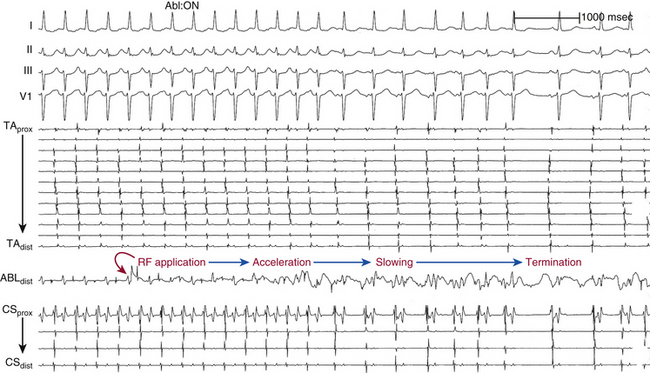
RF power delivery should be adjusted to achieve a tip temperature of 55° to 65°C.31,42 The response of the AT focus to a successful RF application should be rapid, typically within a few seconds of RF energy delivery. The most common response to successful ablations is abrupt termination. However, in some patients, transient acceleration precedes termination; in others, gradual slowing precedes termination (Fig. 11-21). If the tachycardia is not affected within 10 to 20 seconds, RF energy application is terminated, and the catheter is repositioned slightly for a repeat attempt. Prolonged RF applications beyond 10 to 20 seconds without accompanying changes in AT rate are usually nonproductive.
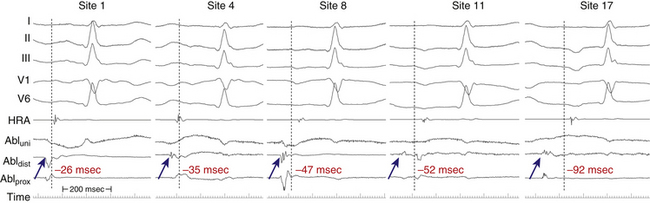
Extensive ablation in one area that does not terminate AT may cause enough damage to block the spread of activation partially in the region, thus causing a change in P wave morphology (although the actual focus may not have changed), as well as slow propagation of the tachycardia impulse away from the focus of the tachycardia to activate atrial myocardium. The latter effect can result in an increase in the interval between the presystolic electrogram at the focus and P wave onset (Fig. 11-22).
Ablation of focal ATs near the AVN or HB (in the triangle of Koch) requires special precautions. Titrated RF energy output should be used, starting with 5 W and increasing by 5 W every 10 seconds of energy application, up to a maximum of 40 W. Additionally, it is preferable to deliver RF energy during AT; if AT terminates during RF delivery, the RF application is continued at the same power output for 30 seconds and then repeated for 30 seconds or more. If the AT does not terminate with an RF output of 40 W for 30 seconds, then another site should be sought. If accelerated junctional rhythm develops after AT termination, overdrive atrial pacing should be performed to monitor AV conduction, or RF application should be stopped and other sites sought. To reduce the risk of AV block, RF delivery should be immediately discontinued when (1) impedance rises suddenly (more than 10 Ω), (2) the PR interval (during NSR, atrial pacing, or AT) prolongs, (3) AV block develops, (4) retrograde conduction block is observed during junctional ectopy, or (5) fast junctional tachycardia (CL shorter than 350 milliseconds) occurs because it may herald imminent heart block.
Use of Intracardiac Echocardiography to Guide Mapping and Ablation
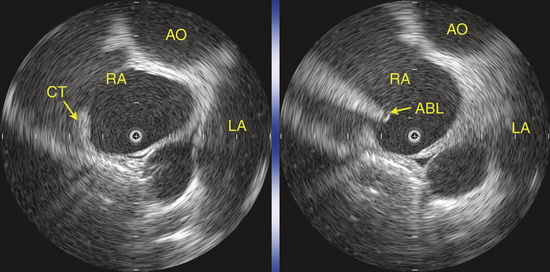
Intracardiac echocardiography (ICE) can be useful to provide focused real-time images of the endocardial surfaces critical for positioning of catheters, establish catheter tip–tissue contact, and monitor energy delivery in the beating heart. In particular, ICE has been used in cristal ATs. In view of the variability in the anatomical course of the crista terminalis, ICE can assist in accurate positioning of the multipolar mapping catheter and guide precise mapping along this structure with the mapping-ablation catheter (Fig. 11-23).
Endpoints of Ablation
1. Saoudi N., Cosio F., Waldo A., et al. Classification of atrial flutter and regular atrial tachycardia according to electrophysiologic mechanism and anatomic bases: a statement from a joint expert group from the Working Group of Arrhythmias of the European Society of Cardiology and the North American Society of Pacing and Electrophysiology. J Cardiovasc Electrophysiol. 2001;12:852-866.
2. Scheinman M.M., Yang Y., Cheng J. Atrial flutter: part II. Nomenclature. Pacing Clin Electrophysiol. 2004;27:504-506.
3. Morton J.B., Sanders P., Das A., et al. Focal atrial tachycardia arising from the tricuspid annulus: electrophysiologic and electrocardiographic characteristics. J Cardiovasc Electrophysiol. 2001;12:653-659.
4. Badhwar N., Kalman J.M., Sparks P.B., et al. Atrial tachycardia arising from the coronary sinus musculature: electrophysiological characteristics and long-term outcomes of radiofrequency ablation. J Am Coll Cardiol. 2005;46:1921-1930.
5. Hoffmann E., Reithmann C., Nimmermann P., et al. Clinical experience with electroanatomic mapping of ectopic atrial tachycardia. Pacing Clin Electrophysiol. 2002;25:49-56.
6. Kistler P.M., Roberts-Thomson K.C., Haqqani H.M., et al. P-wave morphology in focal atrial tachycardia: development of an algorithm to predict the anatomic site of origin. J Am Coll Cardiol. 2006;48:1010-1017.
7. Kistler P.M., Sanders P., Fynn S.P., et al. Electrophysiological and electrocardiographic characteristics of focal atrial tachycardia originating from the pulmonary veins: acute and long-term outcomes of radiofrequency ablation. Circulation. 2003;108:1968-1975.
8. Tritto M., Zardini M., De Ponti R., Salerno-Uriarte J.A. Iterative atrial tachycardia originating from the coronary sinus musculature. J Cardiovasc Electrophysiol. 2001;12:1187-1189.
9. Volkmer M., Antz M., Hebe J., Kuck K.H. Focal atrial tachycardia originating from the musculature of the coronary sinus. J Cardiovasc Electrophysiol. 2002;13:68-71.
10. Pavin D., Boulmier D., Daubert J.C., Mabo P. Permanent left atrial tachycardia: radiofrequency catheter ablation through the coronary sinus. J Cardiovasc Electrophysiol. 2002;13:395-398.
11. Navarrete A.J., Arora R., Hubbard J.E., Miller J.M. Magnetic electroanatomic mapping of an atrial tachycardia requiring ablation within the coronary sinus. J Cardiovasc Electrophysiol. 2003;14:1361-1364.
12. Medi C., Kalman J.M. Prediction of the atrial flutter circuit location from the surface electrocardiogram. Europace. 2008;10:786-796.
13. Matsuoka K., Kasai A., Fujii E., et al. Electrophysiological features of atrial tachycardia arising from the atrioventricular annulus. Pacing Clin Electrophysiol. 2002;25:440-445.
14. Tsai C.F., Tai C.T., Hsieh M.H., et al. Initiation of atrial fibrillation by ectopic beats originating from the superior vena cava: electrophysiological characteristics and results of radiofrequency ablation. Circulation. 2000;102:67-74.
15. Das S., Neuzil P., Albert C.M., et al. Catheter ablation of peri-AV nodal atrial tachycardia from the noncoronary cusp of the aortic valve. J Cardiovasc Electrophysiol. 2008;19:231-237.
16. Shehata M., Liu T., Joshi N., et al. Atrial tachycardia originating from the left coronary cusp near the aorto-mitral junction: anatomic considerations. Heart Rhythm. 2010;7:987-991.
17. Wharton M., Shenasa H., Barold H., et al. Ablation of atrial tachycardia in adults. In: Huang S.K.S., Wilber D.J., editors. Radiofrequency catheter ablation of cardiac arrhythmias: basic concepts and clinical applications. ed 2. Armonk, NY: Futura; 2000:139-164.
18. Roberts-Thomson K.C., Kistler P.M., Kalman J.M. Focal atrial tachycardia I: clinical features, diagnosis, mechanisms, and anatomic location. Pacing Clin Electrophysiol. 2006;29:643-652.
19. Blomstrom-Lundqvist C., Scheinman M.M., Aliot E.M., et al. ACC/AHA/ESC guidelines for the management of patients with supraventricular arrhythmias—executive summary: a report of the American College of Cardiology/American Heart Association Task Force on Practice Guidelines and the European Society of Cardiology Committee for Practice Guidelines (writing committee to develop guidelines for the management of patients with supraventricular arrhythmias). Circulation. 2003;108:1871-1909.
20. Medi C., Kalman J.M., Haqqani H., et al. Tachycardia-mediated cardiomyopathy secondary to focal atrial tachycardia: long-term outcome after catheter ablation. J Am Coll Cardiol. 2009;53:1791-1797.
21. Teh A.W., Kalman J.M., Medi C., et al. Long-term outcome following successful catheter ablation of atrial tachycardia originating from the pulmonary veins: absence of late atrial fibrillation. J Cardiovasc Electrophysiol. 2010;21:747-750.
22. Baranowski B., Wazni O., Lindsay B., et al. Focal ablation versus single vein isolation for atrial tachycardia originating from a pulmonary vein. Pacing Clin Electrophysiol. 2010;33:776-783.
23. Hu Y.F., Higa S., Huang J.L., et al. Electrophysiologic characteristics and catheter ablation of focal atrial tachycardia with more than one focus. Heart Rhythm. 2009;6:198-203.
24. Josephson M.E. Supraventricular tachycardias. In Josephson M.E., editor: Clinical cardiac electrophysiology, ed 4, Philadelphia: Lippincott Williams & Wilkins, 2008. pp 175–284
25. Porter M.J., Morton J.B., Denman R., et al. Influence of age and gender on the mechanism of supraventricular tachycardia. Heart Rhythm. 2004;1:393-396.
26. Hillock R.J., Kalman J.M., Roberts-Thomson K.C., et al. Multiple focal atrial tachycardias in a healthy adult population: characterization and description of successful radiofrequency ablation. Heart Rhythm. 2007;4:435-438.
27. Brown J.P., Krummen D.E., Feld G.K., Narayan S.M. Using electrocardiographic activation time and diastolic intervals to separate focal from macro-re-entrant atrial tachycardias. J Am Coll Cardiol. 2007;49:1965-1973.
28. Wang Y., Cuculich P.S., Woodard P.K., et al. Focal atrial tachycardia after pulmonary vein isolation: noninvasive mapping with electrocardiographic imaging (ECGI). Heart Rhythm. 2007;4:1081-1084.
29. Teh A.W., Kistler P.M., Kalman J.M. Using the 12-lead ECG to localize the origin of ventricular and atrial tachycardias: part 1. Focal atrial tachycardia. J Cardiovasc Electrophysiol. 2009;20:706-709.
30. Ellenbogen K.A., Stambler B.S., Wood M.A. Atrial tachycardia. In: Zipes D.P., Jalife J., editors. Cardiac electrophysiology: from cell to bedside. ed 5. Philadelphia: Saunders; 2009:589-604.
31. Hsieh M., Chen S. Catheter ablation of focal atrial tachycardia. In: Zipes D.P., Haissaguerre M., editors. Catheter ablation of arrhythmias. Armonk, NY: Futura; 2002:185-204.
32. Roberts-Thomson K.C., Kistler P.M., Haqqani H.M., et al. Focal atrial tachycardias arising from the right atrial appendage: electrocardiographic and electrophysiologic characteristics and radiofrequency ablation. J Cardiovasc Electrophysiol. 2007;18:367-372.
33. Gerstenfeld E.P., Dixit S., Bala R., et al. Surface electrocardiogram characteristics of atrial tachycardias occurring after pulmonary vein isolation. Heart Rhythm. 2007;4:1136-1143.
34. Kistler P.M., Sanders P., Hussin A., et al. Focal atrial tachycardia arising from the mitral annulus: electrocardiographic and electrophysiologic characterization. J Am Coll Cardiol. 2003;41:2212-2219.
35. Crawford T.C., Mukerji S., Good E., et al. Utility of atrial and ventricular cycle length variability in determining the mechanism of paroxysmal supraventricular tachycardia. J Cardiovasc Electrophysiol. 2007;18:698-703.
36. Knecht S., Matsuo S., Lim K.-T., et al. Focal vs. macroreentrant atrial tachycardia after prior ablation: value of cycle length variability. Heart Rhythm. 2007;4(Suppl S):S238.
37. Iwai S., Markowitz S.M., Stein K.M., et al. Response to adenosine differentiates focal from macroreentrant atrial tachycardia: validation using three-dimensional electroanatomic mapping. Circulation. 106, 2002. 2793–2799
38. Knight B.P., Ebinger M., Oral H., et al. Diagnostic value of tachycardia features and pacing maneuvers during paroxysmal supraventricular tachycardia. J Am Coll Cardiol. 2000;36:574-582.
39. Maruyama M., Kobayashi Y., Miyauchi Y., et al. The VA relationship after differential atrial overdrive pacing: a novel tool for the diagnosis of atrial tachycardia in the electrophysiologic laboratory. J Cardiovasc Electrophysiol. 2007;18:1127-1133.
40. Colombowala I.K., Massumi A., Rasekh A., et al. Variability in post-pacing intervals predicts global atrial activation pattern during tachycardia. J Cardiovasc Electrophysiol. 2008;19:142-147.
41. Vijayaraman P., Lee B.P., Kalahasty G., et al. Reanalysis of the “pseudo A-A-V” response to ventricular entrainment of supraventricular tachycardia: importance of His-bundle timing. J Cardiovasc Electrophysiol. 2006;17:25-28.
42. Josephson M.E. Catheter and surgical ablation in the therapy of arrhythmias. In Josephson M.E., editor: Clinical cardiac electrophysiology, ed 4, Philadelphia: Lippincott Williams & Wilkins, 2008. pp 746–888
43. Morady F. Catheter ablation of supraventricular arrhythmias: state of the art. J Cardiovasc Electrophysiol. 2004;15:124-139.
44. Chang K.C., Chen J.Y., Lin Y.C., Huang S.K. Usefulness of interatrial conduction time to distinguish between focal atrial tachyarrhythmias originating from the superior vena cava and the right superior pulmonary vein. J Cardiovasc Electrophysiol. 2008;19:1231-1235.
45. Lee S.H., Tai C.T., Lin W.S., et al. Predicting the arrhythmogenic foci of atrial fibrillation before atrial transseptal procedure: implication for catheter ablation. J Cardiovasc Electrophysiol. 2000;11:750-757.
46. Mohamed U., Skanes A.C., Gula L.J., et al. A novel pacing maneuver to localize focal atrial tachycardia. J Cardiovasc Electrophysiol. 2007;18:1-6.
47. Wetzel U., Hindricks G., Schirdewahn P., et al. A stepwise mapping approach for localization and ablation of ectopic right, left, and septal atrial foci using electroanatomic mapping. Eur Heart J. 2002;23:1387-1393.
48. Seidl K., Schwacke H., Rameken M., et al. Noncontact mapping of ectopic atrial tachycardias: different characteristics of isopotential maps and unipolar electrogram. Pacing Clin Electrophysiol. 2003;26:16-25.
49. Higa S., Tai C.T., Lin Y.J., et al. Focal atrial tachycardia: new insight from noncontact mapping and catheter ablation. Circulation. 2004;109:84-91.
50. Sanders P., Hocini M., Jais P., et al. Characterization of focal atrial tachycardia using high-density mapping. J Am Coll Cardiol. 2005;46:2088-2099.