Chapter 31 Ventricular Arrhythmias in Inherited Channelopathies
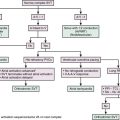
Ventricular fibrillation (VF) or pulseless ventricular tachycardia (VT) is the initial rhythm recorded in 25% to 36% of witnessed cardiac arrests occurring at home, but in a much higher proportion (38% to 79%) of witnessed cardiac arrests occurring in a public setting.1 The majority of SCD events are associated with structural heart disease, with coronary artery disease and its complications being involved in up to 60% to 80% of cases, followed by other cardiomyopathies. However, in 10% to 20% of SCDs, no cardiac structural abnormalities are detectable. The lack of an apparent cause in many of those cases initially led to the classification as “sudden unexplained death syndrome” (SUDS) or “sudden infant death syndrome” (SIDS). Many of these are caused by primary electrical disorders, including long QT syndrome (LQTS), catecholaminergic polymorphic VT (CPVT), Brugada syndrome, and short QT syndrome (SQTS), as well as cases identified as “idiopathic VF” when the underlying cause often remains unknown.2
Long QT Syndrome
The LQTS is a rare inherited cardiac channelopathy with variable penetrance that is associated with an abnormally prolonged QT interval and an increased propensity to life-threatening ventricular arrhythmias in the presence of a structurally normal heart.3–5
The progressive unraveling of the molecular basis of LQTS has disclosed that whereas the autosomal dominant Romano-Ward syndrome depends on mutations affecting at least five genes encoding sodium (Na+) and potassium (K+) channels, the autosomal recessive Jervell and Lange-Nielsen syndrome depends on homozygous or compound heterozygous mutations of either one of the two genes encoding the subunits forming the channel conducting the slowly activating delayed rectifier K+ current (IKs). Being a recessive disease, the Jervell and Lange-Nielsen syndrome is far less common than the Romano-Ward syndrome.3,6,7
The initial molecular studies suggested that all genes linked to the LQTS phenotype encode for various subunits of cardiac ion channels. Subsequent findings, however, revealed that LQTS could also be caused by mutations of genes coding for channel-associated cellular structural proteins as well. Nonetheless, the concept that LQTS genes ultimately affect cardiac ion currents, either directly (ion channel mutations) or indirectly (modulators), still holds true.3
Epidemiology
There are no systematic studies on LQTS prevalence in the general population. A recent estimate of the prevalence of LQTS is 1:2000 based on the results of genetic screening in families and the incidence of compound heterozygotes (i.e., persons with two mutations). However, the clinical disease is less common (approximately 1 in 5000) because most mutation carriers remain asymptomatic.8 The usual mode of inheritance is autosomal dominant, with the exception of the autosomal recessive Jervell and Lange-Nielsen type.6
Clinical Presentation and Natural Course
Romano-Ward Syndrome
Most information regarding the clinical features of LQTS have been derived from analysis of data from large series of LQTS patients, the largest of which is the International LQTS Registry. LQTS probands are diagnosed at an average age of 21 years. The clinical course of patients with LQTS is variable, owing to incomplete penetrance. It is influenced by age, genotype, gender, environmental factors, therapy, and possibly other modifier genes. At least 37% of individuals with the LQT1 phenotype, 54% with the LQT2 phenotype, and 82% with the LQT3 phenotype remain asymptomatic and many are referred for evaluation because of the diagnosis of LQTS of a family member or the identification of long QT interval on surface electrocardiogram (ECG) obtained for unrelated reasons.5
Syncope is the most frequent symptom, occurring in 50% of symptomatic probands by the age of 12 years, and in 90% by the age of 40 years. The incidence of syncope in LQTS patients is approximately 5% per year, but can vary depending on the LQTS genotype. On the other hand, the incidence of SCD is much lower, approximately 1.9% per year. Nonfatal events (syncope and aborted cardiac arrest) in LQTS patients remain the strongest predictors of subsequent LQTS-related fatal events. The overall risk of subsequent SCD in an LQTS patient who has experienced a previous episode of syncope is approximately 5% per year.9
LQT1, LQT2, and LQT3 comprise more than 90% of all genotyped LQTS cases. LQT1 is the most frequent genetic form of LQTS, accounting for 42% to 45% of genotyped LQTS cases. LQT2 is the second most prevalent form of the disease and accounts for 35% to 45% of genotyped LQTS cases (Table 31-1).5,10
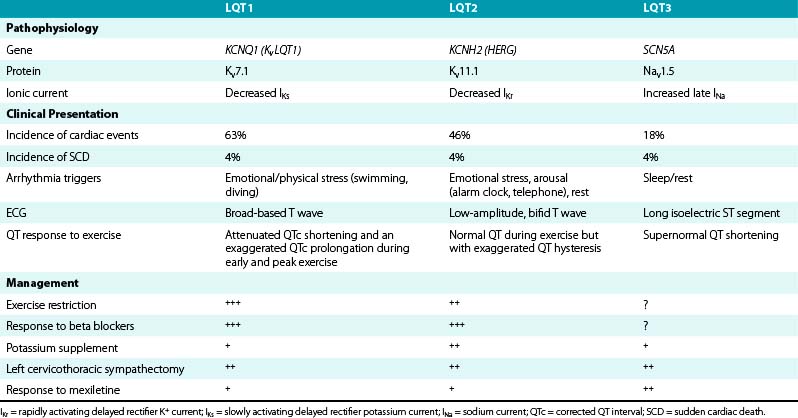
Risk and lethality of cardiac events among untreated individuals are strongly influenced by the genotype. The frequency of cardiac events is significantly higher among LQT1 (63%) and LQT2 (46%) patients than among patients with the LQT3 genotype (18%). However, the likelihood of dying during a cardiac event is significantly higher among LQT3 patients (20%) than among those with the LQT1 (4%) or the LQT2 (4%) genotype.10–12
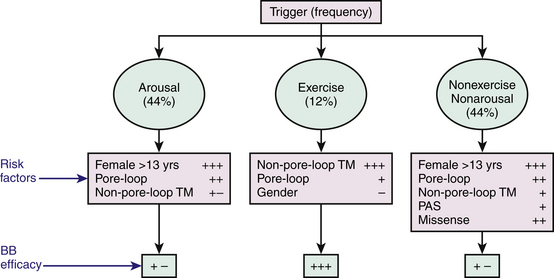
Cardiac events (syncope, cardiac arrest, SCD) in LQTS patients do not occur at random; the factors precipitating cardiac events seem to be specific for each genetic variant. LQT1 patients present an increased risk during physical or emotional stress (90%), and only 3% of the arrhythmic episodes occur during rest/sleep. Swimming and diving appear as highly specific triggers in LQT1 patients. LQT2 patients are at higher risk for lethal events during arousal (44%), but are also at risk during sleep and at rest (43%). Only 13% of cardiac events occur during exercise. Cardiac events in LQT2 patients are typically associated with arousal and auditory stimulation. In fact, the triggering of events by startling, sudden awakening, or sudden loud noises (such as a telephone or alarm clock ring) is virtually diagnostic of LQT2. Notably, individual factors such as gender, location and type of mutation, and QTc prolongation appear to be associated with trigger-specific events; female adolescents with LQT2 appear to experience a greater than ninefold increase in the risk for arousal-triggered cardiac events compared with male adolescents in the same age group. In contrast, gender does not seem to be a significant risk factor for exercise-triggered events among carriers of the same genotype (Fig. 31-1).13
On the other hand, LQT3 patients experience cardiac events largely while asleep or at rest (65%) without emotional arousal, and only occasionally during exercise (4%). Notably, the majority of patients continue to experience their cardiac events under conditions similar to their first classified event.10,11
The effect of gender on outcome is age-dependent, with boys being at higher risk than girls during childhood and early adolescence, but no significant difference in gender-related risk being observed between 13 and 20 years. The gender-related risk reverses afterward, and female patients maintain higher risk than male patients throughout adulthood.14
The genotype can potentially affect the clinical course of the LQTS and modulate the effects of age and gender on clinical manifestations.15 Although the three major LQTS genotypes (LQT1, LQT2, or LQT3) are associated with similar risks for life-threatening cardiac events in children and adolescents after adjustment for clinical risk factors (including gender, QTc duration, and time-dependent syncope), the risk for cardiac events is augmented in LQT2 women aged 21 to 40 years and in LQT3 patients greater than 40 years of age. The risk of syncope and SCD decreases during pregnancy but increases in the postpartum period, especially among LQT2 women.10–12
Jervell and Lange-Nielsen Syndrome
Patients with Jervell and Lange-Nielsen syndrome have a more severe cardiac phenotype than those with Romano-Ward syndrome. Complete loss of IKs in hair cells and endolymph of the inner ear results in congenital bilateral sensorineural deafness. Patients begin to experience cardiac events very early in life; 15% suffer a cardiac event during the first year of life, 50% by age 3 years, and 90% by age 18 years. In untreated patients, approximately 50% die of ventricular arrhythmias by the age of 15 years. Furthermore, SCD occurs in more than 25% of patients despite medical therapy.6
The conditions that trigger the cardiac events are, overall, very similar to those described for LQT1. Up to 95% of events occur during sympathetic activation (exercise and emotions), and only 5% of the events occur at rest or during sleep.6
Andersen-Tawil Syndrome
Andersen-Tawil syndrome (LQT7) is a rare autosomal dominant disorder caused by mutations of the gene KCNJ2, which encodes the inward rectifier potassium channel, Kir2.1. This syndrome is characterized by a triad of a skeletal muscle phenotype (periodic paralysis caused by abnormal muscle relaxation), a cardiac phenotype (borderline or mildly prolonged QT interval, prominent U waves, and adrenergically mediated ventricular arrhythmias), and distinctive skeletal dysmorphic features (low-set ears, ocular hypertelorism, small mandible, fifth-digit clinodactyly, syndactyly, short stature, scoliosis, and a broad forehead).16–18
Affected individuals present initially with either periodic paralysis or cardiac symptoms (palpitations, syncope, or both) in the first or second decade. The arrhythmias displayed by affected patients are generally more benign compared with other types of LQTS and rarely degenerate into hemodynamically compromising rhythms like torsades de pointes, as ultimately evidenced by the lack of SCD cases so far.17 Intermittent weakness occurs spontaneously, or may be triggered by prolonged rest or rest following exertion; however, the frequency, duration, and severity of symptoms are variable between and within affected individuals, and are often linked to fluctuations in plasma potassium levels. Mild permanent weakness is common.
Timothy Syndrome
Extracardiac features include cutaneous syndactyly (variably involving the fingers and toes), which is observed in almost all patients. Facial findings (observed in approximately 85% of individuals) include low-set ears, flat nasal bridge, thin upper lip, small upper jaw, small, misplaced teeth, and round face. Neuropsychiatric involvement occurs in approximately 80% of individuals and includes global developmental delays and autism spectrum disorders.
Electrocardiographic Features
QT Interval Measurement
QT interval is the body surface representation of the duration of ventricular depolarization and subsequent repolarization. Any deviation or dispersion of either depolarization (e.g., bundle branch block) or repolarization (e.g., prolongation or dispersion of the action potential duration) prolongs the QT interval.19
An accurate measurement of the QT interval is important for the diagnosis of LQTS. A 12-lead ECG tracing at a paper speed of 25 mm/sec at 10 mm/mV is usually adequate to make accurate measurements of the QT interval. The QT interval is measured as the interval from the onset of the QRS complex, that is, the earliest indication of ventricular depolarization, to the end of the T wave, that is, the latest indication of ventricular repolarization. The QT interval is measured in all ECG leads where the end of the T wave can be clearly defined (preferably leads II and V5 or V6), with the longest value being used. The end of the T wave is the point at which the descending limb of the T wave intersects the isoelectric line. Three to five consecutive cardiac cycles are taken to derive average values for R-R, QRS, and QT intervals.5,20–23
When the end of the T wave is indistinct, or if a U wave is superimposed or inseparable from the T wave, it is recommended that the QT be measured in the leads not showing U waves (often aVR and aVL) or that the downslope of the T wave be extended by drawing a tangent to the steepest proportion of the downward limb of the T wave until it crosses the baseline (i.e., the T-P segment). Nonetheless, it should be recognized that defining the end of the T wave in these ways might underestimate the QT interval.22 Some investigators advocate measurement of both the QT interval and the QTU interval (with the latter measurement taken to the end of the U wave as it intersects the isoelectric line) because the QTU interval probably reflects the total duration of ventricular depolarization.20
The highest diagnostic and prognostic value in LQTS families has been observed for QTc in leads II and V5 of the 12-lead ECG. Thus, QTc should be obtained in one of these leads if measured in only one ECG lead. However, other leads presented with similar diagnostic (aVR) or prognostic (V2/V3) value alone, and, in general, the lead with the longest QT interval is used for measurement.23
QT Interval Correction for Gender
The QT interval shortens after puberty in men but not women, resulting in a longer QT in women than in men. The reported gender difference in various studies varies from 6 to 10 milliseconds in older age groups and from 12 to 15 milliseconds in younger adults. Overall, the gender difference in the rate-corrected QT interval becomes small after 40 years of age and practically disappears in older men and women. Separate gender- and age-specific QT adjustment formulas have been proposed to accommodate these differences.22
QT Interval Correction for Heart Rate
Because the heart rate (R-R cycle length) is the primary modifier of ventricular action potential, QT interval measurements must be corrected for the individual’s R-R interval (QTc) to allow for comparisons. Various correction formulas have been developed (Table 31-2), the most widely used being the formula derived by Bazett in 1920 from a graphic plot of measured QT intervals in 39 young subjects. The Bazett correction, however, performs less well at high and low heart rates (undercorrects at fast heart rates and overcorrects at slow heart rates).20 Therefore, it was recommended by the American Heart Association/American College of Cardiology Foundation/Heart Rhythm Society (AHA/ACC/HRS) in 2009 that linear regression functions rather than the Bazett formula be used for QT rate correction. In addition to the Bazett formula, many other correction formulas, such as the Framingham-Sagie, Fridericia, Hodges, and Nomogram-Karjalainen formulas, have been proposed.5,21,22
TABLE 31-2 Formulas for Heart Rate Correction of the QT Interval
| Bazett | QTcB = QT/(R-R interval)1/2 (all intervals in seconds) |
| Framingham-Sagie | QTcFa = QT + 154(1 − 60/heart rate) |
| Fridericia | QTcFi = QT/(R-R interval)1/3 |
| Hodges | QTcH = QT + 1.75(heart rate − 60) |
| Nomogram-Karjalainen | QTcN = QT + nomogram correction factor |
In a recent report, the accuracy of five different QT correction formulas was evaluated for determining drug-induced QT interval prolongation. The Bazett correction formula provided the most marked QTc variations at heart rates distant from 60 beats/min. The Fridericia formula was found to overestimate QTc at faster heart rates, being more reliable at slower heart rates. Conversely, the Hodges, Nomogram, and Framingham formulas demonstrated less QTc variability over the whole range of the investigated heart rates and seemed to be similarly satisfactory at heart rates of up to 100 beats/min. Among them, the Hodges method, followed by the Nomogram-Karjalainen method, appeared to be the most accurate in determining the correct QTc and subsequently in guiding clinical decisions.21
Importantly, there exists a substantial interindividual variability of the QT/R-R relationship, which represents the relationship between QT duration and heart rate. In contrast, a high intraindividual stability of the QT/R-R pattern has been shown, suggesting that a genetic component might partly determine individual QT length. Therefore, population-based and averaged QT correction cannot accurately predict a normal QT interval at a given R-R interval in a given patient. Individual-specific QT/R-R hysteresis correction in combination with individualized heart rate correction can potentially reduce intrasubject QTc variability.19,24
QT Interval Correction to QRS Duration
The QT interval prolongs in ventricular conduction defects, and an adjustment for QRS duration becomes necessary. This can be accomplished best by incorporating QRS duration and R-R interval as covariates into the QT adjustment formula or by using the JT interval (QT duration minus QRS duration). If the JT interval is chosen, normal standards established specifically for the JT interval should be used. QT and JT adjustment formulas have recently been introduced for use in the setting of prolonged ventricular conduction. With confirmation, they may be incorporated into automated algorithms to provide appropriate correction factors.22
QT Interval Prolongation
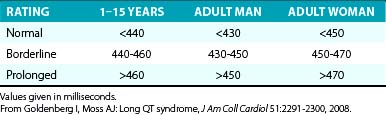
The diagnosis of QT interval prolongation can be challenging because of the difficulty in defining the “end” of the T wave and the need for correction for heart rate, age, and gender. This is further complicated by the lack of linear behavior of the Bazett formula at slower and faster heart rates as well as the arbitrary definition of the gender-based diagnostic cut-off values that define an abnormally prolonged QTc (QTc of 450 milliseconds for men and QTc of 460 milliseconds for women; Table 31-3).
Furthermore, no single QTc value separates all LQTS patients from healthy controls. The QT interval is subject to large variations even in healthy individuals, and substantial overlap exists with QTc values obtained from LQTS mutation carriers in the range between 410 and 470 milliseconds. In up to 40% of LQTS patients QTc intervals fall in the normal range. Nevertheless, QTc values greater than 470 milliseconds in men and greater than 480 milliseconds in women are practically never seen among healthy individuals (especially when their heart rate is 60 to 70 beats/min), but LQTS cannot be excluded merely by the presence of a normal QTc interval.25 Therefore, unless excessive QTc prolongation (>500 milliseconds, corresponding to the upper quartile among affected genotyped individuals) is present, the QTc interval should always be evaluated in conjunction with the other diagnostic criteria. In the case of borderline QTc prolongation, serial ECG and 24-hour Holter recordings can potentially assist in establishing QT prolongation, as can various challenge tests.7
Of note, a considerable variability in QTc interval duration can be observed in patients with LQTS when serial ECGs are recorded during follow-up. This time-dependent change in QTc duration is an important determinant of the phenotypic expression of the disease. Up to 40% of patients with LQTS will have QTc greater than 500 milliseconds at least once during long-term follow-up, but only 25% will have that degree of QT prolongation during their initial evaluation. The maximal QTc duration measured at any time before age 10 years was shown to be the most powerful predictor of cardiac events during adolescence, regardless of baseline, mean, or most recent QTc values. In addition, the QT interval normally may exhibit individual variations during the day.25,26
T Wave Morphology
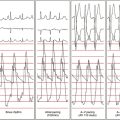
ST-T wave abnormalities are common among LQTS patients, and some of the ST-T anomalies are characteristic for a specific genotype. Patients with LQT1 commonly exhibit a smooth, broad-based T wave that is present in most leads, particularly evident in the precordial leads. The T wave generally has a normal to relatively high amplitude and often no distinct onset. LQT2 patients generally present with low-amplitude T waves, which are notched or bifid in approximately 60% of carriers. The bifid T wave can be confused with a T-U complex; however, unlike the U waves, the bifid T waves are usually present in most of the 12 ECG leads. LQT3 patients often show late-onset, narrow, peaked, and/or biphasic T waves with a prolonged isoelectric ST segment. Occasionally, the T wave is peaked and asymmetrical with a steep downslope. These ST-T wave patterns can be seen in 88% of LQT1 and LQT2 carriers and in 65% of LQT3 carriers. However, exceptions are present in all three genotypes, and the T wave pattern can vary with time, even in the same patient with a specific mutation.27,28
No specific T wave pattern has been suggested in the LQT5 and LQT6 syndromes. T-U wave abnormalities such as biphasic T waves following long pauses like those found in the LQT2 syndrome are commonly observed in the LQT4 syndrome. Enlarged U waves separated from the T wave are reported to be characteristic ECG features in the LQT7 syndrome. Severe QT interval prolongation and macroscopic T wave alternans can be observed in LQT8.27
Despite the initial enthusiasm in achieving a genotype-phenotype correlation for specific LQT-associated genes, this approach failed to provide a high diagnostic yield because of the frequent exceptions in T wave morphology presentation. Therefore, other T wave parameters, such as duration, amplitude, asymmetry, and flatness, as well as the T wave peak–to–T wave end interval, have been used as highly specific quantitative descriptors (see below).28
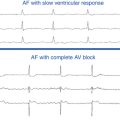
Torsades De Pointes
The tachycardia rate typically is in the range of 150 to 300 beats/min. In many cases, torsades de pointes is a self-limiting arrhythmia that spontaneously dies out after a few tens of cycles; however, most patients experience multiple episodes of the VT occurring in rapid succession. Only in a minority of cases does torsades de pointes degenerate into VF, which almost without exception leads to SCD if immediate rescue intervention is unavailable.7
Dispersion of Repolarization
In experimental models of the LQTS, prolonged repolarization, transmural dispersion of repolarization, and early afterdepolarizations (EADs) are the three EP components linked to the genesis of torsades de pointes. Prolongation of the action potential duration (and QT interval) per se is not pathogenic, as demonstrated by the fact that a homogeneous action potential duration prolongation (such as occurs following amiodarone therapy) fails to generate reentry. Several ECG indices have been proposed in recent years as noninvasive surrogates for transmural dispersion of repolarization. Transmural dispersion of repolarization arises from repolarization heterogeneity that exists between the epicardial and putative midmyocardial (M) cells that lie toward the endocardium of the left ventricular (LV) wall. These midmyocardial cells are especially sensitive to a repolarization challenge and exhibit significant prolongation of the action potential duration compared with other transmural cell types.7,29,30
Although some controversy exists, some experimental models suggest that the peak of the T wave coincides with the end of epicardial repolarization (the shortest action potentials), whereas the end of the T wave coincides with the end of repolarization of the M cells (the longest action potentials). Hence, the interval from the peak of the T wave to the end of the T wave (Tpeak-to-end) in each surface ECG lead has been proposed as an index of transmural repolarization, which can potentially be a more sensitive predictor of arrhythmogenic risk than the QT interval, because the latter represents the total duration of electrical ventricular activation) and not necessarily the dispersion of transmural repolarization.7,29,30
Although changes in the Tpeak-to-end interval can potentially show the dynamicity of the transmural dispersion of repolarization in clinical settings in LQTS patients, the role of measuring the Tpeak-to-end interval in these patients is not clearly defined yet. In fact, the normal value of the Tpeak-to-end interval on the ECG has not been established. Nonetheless, an interval of more than 100 milliseconds is uncommon in normal subjects compared with that in subjects with LQTS (9% versus 55%).30
LQT2 exhibits a larger-degree transmural dispersion of repolarization, as measured by the Tpeak-to-end interval, compared with LQT1 and normal hearts. In fact, the Tpeak-to-end interval has been proposed as a diagnostic criterion in differentiation between LQT2 and LQT1 patients. Additionally, whereas LQT1 patients and normal subjects demonstrate stable Tpeak-to-end intervals independent of heart rates, LQT2 patients exhibit a trend to decreased Tpeak-to-end intervals at fast heart rates and to increased Tpeak-to-end durations at slow heart rates. In both LQT1 and LQT2 patients, the longest Tpeak-to-end intervals are associated with sudden changes in the heart rate trend. Importantly, the magnitude of transmural dispersion of the repolarization interval does not seem to differ between asymptomatic and symptomatic patients in either LQT1 or LQT2. Conversely, symptomatic LQT2 patients exhibit a trend toward longer QT intervals than do asymptomatic patients.29
On ambulatory monitoring, transmural dispersion of repolarization, measured as Tpeak-to-end intervals during normal daily activities, appears to be greater in LQT2 than in LQT1 patients. LQT1 patients exhibit abrupt increases in Tpeak-to-end intervals at elevated heart rates, whereas LQT2 patients exhibit increases in transmural dispersion of repolarization at a much wider range of rates. In addition, beta-adrenergic stimulation (exercise or epinephrine infusion) increases transmural dispersion of repolarization in both LQTS models, transiently in LQT2 and persistently in LQT1.29
An alternate approach to determine repolarization heterogeneity is provided by the QT interval dispersion. The QT dispersion index is obtained by the difference between the maximal and minimal QT intervals (QTmax − QTmin) measured on a 12-lead ECG. It reflects the spatial heterogeneity of myocardial refractoriness more accurately than single QT values. Visualization of the differences in QT interval in the different ECG leads is facilitated by the display of a suitable subset of temporally aligned simultaneous leads with a slight separation on the amplitude scale.22 However, QT interval dispersion measurements are subject to similar shortcomings encountered with the QT interval assessment, as a large overlap between affected and healthy individuals is observed.7 Further, accurate measurement on the scalar ECG at a paper speed of 25 mm/sec is difficult. The same caveat applies to measuring Tpeak-to-end.
The ratio of the amplitudes of the U and T waves has been suggested as the clinical counterpart of EADs, and a progressive increase in this ratio was found to precede the onset of torsades de pointes in an experimental model of LQTS. In addition, the increment in U wave amplitude after a premature ventricular complex (PVC) has been suggested as a marker for arrhythmia risk in “pause-dependent” LQTS. In patients with bifid T waves, some investigators used the late component of the T wave, rather than the U wave. The diurnal maximal ratio between late and early T wave peak amplitude correlates with a history of LQTS-related symptoms better than the baseline QTc interval in both LQT1 and LQT2 patients. In LQT1 and LQT2 patients, diurnal distributions of maximal T2-to-T1 wave amplitude ratios are similar to reported corresponding distributions of cardiac events, and can potentially be used as a predictor of the arrhythmia risk for asymptomatic patients with known type 1 or 2 LQT genotype.31
Diagnosis of the Long QT Syndrome
The LQTS is a clinical diagnosis, primarily based on the clinical presentation, personal and family history, and ECG findings. A detailed family history of syncope and SCD is essential, not only in first-degree relatives (mother, father, siblings, children), but also in more distant relatives. Importantly, family history should also be investigated for other potential manifestations of malignant arrhythmias that might not have been classified as cardiac in origin, such as drowning, death while driving, epileptic seizures, as well as SIDS. Data on comorbidities in evaluated individuals or family members (such as congenital deafness) should also be acquired. Clinical features such as triggers of syncope and specific QT morphological attributes in patients in whom the clinical diagnosis has been made can suggest the affected gene in 70% to 90% of patients.5,32
The QTc interval is the most common standardized parameter used for diagnosing LQTS and quantifying ventricular repolarization. As noted, QTc values greater than 470 milliseconds in men and greater than 480 milliseconds in women are practically never seen among healthy individuals (especially at heart rates of 60 to 70 beats/min) and are considered diagnostic of LQTS (as long as acquired forms of LQTS are excluded) even in asymptomatic subjects and those having a negative family history. When a prolonged QTc is observed during faster heart rates (>90 beats/min), it is important to repeat the ECG once the heart rate slows down, to minimize the error that can potentially be introduced by heart rate correction formulas.25
Additionally, LQTS can be suspected in individuals with QTc values exceeding 450 milliseconds for men and exceeding 460 milliseconds for women; these subjects are considered to have “high probability for LQTS” if they have a history of syncope and familial SCD. On the other hand, LQTS is very unlikely among men with QTc less than 390 milliseconds and among women with QTc less than 400 milliseconds.25
Importantly, a significant proportion (20% to 40%) of patients with genetically proven LQTS have normal or borderline QTc measurements at rest (“concealed” LQTS). Therefore, the diagnosis of LQTS should not be excluded based solely on a QTc interval in the normal range (400 to 450 milliseconds), and additional testing is indicated whenever the clinical history requires exclusion of LQTS. In this setting, obtaining a resting ECG periodically sometimes can uncover an abnormal prolongation of the QTc interval, given the considerable day-to-day variability in QTc of patients with LQTS. Additionally, reviewing the ECGs of all family members can be valuable, because some family members can have obvious QT prolongation. Several additional clinical tests and tools have been used in the clinical evaluation of LQTS, including ambulatory ECG recordings, exercise stress testing, epinephrine QT stress testing, and genetic testing. Although these diagnostic tools can all contribute to identifying patients with LQTS, a “gold standard” diagnostic tool is still lacking. Invasive EP testing is generally not useful in the diagnosis of LQTS.33,34
Clinical Scoring Systems
When the diagnosis is not clear, two clinical scoring systems have been developed to enhance the diagnostic reliability of clinical parameters and to estimate the probability of LQTS: the Keating criteria and the Schwartz score. The Keating criteria are a binary combination of QTc values with LQTS-related symptoms. According to these criteria, individuals are affected if they have a QTc interval greater than 470 milliseconds even in the absence of symptoms, or if they have typical symptoms with a QTc interval greater than or equal to 450 milliseconds. The Schwartz score incorporates ECG features in combination with personal clinical history and family history. Scores were arbitrarily divided into three probability categories, providing a quantitative estimate of the risk for LQTS (Table 31-4).35,36
| FINDING | SCORE |
|---|---|
| ECG* | |
| QTc† ≥ 480 msec | 3 |
| QTc† = 460-470 msec | 2 |
| QTc† = 450 msec (in men) | 1 |
| Torsades de pointes‡ | 2 |
| T wave alternans | 1 |
| Notched T wave in three leads | 1 |
| Low heart rate for age§ | 0.5 |
| Clinical History | |
| Syncope with stress‡ | 2 |
| Syncope without stress‡ | 1 |
| Congenital deafness | 0.5 |
| Family History¶ | |
| Family members with definite LQTS | 1 |
| Unexplained SCD in immediate family members <30 yr of age | 0.5 |
Scoring: 1 point, low probability of LQTS; 2 or 3 points, intermediate probability of LQTS; 4 or more points, high probability of LQTS.
LQTS = long QT syndrome; SCD = sudden cardiac death.
* Findings in the absence of medications or disorders known to affect these ECG findings.
† The corrected QT interval (QTc) is calculated by the Bazett formula.
‡ Torsades de pointes and syncope are mutually exclusive.
§ Resting heart rate below the second percentile for age.
¶ The same family member cannot be counted in both categories.
Modified from Goldenberg I, Moss AJ: Long QT syndrome, J Am Coll Cardiol 51:2291-2300, 2008.
When applied to family members of positively genotyped patients, these systems demonstrated excellent high specificity (99%) but very low sensitivity (19% for the Schwartz “high probability” score and 36% for the Keating criteria), and severely underdiagnosed disease carriers (false negatives). Significant underdiagnosis was also found among probands, despite the fact that probands are generally more seriously affected than their relatives. A high probability of LQTS (Schwartz criteria) was found only in 57% of probands with a confirmed molecular diagnosis. The performance of QTc interval measurement alone (with a cut-off value of 430 milliseconds) is superior to the Schwartz and Keating criteria when DNA testing is available for the confirmation of disease carriership, as it has far better sensitivity (72%) while retaining reasonable specificity (86%). Thus, in families with known causal gene mutations, genetic analysis is the method of choice to identify the relatively high proportion of silent carriers of disease-causing mutations.35,36
Ambulatory Cardiac Monitoring
Holter monitoring is not sufficiently well standardized to serve in the primary assessment for ventricular repolarization analysis, and only rarely will show spontaneous arrhythmias in LQTS patients. However, this method can sometimes be used for the detection of extreme QT interval events that occur infrequently during the day. Characteristic T wave changes may be revealed during sleep or following post-extrasystolic pauses.25,32
Exercise Stress Testing
Attenuated QTc shortening and an exaggerated QTc prolongation during early and peak exercise are characteristic of LQT1. As will be discussed later, genetic mutations in LQT1 result in reduction of the amplitude of IKs, one of the dominant K+ currents responsible for repolarization especially at rapid heart rates (during sympathetic stimulation). Attenuation of IKs results in failure of the QT to adapt (i.e., shorten) in response to increasing heart rate. Unlike LQT1 patients, normal subjects, LQT2 patients, and LQT3 patients decrease their respective QTc intervals from rest at peak exercise. A maladaptive paradoxical QTc prolongation during the recovery phase (QTc >460 milliseconds or a ΔQTc [QTc at 3 minutes of recovery minus the baseline supine QTc] >30 milliseconds) was found to distinguish patients with either manifest or concealed LQT1 from normal subjects and those with LQT2 and LQT3 genotypes.37
In contrast, patients with LQT2 mutations have normal QT shortening and minimal QTc prolongation during exercise, but they characteristically demonstrate an exaggerated QT hysteresis compared with LQT1 patients and normal subjects. QT hysteresis is normally measured by comparing the QT intervals during exercise versus the recovery period at comparable heart rates (e.g., when the heart rate accelerates to approximately 100 beats/min during early exercise and 1 to 2 minutes into the recovery phase, when the heart rate typically decelerates to approximately 100 beats/min). In LQT2 patients, the QT fails to shorten at these intermediate heart rates in early exercise because of attenuated IKr (rapidly activating delayed rectifier potassium current; a so-called IKr zone). This is followed by recruitment of the unimpaired, sympathetically responsive IKs, resulting in appropriate QT shortening at faster heart rates through to peak exercise, which persists into the recovery phase. This consequently leads to an exaggerated QT difference between exercise and recovery at comparable heart rates, which is manifested as increased QT hysteresis.34,38
The LQT3 phenotype is characterized by a constant shortening of the action potential duration (and QT interval) with exercise because of stimulation of the intact IKs channel and augmentation of a late inward Na+ current.38
Postural and exercise-induced QTc prolongation and QT hysteresis can be attenuated with beta blockade; therefore, beta blocker therapy should be discontinued before exercise testing. Additionally, exercise treadmill testing can also reveal the characteristic T wave morphology in patients with LQT1 and LQT2 syndromes.7
Importantly, induction of arrhythmias during exercise is very rare in LQTS patients. Exercise-induced ventricular ectopy exceeding isolated PVCs is observed in less than 10% of patients.7,32 The presence of exercise-induced ventricular ectopy beyond single, isolated PVCs must prompt intense evaluation because it was found to have a positive predictive value exceeding 90% for the presence of significant cardiac pathology. However, CPVT, rather than LQTS, is the far more likely diagnosis.39
Epinephrine QT Stress Test
Catecholamine provocation testing can help diagnose patients with concealed LQT1, with a positive predictive value approaching 75% and a negative predictive value of 96%. Furthermore, epinephrine provocation testing was found to be a powerful test to predict the genotype of LQT1, LQT2, and LQT3 syndromes.32,38,40
Two major protocols have been developed for epinephrine infusion. Using the “escalating-dose infusion protocol,” epinephrine infusion is initiated at 0.025 µg/kg/min and then increased sequentially every 10 minutes to 0.05, 0.1, and 0.2 µg/kg/min. The 12-lead ECG is continuously recorded during sinus rhythm under baseline conditions and during epinephrine infusion. The QT interval is measured 5 minutes after each dose increase. Epinephrine infusion should be stopped for systolic blood pressure greater than 200 mm Hg, nonsustained VT or polymorphic VT, frequent PVCs (>10 per minute), T wave alternans, or patient intolerance. A paradoxical QT interval response (prolongation of the absolute QT interval of ≥30 milliseconds) during low-dose epinephrine infusion provides a presumptive clinical diagnosis of LQT1, with a positive predictive value of 75%. The diagnostic accuracy can be reduced in patients receiving beta blockers.38
Using the “bolus and infusion protocol,” an epinephrine bolus (0.1 µg/kg) is administered and immediately followed by continuous infusion (0.1 µg/kg/min) for 5 minutes. The QT interval is measured 1 to 2 minutes after the start of epinephrine infusion when the R-R interval is the shortest (which represents the peak epinephrine effect) and 3 to 5 minutes after the start of epinephrine infusion (which represents the steady-state epinephrine effect).40
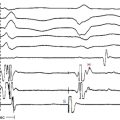
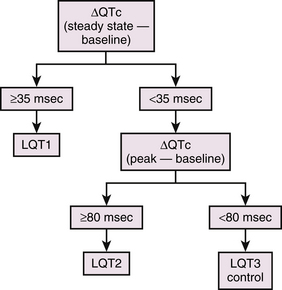
During the epinephrine test, patients with LQT1 manifest prolongation of the QTc at the peak of the epinephrine effect, which is maintained under steady-state conditions of epinephrine. In contrast, epinephrine prolongs the QTc more dramatically at the peak of epinephrine infusion in LQT2 patients, but the QTc returns to baseline levels under steady-state conditions. A much milder prolongation of QTc at the peak of epinephrine has been described in LQT3 patients and in healthy subjects, and it returns to the baseline levels under steady-state conditions. A subject is considered to have an LQT1 response if the QTc increase in the peak phase is greater than 35 milliseconds and is maintained throughout the steady-state phase (Fig. 31-2). LQT2 response is likely if the peak QTc increase of greater than 80 milliseconds is not maintained in the steady-state phase. In one report, the sensitivity and specificity of the epinephrine test to differentiate LQT1 from LQT2 were 97% and 96%, those from LQT3 were 97% and 100%, and those from healthy subjects were 97% and 100%, respectively, when ΔQTc greater than 35 milliseconds at steady state was used. The sensitivity and specificity to differentiate LQT2 from LQT3 or healthy subjects were 100% and 100%, respectively, when ΔQTc greater than 80 milliseconds at peak was used.40
The escalating-dose infusion protocol is generally better tolerated by the patient and carries a lower incidence of false-positive responses. On the other hand, the bolus and infusion protocol offers the ability to monitor the temporal course of the epinephrine response at peak dose (during the bolus) and during steady state (during the infusion), which is particularly important in individuals with LQT2 in whom transient prolongation of the uncorrected QT interval can occur, followed by subsequent shortening.38
Genetic Testing
Although the diagnosis of LQTS frequently can be certain based on clinical diagnostic measures, in which setting molecular screening may not be necessary, genetic testing can still be of value; identification of the specific gene affected (or the site of the mutation within the gene) can potentially guide therapeutic choice and enhance risk stratification. Importantly, identification of the disease-causing mutation in the proband provides the ability to easily identify affected family members and implement lifestyle adjustment and presymptomatic treatment, and is thereby potentially lifesaving. Furthermore, genetic testing may be important in the identification of concealed LQTS, because a significant minority (25% to 50%) of individuals with genetically proven LQTS have a nondiagnostic QTc.3,5,7,32
Genetic testing is a powerful tool to identify patients with LQTS. Yet, it remains expensive and unavailable to many centers. Depending on the stringency of clinical phenotype assessment, the yield for positive genetic results in LQTS ranges from 50% to 78%, and is highest among tested individuals with the highest clinical probability (i.e., those with longer QTc intervals and more severe symptoms). The remaining probands with a strong clinical probability of LQTS will have a negative genetic test result, probably because of technical difficulties with genotyping, noncoding variants, or as yet unidentified disease-associated genes. Therefore, a negative genetic test in a subject with clinical LQTS (i.e., genotype-negative/phenotype-positive LQTS) does not provide a basis to exclude the diagnosis.3,32–34
There is also the potential for false-positive results; genetic testing may identify novel mutations of unclear significance, which could represent normal variants, and require validation and further analysis (e.g., linkage within a family or in vitro studies).32–34
Currently, comprehensive or LQT1 to LQT3 (KCNQ1, KCNH2, and SCN5A)-targeted LQTS genetic testing is recommended for symptomatic patients with a strong clinical index of suspicion for LQTS as well as for asymptomatic patients with QT prolongation (QTc ≥480 milliseconds [prepuberty] or ≥500 milliseconds [adults]) in the absence of other clinical conditions that might prolong the QT interval.41
Genetics of the Long QT Syndrome
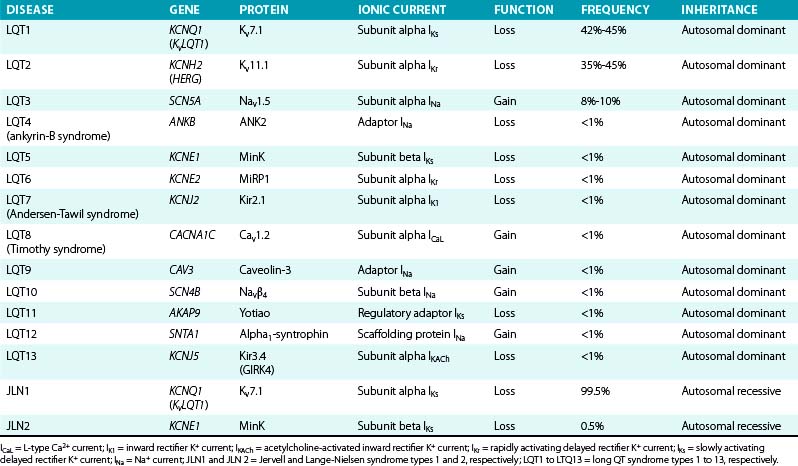
To date, more than 500 mutations of 13 different genes responsible for a hereditary form of LQTS have been identified (Table 31-5), with the majority of the known mutations located in the first three: LQT1 (KCNQ1) mutations account for 42% to 45% of genetically positive LQTS, LQT2 (KCNH2) for 35% to 45%, and LQT3 (SCN5A) for 8% to 10%.
Genetic analysis reveals two or more mutations in 5% to 10% of LQTS patients with clinical phenotypes of Romano-Ward syndrome. These compound mutations (so-called double hits) appear to be associated with a more severe phenotype than that associated with a single hit.42
Most reported mutations are in coding regions, although noncoding mutations (resulting in the loss of allele expression) have also been described. Most LQTS families have their own mutations, which are often termed “private” mutations.32
The majority of LQTS cases are caused by heterozygous disease; thus, mutations causing abnormalities in channel coassembly or trafficking result in up to 50% maximal reduction in the number of functional channels (haplotype insufficiency), because the gene product from the healthy allele remains intact. On the other hand, mutations that abolish channel function while preserving subunit assembly can result in dominant-negative suppression of the healthy allele as well, causing a more severe reduction (up to 94%) of the total amount of functional protein (dominant-negative effect) and favoring a more severe clinical course and a higher frequency of arrhythmia-related cardiac events.7,12
Mutations Related to the Slowly Activating Delayed Rectifier Potassium Current (IKs)
IKs contributes to human atrial and ventricular repolarization, particularly during action potentials of long duration, and plays an important role in determining the rate-dependent shortening of the cardiac action potential. As heart rate increases, IKs increases because channel deactivation is slow and incomplete during the shortened diastole. This allows IKs channels to accumulate in the open state during rapid heart rates and contribute to the faster rate of repolarization.43,44 Importantly, IKs is functionally upregulated when other repolarizing currents (such as IKr) are reduced, potentially serving as a “repolarization reserve” and a safeguard against loss of repolarizing power (see Chap. 2). Mutations in LQT1, LQT5, and LQT11 result in attenuation of IKs and, as a consequence, prolongation of repolarization, action potential duration, and QT interval.7,43 LQT1 is caused by loss-of-function mutations of the KCNQ1 (KvLQT1) gene, which encodes the alpha subunit (Kv7.1) of the inward IKs. More than 170 mutations of this gene have been reported, comprising many Romano-Ward (autosomal dominant) syndromes and accounting for approximately 45% of all genotyped LQT families.12 Of note, mutations involving the transmembrane domain of KCNQ1 result in more severe disease compared with C-terminal mutations.
LQT5 is caused by loss-of-function mutations of the KCNE1 gene, which encodes the beta subunit (MinK) that modulates IKs.7
Homozygous or compound heterozygous loss-of-function mutations of either the KCNQ1 or KCNE1 gene cause the autosomal recessive form of LQTS (the Jervell and Lange-Nielsen syndrome). Patients with KCNQ1 mutations (type 1 Jervell and Lange-Nielsen syndrome) have an almost sixfold greater risk of arrhythmic events, whereas patients with KCNE1 mutations (type 2 Jervell and Lange-Nielsen syndrome) appear to be at lower risk. Although the Jervell and Lange-Nielsen syndrome is the most severe among the major variants of LQTS, the parents of Jervell and Lange-Nielsen syndrome patients are generally less symptomatic than other LQT1 patients, despite the fact that they all are heterozygous for the same gene. This is likely related to the observation that most of the LQT1 genetic variants are missense mutations exerting a dominant-negative effect, whereas most (74%) Jervell and Lange-Nielsen mutations of KCNQ1 are frame-shift/truncating mutations that are unable to cause dominant-negative suppression but are likely to interfere with subunit assembly. Jervell and Lange-Nielsen syndrome accompanies complete loss of IKs in hair cells and endolymph of the inner ear, which results in congenital deafness.6
LQT11 is caused by loss-of-function mutations of the AKAP9 gene, which encodes an A-kinase anchoring protein (Yotiao), shown to be an integral part of the IKs macromolecular complex. The presence of Yotiao is necessary for the physiological response of the IKs to beta-adrenergic stimulation. LQT11 mutations reduce the interaction between Yotiao and the IKs channel (Kv7.1), preventing the functional response of IKs to cyclic adenosine monophosphate (cAMP) and adrenergic stimulation and causing an attenuation of IKs.3
Mutations Related to the Rapidly Activating Delayed Rectifier Potassium Current (IKr)
IKr is largely responsible for repolarization of most cardiac cells and plays an important role in governing the cardiac action potential duration and refractoriness. Mutations in LQT2 and LQT6 result in attenuation of IKr and cause a decrease in the K+ outward current and prolongation of repolarization, action potential duration, and QT interval.44
LQT2 is caused by loss-of-function mutations of the KCNH2 (HERG) gene, which encodes the alpha subunit (Kv11.1) of the inward IKr. LQT2 syndrome accounts for almost 45% of all genotyped congenital LQTS cases. Approximately 200 mutations in this gene have been identified, which result in rapid closure of the HERG channels and decrease the normal rise in IKr, leading to delayed ventricular repolarization and QT prolongation. Mutations involving the pore region of the HERG channel are associated with a significantly more severe clinical course than nonpore mutations; most pore mutations are missense mutations with a dominant-negative effect.12
LQT6 is caused by loss-of-function mutations of the KCNE2 gene, which encodes the accessory beta subunit (MiRP1) of the HERG channel. LQT6 displays clinical resemblance to LQT2.7
Mutations Related to the Inward Rectifier Potassium Current (IK1)
Andersen-Tawil syndrome (LQT7) is caused by loss-of-function mutations of the KCNJ2 gene, which encodes the voltage-dependent K+ channel (Kir2.1) that contributes to the inward IK1. Kir2.1 channels are expressed primarily in skeletal muscle, heart, and brain. The majority of mutations exerts a dominant-negative effect on channel current.7,16,17
Disruption of the IK1 function can potentially lead to prolongation of the terminal repolarization phase and QT interval, which can predispose to the generation of EADs and diastolic membrane depolarizations (DADs) causing ventricular arrhythmias. However, unlike other types of LQTS, where the afterdepolarizations arise from reactivation of L-type Ca2+ channels, the EADs/DADs generated in LQT7 are likely secondary to Na+-Ca2+ exchanger-driven depolarization. It is believed that the differential origin of the triggering beat is responsible for the observed discrepancy in arrhythmogenesis and the clinical features compared with other types of LQTS. Additionally, it is likely that prolongation of the action potential duration in LQT7 is somewhat homogeneous across the ventricular wall (i.e., transmural dispersion of repolarization is less prominent than in other types of LQTSs), which can potentially explain the low frequency of torsades de pointes. Flaccid paralysis results from failure to propagate action potentials in the muscle membrane as a result of sustained membrane depolarization.7,16,17
Mutations Related to the Acetylcholine-Activated Potassium Current (IKACh)
LQT13 is caused by loss-of-function mutations of the KCNJ5 gene, which encodes the alpha subunit (Kir3.4, GIRK4) of the inward IKACh. The Kir3.4 mutation is the most recently identified LQT-associated gene, and it exerts dominant-negative effects on Kir3.1/Kir3.4 channel complexes by disrupting membrane targeting and stability of Kir3.4.45
Mutations Related to the Sodium Current (INa)
LQT3 is caused by gain-of-function mutations of the SCN5A gene, which encodes the alpha subunit (Nav1.5) of the cardiac voltage-gated Na+ channel that is responsible for the INa. LQT3 accounts for approximately 8% of the congenital LQTS cases. More than 80 mutations have been identified in the SCN5A gene, with the majority being missense mutations mainly clustered in Nav1.5 regions that are involved in fast inactivation (i.e., S4 segment of DIV, the DIII-DIV linker, and the cytoplasmic loops between the S4 and S5 segments of DIII and DIV), or in regions that stabilize fast inactivation (e.g., the C-terminus).12,46,47
Several mechanisms have been identified to underlie ionic effects of SCN5A mutations in LQT3. Most of the SCN5A mutations cause a gain of function through disruption of fast inactivation, allowing repeated reopening during sustained depolarization and resulting in an abnormal, small but functionally important sustained (or persistent) noninactivating Na+ current (Isus) during the action potential plateau. Other, less common mechanisms include increased window current, which results from delayed inactivation of mutant Na+ channels, occurring at more positive potentials and widening the voltage range during which the Na+ channel may reactivate without inactivation. Additionally, some mutations cause slower inactivation, which allows longer channel openings, and causes a slowly inactivating Na+ current (the late Na+ current, INaL). Because the general membrane conductance is small during the action potential plateau, the presence of a persistent inward Na+ current, even of small amplitude, can potentially have a major impact on the plateau duration and can be sufficient to prolong repolarization and QT interval. QT prolongation and the risk of developing arrhythmia is more pronounced at slow heart rates, when the action potential duration is longer, allowing more Na+ current to enter the cell.12,46
Regardless of the mechanism, increased Na+ current (Isus, window current, INaL, or peak INa) upsets the balance between depolarizing and repolarizing currents in favor of depolarization. The resulting delay in the repolarization process triggers EADs (i.e., reactivation of the L-type Ca2+ channel during phase 2 or 3 of the action potential), especially in Purkinje fiber myocytes where action potential durations are intrinsically longer.47
LQT9 is caused by gain-of-function mutations of the CAV3 gene, which encodes caveolin-3, a plasma membrane scaffolding protein that interacts with Nav1.5 and plays a role in compartmentalization and regulation of channel function. Mutations in caveolin-3 induce kinetic alterations of the Na+ channel that result in persistent late Na+ current (Isus) and have been reported in cases of SIDS.7,47
LQT10 is caused by gain-of-function mutations of the SCN4B gene, which encodes the beta subunit (Navβ4) of the Nav1.5 ion channel. To date, only a single mutation in one patient has been described, which resulted in a shift in the inactivation of the Na+ current toward more positive potentials, but did not change the activation. This resulted in increased window currents at membrane potentials corresponding to phase 3 of the action potential.7,47
LQT12 is caused by mutations of the SNTA1 gene, which encodes alpha1-syntrophin, a cytoplasmic adaptor protein that enables the interaction between Nav1.5, nitric oxide synthase, and sarcolemmal Ca2+ ATPase complex that appears to regulate ion channel function. By disrupting the interaction between Nav1.5 and sarcolemmal calcium ATPase complex, SNTA1 mutations cause increased Nav1.5 nitrosylation with consequent reduction of channel inactivation and increased Isus densities.3,47
Mutations in the Ankyrin-B Gene
LQT4 is caused by loss-of-function mutations of the ANK2 gene, which encodes ankyrin-B, a structural membrane adapter protein that anchors ion channels to specific domains in the plasma membrane. Functionally, ankyrins bind to several ion channel proteins, targeting these proteins to specialized membrane domains, such as the anion exchanger (chloride-bicarbonate exchanger), Na+-K+ adenosine triphosphatase (ATPase), INa, the Na+-Ca2+ exchanger (INa-Ca), and Ca2+ release channels (including those mediated by the receptors for inositol triphosphate [IP3] or ryanodine [RyR2]). Hence, ANK2 mutations can potentially result in improper localization and activity of ion-conducting proteins. Five mutations of this gene have been reported, resulting in increased intracellular concentration of Ca2+ and, sometimes, fatal arrhythmia. However, QT interval prolongation is not a consistent feature in patients with ankyrin-B dysfunction; instead, varying degrees of cardiac dysfunction are observed including bradycardia, sinus arrhythmia, idiopathic VF, CPVT, and SCD. Therefore, ankyrin-B dysfunction is now regarded as a clinical entity distinct from classic LQTS (referred to as the “ankyrin-B syndrome”).
Pathophysiology of the Long QT Syndrome
Mechanism of QT Interval Prolongation
Any factor that evokes lengthening of the action potential duration holds the potential of causing an LQTS phenotype, especially if it does it heterogeneously. Electrophysiologically, prolongation of the action potential duration and QT interval can arise from either a decrease in the outward repolarizing current (K+ currents: IKr, IKs, IK1, IKACh) or an increase in inward depolarizing membrane current (Na+ current, Ca2+ current, or both) during phases 2 and 3 of the action potentials (Fig. 31-3).
Most commonly, QTc prolongation is produced by delayed repolarization due to attenuation of IKs (LQT1, LQT5, LQT11), IKr (LQT2, LQT6), IK1 (LQT7), or IKACh (LQT13). Less commonly, QT prolongation results from prolonged depolarization due to an increase in INa (LQT3, LQT4, LQT9, LQT10, LQT12) or ICaL (LQT8).7
Mechanism of Dispersion of Repolarization
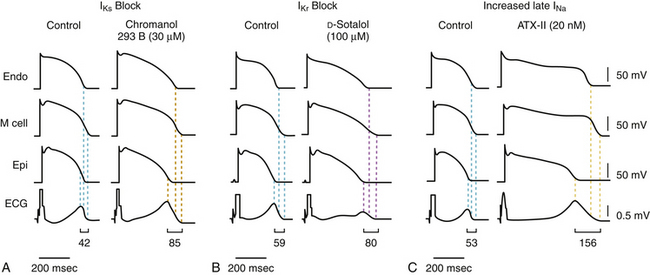
The LQTS is caused by an excessive and heterogeneous prolongation of the repolarization phase of the ventricular action potential. In the normal ventricle, there are heterogeneous cell types with different action potential morphologies and durations, mainly attributed to cell-specific and regional variability in the functional expression of different populations of ion channels (transient outward K+ channels [Ito], IKs), and the Na+ window current (INa) and/or their accessory proteins. Some experimental studies proposed the presence of three irregular cell layers in the ventricle with distinct electrical properties: endocardial, midmyocardial (M cells), and epicardial cells. Overall, the putative midmyocardial cells (which have a smaller IKs, a larger late INa, and a larger Na+-Ca2+ exchange current [INa-Ca]) appear to generate longer action potential durations that are more susceptible to modification compared with the endocardium and epicardium. The epicardial cells have the shortest action potential durations because of a prominent Ito. Repolarization of endocardial cells usually occurs between repolarization of the epicardial and midmyocardial cells. Notably, factors that prolong the action potential appear to elicit a disproportionate prolongation of the action potential duration in midmyocardial cells. As a result, dispersion of the action potential duration becomes irregularly exaggerated across the ventricular wall, yielding an increase in the action potential duration heterogeneity.7
Conditions leading to a reduction in IKr (e.g., LQT2) or augmentation of late INa (e.g., LQT3) produce a preferential prolongation of the M cell action potential. Consequently, QT interval prolongation is accompanied by a dramatic increase in transmural dispersion of repolarization. In contrast, conditions leading to a reduction in IKs alone (e.g., LQT1) result in a homogeneous prolongation of action potential duration across the ventricular wall with little increase in transmural dispersion of repolarization. However, concurrent beta-adrenergic stimulation (e.g., exercise, isoproterenol) results in abbreviation of epicardial and endocardial action potential duration with little or no change in the M cell action potential, resulting in marked augmentation of transmural dispersion of repolarization and arrhythmogenesis (see Fig. 31-3).27
On the surface ECG, the peak of the normal T wave coincides with repolarization of the epicardial action potential (the shortest action potential) whereas repolarization of the longest action potential in the midmyocardial cells coincides with the end of the T wave. Hence, the increased dispersion of transmural repolarization results in prolongation of the interval from the peak of the T wave to the end of the T wave (Tpeak-to-end) on the surface ECG.7,29,30
Mechanism of Torsades De Pointes
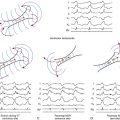
The excessive increase in the spatial and/or temporal action potential duration heterogeneity favors the generation of EADs because of reactivation of L-type Ca2+ channels, and on some occasions the late INa or Na+-Ca2+ exchanger. The EADs can cause PVCs that can potentially trigger the initiation of ventricular arrhythmias. Furthermore, excessive transmural heterogeneity of the action potential duration provides the substrate for unidirectional block and functional reentry circuits to propagate torsades de pointes.7
Although torsades de pointes is presumably often initiated by EAD-triggered PVCs, its propagation likely is due to intramural reentrant mechanisms, giving rise to one or more intramural rotors that impose a rapid ectopic ventricular rhythm (typically 150 to 300 beats/min) while migrating inside the ventricular wall. Hence, with each new cycle the principal depolarization focus migrates accordingly, resulting in a progressive change of the electrical axis, typically rotating 180 degrees in approximately 10 to 12 cycles. This results in a polymorphic VT with the characteristic sinusoidal “twisting of the points” pattern on the 12-lead ECG.7
Notably, although the atrium seems to be resistant to generating EADs in response to agents that prolong repolarization, atrial EADs and “atrial torsades de pointes” have been reported in some LQTS patients as well as cesium-treated dogs.48
Mechanism of Exercise-Induced Changes
Patients with LQT1 and LQT2 genotypes have differing patterns of QT adaptation during beta-adrenergic stimulation (e.g., during stress, exercise, epinephrine infusion). Patients with LQT1 appear to have less repolarization reserve during exercise as evidenced by a progressive or persistent pattern of QTc prolongation at faster heart rates, compared with patients with LQT2, in whom maximal QTc prolongation occurs at submaximal heart rates in the early phase of sympathetic stimulation with subsequent fall toward baseline values at faster heart rates.10
IKs is markedly enhanced by beta-adrenergic stimulation through G-protein/cAMP-mediated channel phosphorylation by protein kinase A (PKA) (requiring AKAP9 [Yotiao]) and PKC (requiring MinK). This produces a rate-dependent shortening of the action potential duration in normal hearts. Importantly, IKs is functionally upregulated when other repolarizing currents (such as IKr) are reduced, potentially serving as a “repolarization reserve” and a safeguard against loss of repolarizing power, especially when beta-adrenergic stimulation is present.44,49
In contrast, subjects with LQT2 have dysfunctional IKr channels, which represent a smaller fraction of the K+ channels responsible for phase 3 repolarization and are not as sympathetically responsive as IKs channels. Therefore, in LQT2 patients, the QT fails to shorten at the intermediate heart rates in the early phase of exercise or epinephrine infusion because of attenuation of IKr. This is followed by recruitment of IKs (“repolarization reserve”) at faster heart rates during continuing exercise or epinephrine infusion, with concomitant appropriate abbreviation of the action potential duration and QT shortening, which persists into the recovery phase. This consequently leads to an exaggerated QT difference between the exercise and recovery QT/R-R curves that is manifested as increased QT hysteresis, which appears to be a characteristic feature of the LQT2 phenotype.34
The LQT3 phenotype is characterized by a constant reduction of the action potential duration with epinephrine because of stimulation of the intact IKs channel and augmentation of the late inward Na+ current. In fact, LQT3 patients may have supranormal QT adaptation in response to exercise compared with control subjects. SCN5A mutations in LQT3 cause a gain of function through disruption of fast channel inactivation, allowing repeated reopening during sustained depolarization and resulting in a small but functionally important enhancement of the INa during action potential plateau. As a consequence, the risk of developing arrhythmia will be expected to be particularly high at slow heart rates, when the action potential duration is longer, allowing more Na+ current to enter the cell.38
The differences in the dynamic response of ventricular repolarization to sympathetic stimulation may explain the epidemiological observation that patients with LQT1 are more likely to have life-threatening events during sympathetic activation compared with patients with other genotypes and also may underlie the responsiveness of LQT1 patients to beta blocker therapy.10
Mechanism of Genotype-Phenotype Variability
The LQTS is a complex and multifactorial disorder characterized by a broad phenotypic heterogeneity. The clinical phenotype (QTc values, arrhythmia-related symptoms, and outcomes) is highly variable, not only between families carrying different causal mutations, but also among family members carrying an identical mutation, with a broad continuous spectrum of clinical or subclinical phenotypes. One end of this spectrum is concealed LQTS (silent carriers of disease-causing mutations), whereby no QT prolongation or related symptoms are observed. At the other end of the spectrum are the severe symptomatic LQTS cases, these often representing the index cases easily identified in families. In between are patients with different degrees of QT prolongation and different levels of severity of arrhythmias.7
A multitude of genetic and acquired interacting factors (some defined but many still unknown) influence the pathophysiology and clinical course of each person and ultimately determine a spectrum of phenotypes. Among these factors is the fact that action potential generation is a polygenic process; different LQTS genes affect different ion current mechanisms. Even mutations in the same gene can affect gene expression levels and ionic current activity to different extents and via different mechanisms. As noted above, mutations located in the transmembrane segment (for LQT1) or pore region (for LQT2) generally result in more malignant disease compared with mutations in other locations. Similarly, mutations causing a dominant-negative effect (e.g., missense mutations involving the pore region of the channel) result in more profound channel dysfunction and more severe clinical disease that those associated with haplotype insufficiency (e.g., mutations causing coassembly or trafficking abnormalities).7,12
The “repolarization reserve” hypothesis, whereby multiple hits to repolarization are required to compromise repolarization and surpass the threshold for developing clinical QT prolongation and torsades de pointes, can underlie, at least in part, the phenotypic heterogeneity in LQTS. In this setting, a mutation in one of the LQT-linked genes causing an attenuation of a cardiac ionic current may result in only a limited disruption of the repolarization process, which can be clinically concealed and become unmasked (manifesting as QT prolongation and arrhythmias) only when accompanied by another insult to the same or a different ionic current (e.g., drugs or electrolyte abnormalities). In fact, it has been suggested that some cases of acquired LQTS represent inadvertent “unmasking” of subclinical congenital LQTS.7,30
Adding to the complexity is the “double-hit” phenomenon, secondary to either two mutations in the same gene (compound heterozygosity) or mutations in two different LQT genes (digenic heterozygosity). Double hits occur in 5% to 10% of LQTS patients and the resulting phenotype is more severe than with a single hit.7
Genetic factors are also involved in the control of cardiac repolarization at the population level. The heritability of the QTc interval has been estimated as between 25% and 52%. Ventricular action potential is under the joint control of multiple ionic currents, and the activity and expression levels of the channels underlying each of these currents establish a subtle equilibrium between depolarizing and repolarizing currents determining the action potential duration in each individual. Common genetic variants differing from the ancestor sequence by one nucleotide (i.e., single nucleotide polymorphism) in genes coding for proteins that are known or suggested to affect ion channel function appear to influence this equilibrium even via weak effects on activity and/or expression level of channel subunits and can potentially play a role in determining cardiac repolarization duration and QTc length in healthy individuals.50 Therefore, apart from the known LQT-linked genetic mutations, allelic variation elsewhere in the genome, most often single nucleotide polymorphisms, in the same disease-causing gene or in other genes can amplify otherwise subclinical disturbances of the repolarization into overt LQTS and potentially contribute to the variable penetrance and clinical phenotype heterogeneity.50,51
Furthermore, the genetic constitution is dynamic over time; the resultant intrinsic risk for arrhythmias can change according to age, LV hypertrophy, and heart failure resulting in structural and electrical remodeling of the heart.7
Differential Diagnosis
It is especially important to distinguish acquired factors that result in QT prolongation from the inherited form of LQTS. The acquired form of LQTS is far more prevalent than the congenital form. Causes of abnormal prolongation of the QT interval include myocardial ischemia, cardiomyopathies, hypokalemia, hypocalcemia, hypomagnesemia, autonomic influences, drugs, and hypothermia.5 Hypokalemia causes prolongation of the action potential duration because of reduced K+ conductance. Low extracellular K+ levels accelerate fast inactivation of the HERG channel and further decrease IKr.
By far, the most common environmental stressor resulting in acquired LQTS is drug therapy, including antiarrhythmic drugs, some antihistaminics, antipsychotics, and antibiotics. Noncardiovascular drugs that can potentially precipitate QT interval prolongation and arrhythmias comprise approximately 2% to 3% of total prescribed medications. Indeed, the risk of acquired LQTS is the most common cause of withdrawal or restriction of drugs that have already been marketed. The vast majority of drugs associated with the acquired form of LQTS are known to interact with the HERG channel (which mediates IKr), likely because of unique structural properties rendering this channel unusually susceptible to blockade by a wide range of different drugs. Compared with other cardiac K+ channels, the HERG channel has a large, funnel-like vestibule that allows many small-sized molecules to enter and block the channel (see Chap. 2). The more spacious inner cavity is due to the lack of the Pro-X-Pro sequence motif in the S6 segment (which is present in most other voltage-gated K+ channels and is believed to induce a sharp bend in the inner S6 helices of voltage-gated K+ channels, reducing the inner vestibule), which presumably facilitates access of drugs to the pore region from the intracellular side of the channel to block the channel current. Additionally, the HERG channel contains two aromatic sites inside its pore (not present in most other K+ channels), which provide high-affinity binding sites for aromatic moieties of a wide range of structurally diverse compounds. Interaction of these compounds with the channel’s pore causes functional alteration of its biophysical properties, occlusion of the permeation pathway, or both.7,44,52
Other mechanisms underlying drug-induced LQTS have been recently described, including disruption of HERG channel protein trafficking, with consequent reduction of surface membrane expression of otherwise functional channels (e.g., pentamidine), or folding and assembly of channel subunits. The accessory beta subunit (MiRP1, KCNE2) also determines the drug sensitivity.7
Several factors can potentially increase the risk of susceptibility of acquired LQTS as a complication of drug therapy, including female gender (70% of patients with drug-induced torsades de pointes are women), hypokalemia, hypomagnesemia, hypocalcemia, bradycardia, congestive heart failure, LV hypertrophy, recent conversion from atrial fibrillation (AF), and the degree of QT interval prolongation on baseline ECG. Other risk factors include high drug doses, rapid intravenous infusion, and concurrent use of drugs that prolong the QT interval or that slow drug metabolism. Additionally, genetically determined variability in pharmacodynamics (e.g., polymorphisms and mutations of the cytochrome system) can be responsible for significant variations in drug response. Most patients with drug-induced torsades de pointes have one or more risk factors.44,49,53
Furthermore, mutations of ion channel genes responsible for LQTS have been implicated as a risk factor. In fact, previously unrecognized congenital LQTS, of any subtype, can be identified in 5% to 20% of patients with drug-induced torsades de pointes. Therefore, it might be useful to screen for genetic variations in patients with overt drug-induced LQTS.41 In addition, polymorphisms (i.e., common genetic variations present in >1% of the population) in cardiac ion channels can potentially increase the risk for the development of drug-induced torsades de pointes. In these patients, drug-induced LQTS appears to represent a “forme fruste” of congenital LQTS. This is likely related to a redundancy in repolarizing currents; normal repolarization is accomplished by multiple ion channels, providing a safety reserve for repolarization. As a result, a mutation or polymorphism in one of the LQTS genes can be clinically inapparent until another insult to repolarization, such as a drug, hypokalemia, or hypomagnesemia, is superimposed.7,32
Risk Stratification
Genetic Markers of Risk
LQT1 patients exhibit a 49% increase in the risk of cardiac events as compared with LQT2 patients. However, in the 15- through 40-year age group, the risk of a first cardiac event is significantly higher among LQT2 patients (67% increase in the risk as compared with LQT1 patients).15 Among LQTS patients receiving beta blocker therapy, the LQT2 and LQT3 genotypes are associated with increased risk of arrhythmic events as compared with LQT1.10
In addition to identifying the LQT genotype, knowing the specific mutation and its biophysical function can help improve risk stratification. For LQT1, patients with mutations in the transmembrane domain of the KCNQ1 ion channel had more frequent cardiac events (syncope, aborted cardiac arrest, or SCD) and a greater risk of the first cardiac event occurring at a younger age than did patients with C-terminal mutations. For LQT2, pore mutations have a more severe clinical course and a higher frequency of arrhythmic events occurring at a younger age when compared with nonpore mutations. In particular, missense mutations in the transmembrane pore (S5-loop-S6) region appear to be associated with the highest risk of clinical arrhythmia. Preliminary data for LQT3 patients also suggest that the location of the mutation can play a role in determining the severity of the clinical phenotype. Furthermore, the biophysical function of the mutation is also important in determining the phenotype. Mutations with a dominant-negative effect on ion channel function (>50% reduction in function) have a more severe phenotype compared with mutations exhibiting haploinsufficiency (≤50% reduction in function). These genetic risks were independent of traditional clinical risk factors such as the manifest QTc interval on the ECG, suggesting that variability in the electrophysiological effects of the different mutations contributes to the variability in the risk of life-threatening cardiac events.10,15
Electrocardiographic Markers of Risk
QT Interval Prolongation
The QTc interval is the best prognostic ECG parameter in LQTS families. A QTc interval of at least 470 milliseconds is a predictor for increased risk for symptoms, whereas a QTc of at least 500 milliseconds predicts an increased risk of life-threatening cardiac events. The risk for cardiac events demonstrates a nearly exponential increase for the QTc interval decile. The maximal QTc duration measured at any time before age 10 was shown to be the most powerful predictor of cardiac events during adolescence, regardless of baseline, mean, or most recent QTc values.23,26
T-U Wave Morphology
Furthermore, in patients with bifid T waves, the diurnal maximal ratio between late and early T wave peak amplitude was found to correlate with a history of LQTS-related symptoms better than the baseline QTc interval in both LQT1 and LQT2 patients, and can potentially be used to assess the risk of symptoms in asymptomatic patients with known type 1 or 2 LQTS genotype. In LQT1 patients, a ratio of at least 3 suggests a high probability of being symptomatic whereas a ratio not exceeding 2 suggests a low probability. Among LQT2 patients, ratios suggestive of being symptomatic or asymptomatic are, respectively, at least 2.4 and not more than 1.5.31
Clinical Markers of Risk
Syncope
Nonfatal events (syncope and aborted cardiac arrest) in LQTS patients remain the strongest predictor of subsequent LQTS-related fatal events, and the overall risk of subsequent SCD in an LQTS patient who has experienced a previous episode of syncope is approximately 5% per year.9
The risk of subsequent syncopal episodes can be reduced with beta blocker therapy; however, patients experiencing syncope while receiving beta blockers are at high risk of subsequent cardiac events, a risk similar to that observed in patients who are not treated with beta blockers.9
Both the timing and frequency of syncopal events are related to the subsequent risk of cardiac events. Patients with recent (within the past 2 years) syncope and a higher number of syncopal events during this period carry a higher risk of cardiac events.54
Family History
The incomplete penetrance and variable expressivity in LQTS preclude predicting severity of symptoms in relatives of a symptomatic LQTS patient. In fact, SCD of a sibling (at any age) does not seem to contribute to increased personal risk of LQTS-related life-threatening cardiac events. Instead, the risk of adverse events in relatives appears to be determined more by the individual’s own risk factors (QTc duration, personal history of syncope, and gender).55
Gender
The effect of gender on outcome is age-dependent, with boys exhibiting a significant (71% to 85%) increase in risk for syncope, aborted cardiac arrest, or SCD as compared with girls during childhood and early adolescence. However, a gender risk reversal occurs after age 14 years, in which girls exhibit an 87% increase in the risk of cardiac events compared with boys among probands and a 3.3-fold increase in the risk among affected family members. When only life-threatening cardiac events (aborted cardiac arrest or SCD) are considered, the onset of gender risk reversal occurs at a later age. The cumulative probability of a first life-threatening cardiac event from age 1 to 12 years is 5% in boys compared with only 1% among girls, whereas in the age range of 12 to 20 years, there is no significant gender difference in risk. Risk reversal for the endpoint of aborted cardiac arrest or SCD occurs after the age of 20 years, and female patients maintain higher risk than male patients throughout adulthood.14
Importantly, the effect of gender on outcome appears to be genotype-dependent. Among those not more than 14 years of age, male LQT1 patients exhibit the highest risk of cardiac events; female LQT1 patients had intermediate risk; and both male and female LQT2 patients had the lowest risk. No significant gender-related difference in risk was shown among LQT2 and LQT3 children. In contrast, in the 15- through 40-year age group, risk is highest among LQT2 women, intermediate among LQT1 women, and lowest among LQT1 and LQT2 men.15
The mechanisms behind these age-dependent differences in gender-related risk are unknown. Environmental (increased physical activity), hormonal (opposing effects of estrogens and androgens on ventricular repolarization), and/or genetic (modifier genes not shared by boys and girls) factors can potentially play a role.14
Age
Risk factors in LQTS are time-dependent and age-specific (Table 31-6). LQTS patients who experience an aborted cardiac arrest during the first year of life are at a very high risk for subsequent life-threatening cardiac events during the first decade of life. The risk factors for a cardiac event in LQTS infants also include a QTc of at least 500 milliseconds, a heart rate not exceeding 100 beats/min, and female gender.56 In LQTS children, risk factors for life-threatening cardiac events include male gender, a history of syncope at any time during childhood, and a QTc duration greater than 500 milliseconds.14 Among adolescent patients with suspected LQTS, recent episodes of syncope (in particular within the past 2 years) and QTc greater than 530 milliseconds predict increased risk of LQTS-related cardiac events.54 Although LQT1 genotype predicts higher risk in patients not more than 14 years of age (especially boys), the risk is higher for LQT2 in patients 15 years of age or older (especially women). In adult patients, predictors of worse outcome include a QTc greater than 500 milliseconds, female gender, and history of syncope before age 18 years. Additionally, patients with LQT2 mutations appear to be at a greater risk for a cardiac event than patients with LQT1 or LQT3 genotypes.4
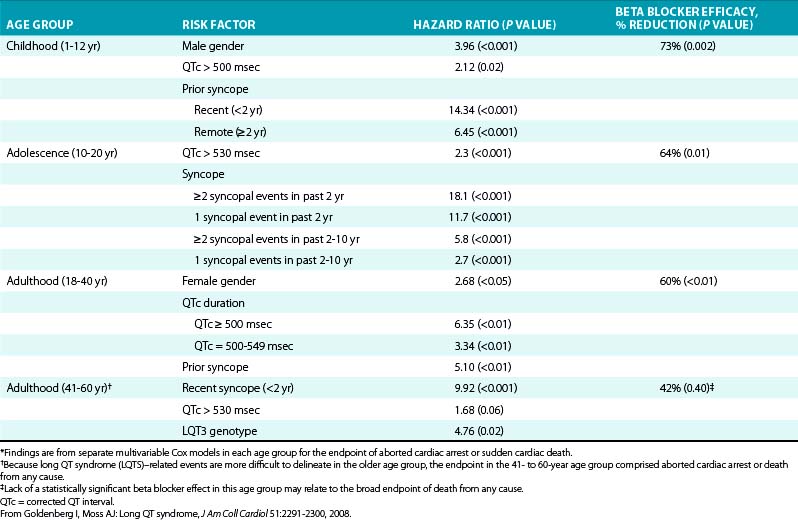
Principles of Management
The main therapeutic modalities for the prevention of life-threatening cardiac events include beta blockers, left cervicothoracic sympathetic denervation, and ICD implantation. In nongenotyped patients, beta blockers comprise the mainstay therapy, whereas cervicothoracic sympathetic denervation and implantation of an ICD are therapeutic options in high-risk LQTS patients who experience recurrent cardiac events despite beta blocker therapy.12
Pharmacological Therapy
Treatment with beta blockers is associated with a significant (53% to 64%) reduction in risk of LQTS-related life-threatening events (syncope, cardiac arrest, and SCD), regardless of age (see Table 31-6). The benefit appears to be most substantial in patients at highest risk for cardiac events. On the other hand, very low-risk patients (no history of syncope, QTc <500 milliseconds, girls <age 14, LQT2 men of any age, and LQT1 women >age 14) have such a small frequency of events that beta blockers may not provide a significant benefit.15
Genetic data can be used to guide the therapeutic management plan. Given the critical role of catecholamines in precipitating arrhythmias in LQT1, beta blocker therapy is particularly effective for this group of patients; approximately 90% of LQT1 patients treated with beta blockers remained free from syncope and cardiac arrest after a mean follow-up time of 5.4 years and showed a total mortality rate of 1%. Although beta blockers were generally considered to have lower efficacy in LQT2 patients as compared with LQT1 patients, recent data argue for a similar magnitude of risk reduction in LQT2 patients (beta blocker therapy decreased cardiac events from 58% to 23% after an average follow-up of 4.9 years on therapy). The higher residual event rate in LQT2 patients while receiving beta blocker therapy is likely due to a higher overall event rate in patients with this genotype, rather than to an attenuated efficacy of medical therapy in this high-risk population.10,15 A recent report found that a trigger-specific response to beta blocker therapy exists within the LQT2 population. Beta blockers appear to be more protective against exercise-triggered cardiac events than arousal- or non–exercise-related events (see Fig. 31-1).13
On the other hand, LQT3 patients were not shown to have a significant benefit from beta blockers; in these patients, prolongation of the QT intervals is aggravated at slow heart rates. Thus, a reduction in heart rate with beta blockers can potentially pose a therapeutic problem in these patients. Among LQT3 patients receiving beta blocker therapy, the adjusted risk for a cardiac event is fourfold higher than among LQT1 patients.12
In summary, beta blockers comprise the mainstay therapy for the prevention of life-threatening cardiac events and, given the approximately 12% risk of SCD as the first manifestation of LQTS, they should be considered the first-line measure in all nongenotyped patients and in patients with LQT1 or LQT2 genotypes, regardless of their symptomatic or risk status. Recent data have argued against the routine empirical administration of beta blockers to all patients and advocated limiting therapy to high-risk patients (including LQT1 boys in the ≤14-year group, LQT2 women in the 15- to 40-year age group, patients with a history of syncope and/or documented torsades de pointes, and patients with a QTc ≥500 milliseconds), whereas low-risk LQT1 and LQT2 patients (including female LQT1 patients and LQT2 patients in the 0- to 14-year age group and LQT1 patients and LQT2 men in the 15- to 50-year age group, without prior syncope and with a QTc <500 milliseconds) are treated with beta blocker therapy on an individual basis, and routine initiation of medical therapy if they become symptomatic or if follow-up ECGs show an increase in QTc duration. That said, it is important to understand that all these recommendations are based on observational studies and not randomized clinical trials.15
Propranolol and nadolol are the beta blockers most frequently used, although different beta blockers (including atenolol and metoprolol) demonstrate similar effectiveness in preventing cardiac events in patients with LQTS. The protective effect of beta blockers is related to their adrenergic blockade that diminishes the risk of cardiac arrhythmias; hence, the goal of beta blocker therapy is to blunt the maximal heart rate during exercise, and the adequacy of beta blockade can be assessed by exercise testing or ambulatory monitoring. Beta blockers do not substantially shorten the QT interval.32
Despite the beneficial effects of beta blockers, a high rate of residual cardiac events has been reported in patients receiving beta blocker therapy, occurring in 10%, 23%, and 32% of LQT1, LQT2, and LQT3 patients, respectively, after a mean follow-up time of 5.4 years. Therefore, patients who remain symptomatic despite treatment with beta blockers should be considered for other therapeutic modalities.57 Interestingly, it has been reported that lack of compliance can be an important cause of events occurring during beta blocker treatment in LQT1 patients.10
Implantable Cardioverter-Defibrillator
ICD therapy is highly effective to prevent SCD in high-risk LQTS patients (mortality of 1.3% in high-risk ICD patients compared with 16% in non-ICD patients during a mean follow-up time of 8 years) and should be considered for secondary prevention in patients with prior cardiac arrest and for primary prevention in those who experience syncope and/or ventricular tachyarrhythmias while receiving beta blocker therapy.4,14,54
Although prophylactic ICD therapy can be considered for LQTS patients with risk factors for SCD (see Table 31-6) regardless of medical therapy, recent data suggest that high-risk LQT1 and LQT2 patients should be considered for prophylactic ICD implantation only if they develop recurrent cardiac events (e.g., syncope or torsades de pointes) despite beta blocker therapy or when compliance with or intolerance to medical therapy is a concern. Clear understanding by the patient and/or family of the relative merits of each strategy is essential. Although beta blocker therapy significantly reduces the risk of SCD in this population, it is not completely protective, and residual cardiac events still occur. On the other hand, data suggest that syncopal episodes almost always precede cardiac arrest in patients receiving beta blockers, allowing for institution of other therapeutic modalities, such as ICD implantation. Additionally, ICD therapy is not without complications. Infection, lead malfunction, inappropriate shocks, psychiatric sequelae, as well as device and lead longevity, especially in the young patient, have to be taken into consideration.9,15,32,58
Left Cervicothoracic Sympathectomy
Although left cardiac sympathetic denervation is associated with a significant long-term reduction in the frequency of aborted cardiac arrest and syncope, it is not completely protective against SCD, with a residual mortality rate of 5% at 5 years. Therefore, ICD is superior therapy to cervicothoracic sympathectomy. Left cardiac sympathetic denervation is more effective in patients with LQT1 than in those with other types of LQTS.12
Cervicothoracic sympathectomy may be indicated in some high-risk patients with recurrent symptoms while receiving a full dose of beta blocker or those intolerant to beta blocker therapy, especially those in whom ICD implantation is not feasible (e.g., small infants). Additionally, cervicothoracic sympathectomy can be of value in ICD patients experiencing frequent shocks despite receiving adequate doses of beta blockers.12
Permanent Pacemaker
Cardiac pacing, in conjunction with beta blocker therapy, can potentially reduce the risk of bradycardia-dependent QT prolongation, decrease heart-rate irregularities (eliminating short-long-short sequences), and reduce repolarization heterogeneity. Permanent pacemakers can be of value especially in patients who continue to be symptomatic despite beta blocker therapy or those in whom bradycardia or AV block limits the use of such therapy. In particular, patients with documented pause- or bradycardia-induced torsades de pointes and those with LQT3 genotype may derive significant benefit from cardiac pacing.12
Lifestyle Modifications
Physical activity and stress-related emotions frequently trigger cardiac events in patients with LQTS, especially patients with LQT1 or LQT2. Therefore, all competitive sports (except those in the class IA category, such as billiards, bowling, cricket, and golf) should be restricted in symptomatic LQTS patients (regardless of the QTc duration or underlying genotype) as well as asymptomatic patients with baseline QT prolongation (QTc ≥470 milliseconds in men, ≥480 milliseconds in women). Swimming is particularly hazardous in LQT1 patients and should therefore be limited or performed under appropriate supervision, even in subjects with genotype-positive/phenotype-negative LQT1.59
Because many first cardiac events occur before the age of 15 years in male patients, particularly those with the LQT1 genotype, whereas female patients may experience first cardiac events after the age of 20 years, LQT1 men require stricter exercise restriction before the age of 15, but less restriction after age 15 years.59
The restriction limiting participation to class IA activities may be liberalized for the asymptomatic patient with genetically proven LQT3 genotype and those with genotype-positive/phenotype-negative LQTS (i.e., identification of an LQTS-associated mutation in an asymptomatic individual with a nondiagnostic QTc).59
Preventive measures in LQTS patients in general and LQT2 patients in particular include avoidance of unexpected auditory stimuli (such as alarm clocks and telephones), especially during rest or sleep.
Gene-Specific Therapy
The standard therapeutic options for LQTS (including beta blockers, cardiac sympathetic denervation, ICD) rely on genotype to only a minor degree, yet are quite effective. Nevertheless, beta blockers and left cervicothoracic sympathectomy have some degree of genotype specificity, being quite effective in LQT1 and LQT2 and less effective in LQT3 (see Table 31-1). Similarly, behavior modification is most helpful in LQT1 and LQT2. For practical purposes, however, this apparent genotype specificity influences therapy decisions in only a very small number of patients.12,27
Gene-specific LQTS therapy is an area under investigation and appears to be promising, including Na+ channel blockers, K+ channel activators, alpha-adrenergic receptor blockers, protein-kinase inhibitors, and atropine. However, current experience with these drugs is limited.12
Intravenous nicorandil, an agent that promotes ATP-dependent K+ channel (IKATP) opening, has been shown to improve repolarization abnormalities and can potentially be of therapeutic value in suppressing repetitive episodes of torsades de pointes in the LQT1 and LQT2 patients and less efficiently in LQT3 patients. Unfortunately, oral administration of nicorandil reaches much lower plasma concentrations than those used in the experimental setting, thus limiting the potential for its clinical use.27
Mexiletine, a class IB Na+ channel blocker, was shown to shorten the QT interval and was suggested as gene-specific therapy for patients with the LQT3 genotype, in whom enhanced late Na+ inward current underlies prolongation of the QT interval. However, the response to mexiletine was not consistent and was shown to be mutation-specific. Furthermore, there is no conclusive evidence that shortening of the QT interval in these patients translates into a clinical benefit. Until prospective clinical trials confirm the effectiveness of mexiletine, it should be used in LQT3 patients only in conjunction with beta blockers or with the backup of an ICD. In addition, some investigators recommend testing the effectiveness of mexiletine by the administration of half the daily dose during continuous ECG monitoring. Only if the QTc is shortened by more than 40 milliseconds within 90 minutes of drug administration (when the peak plasma concentration is reached) should mexiletine be added to beta blocker therapy.12,27
Similarly, the antianginal agent ranolazine reduces late Na+ current, shortens the action potential duration, and suppresses EAD-triggered arrhythmias in animal models of LQT3, and can potentially offer a therapeutic benefit in LQT3 patients.12
Additionally, flecainide, a class IC Na+ channel blocker, was shown to shorten the QT interval in LQT3 patients with a specific mutation (D1790G) in the SCN5A gene. However, flecainide is reported to elicit a Brugada phenotype in some LQT3 patients; therefore, this drug should not be used in LQT3 patients except for those with this specific SCN5A mutation.12
Potassium supplements can be of value especially in LQT2 patients, who are particularly sensitive to low K+ levels because the conductance of KCNH2 channels is directly related to extracellular K+ concentrations. Therefore, efforts should be made to maintain a serum K+ level greater than or equal to 4 mEq/L in patients with this genotype. Acute intravenous treatment with K+ can be effective in suppressing torsades de pointes. Furthermore, long-term oral potassium supplements, even in patients with normal K+ levels at baseline, can potentially reduce repolarization abnormalities in LQT2. Increasing extracellular K+ concentrations enhances IKr and at least partially compensates for the loss of IKr in LQT2 and can potentially limit the development of an arrhythmogenic substrate under long QT conditions. Whether these effects translate into clinical benefit in reduction of the risk of cardiac events is still unclear.12,15
Family Screening
Timely (often presymptomatic) identification of disease carriers is important because preventive measures and therapies can effectively avert SCD.27 Therefore, when a patient is diagnosed with LQTS, ECGs should be obtained on all first-degree family members (i.e., parents, siblings, offspring) to determine whether others are affected. Unexplained sudden death in a young individual should trigger a similar evaluation to determine if LQTS is present in the family.5
When the causal mutation has been identified in the proband, first-degree relatives should be offered genetic screening, even those with a negative clinical and ECG phenotype.36,41 Genotyping of family members can help exclude the diagnosis in some persons as well as identify silent mutation carriers and allow prophylactic treatment.7 However, detailed genetic counseling is warranted before proceeding to this testing, particularly for asymptomatic persons for whom the option of not testing must also be recognized.32
Brugada Syndrome
Epidemiology
The prevalence of the Brugada ECG pattern in an apparently healthy population is varied, ranging from 0.14% in the Japanese population to 0.61% in Europeans, and may reach as high as 3% in endemic areas of Southeast Asia. In the United States, the prevalence ranges from 0.012% to 0.43%, depending on the demographics of the patient population studied. However, because the aberrant ECG pattern can be intermittently present or concealed, it is difficult to estimate the true prevalence of the disease in the general population.60,61 For unclear reasons, the Brugada syndrome is either more prevalent or more penetrant in Eastern countries (mainly in Southeast Asia), where the disease occurs endemically.62
Although the disease is inherited as an autosomal dominant trait, there is a striking male predominance in its phenotype (ratio of men to women, 8:1). It remains unknown why men have a more penetrant form of the disease. Although gene mutations provide a proarrhythmic substrate, the adult male dominance of clinical manifestation suggests that gender- and age-related factors (e.g., sex hormones) may play a role in triggering the arrhythmia in Brugada syndrome.61,63,64
The age of onset of clinical manifestations (syncope or cardiac arrest) is the third to fourth decade of life (mean age of SCD occurrence, 41 ± 15 years), but cases have been diagnosed in infancy and in patients in their 80s.61,65
Clinical Presentation
Patients with Brugada syndrome are at high risk of rapid polymorphic VT, VF, and SCD. Syncope, agonal respirations, nocturnal labored respiration with agitation, and “seizures” are the only symptoms the patient may have before SCD occurs.
The Brugada syndrome is the leading cause of death in men not more than 40 years of age, particularly in countries in which the syndrome is endemic. The Brugada syndrome is believed to be responsible for 4% to 12% of all SCDs, and at least 20% of those occurring in patients with structurally normal hearts. The Brugada syndrome has even been described as responsible for SIDS as well as the sudden unexplained nocturnal death syndrome (SUNDS; also known as SUDS).62,65 Nevertheless, the majority of Brugada syndrome patients do not manifest life-threatening events; approximately 10% to 15% of clinically affected patients experience one or more cardiac arrests before age 60.61 In a meta-analysis of prognostic studies, patients with Brugada ECG pattern have an approximately 10% risk of SCD, syncope, or ICD shock at an average follow-up time of 2.5 years, or approximately 3.8% per year.66
Cardiac arrhythmia and death in the Brugada syndrome seem to occur largely in the early morning hours during sleep and in the setting of bradycardia. Circadian variation of sympathovagal balance, hormones, and other metabolic factors are likely to contribute to this circadian pattern. Bradycardia resulting from altered autonomic balance or other factors likely contributes to the initiation of arrhythmia.65
Some episodes of syncope or SCD can be triggered by fever, large meals (gastric distention), alcohol and cocaine toxicity, and drugs.62 In fact, it now appears that many previously described episodes of “febrile seizures” may in fact represent bouts of polymorphic VT in patients with temperature-sensitive mutations.67,68 Some patients with the Brugada syndrome experience an electrical storm of VF, but with no obvious precipitating factors.
Approximately 20% of patients with Brugada syndrome develop supraventricular arrhythmias. AF is observed in 10% to 20% of patients. Atrioventricular nodal reentrant tachycardia and Wolff-Parkinson-White syndrome also have been reported. A recent study reported that inducibility of ventricular arrhythmias is positively correlated with a history of atrial arrhythmias. In patients with an indication for an ICD, the incidence of atrial arrhythmias was 27% versus 13% in patients without an indication for an ICD, which suggests a more advanced disease process in patients with Brugada syndrome and spontaneous atrial arrhythmias.65
Electrocardiographic Features
Brugada ST Segment Elevation
Three ECG repolarization patterns in the right precordial leads are recognized (Fig. 31-4). Type 1 is characterized by ST segment elevation of at least 2 mm (0.2 mV) with a coved (downward convex) morphology, associated with an incomplete or complete right bundle branch block (RBBB) pattern and followed by a descending negative T wave, with little or no isoelectric separation. The type 2 pattern has a “saddleback” appearance with a high take-off ST segment elevation of at least 2 mm, a trough displaying an ST elevation greater than or equal to 1 mm, and then either a positive or biphasic T wave. The type 3 pattern has either a saddleback or coved appearance with an ST segment elevation of less than 1 mm. These three patterns can be observed spontaneously in serial ECG tracings from the same patient or after the introduction of specific drugs. Only the type 1 ECG pattern is diagnostic of the Brugada syndrome, with type 2 and type 3 ECG patterns being suggestive but not specific.62,65
The use of more cephalad placement of the right precordial leads in a superior position (up to the second intercostal space above normal) can increase the sensitivity for detecting the Brugada ECG pattern in some patients, both in the presence or absence of a drug challenge. Recent data suggest that patients with a diagnostic ECG with the leads positioned at a higher position have a prognosis similar to that of individuals with a type 1 ECG recorded using the standard position.65,69
The presence of the type 1 pattern is dynamic, and it is rare for patients to present with uniformly diagnostic tracings. Therefore, serial ECGs can be necessary for diagnostic evaluation in high-risk patients. Continuous Holter monitoring also can help assess ST segment elevation at nighttime, because such changes can be modified by autonomic tone.61
The ECG manifestations of the Brugada syndrome, when concealed, can be unmasked by stress, fever, various vagal stimuli (including gastric distention), vagotonic agents, a combination of glucose and insulin, hyperkalemia, hypokalemia, hypercalcemia, alcohol and cocaine toxicity, class I antiarrhythmic medications, as well as a number of other noncardiac medications.65
Furthermore, the ECG phenotype in the Brugada syndrome can be modified by autonomic changes. Adrenergic stimulation attenuates whereas acetylcholine accentuates the ECG abnormalities in affected individuals. Clinically, this correlates well with the propensity for cardiac events to occur at rest or during sleep.61
QRS Fragmentation
In addition to the repolarization abnormality, the Brugada syndrome is associated with depolarization abnormalities and conduction disturbances. Fragmentation of the QRS complex (manifesting as multiple small spikes within the QRS complex) has been recently observed in 40% of patients with the Brugada syndrome and in the majority (85%) of those who had VF episodes. It has been proposed that the multiple spikes within the fragmented QRS complex suggest the presence of an arrhythmogenic substrate that has multiple areas of conduction slowing, and can potentially predict a high risk of life-threatening ventricular arrhythmias. Notably, fragmentation of the QRS occurs preferentially in the right precordial leads, especially in the higher intercostal spaces, suggesting a localized conduction abnormality within the RV outflow tract (RVOT) region. The use of a low-pass filter with a low cutoff frequency (>25 Hz), as commonly employed to remove the electromyogram signal, can eliminate the QRS fragmentation. Thus, low-noise amplifier and a relatively high cutoff low-pass filter frequency (150 Hz) need to be used.70
Epsilon-like waves and localized prolongation of the QRS complex in the right precordial leads have been observed in some patients with a spontaneous or drug-induced type 1 Brugada ECG pattern, likely reflecting RV activation delay.71
Conduction Abnormalities
Depolarization abnormalities, including prolongation of P wave duration, PR interval, and QRS duration, are frequently observed, particularly in patients linked to SCN5A mutations. PR interval prolongation likely reflects HV conduction delay. Of note, loss-of-function SCN5A mutations can lead to isolated cardiac conduction defects or Lev-Lenègre disease, characterized by disturbances in any part of the conduction system without QT interval prolongation or Brugada ST segment elevation. Additionally, prolonged sinus node recovery time and sinoatrial conduction time, slowed atrial conduction, and atrial standstill have been reported in association with the syndrome.61,65
Signal-Averaged Electrocardiography
Signal-averaged ECG demonstrates late potentials in approximately 60% to 70% of clinically affected Brugada syndrome patients. In this setting, late potentials can be a clinical marker of the disease, representing the delayed second upstroke of the epicardial action potential, a local phase 2 reentry (failing to trigger transmural reentry), or an intraventricular conduction delay.61,65
Exercise Testing
Treadmill exercise testing can potentially aggravate the ECG abnormalities in the Brugada syndrome, including widening of the QRS, prolongation of the QTc duration, and augmentation of precordial peak ST segment elevation (which reaches its maximal amplitude during the early phase of recovery from exercise). Nonetheless, exercise was not found to induce ventricular arrhythmia in Brugada patients.72
Diagnosis of the Brugada Syndrome
Diagnostic Criteria
The diagnosis of Brugada syndrome is based on clinical diagnostic criteria. The Brugada syndrome is definitively diagnosed when type 1 ST segment elevation is observed in more than one right precordial lead (V1 to V3), in conjunction with one of the following: (1) documented VF; (2) polymorphic VT; (3) a family history of SCD at age less than 45 years; (4) coved-type ECGs in family members; (5) inducibility of VT with programmed electrical stimulation; (6) syncope; or (7) nocturnal agonal respiration.65
The diagnosis of Brugada syndrome is also considered positive when type 2 (saddleback pattern) or type 3 ST segment elevation is observed in more than one right precordial lead under baseline conditions and conversion to the diagnostic type 1 pattern occurs after administration of a Na+ channel blocker. One or more of the clinical criteria described above also should be present. Drug-induced conversion of type 3 to type 2 ST segment elevation is considered inconclusive for a diagnosis of Brugada syndrome.65,73
Provocative Drug Testing
The drug challenge test involves administration of ajmaline, flecainide, procainamide, or pilsicainide (Table 31-7) under close cardiac monitoring and in a setting that is fully equipped for resuscitation. Procainamide remains the only choice for intravenous pharmacological induction protocols in the United States, despite consensus that both ajmaline and flecainide are more efficacious and are likely safer because of shorter half-life.74
| DRUG | DOSE |
|---|---|
| Ajmaline | 1-mg/kg IV infusion over 5 min |
| Flecainide | 2-mg/kg IV infusion over 10 min, maximum 150 mg; or 400 mg oral |
| Procainamide | 10-mg/kg IV infusion over 10 min |
| Pilsicainide | 1-mg/kg IV infusion over 10 min |
IV = intravenous.
The drug challenge test is terminated when (1) the diagnostic type 1 ST segment elevation develops (Fig. 31-5), (2) the ST segment elevation in type 2 ECG pattern increases by at least 2 mm, (3) PVCs or other arrhythmias develop, or (4) the QRS widens by 30% or more. Although the drug challenge test is generally safe, it can potentially precipitate malignant cardiac arrhythmias or advanced AV block, particularly in patients with preexisting intraventricular conduction disturbances (wide QRS complex) or infranodal AV conduction delay. Isoproterenol and sodium lactate can be effective antidotes in this setting. The sensitivity and specificity of flecainide testing have recently been estimated at 77% and 80%, respectively. Of note, quinidine, a class IA antiarrhythmic and a Na+ channel blocker, generally normalizes ST elevation in Brugada syndrome patients owing to its potent Ito-blocking effect.61,65,69,73
Genetic Testing
Diagnostic genetic testing may be considered for patients who clinically manifest with symptoms of the Brugada syndrome. Although the knowledge of a specific mutation may not provide guidance for determining prognosis or treatment, identification of a disease-causing mutation in the family can lead to genetic identification of at-risk family members who are clinically asymptomatic and who may have normal ECG. However, it is important to remember that a negative result of genetic testing does not exclude the presence of the disease and, therefore, only a positive genetic diagnosis is informative.65,75 Genetic screening of SCN5A in unselected patients with diagnosis of Brugada syndrome has low yield and may not be cost-effective. Only 13% of patients with spontaneous or drug-induced type 1 Brugada ECG pattern, 4% of those with type 2 or 3 Brugada ECG pattern, and 2% of individuals with idiopathic VF or family history of SCD are genotyped on SCN5A. The yield of genotyping increases substantially in patients with type 1 Brugada ECG pattern and prolonged PR interval, suggesting that this subset of patients with Brugada syndrome should be screened.75 Genetic testing is not indicated in the setting of an isolated type 2 or type 3 Brugada ECG pattern.41
Genetics of the Brugada Syndrome
The Brugada syndrome is a channelopathy that causes current dysfunction in those channels participating in the generation of the cardiac action potential. SCN5A, the gene that encodes the alpha subunit (Nav1.5) of the cardiac Na+ channel, was the first gene linked to Brugada syndrome. Although most mutations occur in SCN5A, mutations in other genes related to the Na+ current as well as genes that affect L-type Ca2+ channels (ICaL) or transient outward K+ channels (Ito) have been identified in patients with the Brugada syndrome (Table 31-8). These channelopathies cause Brugada syndrome phenotype by attenuating INa, attenuating ICaL, and/or enhancing Ito. However, the relationships between genotype and phenotype are not always predictive. Mutations in different genes can express similar Brugada syndrome phenotypes. Conversely, mutations in the same gene can lead to different syndromes.62,63,65
On the other hand, the failure to identify gene mutations in most patients with the Brugada syndrome suggests that unknown mutations or pathophysiological cellular regulations (such as post-translational modulations, phosphorylation, glycosylation) may also cause similar ion current defects and clinical manifestations.63
Mutations Related to the Sodium Current
On average 18% to 30% of cases of the Brugada syndrome can be attributed to loss-of-function mutations in the SCN5A gene, which encodes the alpha subunit (Nav1.5) of the cardiac voltage-gated Na+ channel, resulting in a reduction of the depolarizing inward sodium current (INa). A higher incidence of SCN5A mutations has been reported in familial than in sporadic cases. INa initiates the ventricular action potential, thereby controlling cardiac excitability and electric conduction velocity.62
So far, more than 200 Brugada syndrome-associated mutations have been described in the SCN5A gene. Some of these mutations result in loss of function due to impaired channel trafficking to the cell membrane, disrupted ion conductance, or altered gating function. Most of the mutations are missense mutations, whereby a single amino acid is replaced by a different amino acid. Missense mutations commonly alter the gating properties of mutant channels. Because virtually all reported SCN5A mutation carriers are heterozygous, mutant channels with altered gating can result in an up to 50% reduction of INa. Different SCN5A mutations can cause different degrees of INa reduction and, hence, different levels of severity of the clinical phenotype of the Brugada syndrome.62,65,66
SCN5A loss-of-function mutations have also been linked to patients with progressive cardiac conduction system disease (Lev-Lenègre disease). Mutated SCN5A can also impede the closure (gain of function) of the Na+ channel, leading to type 3 LQTS (LQT3). It was reported that all three syndromes (Brugada syndrome, LQT3, and Lev-Lenègre disease) occurred within a single family because of a single mutated SCN5A gene. Approximately 65% of mutations identified in the SCN5A gene are associated with the Brugada syndrome phenotype.63
Compared with Brugada patients without an SCN5A mutation, those with SCN5A mutations generally exhibit longer and progressive conduction delays (PQ, QRS, and HV intervals), frequent occurrences of fragmented QRS complex, and ventricular arrhythmias of extra-RVOT origin.63
In addition to SCN5A mutations, reduction in INa can be caused by mutations in the SCN1B gene (encoding the beta1 and beta1b subunits of the Na+ channel) and the SCN3B gene (encoding the beta3 subunit of the Na+ channel), resulting in Brugada syndrome type 5 and type 7, respectively.62,63
Furthermore, mutations in the GPD1L (glycerol-3-phosphate dehydrogenase 1-like) gene, which encodes the protein glycerol-3-phosphate dehydrogenase 1-like (G3PD1L), affect the trafficking of the cardiac Na+ channel to the cell surface, resulting in reduction of INa and “type 2” Brugada syndrome.62 Brugada syndrome associated with GPD1L gene mutations is characterized by progressive conduction disease, low sensitivity to procainamide, and a relatively good prognosis.63
Mutations Related to the Calcium Current
Approximately 11% to 12% of cases of the Brugada syndrome are attributable to loss-of-function mutations in the cardiac Ca2+ channel resulting in a reduction of the depolarizing ICaL. Brugada syndrome type 3 is caused by mutations in the CACNA1C gene, which encodes the pore-forming alpha1 subunit (Cav1.2) of the L-type voltage-gated Ca2+ channel. Brugada syndrome type 4 is caused by mutations in the CACNB2 gene, which encodes for the regulatory beta2 subunit (Cavβ2) of Cav1.2, which modifies gating of ICaL. The mechanism of Brugada syndrome type 3 and type 4 involves a reduction of the depolarizing ICaL. Mutations in the alpha and beta subunits of the Ca2+ channel can also lead to a shorter than normal QT interval, creating a new clinical entity consisting of combined Brugada/SQTS.62
Pathophysiology of the Brugada Syndrome
Mechanism of Brugada ECG Pattern
The ST-T wave changes in Brugada syndrome likely reflect a profound change in the process of ventricular repolarization, particularly in the relationship between the endocardial and epicardial repolarization processes. The cellular basis for this phenomenon is thought to be the result of loss of function of Na+ channels (reduced INa) that differentially alters the action potential morphology in epicardial versus endocardial cells.47,63
Ito is a prominent repolarizing current; it partially repolarizes the membrane, shaping rapid (phase 1) repolarization of the action potential, setting the height of the initial plateau (phase 2), and resulting in a pronounced action potential notch and, in combination with depolarizing Ca2+ currents, in a “spike-and-dome” morphology. Ito channel densities are heterogeneously distributed across the myocardial wall and in different regions of the heart, being much higher in the RV than in the LV, in the epicardium than in the endocardium, and nearer the base than the apex of the ventricles. These regional differences are responsible for the shorter duration, the prominent phase 1 notch, and the “spike and dome” morphology of RV epicardial and midmyocardial action potentials compared with endocardium and LV. A prominent Ito-mediated action potential notch in ventricular epicardium but not endocardium produces a transmural voltage gradient during early ventricular repolarization that registers as a J wave or J point elevation on the ECG (Fig. 31-6).76,77
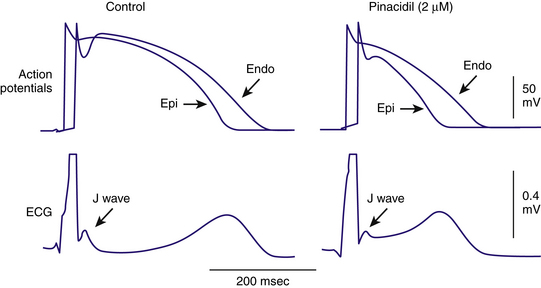
Na+ channel malfunction and reduction of INa associated with the Brugada syndrome accentuate the notch produced by Ito, leading to partial or complete loss of the action potential dome, premature repolarization, and significant action potential shortening, presumably by deactivation or voltage modulation that reduces ICaL. These changes occur predominantly in regions where Ito is abundant (such as RVOT epicardium). In contrast, endocardial cells display a much smaller Ito and, consequently, INa reduction would not significantly affect action potential morphology and duration.62 This is likely to manifest on the ECG as an early repolarization pattern consisting of a J point elevation, slurring of the terminal part of the QRS, and mild ST segment elevation. A further increase in net repolarizing current can result in complete loss of the action potential dome in the RVOT epicardium, leading to more pronounced dispersion of repolarization (epicardial repolarization precedes repolarization in endocardial regions) and a transmural voltage gradient that manifests as greater ST segment elevation.62,76
Additionally, the reduction in INa observed in Brugada syndrome linked to an SCN5A mutation leads to a reduction in the upstroke velocity of action potential phase 0, and, as a result, slowing in atrial and ventricular electrical conduction. Conduction slowing preferentially involves the RVOT. This often is reflected by prolongation in atrioventricular and intraventricular conduction intervals (PR and HV intervals and QRS duration) on the ECGs of Brugada syndrome patients with an SCN5A mutation. Slowed transmural conduction (which preferentially involves the RVOT) likely contributes to ST elevation by delaying epicardial activation, thus increasing the transmural gradient of the membrane potential.47,63
Mechanism of Ventricular Arrhythmias
The excessive increase in intramural dispersion of repolarization (between epicardium and endocardium) facilitates reentrant excitation waves between depolarized endocardium and prematurely repolarized epicardium. A significant outward shift in current can cause a prominent action potential notch causing more negative potentials during phase 1 of the action potential and loss of activation of ICaL. As a consequence, loss of the action potential dome and marked abbreviation of the action potential develop in regions where Ito is prominent (epicardium) but not in other locations. The dome then can propagate from regions where it is maintained to regions where it is lost, giving rise to a very closely coupled extrasystole (phase 2 reentry) that in turn can initiate polymorphic VT or VF (Fig. 31-7).
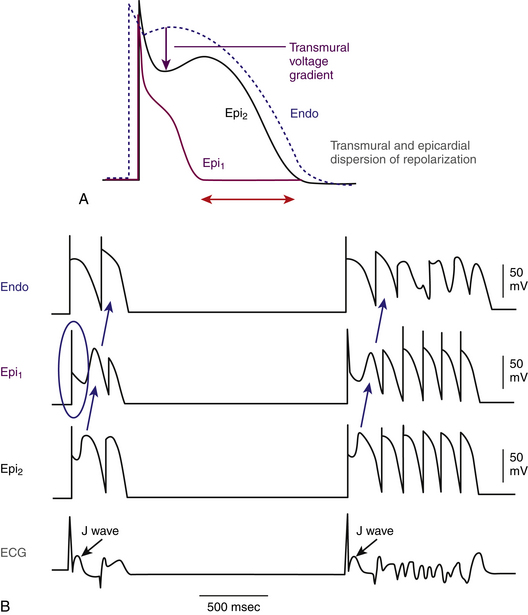
Although the repolarization abnormalities facilitate the onset of polymorphic VT, it is the depolarization disturbance (conduction slowing leading to wave break of the reentrant wave) that allows the VT to become sustained and to degenerate to VF. Because the RVOT is the critical area associated with depolarization and repolarization abnormalities, it is a frequent origin of VT and VF in the setting of Brugada syndrome (see Fig. 31-4).47,62,78
Mechanism of Age and Gender Effects
The effects of gender on the Brugada syndrome phenotype (being more prevalent in men) may be due to intrinsic differences in Na+ channel expression between men and women (e.g., higher Ito densities in men) or due to differences in hormone levels (e.g., higher testosterone levels in men). The phase 1 notch potentially mediates the effects of sex hormones on the phenotypic expressions of Na+ channel dysfunction, thus contributing to the male predominance of Brugada syndrome. Estrogen suppresses the expression of the Kv4.3 channel, resulting in reduced Ito and a shallow phase 1 notch, whereas testosterone enhances the outward currents (IKr, IKs, IK1) and reduces the inward current (ICaL), thus deepening the phase 1 notch.47,63,64
Mechanism of Temperature Sensitivity
The exact mechanism by which fever triggers arrhythmias in Brugada syndrome remains unknown. Mutations responsible for Brugada syndrome can potentially alter the temperature sensitivity of fast inactivation of the Na+ channel (e.g., more slow inactivation at higher temperatures). Alternatively, temperature elevation can potentially result in a positive shift of steady-state activation, acceleration of inactivation, and slow recovery from inactivation in both wild and mutant Na+ channels, resulting in INa reduction, deepening of the phase 1 notch of the action potential, and aggravation of the Brugada syndrome.47,63,68,79
Mechanism of Exercise-Induced Changes
Mechanisms that underlie ECG responses in the Brugada syndrome to exercise are complex, which may be related to different molecular-genetic mutations underlying the Brugada syndrome phenotype. Exercise testing can potentially aggravate the ECG abnormalities in the Brugada syndrome. However, other factors (e.g., autonomic nervous system, ion current imbalances) also play a role. Nonetheless, exercise was not found to induce ventricular arrhythmia in Brugada patients.47,72
Brugada syndrome–linked loss-of-function mutations in SCN5A reduce INa more during tachycardia, likely secondary to accumulation of mutant Na+ channels in the slow inactivated state. Na+ channels activate on depolarization and inactivate within milliseconds thereafter. Before reopening, channels must recover from inactivation during diastole. At fast heart rates, the diastolic interval becomes too short for mutant channels to completely recover from the slow inactivated state, resulting in decreased availability of open channels and, as a consequence, accentuation of Na+ channel loss of function produced by SCN5A mutations.47,72
Mechanism of Drug Effects
Pharmacological agents that primarily block INa but not Ito (flecainide, ajmaline, and procainamide) can further diminish INa that is already reduced by the Brugada mutations. This may explain the use of Na+ channel blockers to unmask concealed forms of the Brugada syndrome and the potential proarrhythmic adverse effects of these and other pharmacological agents. In contrast, quinidine, in addition to blocking INa, has a relatively strong effect in blocking Ito. Hence, quinidine can effectively suppress ST elevation and ventricular arrhythmias in patients with the Brugada syndrome.64
Beta-adrenergic stimulation induces increased inward ICaL and attenuates the excess of outward current, resulting in reduction of ST segment elevation in right precordial leads and potentially underlying the therapeutic benefit observed for isoproterenol infusion for prevention of ventricular arrhythmias in Brugada syndrome patients with electrical storm. In contrast, acetylcholine facilitates the loss of the action potential dome by suppressing ICaL and/or augmenting K+ current.80
Differential Diagnosis
Several psychotropic drugs have been reported to unmask Brugada-like ST segment elevation, secondary to block of fast INa usually with drug overdose. Other drugs that can potentially unmask a Brugada-like ECG pattern include verapamil, lithium, H1 antihistamines, propofol, alcohol intoxication, cocaine intoxication, and potentially nitrates, vagomimetic agents, and beta blockers (Table 31-9).64
| DRUG GROUP | EXAMPLE(S) |
|---|---|
| Class IC antiarrhythmic drugs | Flecainide, propafenone, pilsicainide |
| Class IA antiarrhythmic drugs | Ajmaline, procainamide, disopyramide |
| Calcium channel blockers | Verapamil, diltiazem, nifedipine |
| Beta blockers | Propranolol |
| H1-Antihistamines | Dimenhydrinate |
| Tricyclic antidepressants | Amitriptyline, nortriptyline, desipramine |
| Tetracyclic antidepressants | Maprotiline |
| Selective serotonin reuptake inhibitors | Fluoxetine |
| Phenothiazines | Perphenazine, trifluoperazine |
| Local anesthetics | Bupivacaine |
| Other drugs | Lithium, nitrates, propofol |
Whether this “acquired” form of Brugada syndrome unmasks clinically inapparent Brugada syndrome (“forme fruste”) or merely represents one end of a broad spectrum of responses to Na+ channel blockers is not known. The prognosis of asymptomatic patients with drug-induced Brugada ECG pattern, but without a family history of SCD, appears to be benign once the offending agent is discontinued, provided the full-blown Brugada syndrome is not uncovered.64
In addition to drug-induced Brugada syndrome, it is also important to exclude a variety of pathological and physiological conditions that can potentially mimic the Brugada ECG pattern. These include atypical RBBB, LV hypertrophy, pulmonary embolism, acute pericarditis, various central and autonomic nervous system abnormalities, hyperkalemia, hypercalcemia, ARVD, mechanical compression of the RVOT (e.g., by tumor), pectus excavatum, hyperthermia, and hypothermia. Acute myocardial infarction or ischemia involving the RVOT can produce Brugada-like ST elevation, likely because of the attenuation of ICaL and enhancement of IKATP during ischemia. Additionally, a Brugada-like ST elevation can occasionally appear for a brief period after direct-current cardioversion; it is not known whether these patients are gene carriers for the Brugada syndrome.61,65
Early repolarization syndromes (J wave syndromes) can mimic Brugada ECG pattern (see later discussion). ST segment elevation encountered in healthy well-trained athletes is usually distinguished from Brugada ECG pattern by an upslope rather than a downslope of the ST segment and by remaining largely unaffected by challenge with a Na+ channel blocker.61,65
Risk Stratification
Brugada syndrome patients initially presenting with aborted SCD are at the highest risk for a recurrence (69% at 54 ± 54 months of follow-up), whereas patients presenting with syncope and a spontaneously appearing type 1 ECG have a recurrence rate of 19% at 26 ± 36 months of follow-up.65,69
Importantly, familial forms of the Brugada syndrome do not appear to be associated with a worse prognosis than are sporadic cases; in other words, a positive family history of Brugada syndrome does not predict outcome. Similarly, a positive family history for SCD and the identification of an SCN5A genotype are not reliable predictors for poor outcome in asymptomatic patients.66,69,81
The usefulness of inducibility of ventricular arrhythmias by programmed stimulation as a predictor for poor outcome has been debated and is unresolved. VF or sustained polymorphic VT can be induced in approximately 50% to 70% of Brugada patients during EP testing. Whereas some investigators found programmed stimulation to be a useful discriminator of risk, others have not found it to be predictive. These discrepancies are likely the result of differences in patient characteristics, subtle differences in the diagnostic criteria, and the use of nonstandardized or noncomparable stimulation protocols. It is important to recognize that VF can be induced by programmed electrical stimulation in 6% to 9% of apparently healthy individuals and can represent a false-positive and nonspecific response, particularly when aggressive stimulation protocols are used.65,66,69
Patients with a type 2 or 3 ECG pattern that did not convert to type 1 during drug challenge testing were found to have a good prognosis and noninducible ventricular arrhythmias during programmed electrical stimulation. However, in a recent report, the prognosis of probands with non–type 1 Brugada-pattern ECG (even after challenge with a Na+ channel blocker) was similar to that of patients with spontaneous or drug-induced type 1 ST elevation. Patients presenting with aborted cardiac arrest had a grim prognosis (annual rate of arrhythmic events of 10.6%), whereas those presenting with syncope or no symptoms had an excellent prognosis (annual rate of arrhythmic events ≤1.2%) irrespective of their ECG pattern (that is, type 1 versus non–type 1). Also, a family history of SCD at age less than 45 years and coexistence of early repolarization in the inferolateral leads (observed in 8% to 11% of Brugada patients) were predictors of poor outcome. In contrast, VT/VF inducibility during programmed stimulation was not a predictor of outcome. Furthermore, men with a spontaneous type 1 ECG recorded only at the higher leads V1 and V2 showed a prognosis similar to that of men with a type 1 ECG when using standard leads.73,81
Principles of Management
Implantable Cardioverter-Defibrillator
Currently, an ICD is the only proven effective treatment for the Brugada syndrome. There is general consensus that ICD implantation is recommended in patients with type 1 Brugada ECG (either spontaneously or after Na+ channel blockade) and a history of aborted SCD or related symptoms such as syncope, seizure, or nocturnal agonal respiration, given that noncardiac causes of these symptoms have been carefully excluded. The cumulative efficacy of ICD therapy (at least one appropriate defibrillation) in these patients is 18%, 24%, 32%, 36%, and 38% at 1, 2, 3, 4, and 5 years of follow-up, respectively. ICD devices need to be carefully programmed in Brugada syndrome patients in order to avoid inappropriate shocks, given the high incidence of supraventricular arrhythmias (especially AF) in this population. Programming a single VF zone of more than 210 beats/min with or without a monitoring zone of more than 180 beats/min is preferable.65,82
On the other hand, there is no similar consensus regarding the management of asymptomatic patients with the Brugada syndrome. Whereas some experts advocate close follow-up, others propose the evaluation of VT/VF inducibility by programmed stimulation for risk stratification and to decide on ICD implantation in patients with spontaneous type 1 Brugada ECG. It is important to recognize that ICD therapy is not without complications. A recent study of ICD use in 220 patients with the Brugada syndrome, of whom nearly 50% were symptomatic, showed that during a 3-year follow-up inappropriate shocks occurred 2.5 times more frequently (20%) than appropriate shocks (8%), and other procedure-related complications occurred in 8% of patients. Therefore, more studies are needed to define further the risk stratification strategy in these patients.82
For asymptomatic patients with normal baseline ECG and those with spontaneous type 1 Brugada ECG but noninducible VT/VF during programmed stimulation, reassurance is adequate management.65,69
Pharmacological Therapy
At present, there is no specific pharmacological treatment to prevent SCD in patients with Brugada syndrome. Because of the critical role of Ito in the arrhythmogenesis in the Brugada syndrome, Ito blockade may be protective. Additionally, agents that augment ICaL have been shown to have a therapeutic value. Both groups of drugs can potentially restore the RV epicardial action potential dome, thus normalizing the ST segment and preventing phase 2 reentry and polymorphic VT in the Brugada syndrome. Although clinical evidence of the long-term efficacy in the prevention of SCD is limited, the use of Ito blockers and agents that augment ICaL may be considered in high-risk patients who are not candidates for ICD implantation, as adjunctive chronic treatment in ICD patients with frequent appropriate ICD therapies, as well as in patients with VF storm.65,67 Additionally, these agents may be considered as an alternative therapeutic strategy to early ICD implant if an acceptable therapeutic response (i.e., ECG normalization and noninducibility of ventricular arrhythmia on programmed stimulation) can be achieved. Further systematic evaluation of the usefulness of these oral agents in larger numbers of Brugada patients is required to make a definitive conclusion.67,69
In patients with Brugada syndrome and electrical storm of VF, isoproterenol, a beta-adrenergic agonist, is reported to decrease ST elevation and suppress repetitive episodes of VF, likely via augmentation of ICaL. In one report, five of seven patients with VF storm were successfully treated with isoproterenol infusion (dose titrated to achieve a 20% increase in heart rate). However, discontinuation or decrease in the infusion rate often resulted in recurrence of arrhythmias, and the total duration of intravenous therapy was quite long (average, 20 days). Eventually, all patients were successfully switched to oral medications (denopamine, quinidine, cilostazol, bepridil, or a combination thereof). Before consideration of isoproterenol therapy, however, it is critical that the diagnosis of Brugada syndrome be clearly established as the underlying etiology of VF storm. Isoproterenol infusion can be devastating in patients with VF due to other mechanisms, especially CPVT. This is especially important to recognize because a Brugada-like ST segment elevation can occasionally appear for a brief period in a patient successfully defibrillated from VF.67
Interestingly, in some SCN5A mutations that impair protein trafficking to the cell membrane, mexiletine (a class IB Na+ channel blocker) has the potential to serve as a mutation-specific therapy. Mexiletine binds to mutant proteins and acts as a molecular chaperone to rescue their trafficking to the sarcolemma and restore INa. However, it is questionable whether such drugs can be used as therapy because (once expressed on the sarcolemma) the mutant proteins can potentially display arrhythmia-causing gating defects. Moreover, Na+ channel–blocking effects of the drug reduce INa and, hence, can potentially aggravate the ECG changes or trigger arrhythmias in the Brugada syndrome.47
Finally, several drugs have been reported to exacerbate the ECG pattern of ST segment elevation in the Brugada syndrome and to trigger arrhythmias, and should be avoided. These drugs include antiarrhythmics (class IA, IC), beta blockers, tricyclic antidepressants, local anesthetics (bupivacaine), opioid analgesics (propoxyphene), propofol, K+ channel activators (pinacidil), lithium, cocaine, alpha-adrenergic agonists (methoxamine), and vagomimetic agents. Furthermore, fever, which can potentially trigger fatal events, should be treated promptly.65 It should be stressed that ventricular arrhythmias in Brugada syndrome respond differently from most other VTs in that they are suppressed by sympathomimetic agents and enhanced by vagomimetic agents.
Participation in Sports
Although a clear association between exercise and SCD has not been established, restriction to participation in class IA sports seems advisable, especially given the potential impact of hyperthermia on triggering cardiac events in patients with the Brugada syndrome. The presence of an ICD device warrants the same restrictions to class IA sports.59,83
Family Screening
Given the insensitivity of ECG changes in establishing the diagnosis, molecular genetic testing of at-risk asymptomatic family members of a patient with Brugada syndrome should be considered if the disease-causing mutation has been identified in the proband. Family members who test positive for the familial mutation should receive baseline ECG and annual ECG screening examinations, and should be instructed to avoid medications that can induce ventricular arrhythmias and to seek medical attention immediately on occurrence of symptoms.41 On the other hand, a negative genetic test result for the familial mutation would obviate the need for repeated follow-up examinations. Genetic testing also can be used for prenatal diagnosis. All patients who undergo genetic testing should receive pretest and post-test genetic counseling to understand the implications of testing.