Chapter 5 Conventional Intracardiac Mapping Techniques
Activation Mapping
Fundamental Concepts
The main value of intracardiac and surface ECG tracings consists of the comparative timing of electrical events and the determination of the location and direction of impulse propagation. Additionally, electrogram morphology can be of significant importance during mapping. Interpretation of recorded electrograms is fundamental to the clinical investigation of arrhythmias during electrophysiological (EP) studies. Establishing electrogram criteria, which permit accurate determination of the moment of myocardial activation at the recording electrode, is critical for construction of an area map of the activation sequence. Bipolar recordings are generally used for activation mapping. Unipolar recordings are used to supplement the information obtained from bipolar recordings. The differences in unipolar and bipolar recordings can be used to assist in mapping by simultaneously recording bipolar and unipolar signals from the mapping catheter.1
Unipolar Recordings
Timing of Local Activation
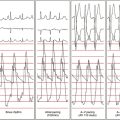
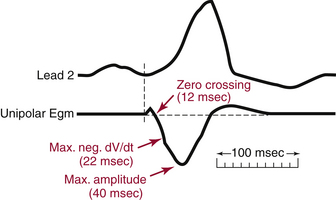
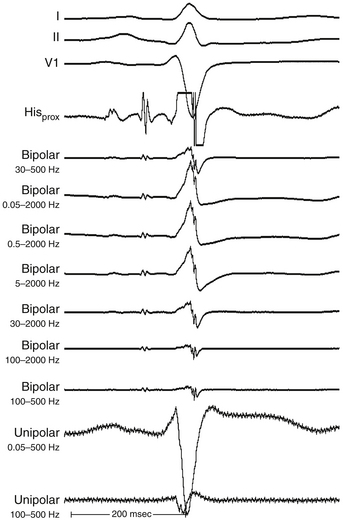
The major component of the unipolar electrogram allows determination of the local activation time, although there are exceptions. The point of maximum amplitude, the zero crossing, the point of maximum slope (maximum first derivative), and the minimum second derivative of the electrogram have been proposed as indicators of underlying myocardial activation (Fig. 5-1). The maximum negative slope (i.e., maximum change in potential, dV/dt) of the signal coincides best with the arrival of the depolarization wavefront directly beneath the electrode because the maximal negative dV/dt corresponds to the maximum sodium channel conductance. Using this fiducial point, errors in determining the local activation time as compared with intracellular recordings have typically been less than 1 millisecond. This is true for filtered and unfiltered unipolar electrograms.1,2
Direction of Local Activation
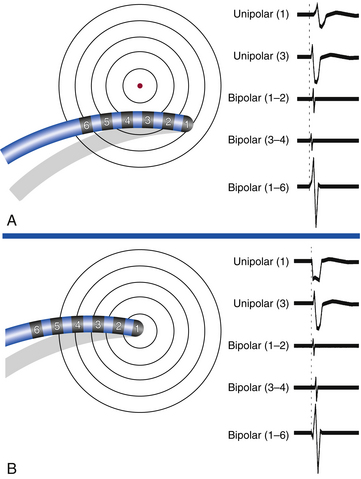
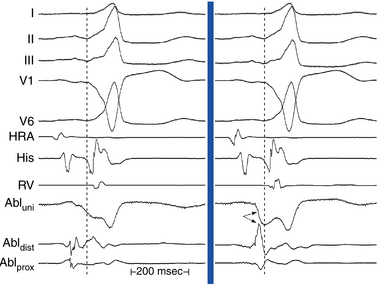
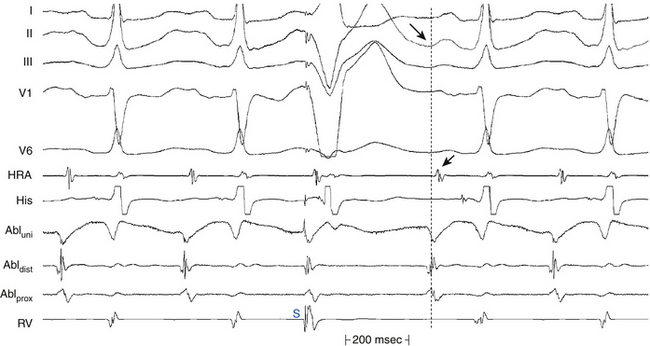
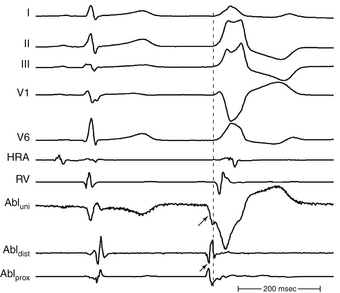
The morphology of the unfiltered unipolar recording indicates the direction of wavefront propagation. By convention, the mapping electrode that is in contact with the myocardium is connected to the positive input of the recording amplifier. In this configuration, positive deflections (R waves) are generated by propagation toward the recording electrode, and negative deflections (QS complexes) are generated by propagation away from the electrode (Figs. 5-2 and 5-3). If a recording electrode is at the source from which all wavefronts propagate (at the site of initial activation), depolarization will produce a wavefront that spreads away from the electrode, thus generating a monophasic QS complex. It is also important to recognize that a QS complex can be recorded when the mapping electrode is not in contact with the myocardium, but is floating in the cavity. In that situation, the initial negative slope of the recording is typically slow, suggesting that the electrogram is a far-field signal, generated by tissue some distance from the recording electrode.1 Filtering at higher corner frequencies (e.g., 30 Hz) alters the morphology of the signal, so that the morphology of the unipolar electrogram is no longer an indication of the direction of wavefront propagation, and the presence or absence of a QS complex cannot be used to infer proximity to the site of earliest activation (Fig. 5-4).2
Disadvantages of Unipolar Recordings
The major disadvantage of unipolar recordings is that they have poor signal-to-noise ratio and contain substantial far-field signal generated by depolarization of tissue remote from the recording electrode. Therefore, distant activity can be difficult to separate from local activity. This is especially true when recording from areas of prior myocardial infarction (MI), where the fractionated ventricular potentials are ubiquitous and it is often impossible to select a rapid negative dV/dt when the entire QS potential is slowly inscribed—that is, cavity potential.2 Another disadvantage is the inability to record an undisturbed electrogram during or immediately after pacing. This is a significant disadvantage when entrainment mapping is to be performed during activation mapping, because recording of the return tachycardia complex on the pacing electrode immediately after cessation of pacing is required to interpret entrainment mapping results.1
Bipolar Recordings
Timing of Local Activation
Algorithms for detecting local activation time from bipolar electrograms have been more problematic, partly because of generation of the bipolar electrogram by two spatially separated recording poles. In a homogeneous sheet of tissue, the initial peak of a filtered (30 to 300 Hz) bipolar signal, the absolute maximum electrogram amplitude, coincides with depolarization beneath the recording electrode, appears to correlate most consistently with local activation time, and corresponds to the maximal negative dV/dt of the unipolar recording (see Fig. 5-3).2 However, in the case of complex multicomponent bipolar electrograms, such as those with marked fractionation and prolonged duration seen in regions with complex conduction patterns (e.g., in regions of slow conduction in macroreentrant atrial tachycardia [AT] or ventricular tachycardia [VT]), determination of local activation time becomes problematic, and the decision about which activation time is most appropriate needs to be made in the context of the particular rhythm being mapped. To acquire true local electrical activity, a bipolar electrogram with an interelectrode distance of less than 1 cm is desirable. Smaller interelectrode distances record increasingly local events (as opposed to far-field). Elimination of far-field noise is usually accomplished by filtering the intracardiac electrograms, typically at 30 to 500 Hz.1,2
Direction of Local Activation
The morphology and amplitude of bipolar electrograms are influenced by the orientation of the bipolar recording axis to the direction of propagation of the activation wavefront. A wavefront that is propagating in the direction exactly perpendicular to the axis of the recording dipole produces no difference in potential between the electrodes and hence no signal.1,2 However, the direction of wavefront propagation cannot be reliably inferred from the morphology of the bipolar signal, although a change in morphology can be a useful finding. For example, when recording from the lateral aspect of the cavotricuspid isthmus during pacing from the coronary sinus (CS), a reversal in the bipolar electrogram polarity from positive to negative at the ablation line indicates complete isthmus block. Similarly, if bipolar recordings are obtained with the same catheter orientation parallel to the atrioventricular (AV) annulus during retrograde bypass tract (BT) conduction, an RS configuration electrogram will be present on one side of the BT, where the wavefront is propagating from the distal electrode toward the proximal electrode, and a QR morphology electrogram will be present on the other side, where the wavefront is propagating from the proximal electrode toward the distal electrode (Fig. 5-5).
Disadvantages of Bipolar Recordings
In contrast to unipolar signals, the direction of wavefront propagation cannot be reliably inferred from the morphology of the bipolar signal. Furthermore, bipolar recordings do not allow simultaneous pacing and recording from the same location. To pace and record simultaneously in bipolar fashion at endocardial sites as close together as possible, electrodes 1 and 3 of the mapping catheter are used for bipolar pacing, and electrodes 2 and 4 are used for recording. The precision of locating the source of a particular electrical signal depends on the distance between the recording electrodes, because the signal of interest can be beneath the distal or proximal electrode (or both) of the recording pair.1
Mapping Procedure
Selection of the Electrical Reference Point
Local activation times must be relative to some external and consistent fiducial marker, such as the onset of the P wave or QRS complex on the surface ECG or a reference intracardiac electrode. For VT, the QRS complex onset should be assessed using all surface ECG leads to search for the lead with the earliest QRS onset. This lead should then be used for subsequent activation mapping. Similarly, the P wave during AT should be assessed using multiple ECG leads and choosing the one with the earliest P onset. However, determining the onset of the P wave can be impossible if the preceding T wave or QRS is superimposed. To facilitate visualization of the P wave, a ventricular extrastimulus (VES) or a train of ventricular pacing can be delivered to anticipate ventricular activation and repolarization and permit careful distinction of the P wave onset (Fig. 5-6). After determining P wave onset, a surrogate marker, such as a right atrial (RA) or CS electrogram indexed to the P wave onset, where it is clearly seen, can be used rather than the P wave onset.
Defining the Goal of Mapping
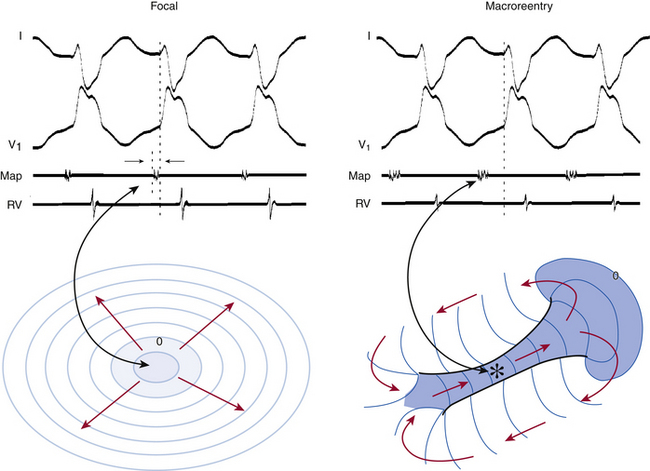
Determination of the mechanism of the tachycardia (focal versus macroreentrant) is essential to define the goal of activation mapping. For focal tachycardias, activation mapping entails localizing the site of origin of the tachycardia focus. This is reflected by the earliest presystolic activity that precedes the onset of the P wave (during focal AT) or QRS (during focal VT) by an average of 10 to 40 milliseconds, because only this short amount of time is required after the focus discharges to activate enough myocardium and begin generating a P wave or QRS complex (Fig. 5-7). For mapping macroreentrant tachycardias, the goal of mapping is identification of the critical isthmus of the reentrant circuit, as indicated by finding the site with a continuous activity spanning diastole or with an isolated mid-diastolic potential (see Fig. 5-7).
Epicardial Versus Endocardial Mapping
Another epicardial mapping technique utilizes a subxiphoid percutaneous approach for accessing the epicardial surface. This technique has become an important adjunctive strategy to ablate a diverse range of cardiac arrhythmias including cardiomyopathic VT, BTs, atrial fibrillation, and idiopathic VTs. Transthoracic epicardial mapping and ablation are seeing increasingly wider application, especially in patients with scar-related VT, in whom more reentrant circuits with vulnerable isthmuses are on the epicardial surface. The same fundamental principles of activation mapping are used for both endocardial mapping and epicardial mapping.3–7
Mapping Focal Tachycardias
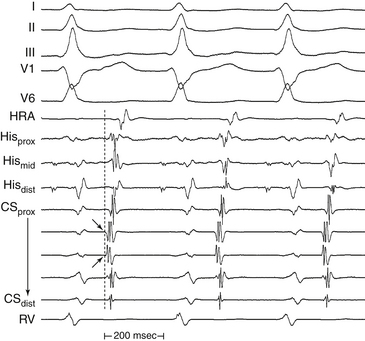
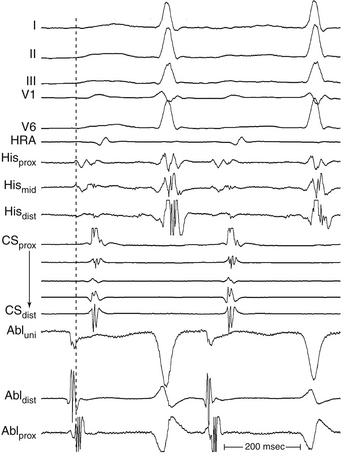
The goal of activation mapping of focal tachycardias (automatic, triggered activity, or microreentrant) is identifying the site of origin, defined as the site with the earliest presystolic bipolar recording in which the distal electrode shows the earliest intrinsic deflection and QS unipolar electrogram configuration (Figs. 5-8 and 5-9). Local activation at the site of origin precedes the onset of the tachycardia complex on the surface ECG by an average of 10 to 40 milliseconds. Earlier electrograms occurring in mid-diastole, as in the setting of macroreentrant tachycardias, are not expected and do not constitute a target for mapping.1
Endocardial activation mapping of focal tachycardias can trace the origin of activation to a specific area, from which it spreads centrifugally. There is generally an electrically silent period in the tachycardia cycle length (CL) that is reflected on the surface ECG by an isoelectric line between tachycardia complexes. Intracardiac mapping shows significant portions of the tachycardia CL without recorded electrical activity, even when recording from the entire cardiac chamber of tachycardia origin. However, in the presence of complex intramyocardial conduction disturbances, activation during focal tachycardias can extend over a large proportion of the tachycardia CL, and conduction spread can follow circular patterns suggestive of macroreentrant activation.2,4
Technique of Activation Mapping of Focal Tachycardias
Initially, one should seek the general region of the origin of the tachycardia as indicated by the surface ECG. In the EP laboratory, additional data can be obtained by placing a limited number of catheters within the heart in addition to the mapping catheter or catheters; these catheters are frequently placed at the right ventricular apex, His bundle region, high RA, and CS. During initial arrhythmia evaluation, recording from this limited number of sites allows a rough estimation of the site of interest. Mapping simultaneously from as many sites as possible greatly enhances the precision, detail, and speed of identifying regions of interest.1
Local activation time is then determined from the filtered (30 to 300 Hz) bipolar signal recorded from the distal electrode pair on the mapping catheter; this time is determined and compared with the timing reference (fiducial point). The distal pole of the mapping catheter should be used for mapping the earliest activation site because it is the pole through which RF energy is delivered. Activation times are generally measured from the onset of the first rapid deflection of the bipolar electrogram to the onset of the tachycardia complex on the surface ECG or surrogate marker (see Fig. 5-6). Using the onset (rather than the peak or nadir) of a local bipolar electrogram is preferable because it is easier to determine reproducibly, especially when measuring heavily fractionated, low-amplitude local electrograms.4
Once the site with the earliest bipolar signal is identified, the unipolar signal from the distal ablation electrode should be used to supplement bipolar mapping.2 The unfiltered (0.05 to 300 Hz) unipolar signal morphology should show a monophasic QS complex with a rapid negative deflection if the site was at the origin of impulse formation (see Figs. 5-8 and 5-9). However, the size of the area with a QS complex can be larger than the tachycardia focus, exceeding 1 cm in diameter. Thus, a QS complex should not be the only mapping finding used to guide ablation. Successful ablation is unusual, however, at sites with an RS complex on the unipolar recording, because these are generally distant from the focus (see Fig. 5-2). Concordance of the timing of the onset of the bipolar electrogram with that of the filtered or unfiltered unipolar electrogram (with the rapid downslope of the S wave of the unipolar QS complex coinciding with the initial peak of the bipolar signal) helps ensure that the tip electrode, which is the ablation electrode, is responsible for the early component of the bipolar electrogram. The presence of ST elevation on the unipolar recording and the ability to capture the site with unipolar pacing are used to indicate good electrode-tissue contact.4
Mapping Macroreentrant Tachycardias
The main goal of activation mapping of macroreentrant tachycardias (e.g., post-MI VT, macroreentrant AT) is identification of the isthmus critical for the macroreentrant circuit.8 The site of origin of a tachycardia is the source of electrical activity producing the tachycardia complex. Although this is a discrete site of impulse formation in focal rhythms, during macroreentry it represents the exit site from the diastolic pathway (i.e., from the critical isthmus of the reentrant circuit) to the myocardium that gives rise to the ECG deflection. During macroreentry, an isthmus is defined as a corridor of conductive myocardial tissue bounded by nonconductive tissue (barriers) through which the depolarization wavefront must propagate to perpetuate the tachycardia. These barriers can be scar areas or naturally occurring anatomical or functional (present only during tachycardia, but not in sinus rhythm) obstacles. The earliest presystolic electrogram closest to mid-diastole is the most commonly used definition for the site of origin of the reentrant circuit. However, recording continuous diastolic activity or bridging of diastole at adjacent sites, or both, or mapping a discrete diastolic pathway is more specific. Therefore, the goal of activation mapping during macroreentry is finding the site or sites with continuous activity spanning diastole or with an isolated mid-diastolic potential. Unlike focal tachycardias, a presystolic electrogram preceding the tachycardia complex by 10 to 40 milliseconds is not adequate in defining the site of origin of a macroreentrant tachycardia (Figs. 5-10 and 5-11; see also Fig. 5-7).2,4

However, identification of critical isthmuses is often challenging. The abnormal area of scarring, where the isthmus is located, is frequently large and contains false isthmuses (bystanders) that confound mapping. Additionally, multiple potential reentry circuits can be present, giving rise to multiple different tachycardias in a single patient. Furthermore, in abnormal regions such as infarct scars, the tissue beneath the recording electrode can be small relative to the surrounding myocardium outside the scar; thus, a large far-field signal can obscure the small local potential. For this reason, despite the limitations of bipolar recordings, these recordings are preferred in scar-related VTs because the noise is removed and high-frequency components are more accurately seen. Unipolar recordings are usually of little help when mapping arrhythmias associated with regions of scar, unless the recordings are filtered to remove far-field signal. Much of the far-field signal in a unipolar recording consists of lower frequencies than the signal generated by local depolarization because the high-frequency content of a signal diminishes more rapidly with distance from the source than the low-frequency content. Therefore, high-pass filtering of unipolar signals (at 30 or 100 Hz) is generally used when mapping scar-related arrhythmias to reduce the far-field signal and improve detection of lower amplitude local signals from abnormal regions.1
Although activation mapping alone is usually inadequate for defining the critical isthmus of a macroreentrant tachycardia, it can help guide other mapping modalities (e.g., entrainment or pace mapping, or both) to the approximate region of the isthmus.4,8
Continuous Activity
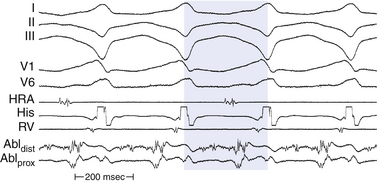
Theoretically, if reentry were the mechanism of the tachycardia, electrical activity should occur throughout the tachycardia cycle. For example, in macroreentrant AT, the recorded electrical activity at different locations in the atrium should span the tachycardia CL (see Fig. 5-10).
For macroreentrant VT, conduction during diastole is extremely slow and is in a small area so that it is not recorded on the surface ECG. The QRS complex is caused by propagation of the wavefront from the exit of the circuit from that isthmus to the surrounding myocardium. After leaving the exit of the isthmus, the circulating wavefront propagates through a broad path (loop) along the border of the scar, back to the entrance of the isthmus (see Fig. 5-7).8 Continuous diastolic activity is likely to be recorded only if the bipolar pair records a small circuit; if a large circuit is recorded (i.e., the reentrant circuit is larger than the recording area of the catheter, the catheter is not covering the entire circuit, or both), nonholodiastolic activity will be recorded. In such circuits, repositioning of the catheter to other sites may allow visualization of what is termed bridging of diastole; electrical activity in these adjacent sites spans diastole.2,4
All areas from which diastolic activity is recorded are not necessarily part of the reentrant circuit. Such sites can reflect late activation and may not be related to the tachycardia site of origin. Analysis of the response of these electrograms to spontaneous or induced changes in tachycardia CL is critical in deciding their relationship to the tachycardia mechanism. Additionally, electrical signals that come and go throughout diastole should not be considered continuous (Fig. 5-12). For continuous activity to be consistent with reentry, it must be demonstrated that such electrical activity is required for initiation and maintenance of the tachycardia, so that termination of the continuous activity, either spontaneously or following stimulation, without affecting the tachycardia, would exclude such continuous activity as requisite for sustaining the tachycardia. It is also important to verify that an electrogram that extends throughout diastole is not just a broad electrogram whose duration equals the tachycardia CL. This can be achieved by analyzing the local electrogram during pacing at a CL comparable to tachycardia CL; if pacing produces continuous diastolic activity in the absence of tachycardia, the continuous electrogram has no mechanistic significance. Furthermore, the continuous activity should be recorded from a circumscribed area, and motion artifact should be excluded.4,8
Mid-Diastolic Activity
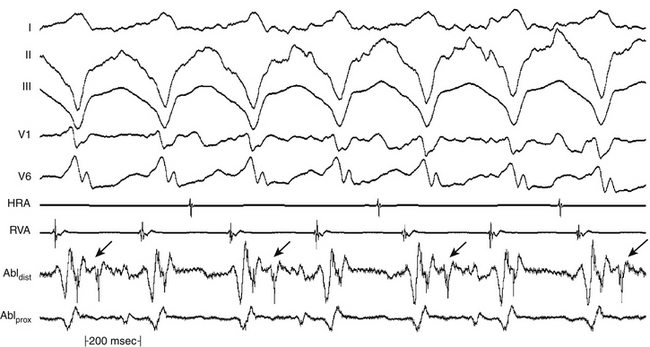
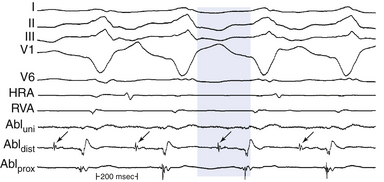
An isolated mid-diastolic potential is defined as a low-amplitude, high-frequency diastolic potential separated from the preceding and subsequent electrograms by an isoelectric segment (Fig. 5-13). Sometimes, these discrete potentials provide information that defines a diastolic pathway, which is believed to be generated from a narrow isthmus of conduction critical to the reentrant circuit. Localization of this pathway is critical for guiding catheter-based ablation.8
Detailed mapping usually reveals more than one site of presystolic activity, and mid-diastolic potentials can be recorded from a bystander site attached to the isthmus. Therefore, regardless of where in diastole the presystolic electrogram occurs (early, middle, or late), its position and appearance on initiation of the tachycardia, although necessary, does not confirm its relevance to the tachycardia mechanism. One must always confirm that the electrogram is required to maintain, and cannot be dissociated from, the tachycardia.8 Thus, during spontaneous changes in the tachycardia CL or those produced by programmed stimulation, the electrogram, regardless of its position in diastole, should show a fixed relationship with the subsequent tachycardia complex (and not the preceding one). Very early diastolic potentials, in the first half of diastole, can represent an area of slow conduction at the entrance of a protected isthmus. These potentials remain fixed to the prior tachycardia complex (exit site from the isthmus), and a delay between this complex and the subsequent tachycardia complex would reflect delay in entering or propagating through the protected diastolic pathway.4
Entrainment Mapping
Fundamental Concepts
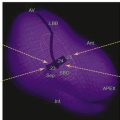
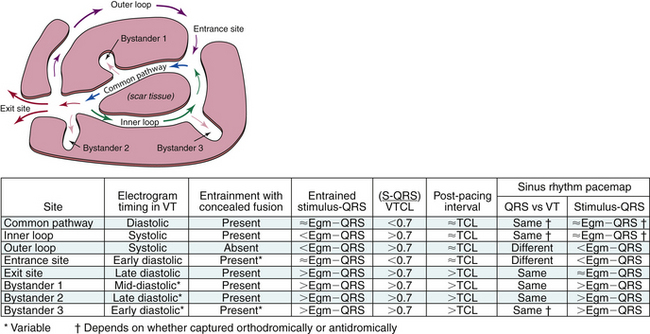
To help understand the concept of entrainment, a hypothetical reentrant circuit is shown in Figure 5-14. This reentrant circuit has several components—a common pathway, an exit site, an outer loop, an inner loop, an entry site, and bystander sites. The reentrant wavefront propagates through the common pathway (protected critical isthmus) during electrical diastole. Because this zone is usually composed of a small amount of myocardium and is bordered by anatomical or functional barriers preventing spread of the electrical signal except in the orthodromic direction, propagation of the wavefront in the protected isthmus is electrocardiographically silent. The exit site is the site at which the reentrant wavefront exits the protected isthmus to start activation of the rest of the myocardium, including the outer loop. Activation of the exit site corresponds to the onset of the tachycardia complex on the surface ECG. The outer loop is the path through which the reentrant wavefront propagates while at the same time activating the rest of the myocardium. Activation of the outer loop corresponds to electrical systole (P wave during AT and QRS during VT) on the surface ECG. An inner loop can serve as an integral part of the reentrant circuit or function as a bystander pathway. If conduction through the inner loop is slower than conduction from the exit to entrance sites (through the outer loop), the inner loop will serve as a bystander, and the outer loop will be the dominant. If conduction through the inner loop is faster than conduction through the outer loop, it will form an integral component of the reentrant circuit. The entry site is where the reentrant wavefront enters the critical isthmus. Bystander sites are sites that are activated by the reentrant wavefront but are not an essential part of the reentrant circuit. These sites can be remote, adjacent, or attached to the circuit. Elimination of these sites does not terminate reentry.4,8
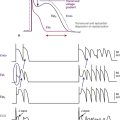
Understanding the concepts associated with resetting is critical to understanding entrainment. When a premature stimulus is delivered to sites remote from the reentrant circuit, it can interact with the circuit in different ways. When the stimulus is late-coupled, it can reach the circuit after it has just been activated by the reentrant wavefront. Consequently, although the extrastimulus may have resulted in activation of part of the myocardium, it fails to affect the reentrant circuit, and the reentrant wavefront continues to propagate in the critical isthmus and through the exit site to produce the next tachycardia complex on time. To reset reentrant tachycardia, the paced wavefront must reach the reentrant circuit (entry site, critical isthmus, or both), encounter excitable tissue within the circuit (i.e., enter the excitable gap of the reentrant circuit), collide in the antidromic (retrograde) direction with the previous tachycardia complex, and propagate in the orthodromic (anterograde) direction through the same tachycardia reentrant path (critical isthmus) to exit at an earlier than expected time and perpetuate the tachycardia (Fig. 5-15). If the extrastimulus encounters fully excitable tissue, as commonly occurs in reentrant tachycardias with large excitable gaps, the tachycardia is advanced by the extent that the paced wavefront arrives at the entrance site prematurely. If the tissue is partially excitable, as can occur in reentrant tachycardias with small or partially excitable gaps, or even in circuits with large excitable gaps when the extrastimulus is very premature, the paced wavefront will encounter some conduction delay in the orthodromic direction within the circuit. Consequently, the degree of advancement of the next tachycardia complex depends on both the degree of prematurity of the extrastimulus and the degree of slowing of its conduction within the circuit. Therefore, the reset tachycardia complex may be early, on time, or later than expected.4,8
Termination of the tachycardia occurs when the extrastimulus collides with the preceding tachycardia impulse antidromically and blocks in the reentrant circuit orthodromically. This occurs when the premature impulse enters the reentrant circuit early enough in the relative refractory period, because it fails to propagate in the anterograde direction, given that it encounters absolutely refractory tissue (see Fig. 5-15). In the retrograde direction, it encounters increasingly recovered tissue and is able to propagate until it meets the circulating wavefront and terminates the arrhythmia.8
Entrainment is the continuous resetting of a reentrant circuit by a train of capturing stimuli. However, following the first stimulus of the pacing train that penetrates and resets the reentrant circuit, the subsequent stimuli interact with the reset circuit, which has an abbreviated excitable gap. The first entrained complex results in retrograde collision between the stimulated and tachycardia wavefronts, whereas in all subsequent beats, the collision occurs between the currently stimulated wavefront and that stimulated previously. Depending on the degree that the excitable gap is preexcited by that first resetting stimulus, subsequent stimuli fall on fully or partially excitable tissue. Entrainment is said to be present when two consecutive extrastimuli conduct orthodromically through the circuit with the same conduction time while colliding antidromically with the preceding paced wavefront.4
Entrainment of reentrant tachycardias by external stimuli was originally defined in the clinical setting as an increase in the rate of a tachycardia to a faster pacing rate, with resumption of the intrinsic rate of the tachycardia on either abrupt cessation of pacing or slowing of pacing beyond the intrinsic rate of the tachycardia, and it was taken to indicate an underlying reentrant mechanism. The ability to entrain a tachycardia also establishes that the reentrant circuit contains an excitable gap.4,8
Entrainment does not require that the pacing site be located in the reentrant circuit. The closer the pacing site is to the circuit, however, the less premature a single stimulus needs to be to reach the circuit and, with pacing trains, the fewer stimuli will be required before a stimulated wavefront reaches the reentrant circuit without being extinguished by collision with a wave emerging from the circuit. Overdrive pacing at relatively long CLs (i.e., 10 to 30 milliseconds shorter than the tachycardia CL) can almost always entrain reentrant tachycardias. However, the number of pacing stimuli required to entrain the reentrant circuit depends on the tachycardia CL, the duration of the excitable gap of the tachycardia, refractoriness at the pacing site, and the conduction time from the stimulation site to the reentrant circuit.8
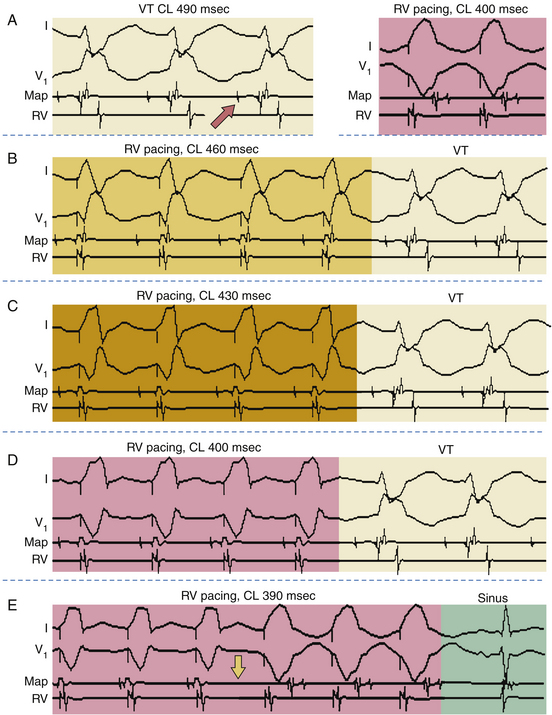
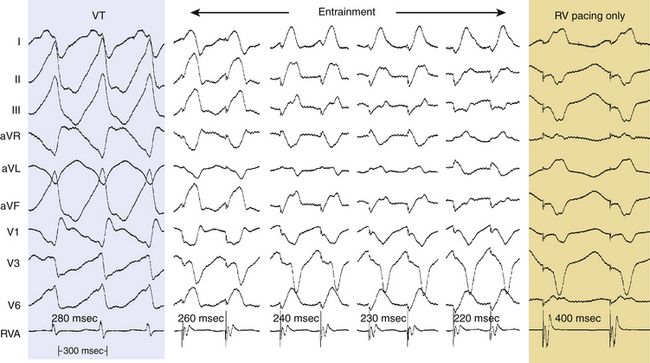
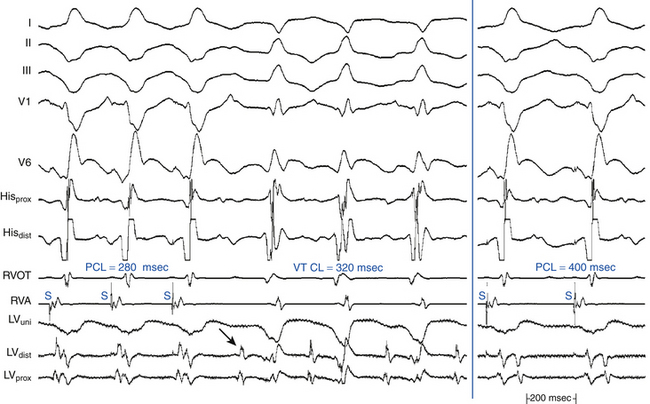
During constant-rate pacing, entrainment of a reentrant tachycardia results in the activation of all myocardial tissue responsible for maintaining the tachycardia at the pacing CL, with the resumption of the intrinsic tachycardia morphology and rate after cessation of pacing. Unfortunately, it is almost impossible to document the acceleration of all tissue responsible for maintaining the reentrant circuit to the pacing CL. Therefore, several surface ECG and intracardiac electrogram criteria have been proposed for establishing the presence of entrainment (see Fig. 5-15): (1) fixed fusion of the paced complexes at a constant pacing rate; (2) progressive fusion or different degrees of fusion at different pacing rates (i.e., the surface ECG and intracardiac morphology progressively look more like the purely paced configuration and less like the pure tachycardia beat in the course of pacing at progressively shorter pacing CLs; Fig. 5-16); and (3) resumption of the same tachycardia morphology following cessation of pacing, with the first post-pacing complex displaying no fusion but occurring at a return cycle equal to the pacing CL.8
Fusion During Entrainment
A stimulated impulse is said to be fused when its morphology is a hybrid between that of a fully paced complex and a tachycardia complex. Fusion can be observed on the surface ECG, intracardiac recordings, or both. For fusion to be observed on the surface ECG, the tachycardia and stimulated wavefronts must collide within the reentrant circuit after the tachycardia wavefront has exited from the isthmus. This requires the paced wavefront to have access to an entrance site of the reentrant circuit that is anatomically distinct from the exit site. If the antidromically stimulated wavefront penetrates the reentrant circuit and collides with the tachycardia wavefront (or the previously stimulated orthodromic wavefront) before the point at which the tachycardia wavefront would be exiting to the mass of the myocardium, then no fusion will be evident on the surface ECG, and the surface ECG will appear entirely paced.4
Once stability in collision sites of the antidromic and orthodromic wavefronts occurs, constant surface ECG fusion is achieved. Fixed fusion in the surface ECG is said to be present during entrainment if one of the following criteria is met: (1) the surface ECG complex is of constant morphology, representing a hybrid of the complex morphology of the tachycardia and that observed during pacing during normal sinus rhythm (NSR; see Figs. 5-15 and 5-16), or (2) the onset of the surface ECG complex precedes the pacing stimulus artifact of each paced beat by a fixed interval (see Figs. 12-9 and 13-5). It is worth noting that to be certain a hybrid or blended ECG complex is present, one must know the configurations of both pure tachycardia and pure pacing (Fig. 5-17; see also Figs. 5-15 and 5-16).
Focal tachycardias (automatic, triggered activity, or microreentrant) cannot manifest fixed fusion during overdrive pacing. However, overdrive pacing of tachycardia of any mechanism can result in a certain degree of fusion, especially when the pacing CL is only slightly shorter than the tachycardia CL. Such fusion, however, is unstable during the same pacing drive at a constant CL, because pacing stimuli fall on a progressively earlier portion of the tachycardia cycle and produce progressively less fusion and more fully paced morphology. Such phenomena should be distinguished from entrainment, and sometimes this distinction requires pacing for long intervals to demonstrate variable degrees of fusion. Moreover, overdrive pacing frequently results in suppression (automatic) or acceleration (triggered activity) of focal tachycardias, rather than resumption of the original tachycardia with an unchanged tachycardia CL.4
Varying degrees of fusion at different pacing rates are caused by a progressive increase in the amount of myocardium activated by the antidromic wavefront at progressively shorter pacing CLs (see Figs. 5-15 and 5-16). At slower pacing CLs, a larger amount of the myocardium is activated by the orthodromic wavefront exiting from the reentrant circuit prior to its intracardiac collision, with the subsequent antidromic wavefront incoming from the pacing site. With a faster pacing rate, more myocardium is antidromically activated because the orthodromic wavefront must continue to traverse the zone of slow conduction within the reentrant circuit, thus creating progressive fusion with changing pacing CLs. In the extreme situation, the antidromic wavefront can capture the exit site of the reentrant circuit and produce a fully paced complex. Once this occurs, pacing at shorter pacing CLs does not cause further progressive fusion, although entrainment is still present. As noted, progressive fusion at decreasing pacing CLs during entrainment of tachycardia excludes the possibility of automaticity or triggered activity as the mechanism of the tachycardia. In those cases, overdrive pacing would yield solely the morphology of the pacing stimulus for a nonprotected focus or would yield varying (not progressive) degrees of fusion for a protected focus with entrance block. Of note, a microreentrant circuit with entrance block could also yield variable fusion during overdrive pacing; thus, this finding would not exclude reentry as the underlying mechanism.4,8
On cessation of pacing, the last paced wavefront traverses the protected isthmus and exits the circuit to produce a normal (nonfused) tachycardia complex at the pacing CL, because there is no paced antidromic wavefront with which to fuse. The wavefront continues around the reentrant circuit to maintain the tachycardia. Constant fusion of the surface ECG can occur, however, without the first nonpaced beat occurring at the pacing CL. When surface ECG fusion occurs, the initial portion of the ECG complex usually reflects activation of the myocardium by the paced wavefront, whereas the terminal portion represents the orthodromically activated wavefront exiting from the tachycardia circuit. The point at which this wavefront exits the circuit can be late in the surface ECG complex. The degree to which the first ECG post-pacing interval (PPI) exceeds the pacing CL is primarily a reflection of the time from the onset of the paced surface ECG complex to the exit of the orthodromic wavefront from the reentrant circuit. This represents the period of time during which the myocardium is depolarized by the stimulated wavefront before the activation of any portion of the myocardium by the tachycardia wavefront. Thus, constant fusion occurring in the absence of the first ECG PPI being equal to the pacing CL can be a valid manifestation of entrainment. In this situation, appropriate placement of intracardiac electrodes demonstrates orthodromic entrainment of some intracardiac recording sites occurring at the pacing CL, even though the last entrained ECG complex occurred at an interval longer than the pacing CL. Alternatively, decremental conduction within the reentrant circuit can explain a first PPI that exceeds the pacing CL.4
Entrainment With Manifest Fusion
Entrainment with manifest fusion demonstrates surface ECG evidence of constant fusion at a constant pacing rate and progressive fusion with incremental-rate pacing (see Fig. 5-16).8 When entrainment is manifest, the last captured wave is entrained at the pacing CL but does not demonstrate fusion.9
Entrainment With Inapparent, Local, or Intracardiac Fusion
Entrainment with inapparent fusion (also referred to as local or intracardiac fusion) is said to be present when a fully paced morphology with no ECG fusion results, even when the tachycardia impulse exits the reentrant circuit (orthodromic activation of the presystolic electrogram present). Fusion is limited to a small area and does not produce surface ECG fusion, and only intracardiac (local) fusion is recognized (Fig. 5-18; see also Fig. 13-5).8 Local fusion can occur only when the presystolic electrogram is activated orthodromically. Collision with the last paced impulse must occur distal to the presystolic electrogram, either at the exit from the circuit or outside the circuit. In such cases, the return cycle measured at this local electrogram equals the pacing CL. Therefore, a stimulus delivered after the onset of the tachycardia complex on the surface ECG during entrainment always demonstrates local fusion. This is to be distinguished from entrainment with antidromic capture. As noted, when antidromic (retrograde) capture of the local presystolic electrogram occurs, the return cycle, even when measured at the site of the presystolic electrogram, exceeds the pacing CL.8,9
Entrainment with Antidromic Capture
Entrainment with antidromic capture should be distinguished from entrainment with local fusion. When pacing is performed at a CL significantly shorter than the tachycardia CL, the paced impulse can penetrate the circuit antidromically and retrogradely capture the presystolic electrogram so that no exit from the tachycardia circuit is possible. When pacing is stopped, the impulse that conducts antidromically also conducts orthodromically to reset the reentrant circuit with orthodromic activation of the presystolic electrogram. When antidromic (retrograde) capture of the local presystolic electrogram occurs, the return cycle, even when measured at the site of the presystolic electrogram, exceeds the pacing CL by the difference in time from when the electrogram is activated retrogradely (i.e., preexcited antidromically) and when it would have been activated orthodromically.4,8,9
Entrainment with Concealed Fusion
Entrainment with concealed fusion (sometimes also referred to as concealed entrainment or exact entrainment) is defined as entrainment with orthodromic capture and a surface ECG complex (or intracardiac activation sequence, or both) identical to that of the tachycardia (see Figs. 12-9 and 13-5). Entrainment with concealed fusion suggests that the pacing site is within a protected isthmus inside or outside, but attached to, the reentrant circuit (see Fig. 5-14). In this situation, transient entrainment is achieved when the orthodromically directed stimulated wavefront resets the tachycardia, but the antidromically directed stimulated wavefront collides with the tachycardia wavefront in or near the reentry circuit and fails to exit the slow conduction zone. Only tissue near the pacing site within the critical isthmus is antidromically activated; hence, there is no evidence of fusion. Compared with the intrinsic tachycardia, this antidromic capture may result in earlier intracardiac recordings from sites located adjacent to the pacing region. The morphological appearance of the ECG, however, is the same during entrainment as during the tachycardia. Entrainment with concealed fusion can occur by pacing from bystander pathways, such as a blind alley, alternate pathway, or inner loop, that are not critical to the maintenance of reentry. In this case, activation propagates from the main circuit loop but is constrained by block lines having the shape of a cul-de-sac; ablation there does not terminate reentry (unless it is fortuitously close to a critical portion of the circuit).4,8,9
Post-Pacing Interval
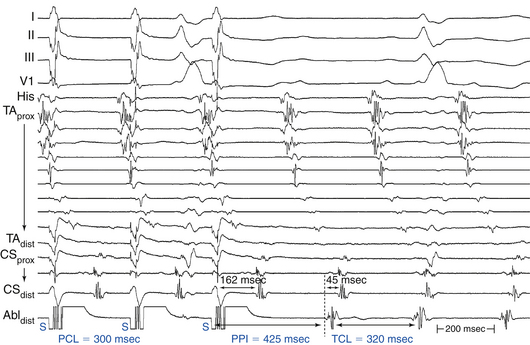
The PPI is the time interval from the last pacing stimulus that entrained the tachycardia to the next nonpaced recorded electrogram at the pacing site (Fig. 5-19). During entrainment from sites within the reentrant circuit, the orthodromic wavefront from the last stimulus propagates through the reentry circuit and returns to the pacing site, following the same path as the circulating reentry wavefronts. The conduction time required is the revolution time through the circuit. Thus, the PPI (measured from the pacing site recording) should be equal (within 30 milliseconds) to the tachycardia CL (given that conduction velocities and the reentrant path did not change during pacing; see Fig. 5-14). At sites remote from the circuit, stimulated wavefronts propagate to the circuit, then through the circuit, and finally back to the pacing site. Thus, the PPI should equal the tachycardia CL plus the time required for the stimulus to propagate from the pacing site to the tachycardia circuit and back. The greater the difference is between the PPI and the tachycardia CL (PPI – tachycardia CL), the longer the conduction time will be between the pacing site and reentry circuit, and the greater the physical distance will be between the pacing site and the circuit (see Figs. 12-9 and 13-5).9
Conduction Time from the Pacing Site to the Circuit Exit Site
During entrainment of reentrant tachycardia, the interval between the pacing stimulus and the onset of the tachycardia complex on the surface ECG (QRS or P wave) reflects the conduction time from the pacing site to the exit of the reentrant circuit (stimulus-exit interval), regardless of whether the pacing site is inside or outside the reentrant circuit, because activation starts at the pacing site and propagates in sequence to the circuit exit site. On the other hand, during tachycardia, the interval between the local electrogram at a given site and circuit exit (electrogram-exit interval) can reflect the true conduction time between those two sites if they are activated in sequence (as occurs when that particular site is located within the reentrant pathway), or it may be shorter than the true conduction time if those two sites are activated in parallel (which occurs when that particular site is located outside the reentrant circuit) (see Figs. 5-14 and 5-19).8
However, the electrogram-exit interval may not be exactly equal to the stimulus-exit interval at sites within the reentrant circuit. Several factors can explain this. One potential factor is decremental conduction properties of the zone of slow conduction that produce lengthening of the stimulus-exit interval during pacing; however, this appears to occur rarely. Therefore, the stimulus-exit interval should be measured during pacing at the slower CL that reliably entrains the tachycardia. Moreover, stimulus latency in an area of diseased tissue can account for a delay in the stimulus-exit interval compared with the electrogram-QRS interval. Additionally, failure of the recording electrodes to detect low-amplitude depolarizations at the pacing site can account for a mismatch of the stimulus-exit and electrogram-exit intervals.8
Mapping Procedure
Before attempting to use entrainment methods for mapping, it is necessary to demonstrate that the tachycardia can be entrained, by providing strong evidence that it is caused by reentry rather than by triggered activity or automaticity. Potential ablation sites are sought by pacing at sites thought to be related to the reentrant circuit, based on other mapping modalities, such as activation mapping and pace mapping. The areas of slow conduction can be identified by endocardial mapping revealing fractionated electrograms, mid-diastolic electrograms, or long delays between the pacing stimulus and the captured surface ECG complex (see Fig. 5-14). These sites are then targeted by entrainment mapping. However, proof of entrainment is best obtained by pacing from sites remote from the circuit, which most readily demonstrate fusion.9
Entrainment mapping can be reliably carried out only if one can record and stimulate from the same area (e.g., for 2-5-2-mm spacing catheters, record from the second and fourth poles and stimulate from the first and third poles). Pacing is usually started at a CL just shorter (10 to 20 milliseconds) than the tachycardia CL. Pacing should be continued for a long enough duration to allow for entrainment; short pacing trains are usually not helpful. Pacing is then repeated at progressively shorter pacing CLs.8
After cessation of each pacing drive, the presence of entrainment should be verified by demonstrating the presence of fixed fusion of the paced complexes at a given pacing CL, progressive fusion at faster pacing CLs, and resumption of the same tachycardia morphology following cessation of pacing with a nonfused complex at a return cycle equal to the pacing CL. The mere acceleration of the tachycardia to the pacing rate and then resumption of the original tachycardia after cessation of pacing do not establish the presence of entrainment. Evaluation of the PPI or other criteria is meaningless when the presence of true entrainment has not been established. Moreover, it is important to verify the absence of termination and reinitiation of the tachycardia during the same pacing drive.4
Once the presence of entrainment is verified, several criteria can be used to indicate the relation of the pacing site to the reentrant circuit. The first entrainment criterion to be sought is concealed fusion. Entrainment with concealed fusion indicates that the pacing site is in a protected isthmus located within or attached to the reentrant circuit. Whether this protected isthmus is crucial to the reentrant circuit or is just a bystander site needs to be verified by other criteria, mainly comparing the PPI with the tachycardia CL and comparing the stimulus-exit interval with the electrogram-exit interval. Features of entrainment when pacing from different sites are listed in Table 5-1 (see also Figs. 5-14, 5-18, and 5-19).9,10
| Pacing from Sites Outside the Reentrant Circuit |
CL = cycle length; PPI = post-pacing interval.
A graphical representation of entrainment mapping can be constructed by plotting the values of the difference between the PPI and the tachycardia CL [PPI–tachycardia CL] on an electroanatomical mapping system (CARTO, Biosense Webster, Inc., Diamond Bar, Calif.; or NavX, St. Jude Medical, Inc., St. Paul, Minn.) to generate color-coded three-dimensional entrainment maps (see Chap. 6 for discussion).11,12
Clinical Implications
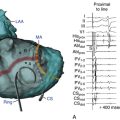
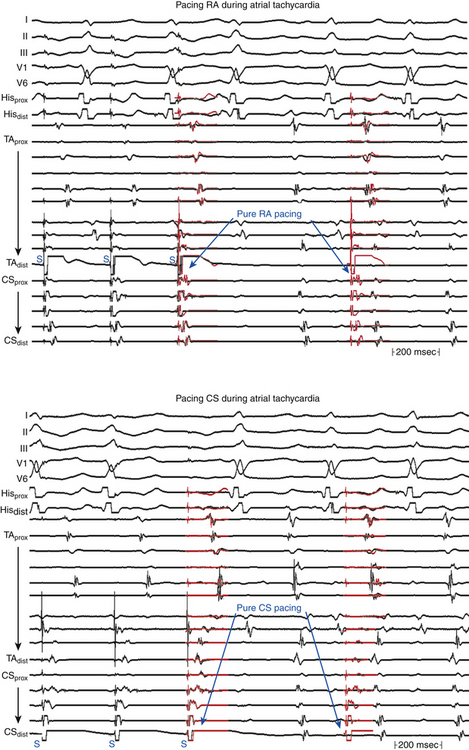
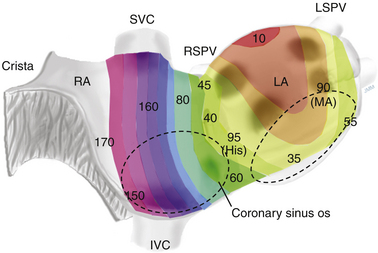
Entrainment mapping is the gold standard for ablation of reentrant circuits generating hemodynamically well-tolerated tachycardias. Achievement of entrainment of tachycardia establishes a reentrant mechanism of that tachycardia and excludes triggered activity and abnormal automaticity as potential mechanisms. Entrainment may also be used to estimate how far the reentrant circuit is from the pacing site qualitatively. For example, entrainment of an AT from multiple sites in the RA with a PPI significantly longer than the tachycardia CL can help identify a left atrial origin of the AT before attempting LA access (see Fig. 13-5). In addition, pacing at multiple sites and measuring the difference between the PPI and tachycardia CL provide an indication of how far or near the pacing site is from the circuit (Fig. 5-20).4,8,9
Entrainment mapping has been useful to identify the critical isthmus in patients with macroreentrant VT or AT. Focal ablation of all sites defined as within the reentrant circuit may not result in a cure of reentrant tachycardia. Cure requires ablation of an isthmus bordered by barriers on either side, which is critical to the reentrant circuit. Entrainment mapping helps identify this critical part of the reentrant circuit. Sites demonstrating entrainment with concealed fusion are initially sought. Once these sites are identified, their relationship to the reentrant circuit is verified using the PPI or stimulus-exit interval (see earlier). Sites demonstrating concealed fusion, a PPI equal to the tachycardia CL (±30 milliseconds), and a stimulus-exit interval equal to the electrogram-exit interval (±20 milliseconds) have a very high positive predictive value for successful ablation.4,9,10
Limitations
One of the limitations of entrainment mapping is the requirement of the presence of sustained, hemodynamically well-tolerated tachycardia of stable morphology and CL. Furthermore, attempts at entrainment can result in termination, acceleration, or transformation of the index tachycardia into a different one, thus making further mapping challenging. Bipolar pacing at relatively high stimulus strengths used during entrainment can result in capture of an area larger than the local area. Additionally, errors can be introduced by the decremental conduction properties of the zone of slow conduction that may cause a rate-dependent lengthening of the PPI. This is more likely to occur at rapid pacing rates.4,8
1. There are differences, albeit slight, of the area from which the second and fourth electrodes record as compared with the first and third. When the local electrogram is not recorded from the same pair of electrodes used for pacing, errors can be introduced when comparing the PPI with the tachycardia CL.
2. The bipolar pacing technique has the potential for anodal contribution to local capture.
3. The total area captured by the pacing stimulus can exceed the local area, especially when high currents (more than 10 mA) are required for stimulation.
4. The pacing artifact can obscure the early part of the captured local electrogram. In such a case, a comparable component of the electrogram can be used to measure the PPI.
5. Far-field electrical signals generated by depolarization of adjacent tissue can cause false-positive entrainment criteria at some sites.4,8
Pace Mapping
Fundamental Concepts
Pace mapping is a technique designed to help locate tachycardia sources by pacing at different endocardial sites to reproduce the ECG morphology of the tachycardia. Pace mapping is based on the principle that pacing from the site of origin of a focal tachycardia at a pacing CL similar to the tachycardia CL results in the same activation sequence as that during the tachycardia.4
When myocardial activation originates from a point-like source, such as during focal tachycardia or during pacing from an electrode catheter, ECG configuration of the resultant tachycardia or paced complex (QRS or P wave) is determined by the sequence of myocardial activation, which is largely determined by the initial site of myocardial depolarization, assuming no conduction abnormalities from that site. Analysis of specific surface ECG configurations in multiple leads allows estimation of the pacing site location to within several square centimeters, and comparing the paced complex configuration with that of tachycardia can be used to locate the arrhythmia focus (Fig. 5-21).13,14
Interpretation of Pace Mapping
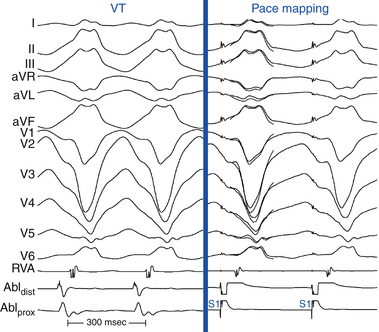
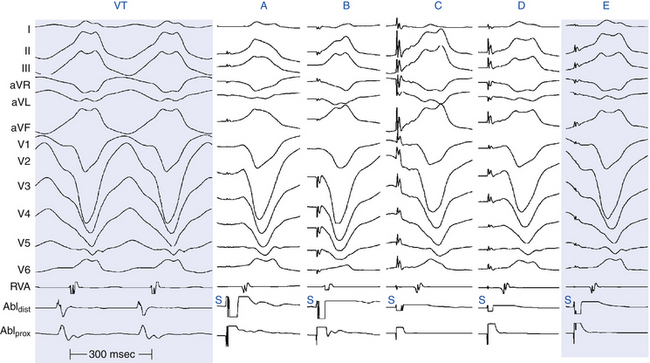
Pace maps with identical or nearly identical matches of tachycardia morphology in all 12 surface ECG leads can be indicative of the site of origin of the tachycardia (Fig. 5-22). Differences in the morphology between pacing and spontaneous tachycardia in a single lead can be critical. For VT, pacing at a site 5 mm from the index pacing site results in minor differences in QRS configuration (e.g., notching, new small component, change in amplitude of individual component, or overall change in QRS shape) in at least one lead in most patients. In contrast, if only major changes in QRS morphology are considered, pacing sites separated by as much as 15 mm can produce similar QRS morphologies.
Although qualitative comparison of the 12-lead ECG morphology between a pace map and clinical tachycardia is frequently performed, there are few objective criteria for quantifying the similarity between 2 12-lead ECG waveform morphologies. Such comparisons are frequently completely subjective or semiquantitative, such as a 10/12 lead match. Unsuccessful ablation can result, in part, from subjective differences in the opinion of a pace map match to the clinical tachycardia. Furthermore, criteria for comparing the similarity in 12-lead ECG waveforms from one laboratory with those of another or for describing such comparisons in the literature are lacking. Two waveform comparison metrics, the correlation coefficient (CORR) and the mean absolute deviation (MAD), have been evaluated to quantify the similarity of 12-lead ECG waveforms during VT and pace mapping objectively. It has been suggested that an automated objective interpretation can have some advantage to qualitative interpretation. Although CORR is more commonly used, MAD is more sensitive to differences in waveform amplitude. The most common human error is not appreciating subtle amplitude or precordial lead transition differences between the ECG patterns. It is important to note that such subtle differences in multiple leads can be reflected in a single quantitative number.
The MAD score grades 12-lead ECG waveform similarity as a single number ranging from 0% (identical) to 100% (completely different). A MAD score of up to 12% was 93% sensitive and 75% specific for a successful ablation site (see Fig. 23-11). It is not surprising that the MAD score is more sensitive than specific; characteristics other than a 12-lead ECG match are necessary for successful ablation, including catheter-tissue contact, catheter orientation, and tissue heating. MAD scores higher than 12%, and certainly higher than 15% (100% negative predictive value), suggest sufficient dissimilarity between the pace map and clinical tachycardia to dissuade ablation at that site. MAD scores of up to 12% should be considered an excellent match, and ablation at these sites is warranted if catheter contact and stability are adequate.
S-QRS Interval During Pace Mapping
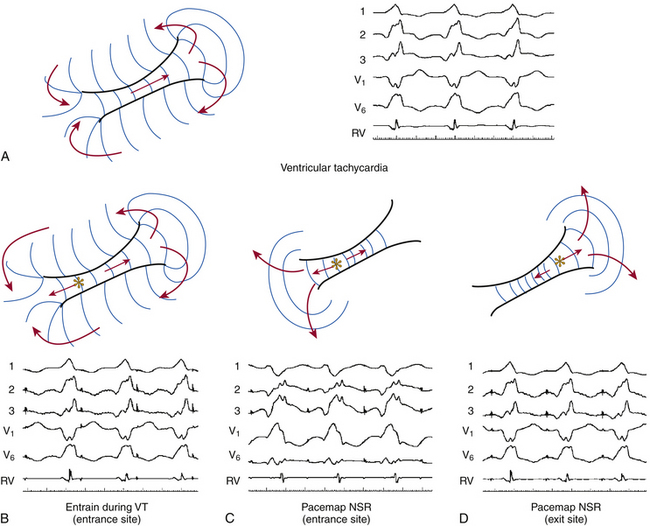
Ventricular pacing in normal myocardium is associated with an S-QRS interval shorter than 20 milliseconds. On the other hand, an S-QRS interval longer than 40 milliseconds is consistent with slow conduction from the pacing site and is typically associated with abnormal fractionated electrograms recorded from that site. Thus, pace mapping can provide a measure of slow conduction, as indicated by the S-QRS interval. For post-MI VTs, at sites at which the reentrant wavefront exits the scar, pace mapping is expected to produce a QRS configuration similar to that of the VT. Pace mapping at sites more proximally located in the isthmus should also produce a similar QRS complex, but with a longer S-QRS interval. The S-QRS interval lengthens progressively as the pacing site is moved along the isthmus, a finding consistent with pacing progressively farther from the exit. Therefore, parts of VT reentry circuit isthmuses can be traced during NSR by combining both the QRS morphology and the S-QRS delay from pace mapping in anatomical maps. This works well when pacing is performed during tachycardia, at which time wavefront propagation is constrained in one direction through a corridor bounded by barriers that can be anatomically or functionally determined. However, pace mapping at the same sites during sinus rhythm can yield different results because the barriers may not exist then, the preferential direction of propagation may not be the same as during tachycardia, or both. This is especially true for pacing at circuit entrance sites (Fig. 5-23). It is likely that pacing sites with long S-QRS delays are in an isthmus adjacent to regions of conduction block. However, this isthmus can be part of the reentrant circuit or a bystander.4
Mapping Procedure
Initially, the exact morphology of the tachycardia complex should be determined and used as a template for pace mapping. For VT, QRS morphology during the tachycardia should be inspected in all 12 surface ECG leads. For AT, determining the morphology of the P wave during the tachycardia can be challenging, and proper interpretation of discrete changes in P wave shape is limited by its low voltage and distortion or masking by the preceding ST segment and T wave. Therefore, the P wave during AT should be assessed using multiple ECG leads, in addition to the intracardiac electrogram activation sequence. Delivery of a vesicular extrastimulus (or a train of ventricular pacing) to advance ventricular activation and repolarization can allow careful distinction of the P wave onset and morphology. Using multiple intraatrial catheters (e.g., Halo and CS catheters) can provide more intracardiac atrial electrograms that are useful for comparing the paced and tachycardia atrial activation sequence.4
Clinical Implications
Pace mapping is typically used to confirm the results of activation mapping. It can be of great help, especially when the tachycardia is difficult to induce. The highest benefit of pace mapping has been found in focal tachycardias, especially in idiopathic VT.13
For macroreentrant VT, pace mapping remains at best a corroborative method of localizing the isthmus critical to the reentrant circuit. It can be used to focus initial mapping efforts to regions likely to contain the reentrant circuit exit or abnormal conduction, but it may not be sufficiently specific or sensitive to be the sole guide for ablation. Pace mapping can also be used in conjunction with substrate mapping when other mapping techniques are not feasible, so that it can provide information on where ablation can be directed. Pace mapping has advantages over activation mapping in that induction of VT is not required; thus, it allows identification of the site of origin when the induced VT is poorly tolerated or when VT is not inducible by EP techniques but the QRS morphology from a prior 12-lead ECG during VT is available.4
Limitations
An optimal spatial pace mapping resolution requires a short maximum distance between two points generating a similar ECG configuration. Usually, the spatial resolution of unipolar stimulation is 5 mm or less. Spatial resolution deteriorates with wide electrodes, bipolar stimulation, and pacing at pathological areas. Spatial resolution worsens with bipolar stimulation by inducing electrical capture at both electrodes with variable contribution of the proximal electrode (generally anode) to depolarization. Such changes in paced ECG morphology that are potentially induced by bipolar pacing can be minimized by low pacing outputs and a small interelectrode distance (5 mm or less).
Pace mapping during post-MI VT has several other limitations. Some areas of conduction block are not anatomically determined but can be functional. Therefore, pacing within the diastolic corridor of the VT circuit during NSR can generate a completely different QRS complex from that of the VT (see Fig. 5-23). Consequently, during pace mapping, a QRS configuration different from VT does not reliably indicate that the pacing site is distant from the reentry circuit. On the other hand, pacing during NSR from sites attached to the reentrant circuit but not part of the circuit can occasionally produce a QRS morphology identical to that of the VT. The reason is that the stimulated wavefront can be physiologically forced to follow the same route of activation as the VT as long as pacing is carried out between the entrance and exit of the protected isthmus. At best, a pace map that matches the VT would identify only the exit site to the normal myocardium, and this site can be distant from the critical sites of the circuit required for ablation.
1. Josephson M. Electrophysiologic investigation: technical aspects. In: Josephson M.E., editor. Clinical cardiac electrophysiology. ed 4. Philadelphia: Lippincott Williams & Wilkins; 2008:1-19.
2. Stevenson W.G., Soejima K. Recording techniques for clinical electrophysiology. J Cardiovasc Electrophysiol. 2005;16:1017-1022.
3. Sosa E., Scanavacca M. Epicardial mapping and ablation techniques to control ventricular tachycardia. J Cardiovasc Electrophysiol. 2005;16:449-452.
4. Markides V., Koa-Wing M., Peters N. Mapping and imaging. In: Zipes D.P., Jalife J., editors. Cardiac electrophysiology: from cell to bedside. ed 5. Philadelphia: Saunders; 2009:897-904.
5. Tedrow U., Stevenson W.G. Strategies for epicardial mapping and ablation of ventricular tachycardia. J Cardiovasc Electrophysiol. 2009;20:710-713.
6. d’Avila A. Epicardial catheter ablation of ventricular tachycardia. Heart Rhythm. 2008;5(Suppl):S73-S75.
7. Pak H.N., Hwang C., Lim H.E., et al. Hybrid epicardial and endocardial ablation of persistent or permanent atrial fibrillation: a new approach for difficult cases. J Cardiovasc Electrophysiol. 2007;18:917-923.
8. Josephson M.E. Recurrent ventricular tachycardia. In: Josephson M.E., editor. Clinical cardiac electrophysiology. ed 4. Philadelphia: Lippincott Williams & Wilkins; 2008:446-642.
9. Deo R., Berger R. The clinical utility of entrainment pacing. J Cardiovasc Electrophysiol. 2009;20:466-470.
10. Miyazaki H., Stevenson W.G., Stephenson K., et al. Entrainment mapping for rapid distinction of left and right atrial tachycardias. Heart Rhythm. 2006;3:516-523.
11. Esato M., Hindricks G., Sommer P., et al. Color-coded three-dimensional entrainment mapping for analysis and treatment of atrial macroreentrant tachycardia. Heart Rhythm. 2009;6:349-358.
12. Santucci P.A., Varma N., Cytron J., et al. Electroanatomic mapping of postpacing intervals clarifies the complete active circuit and variants in atrial flutter. Heart Rhythm. 2009;6:1586-1595.
13. Azegami K., Wilber D.J., Arruda M., et al. Spatial resolution of pacemapping and activation mapping in patients with idiopathic right ventricular outflow tract tachycardia. J Cardiovasc Electrophysiol. 2005;16:823-829.
14. Brunckhorst C.B., Delacretaz E., Soejima K., et al. Identification of the ventricular tachycardia isthmus after infarction by pace mapping. Circulation. 2004;110:652-659.