Flow Cytometry in Oncologic Diagnosis
• Fluorescently conjugated antibodies that are bound to cell-surface or intracellular proteins allow enumeration and detailed characterization of subsets of cells in heterogeneous mixtures.
• Fluorescent DNA-binding dyes allow determination of tumor ploidy and can assess cell-cycle characteristics of tumors.
Applications for Acute Leukemia
• Flow cytometry is used for lineage assignment and classification of leukemia.
• Certain phenotypes correlate with molecular abnormalities.
• Minimal residual disease detection is prognostic in both acute lymphoblastic leukemia and acute myeloid leukemia.
Applications for Lymphoma and Chronic Lymphoproliferative Disorders
• Flow cytometry is suitable for use with cell suspensions of tissue, fine-needle aspirates, fluids, and blood and marrow.
• Clonality of B-cell processes are readily detected by light-chain restriction assay.
• Many lymphoid disorders are defined by phenotypic profiles.
• Minimal residual disease assessment helps in the management of patients with chronic lymphocytic leukemia and myeloma.
• DNA ploidy and S-phase fraction can be detected.
• Prognostic significance is controversial, but measurement has value in certain tumors.
• Methodologic difficulties have contributed to lack of acceptance.
Fluorochromes and Fluorescence
Fluorochromes have spectral characteristics that allow them to absorb light of certain wavelengths and then to emit light at longer wavelengths. Emission, a specific characteristic of the compound, is not limited to a fixed wavelength but rather constitutes a spectrum, with variable numbers of photons emitted at different wavelengths. Different fluorochromes, including fluorescein isothiocyanate and phycoerythrin, as well as others, all have the capacity of absorbing light at 488 nm, but because they emit it at different wavelengths, it becomes possible to perform multicolor flow cytometry with a single laser emitting at 488 nm. Tandem conjugates, which covalently couple two fluorochrome molecules, allow light emitted by one molecule to be transferred to and excite the other; this process can greatly increase the number of colors that can be detected with a single laser. Additional dyes such as allophycocyanin, which emit longer wavelengths, cannot be excited by a 488 nm laser but require a second light source, most frequently one that emits light at 635 nm. The combination of new dyes, more tandem conjugates, and new instruments with even more lasers has made it possible to perform flow cytometry to detect more than a dozen colors; in the clinical laboratory today, instruments capable of detecting six to eight or even more colors are the norm, although many laboratories do not yet take advantage of these higher-order capabilities, in part because of the complexity associated with analyzing and quality controlling such complex data. However, 10-color flow cytometry has been adapted to routine clinical analysis.1
Applications of Flow Cytometry to Clinical Oncology
Acute Leukemia
Flow-cytometric immunophenotyping has become standard in the evaluation of new patients with acute leukemia. The most obvious role of flow cytometry is in distinguishing lymphoid from myeloid leukemia, but flow cytometry can help in the diagnosis and management of these patients in many ways (Box 15-1).
Lineage Assignment in Acute Leukemia
Phenotypic analysis of a bone marrow that is completely replaced by blasts is an almost elementary problem. Multiparameter flow cytometry, however, can dissect and categorize all populations in bone marrow, and most important, it can distinguish leukemic cells from normal cells, even when the leukemic cells are not the majority population. The antibody panel used to study patients with acute leukemia typically contains representative markers of all lineages, with some redundancy to allow recognition and classification because many antigens may be aberrantly lost or acquired in leukemic cells.2,3 No standard combination of antibodies is used by all laboratories, but certain combinations have proved particularly useful not only for the most economical classification of leukemia, but also to demonstrate characteristic aberrant patterns that may be extremely useful for the detection of residual disease in follow-up samples, as discussed later in this chapter.
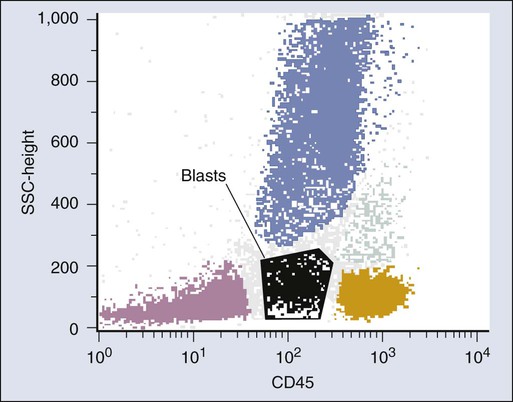
Difficulties encountered in the interpretation of flow cytometry data derive largely from two problems. First, in cases in which leukemic cells are not an obviously dominant population, it is important to ensure that the cells of interest are analyzed. The most useful general approach for this difficulty takes advantage of the fact that the common leukocyte antigen CD45 is differentially expressed on different types of hematopoietic cells and, when combined with side scatter, produces a display in which blasts occupy a unique position not occupied by normal cells (Fig. 15-1).4 Thus combining CD45 in one color with multiple combinations of antibodies in additional colors allows detailed characterization of blast populations in marrow even when they are present only in low numbers.
Failure to select the leukemic cell population for analysis, or including a mixture of leukemic and normal cells in a gate, may cause confusion in the reporting of flow cytometry results. It is best to identify the leukemic population visually and to provide a detailed description of the antigens expressed on the leukemic population, especially in myeloid leukemias, in which the dynamic patterns of maturation associated with morphologic variation in acute myeloid leukemia (AML) are reflected in changes in both light scatter and antigen expression as the leukemic cells mature. Tabular arrays of “percentage positive” are not recommended as part of a flow cytometry report, because they cannot reflect this complexity and may cause confusion.5
The second problem in interpreting flow cytometry results in leukemia derives from the fact that most of the reagents used in classifying leukemia are only relatively rather than absolutely specific. Thus correct classification requires not only a panel with some redundancy but also an understanding of patterns of reactivity of the antibodies. Markers such as CD13 and CD33, which are considered myeloid antigens because they originally were produced against myeloid leukemia cells, are found in up to 50% of cases of lymphoid leukemia,6 and interpretation of leukemias positive for these markers continues to be a cause of confusion. Generally speaking, the most specific markers of a given lineage are not highly sensitive, and the most sensitive ones are not specific. This finding is true more of myeloid markers than of lymphoid markers, and thus lymphoid leukemias usually can be recognized precisely, whereas poorly differentiated myeloid leukemias usually are defined by the presence of myeloid markers in the absence of specific lymphoid antigens.
Acute Leukemias of Indeterminate or Ambiguous Lineage
Although almost all cases of acute leukemia can be categorized easily regarding lineage, the lack of absolute specificity of most markers, and the promiscuity of their expression, implies that some cases cannot be resolved easily. Unfortunately, considerable controversy exists about the use of the terms mixed lineage, bilineal, and biphenotypic leukemia, and the new World Health Organization 2008 classification has recommended a more descriptive term: “mixed phenotype acute leukemia” (MPAL).7 These leukemias, which express myeloid- and lymphoid-associated markers in various combinations, represent a heterogeneous group of diseases. Previously, these leukemias were identified using a scoring system that assigned various point values to different antigens, with a diagnosis of “biphenotypic leukemia” rendered if the score were high for more than one lineage.8 The new World Health Organization classification recommends a different approach, recognizing the limitations of defining lineage with arbitrary scores. In this system, MPAL is defined using fewer, more specific markers, and, most significantly, cases of MPAL associated with specific genetic lesions are considered specific entities.
Association of Immunophenotype and Molecular Abnormalities
Many phenotypes in both acute lymphoblastic leukemia (ALL) and AML are highly associated with characteristic cytogenetic abnormalities.9 In ALL, these include cases associated with mixed lineage leukemia rearrangements, TEL-AML1 or E2A-PBX1. In AML, the most important link is in promyelocytic leukemia with the t(15;17) translocation. Whereas lack of human leukocyte antigen-DR subregion (HLA-DR) is the best-known abnormality, only about half of cases of DR-negative AML turn out to be acute promyelocytic leukemia, and other combinations of marker expression are much more sensitive and specific for acute promyelocytic leukemia.10 AML associated with the t(8;21) translocation also shows a characteristic phenotype.11
Minimal Residual Disease Detection in Acute Leukemia
Several studies have demonstrated that the presence of residual leukemic cells in the marrow of patients who are in clinical and morphologic remission is a very strong adverse prognostic factor.12–20 Although the most extensive data exist in cases of childhood ALL,13–17,19 the principle has also been shown to apply to persons with adult ALL21,22 and to persons with AML.18,20
Both molecular and flow-based methods have been used to detect minimal residual disease (MRD). Flow-based assays of MRD are based on the principle that nearly all leukemias show a pattern of expression of antigens that is aberrant compared with the pattern seen in normal differentiation.15,23–29 This aberrancy can take several forms. Some leukemic cells can abnormally express antigens of a different lineage or show loss of expression of a normal lineage marker. A more common finding is expression of normal differentiation antigens, but at an intensity that is different from that expected for a particular stage of differentiation. This latter attribute makes flow MRD analysis applicable to most cases of leukemia. Nonetheless, recognizing these deviations requires a clear understanding of patterns of maturation in normal differentiation, including marrow regeneration, as viewed in multiparameter space.
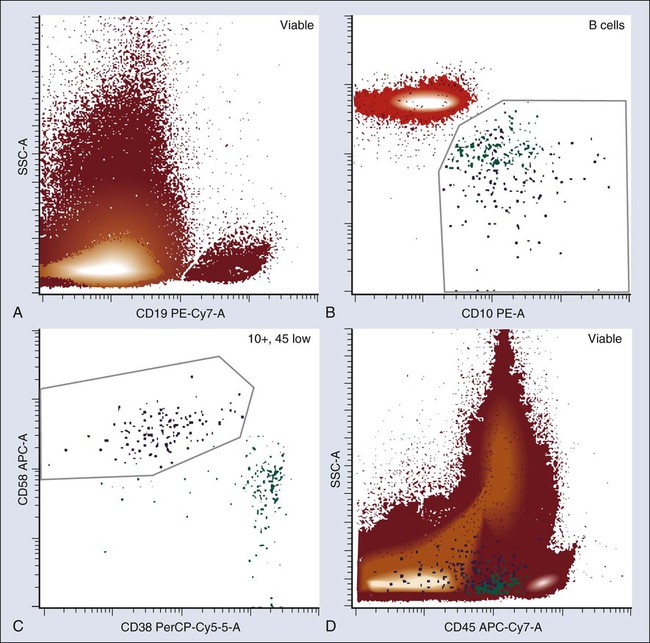
The pattern of antigen acquisition and loss during B-cell maturation in the bone marrow has been very well characterized, and certain markers are particularly useful for distinguishing normal and leukemic maturation. Consideration of markers including intensity of CD45, CD34, CD10, CD58, and CD38 or aberrant coexpression of myeloid or other unexpected antigens can allow detection of as few as 1 in 104 leukemic cells, even when normal B-cell precursors are present in significant numbers (Fig. 15-2). Marrow T-cell acute lymphoblastic leukemia (T-ALL) also can be distinguished from normal T cells, in part because T-ALL will typically coexpress cytoplasmic CD3 and TdT, which is never seen on any normal cell.15 However, after treatment with steroid-based therapies, T-cell leukemias may undergo therapy-induced maturation and lose expression of TdT and other markers useful for distinguishing immature and mature T cells.30 Thus T-ALL MRD detection often relies on detecting the same type of phenotypic abnormalities as seen in B-cell acute lymphoblastic leukemia (B-ALL). Detection of myeloid MRD usually is a more elaborate process because of the greater phenotypic heterogeneity in AML. Certain aberrant combinations, including coexpression of CD34 and CD56, CD117 and CD15, or CD7 and myeloid antigens occur with sufficient frequency to be useful in a large number of cases.24,28,31 Achieving 10−4 sensitivity on a consistent basis is difficult, and sensitivities are more typically closer to 10−3. Because abnormal populations at diagnosis may not persist at recurrence, monitoring patients with acute leukemia is best done by looking for phenotypic differences from normal, rather than for a specific abnormal phenotype present at diagnosis.
Myelodysplasia and Chronic Myeloproliferative Neoplasms
Flow cytometry can detect abnormalities in marrow stem cell disorders other than acute leukemia. Patients with chronic myeloproliferative neoplasms (MPNs) invariably show abnormalities in either blast phenotype or maturation pattern,32 although routine clinical phenotyping of MPNs is not performed in most cases. Interest in using flow cytometry as a primary diagnostic modality in myelodysplastic syndromes is increasing. In addition to finding phenotypically abnormal blasts, many studies have demonstrated characteristic phenotypic abnormalities in either myeloid or erythroid maturation in persons with myelodysplastic syndrome (MDS), as well as describing abnormalities in granulocyte light scatter that correspond to the morphologic finding of hypogranularity.33–41 A scoring system has been proposed to use flow cytometric characteristics to diagnose MDS, and this approach has been shown to have value in assessing the prognosis of patients.33,37 However, consensus documents for the diagnosis and classification of MDS do not yet use flow cytometry results as a primary diagnostic criterion for MDS; rather, flow results are considered as one of several “co-criteria” to be used in patients with clinical suspicion of MDS who do not yet fulfill criteria for diagnosis using standard methods.39,41
Chronic Lymphoproliferative Disorders and Lymphoma
Lymphoid Tissue Analysis
Flow-cytometric immunophenotyping plays a major role in the evaluation of patients with lymphoma (see Box 15-1).44–44 Lymphoid tissue first must be disaggregated to produce a cell suspension suitable for flow-cytometric analysis. Although this task is readily accomplished in most low-grade lymphomas, high-grade lymphomas may give a nonrepresentative sample because of the greater fragility of the neoplastic cells compared with residual normal cells. Fibrosis also may make disaggregation difficult or result in disruption of neoplastic cells. Consequently, flow-cytometric analysis of lymphoma requires careful gating to ensure that the cells of interest are analyzed.
The disadvantages of flow cytometry come from the architectural disruption created by making a cell suspension and the aforementioned possible loss of cells of interest. Hodgkin lymphoma, in particular, is not diagnosed by routine flow cytometry, although careful attention to the procedures used for phenotyping can overcome this drawback.45 Even in non-Hodgkin lymphoma, grading may be difficult from flow-cytometric immunophenotyping alone, and precise classification can be accomplished only rarely; lymphoma classification still relies heavily on morphology, which must be correlated with flow-cytometric information.
One of the most fruitful applications of flow cytometry in the diagnosis of lymphoma is in the analysis of specimens from fine-needle aspiration (FNA).48–48 Cells obtained by FNA already are in suspension, and flow-cytometric analysis contributes significantly to the cytopathological diagnosis of lymphoma, which is notoriously difficult. Although FNA has been used for years in the evaluation of recurrent adenopathy in patients with known lymphoma, it can serve as a primary diagnostic modality in lymphoma when combined with flow cytometry. Most non-Hodgkin lymphomas can be recognized and graded, and, importantly, lymphomas also can usually be excluded. Optimal application of this technology, however, requires close collaboration between the cytopathologist and flow cytometrist, a clear understanding of the strengths and limitations of the two techniques, and a willingness to revert to open biopsy in ambiguous cases.
Blood and Marrow Analysis
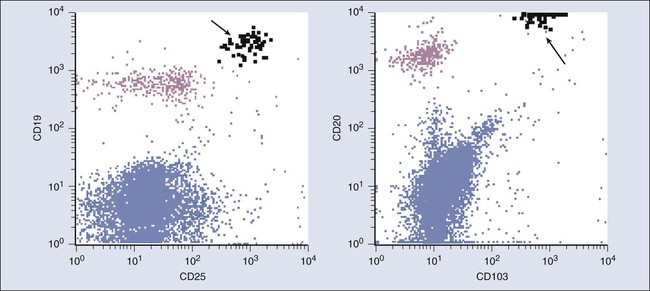
Limitations attendant on generating cell suspensions do not apply to patients with blood or marrow involvement by chronic lymphoproliferative disorders. Subclassification of these lesions relies heavily on flow cytometry.42,44,49–51 Chronic lymphocytic leukemia (CLL) is essentially defined by its immunophenotypic characteristics. Other B-cell lymphoproliferative disorders have characteristic, if not always absolutely specific, phenotypes. Mantle cell lymphoma often can be recognized in its leukemic phase, although the most specific marker, cyclin D1, is very difficult to detect by flow with current techniques. Hairy cell leukemia, conversely, has not only a characteristic but also a highly specific phenotype42,50,52; occasionally, patients with unexplained pancytopenia can be determined to have hairy cell leukemia when only a tiny number of blood cells with the classic phenotype are identified52 (Fig. 15-3).
Flow cytometry can also detect prognostic factors in persons with CLL. Recognizing that CLL can be subdivided into a poor-prognosis type associated with nonmutated immunoglobulin V region genes and a better-prognosis mutated phenotype, several studies have attempted to identify flow surrogates. The first marker found to be prognostic was CD38, although the correlation with either mutational status or prognosis is imperfect.53,54 Zeta-chain–associated protein kinase 70 (ZAP 70) appears to be a better surrogate marker, although it too is not perfect; however, it does provide prognostic information.57–57 However, even though this assay is widely available, particularly in commercial reference laboratories, cutoffs between positive and negative may be arbitrary, and thus significant variability in results can exist among laboratories.58,59 Attempts have been made to improve reproducibility,60 but it is not always certain that a particular assay will give the same results as those in the published clinical literature. Other attempts have been made to define prognostically significant subsets of patients with CLL using other combinations of markers,61 but these combinations have not been adopted in routine practice.
The primary value of flow cytometry in assessing chronic leukemias is its ability to demonstrate clonality in B-cell populations based on restricted expression of one type of immunoglobulin light chain. This feature is particularly valuable in the evaluation of patients with unexplained lymphocytosis62,63 and also is useful for determining the stage of patients with B-cell non-Hodgkin lymphoma,64,65 because the presence of as little as 0.5% to 1% of a clonal B-cell population, or even less, can be demonstrated in the marrow or blood of some patients. However, the high sensitivity of flow cytometry for detecting clonal populations has demonstrated small clonal B-cell populations in some patients without obvious lymphoma or leukemia.66 Thus the finding of a small marrow clone should be interpreted with caution in the absence of other evidence of lymphoma, analogous to finding a monoclonal gammopathy in a patient without evidence of myeloma.
Flow cytometry has also been used extensively in the study of patients with myeloma. One limitation of flow cytometry is that plasma cells are underrepresented on marrow aspirates studied by flow compared with the prevalence of cells on films or in biopsies; as a result, this technique cannot be used to quantify myeloma cells and thus cannot substitute for morphology when applying traditional diagnostic criteria. However, plasma cells have a characteristic phenotype, including very bright expression of CD38 and expression of CD138,67,68 and thus are easy to recognize. With the use of membrane-permeabilization techniques, it is easy to demonstrate cytoplasmic immunoglobulin (Ig) light-chain restriction.67 It is of more significance that neoplastic plasma cells usually have abnormal phenotypes. Although no single specific phenotypic abnormality permits distinction between benign monoclonal gammopathy and myeloma, flow cytometry can still be helpful to distinguish myeloma from monoclonal gammopathy of undetermined significance, or to predict progression of monoclonal gammopathy of undetermined significance or smoldering myeloma.71–71 Moreover, flow cytometric assessment of abnormal plasma cells at the time of diagnosis of myeloma has been shown to have prognostic significance.72 In addition, detection of circulating plasma cells or persistence of an abnormal phenotype after therapy, including detection of minimal residual disease, is predictive of outcome in patients with myeloma.69,71,73–76
Clonality of T-cell populations also can be demonstrated by flow cytometry, although the method is more complex and is not as widely available as that used for B cells. This technique is based on demonstration of restriction of V-beta gene use in T-cell leukemias.79–79 T-cell malignancies also often show abnormal T-cell phenotypes, which most often are characterized by loss of a normal pan-T antigen or expression of a T-cell antigen at abnormal intensity.44,80,81 Because certain small, unusual, and even clonal T-cell populations may be seen in small numbers in non-neoplastic conditions, this technique has more limited sensitivity than demonstration of a clonal B-cell population. However, when abnormal T cells account for more than a very small percentage of cells, multiparameter flow cytometry easily demonstrates them and plays a significant role in categorizing these uncommon tumors.
Residual Disease Detection in Chronic Lymphoproliferative Disorders
As with acute leukemia, MRD can be detected by flow cytometry in chronic lymphoproliferative disorders. The most work has been done with CLL. Although detection of light-chain–restricted clones is difficult when the level is much below 0.1%, aberrant phenotypes that allow detection with a sensitivity of at least 1 in 10−4 can be detected in most cases of CLL,84–84 and standardized approaches to MRD detection in persons with CLL have been suggested.85 Just as in acute leukemia, the presence of MRD in patients considered to be in remission by standard criteria is associated with an adverse prognosis,83 whereas clearance of MRD after therapy is associated with a good outcome.86
Solid Tumors: Analysis for DNA Content
DNA content analysis in tumors was one of the earliest clinical applications of flow cytometry. Many studies have attempted to define the prognostic significance of either ploidy or S-phase fraction in a large number of different solid tumors. The finding that fixed, paraffin-embedded tissue sections could be used for DNA analysis by flow made possible many retrospective studies on archival material for which the outcome was already known.87 However, the literature is confusing and contradictory, and the early promise of this measurement as an important diagnostic and prognostic marker in cancer has not been realized. Although some studies have demonstrated prognostic significance to measurements of ploidy, and especially S-phase fraction, in a number of tumors—most specifically bladder, prostate, and breast cancer—many studies conflict, and as a result, this technology has not been widely embraced in clinical oncology. Although some practices use S-phase fraction to help manage patients with early-stage, node-negative breast cancer, DNA flow cytometry has largely been replaced by molecular prognostic markers.88 One reason flow cytometry had difficulty making inroads into the clinic was the very poor interlaboratory reproducibility of DNA measurements, particularly S-phase fraction.89 Interestingly, some studies that used highly sophisticated analytic methods to reanalyze old data suggested that in breast cancer, at least, both ploidy and S-phase fraction are powerful independent prognostic markers,90 but it is unlikely that these techniques will be adopted in routine clinical practice. A detailed summary of all the controversies regarding DNA cytometry is outside the scope of this chapter, but several reviews have been published.91,92
Future of Flow Cytometry in Clinical Oncology
In the past several years, great technical improvements in flow cytometry have occurred and are beginning to make their way into the clinic. Better hardware on more compact instruments that fit more easily into the clinical laboratory, coupled with more robust software that provides easy setup and standardization, has made this technology more accessible. At the same time, however, with the notable exception of MRD assessment, no significant growth has occurred in the applicability of this technology to cancer. Empirical classification of leukemia and lymphoma with new markers has not, in general, been fruitful, although with the advent of more and more immunotherapeutic agents, there is a growing if still limited role for determining expression of particular markers that can be effectively targeted with antibody therapy.95–95 Most of the recent technological advances in cancer diagnosis have focused on methods of assessing genetic lesions in cancer. However, although genetic abnormalities clearly produce cancer, they do so through production of abnormal proteins, and proteins of course are readily detectable by flow cytometry. Exactly how detection of the expression of specific proteins by flow cytometry can be used to identify molecular lesions is still not clear. Although fusion gene products such as bcr-abl in chronic myeloid leukemia can be detected by flow cytometry,96 these methods appear to have little to recommend them over more standard molecular techniques. However, overexpression of other markers may give insight into specific molecular mechanisms, with therapeutic implications. For example, overexpression of CRLF2 that can be seen in some cases of ALL also can coexist with JAK mutations,97 and thus a simple flow cytometric assay might someday be useful to screen for patients who might be candidates for therapy targeted to specific molecular abnormalities.
Applications that can harness flow cytometry’s unique ability to assay multiple parameters in heterogeneous (and live) cell populations would appear to have the most promise for new clinical applications. To this end, one of the areas that has seen significant attention is the flow-cytometric detection of phosphorylated signaling molecules. These studies have added greatly to our understanding of the operation of signaling pathways,98,99 can be used to demonstrate alterations in signaling in leukemia, and are ideally suited to use as surrogate markers to validate the action of new drugs.100,101 Although these measurements have not yet been incorporated into routine clinical practice, they already are being used in clinical trials,102 and it is likely that the most robust and informative of them will find their way into the routine laboratory.