Childhood Leukemia
Dario Campana and Ching-Hon Pui
• Leukemia is the most common childhood cancer.
• The most common subtype, acute lymphoblastic leukemia (ALL), accounts for 75% to 80% of all cases of childhood leukemia, whereas acute myeloid leukemia (AML) comprises approximately 20%.
• Chronic myelogenous leukemia (CML), myelodysplastic syndrome (MDS), and myeloproliferative disorder (MPD) are less frequent.
• Chronic lymphocytic leukemia (CLL) is extremely rare.
• Although environmental agents, such as ionizing radiation and chemical mutagens, have been implicated in the induction of leukemia, discernible etiologic factors are lacking in almost all cases of primary leukemia.
• Acquired genetic changes are central to the development of leukemia.
• Males are generally affected by leukemia slightly more often than females in all age groups except infants.
• In developed countries, the incidence of ALL is highest between ages 2 and 5 years.
• The incidence of AML is relatively constant during childhood, with slight peaks in the first 2 years of life and in late adolescence.
• MDS typically occurs after 5 years of age and juvenile myelomonocytic leukemia (JMML) occurs nearly always before 5 year of age.
• Physical signs and symptoms of thrombocytopenia and anemia are common.
• Neutropenia may lead to severe infection.
• Bone pain and arthralgia caused by leukemic infiltration is more common in ALL than AML and may be especially severe in young children.
• Common sites of extramedullary involvement in ALL include liver, spleen, thymus, and lymph nodes.
• Skin, gums, and the head and neck area are typical sites of extramedullary disease in AML Infiltration of the central nervous system can be found in both ALL and AML.
• The acute onset of petechiae, ecchymoses, and bleeding may suggest idiopathic thrombocytopenic purpura.
• Both acute leukemia and aplastic anemia may present with pancytopenia and complications associated with bone marrow failure.
• Infectious mononucleosis and other viral infections can be confused with ALL.
• Bone pain, arthralgia, and occasionally arthritis may mimic juvenile rheumatoid arthritis, rheumatic fever, other collagen diseases, or osteomyelitis.
• Childhood ALL should also be distinguished from pediatric small round cell tumors that involve the bone marrow.
• Patients with ALL undergo a relatively brief remission-induction phase followed by intensification (consolidation) therapy and then prolonged continuation treatment.
• All patients require treatment for subclinical central nervous system (CNS) involvement, which should be initiated early in the form of intrathecal chemotherapy.
• Most protocols for AML include remission induction and 3 to 4 courses of consolidation therapy.
• Autologous hematopoietic stem cell transplantation is not usually recommended.
• At present, ALL with remission failure, high levels (≥1%) of minimal residual disease (MRD) and/or persistent MRD postremission induction or early hematologic relapse are clear indications for allogeneic transplantation.
• Allogeneic transplantation appears to improve overall survival in AML, although the indications for this procedure during first remission are debated.
• Five-year event-free survival estimates for children with newly diagnosed ALL are now over 80%.
• Hypodiploidy with less than 44 chromosomes, and early T-cell precursor status are unfavorable prognostic indicators, whereas hyperdiploidy with more than 50 chromosomes and the ETV6-RUNX1 gene fusion in B-lineage ALL and NOTCH/FBXW7 mutations in T-cell ALL are associated with a favorable outcome. The prognosis associated with the Philadelphia chromosome/BCR-ABL1 abnormality has improved with the availability of tyrosine kinase inhibitors.
• Event-free survival for infant ALL with 11q23/MLL rearrangement remains only 20% to 35% and has not been improved by allogeneic transplantation.
• In AML, patients with Down syndrome or acute promyelocytic leukemia have a favorable prognosis with optimal therapy, whereas those with acute megakaryoblastic leukemia without the t(1;22)/OTT-MAL have significantly worse outcomes than others.
• Early bone marrow relapse and treatment-related AML carry a dismal prognosis.
• Patients with MDS, AML arising from MDS, AML with monosomy 7, or AML with internal tandem duplication of the FLT3 gene often have resistant disease.
• Slow response to remission induction therapy and persistent minimal residual disease are associated with a higher risk of relapse in both ALL and AML.
Introduction
Acute leukemia is a malignant proliferation and accumulation of immature lymphohematopoietic cells. The leukemic cell population is shown to be clonal by cytogenetics, glucose-6-phosphate dehydrogenase characterization, and analysis of antigen-receptor gene rearrangements and X-linked restriction fragment-length polymorphisms.1 Although leukemic cells generally do not proliferate as actively as their normal hematopoietic counterparts,2 they accumulate inexorably and compete successfully with normal cells. Their inability to differentiate and their relative resistance to apoptosis may explain this phenomenon. By the time of diagnosis, leukemic cells have usually replaced normal bone marrow cells and disseminated to various extramedullary sites. Therefore the presenting features of leukemia typically reflect the degree of bone marrow replacement and the extent of extramedullary spread.
Both ALL and AML are heterogeneous diseases that comprise different biological subtypes. The major morphologic and immunophenotypic divisions based on lineage association and degree of maturation are subclassified by the identification of distinct, recurrent chromosomal and molecular abnormalities,3,4 and gene expression patterns.5–9
Chronic myelogenous leukemia (CML), myelodysplastic syndrome (MDS), and myeloproliferative disorders (MPD) are infrequent in children. In general, they share clinical, laboratory, and morphologic features with one of their adult counterparts.10–13 A disorder characterized by an heterogeneous pattern of myeloproliferation, dysplasia, and hepatosplenomegaly in association with abnormal peripheral blood counts has historically been called “juvenile CML,” “infantile monosomy 7 syndrome,” and “chronic myelomonocytic leukemia” by different authors; the term juvenile myelomonocytic leukemia (JMML) is currently favored.14 Only a few well-documented cases of chronic lymphocytic leukemia have been reported in children.15,16
Epidemiology
Leukemia is the most common malignancy among patients younger than 15 years. ALL is approximately four times more common than AML. Males are generally affected by leukemia slightly more often than females in all age groups, with two exceptions: boys have a risk of T-cell leukemia that is four times that of girls, and girls have a slightly higher incidence of leukemia in the first year of life (1.5 : 1 ratio).17 Rates of ALL are comparatively higher in Northern and Western Europe, North America, and Oceania, than in Asia and Africa.17 In developed countries, the incidence of ALL is highest between ages 2 and 5 years. This age peak is accounted for largely by ALL with hyperdiploidy (>50 chromosomes) or ETV6-RUNX1 (formerly known as TEL-AML1) gene fusion.3 The incidence of ALL is higher in the Hispanic than in the white population, which, in turn, is higher than in the black population, especially among children 2 to 5 years of age. Black children have a higher incidence of T-cell ALL and pre-B leukemia with E2A-PBX1 fusion, and are less likely to have hyperdiploid ALL with more than 50 chromosomes than are white children.18 The incidence of AML in children peaks at 2 years of age, decreases to a nadir at 9 years, then peaks again at around age 16 years.19 The highest incidence of pediatric AML occurs among the Maori of New Zealand, Hawaiian Americans, and Africans in Zimbabwe.19 In most populations of children, less than 10% of cases of AML are acute promyelocytic leukemia.20 However, this figure is approximately 25% in children of Latin American origin21; a higher incidence was also reported in Italian children.22 Pediatric patients with MDS are typically older at diagnosis (>5 years old), whereas JMML nearly always occurs before 5 years of age.14
A small percentage (<5%) of cases of leukemia are associated with inherited genetic syndromes (Table 96-1). Children with Down syndrome have a tenfold to twentyfold increased risk of leukemia (ALL and AML).23,24 Furthermore, a MPD termed transient abnormal myelopoiesis may occur in newborns with Down syndrome.25 This disorder spontaneously remits in almost all patients within 3 months. However, early death can occur in almost 20% of patients with high presenting leukocyte count, abnormal liver function, and failure to normalize blood count; AML subsequently develops in another 30% of patients.25 Several other genetic disorders are associated with an increased risk of leukemia and/or MDS, including ataxia-telangiectasia, Wiskott-Aldrich syndrome, Bloom syndrome, Fanconi anemia, Kostmann disease, Blackfan-Diamond anemia, and neurofibromatosis.19,26,27 The association between leukemia and congenital immunodeficiencies, such as X-linked agammaglobulinemia and common variable immunodeficiency, is not well supported.26
Table 96-1
Congenital Disorders Associated with Increased Risk of Leukemia
| Congenital Disorder | Associated Leukemia(s) |
| Down syndrome | ALL, AML |
| Ataxia-telangiectasia | ALL |
| Wiskott-Aldrich syndrome | AML |
| Bloom syndrome | ALL, AML |
| Fanconi anemia | AML |
| Kostmann disease | AML |
| Neurofibromatosis | AML, JMML |
| Noonan syndrome | JMML |
Fraternal twins and siblings of affected children are at a twofold to fourfold greater risk of leukemia during the first decade of life than unrelated children.17,28 However, a Nordic population- and register-based study failed to show an increased incidence among siblings of children with leukemia.29 When leukemia occurs in one identical twin, the likelihood that the other twin will develop the disease is approximately 20%. However, when leukemia is diagnosed in one twin before 1 year of age, it almost invariably develops in the other twin, typically within a few months. Molecular studies have demonstrated that intrauterine metastasis of ALL from one twin to the other, via the shared placental circulation, is responsible for the concordant leukemia.32–32
Etiology
Although environmental agents, such as ionizing radiation and chemical mutagens, have been implicated in the induction of leukemia, discernible etiologic factors are lacking in almost all cases of primary leukemia.17 Association between leukemia and maternal exposure to various potential mutagens, neonatal administration of vitamin K, parental use of medications and drugs, and proximity to electromagnetic fields has not been authoritatively demonstrated.17 Although an association between increased risk of childhood ALL and exposure to high levels of residential magnetic fields has been reported, this finding needs confirmation.35–35 A case-control study identified a significantly increased risk of leukemia among the offspring of men employed in occupations with a risk of exposure to electromagnetic fields or radiation,36 a finding that also warrants further studies. Because industrialization, higher socioeconomic status and social isolation are associated with an increased risk of B-lineage ALL, Greaves hypothesized that abnormally late exposure to common infections and immune response stimulation could enhance the likelihood of leukemogenic genetic mutations, thus increasing the risk of childhood B-lineage ALL.37 In line with this notion is the observation of occasional clustering of childhood ALL associated with rural-urban population mixing, especially in new towns.38,39
Infant leukemias frequently have rearrangements of the MLL gene, located on chromosome band 11q23.40,41 MLL rearrangements are also common in therapy-related AML, arising after treatment with topoisomerase II inhibitors.42 This molecular similarity raised the hypothesis that transplacental fetal exposure to substances that inhibit topoisomerase II, such as flavonoids (in food and drink), quinolone antibiotics, benzene metabolites, catechins, and estrogens, could be leukemogenic.41 A case-control study found that in utero exposure to DNA-damaging drugs, herbal medicines, or pesticides was significantly associated with infant leukemia with MLL rearrangements.43 Because the functional doses received via dietary and environmental exposure are much lower than those received from anticancer chemotherapy, it was postulated that affected infants or their mothers may have reduced activity of carcinogen-detoxifying enzymes because of genetic polymorphism. In this regard, deficiency of glutathione-S-transferases (GST-M1 and GST-T1), enzymes that detoxify electrophilic metabolites by catalyzing their conjugation to glutathione, is associated with infant leukemia without MLL rearrangement,41 and with ALL in black children.44 Polymorphisms of reduced nicotinamide adenine dinucleotide phosphate : quinone oxidoreductase, an enzyme that converts benzoquinones to less toxic hydroxyl metabolites, have been associated with the development of infant and childhood ALL.45,46 Cytochrome P-450 CYP1A1*2A and NQO1*2 variant genotypes have also been linked to an increased risk of childhood ALL; children carrying both genotypes were at a particularly high risk.47 It has also been suggested that folate pathways may play a role in susceptibility to ALL,48,49 and that folate supplement may reduce the risk,50 an intriguing finding that requires confirmation. However, recent genome-wide associated studies could not confirm those findings and instead identified a number of other inherited polymorphisms in genes such as ARID5B, IKZF1, CEBPE, and CDKN2A, that are associated with the risk of childhood ALL in various ethnic and racial groups.51–54 To date, no direct gene-environment interaction has been firmly established.
Pathogenesis
There is strong evidence that acquired genetic changes are central to the development of leukemia. These changes affect the number (ploidy) and/or the structure of chromosomes; structural changes comprise translocations, inversions, deletions, point mutations, and amplifications.55 The dysregulation of genes encoding transcription factors and the resulting subversion of transcriptional pathways that regulate hematopoietic cell homeostasis, provides a mechanistic explanation for leukemogenesis.56,57 For example, the core binding factor (CBF) family of transcription factors is disrupted by recurrent chromosomal translocations, such as those involving ETV6-RUNX1 in ALL and RUNX1-RUNX1T1 and CBFB–MYH11 in AML.57,58 The encoded proteins regulate the expression of growth factors, such as interleukin-3, granulocyte-macrophage colony-stimulating factor, and macrophage colony-stimulating factor receptor, as well as the T-cell receptor β enhancer and the immunoglobulin heavy chain enhancer/promoter. The function of homeobox (HOX) genes, an evolutionarily highly conserved family of transcription factors whose expression is tightly regulated during hematopoietic cell differentiation, can also be disrupted either by direct involvement in chromosomal translocations [e.g., the t(7;11), forming the NUP98-HOXA9 fusion gene] or by the disruption of proteins believed to be their upstream regulators.59 Among the latter, the most notable is encoded by MLL, a gene crucial for both embryonic development and hematopoiesis, and, as mentioned above, is involved in translocations of the 11q23 region in both ALL and AML.58,59 Chimeric proteins encoded by fused genes can also directly interfere with normal apoptotic pathways, as has been demonstrated in the case of the TCF3-HLF protein.60,61 The expression of key regulators can be altered in the absence of detectable genetic abnormalities. For example, five different T-cell oncogenes (HOX11, TAL1, LYL1, LMO1, and LMO2) can be aberrantly expressed in T-lineage ALL in the absence of chromosomal abnormalities.6
Cell survival requirements can be altered by the dysregulated activity of tyrosine kinases, as in the case of the BCR-ABL1 gene fusion.4 Alternatively, activating mutations in tyrosine kinase receptors for growth factors may confer a growth advantage to leukemic cells. This mechanism is exemplified by mutations of FLT3, which encodes a receptor tyrosine kinase expressed by immature hematopoietic cells that acts synergistically with other growth factors to stimulate proliferation of hematopoietic progenitor cells.62 Mutant FLT3 is detectable in both ALL and AML; these mutations typically involve small tandem duplications of amino acids that result in constitutive tyrosine kinase activity.62 Activating mutations of NOTCH1, a gene encoding a transmembrane receptor that regulates normal T-cell development, are frequently detected in T-cell ALL.63,64 Activating mutations of NOTCH1 produce constitutive NOTCH1 signaling, which is sufficient to induce T-cell ALL in experimental models.64 Gamma secretase, a multicomponent membrane-associated enzyme, is required for NOTCH1 signaling through mutant NOTCH receptors in T-cell ALL, providing a target for therapeutic intervention with γ-secretase inhibitors.65 NOTCH signaling can also be interfered with by directly targeting NOTCH receptors with specific antibodies,66 thus avoiding the toxicity associated with γ-secretase inhibitors. Interestingly, somatic mutations inactivating the NOTCH pathway have been identified in some patients with chronic myelomonocytic leukemia, suggesting that NOTCH can also have tumor-suppressive functions.67
A pioneering large-scale study of DNA single-nucleotide polymorphism (SNP) analysis examined 242 cases of pediatric ALL and identified lesions in genes encoding key regulators of B-cell differentiation in 40% of B-cell precursor ALL cases.68 Most prominent were deletions and cryptic translocations involving the PAX5 gene, which was altered in almost one third of cases, and which would be predicted to block normal B-progenitor cell differentiation before immunoglobulin heavy-chain gene rearrangement. Other mutated genes were found in concert with several of the more common translocation-induced chimeric oncogenes, such as TCF3-PBX1 and ETV6-RUNX1, including the essential B-cell developmental genes E2A, EBF, LEF1, Ikaros, and Aiolos.
The retrospective identification of leukemia-specific fusion genes (e.g., MLL-AFF1, ETV6-RUNX1) in the neonatal blood spots of identical twins who experienced concordant leukemia has demonstrated their prenatal origin.32,69 In cases with the t(4;11) and MLL-AFF1, there is a high rate of concordance in identical twins (25% to 100%) and a very brief latency period after birth (a few weeks to a few months).32 In other types of leukemia, for example, those with the ETV6-RUNX1 fusion or T-cell phenotype, the rate of concordance is lower, the postnatal latency period is longer and is variable, and the clinical presentation and the outcome of therapy may differ widely among identical twins, suggesting that secondary postnatal molecular events are necessary for full leukemic transformation.32 Further insights were gained from a report of a set of triplets in which the two monozygotic twins developed concordant leukemia with identical ETV6-RUNX1 fusion at 3 years of age, while the third child, who had developed from a second zygote, was free of leukemia and of the genomic sequence.31 In addition to the fusion transcript, the identical twins had a secondary, independent deletion of the normal unrearranged ETV6 allele, suggesting a contributing postnatal event. Clone-specific antigen receptor gene rearrangements were analyzed in the neonatal blood spots of five children who were 6 months to 4 years and 8 months of age at diagnosis of B-lineage ALL and T-ALL: in all five children, the clonotypic antigen receptor gene rearrangements had been present at birth and the estimated number of clonotypic cells per blood spot was in the range of 10 to 100.70 One study found the ETV6-RUNX1 fusion in the cord blood of approximately 1% of randomly selected newborns, a frequency approximately 100 times that of ALL with ETV6-RUNX1,71 further supporting the notion that preleukemic clones are generated in utero at a high frequency and that secondary postnatal leukemogenic events are required for a fully malignant transformation of ETV6-RUNX1 cells. The prevalence of leukemias with prenatal origin is not known and not all cases develop in utero. For example, t(1;19) E2A-PBX1 ALL appears to have a postnatal origin in most cases.72 There is also evidence for RUNX1-RUNXT1 gene fusions occurring in utero,73 but the precise frequency of in utero events for this and other type of genetic abnormalities associated with AML is unclear.74
General Clinical and Laboratory Features
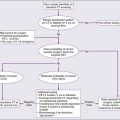
Leukemic blast cells are identified at diagnosis in the cerebrospinal fluid (CSF) of as many as one third of children with ALL (most of whom have no neurologic symptoms) and in approximately 5% of children with AML. Traditionally, CNS leukemia is defined by the presence of at least 5 leukocytes per microliter of CSF and the detection of leukemic blast cells, or by the presence of cranial nerve palsy. However, the presence of any amount of leukemic cells in CSF, even from iatrogenic introduction as the result of a traumatic lumbar puncture, is associated with an increased risk of ALL relapse, and requires additional intrathecal therapy.75,76
Pancytopenia is a presenting feature in most cases of MDS.13 Fetal hemoglobin is frequently slightly elevated. Most patients have no organomegaly. Extramedullary myeloid tumor may be the presenting feature of MDS but blasts in the CSF is not seen in MDS. The bone marrow is usually normocellular or hypercellular, with characteristic dysplastic features, including megaloblastic erythropoiesis, bizarre small or unusual large megakaryocytes, and dysgranulopoiesis; the percentage of myeloblasts is often increased.13 Hepatosplenomegaly and lymphadenopathy are suggestive clinical features of JMML.14 Current World Health Organization diagnostic criteria for patients with JMML include a peripheral monocyte count greater than 1 × 10⁹/L with less than 20% bone marrow blasts and splenomegaly in the absence of BCR-ABL1. Other characteristic features of JMML are somatic mutation in RAS or PTPN11, clinical diagnosis of NF1 or NF1 gene mutation, and/or monosomy 7. A feature of JMML cells is their capacity to spontaneously form granulocyte-macrophage colonies in vitro, and their hypersensitivity to granulocyte-macrophage colony-stimulating factor.14
Differential Diagnosis
MDS with a low blast count must be distinguished from aplastic anemia and other nonclonal disorders, which often requires sequential morphologic studies, including bone marrow biopsies.13 Myelodysplasia may also occur in a variety of disorders, such as infection, drug therapy, and chronic disease. AML is the major differential diagnosis of MDS. Cases with AML-specific translocations are more appropriately classified as AML regardless of the blast count, whereas monosomy 7 as the only cytogenetic aberration is strongly suggestive of MDS.13 A definitive distinction between JMML and Philadelphia chromosome-positive CML requires karyotypic or molecular examination for the t(9;22)/BCR-ABL1 abnormality. These conditions also must be distinguished from the “leukemoid reaction” associated with infection, cancer, or congenital heart disease in which signs and symptoms do not progress and/or resolve spontaneously.14
Morphologic and Cytochemical Analysis
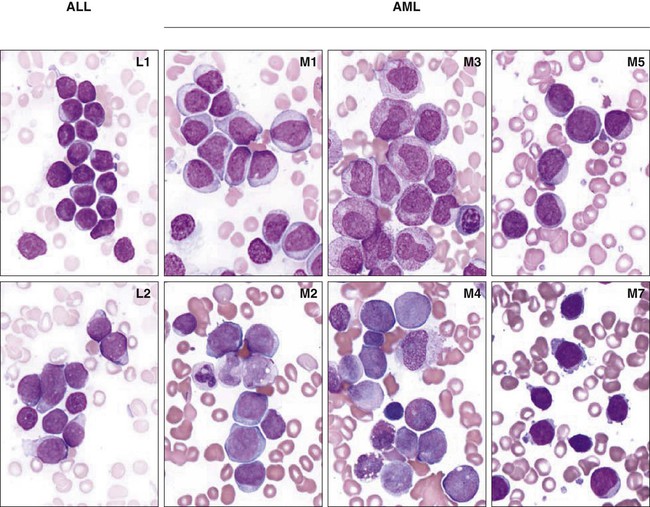
Morphologic analysis of leukemic cells in smears stained with Romanowsky stains (Wright-Giemsa or May-Grünwald-Giemsa) distinguishes three subtypes of ALL (L1, L2, and L3) and eight subtypes of AML (M0-M7) as classified by the French–American–British (FAB) scheme (Fig. 96-1).77 However, the FAB classification for ALL is no longer used because the defining criteria are too subjective, and it has no prognostic or therapeutic significance. The term acute myeloid leukemia is used to designate even leukemias in which some or all cells have the morphology of monocytes (M4, M5), erythroblasts (M6), or megakaryoblasts (M7). Because of the rarity and heterogeneous nature of childhood MDS, its classification has been inconsistent.13 Analysis of a Romanowsky-stained smear cannot accurately distinguish between ALL and AML. Cytochemical stains help this distinction. Myeloperoxidase, Sudan black, and nonspecific esterases, including α- naphthyl butyrate and α-naphthyl acetate esterase, react with myeloid blast cells, whereas periodic acid-Schiff reagent reacts positively in more than 70% of ALL cases. However, despite the traditional use of morphology and cytochemistry, contemporary classification of acute leukemias is based on subtypes that can be identified only by immunologic and molecular analyses.
The FAB group classified MDS into five subgroups: refractory anemia (RA), RA with ringed sideroblasts (RARS), RA with excess of blasts (RAEB), RAEB in transformation (RAEB-T), and chronic myelomonocytic leukemia.78 AML was defined by the presence of 30% myeloblasts in the bone marrow. A more recent World Health Organization classification classified myelodysplastic and myeloproliferative disorders into MDS, JMML, and myeloid leukemias of Down syndrome (Table 96-2).10,13 The distinction between MDS and AML can be difficult and may require molecular genetic studies. The presence of greater than 30% of blasts in the blood or marrow suggests AML, whereas less than 20% blasts suggests MDS.13
Table 96-2
Classification of Pediatric Myelodysplastic and Myeloproliferative Disease Proposed by Hasle et al.
| Myelodysplastic/Myeloproliferative Disease | Down Syndrome Disease | MDS |
| JMML | Transient abnormal myelopoiesis | Refractory cytopenia (<2% blasts in blood and <5% blasts in marrow) |
| Chronic myelomonocytic leukemia (secondary to previous chemotherapy) | Myeloid leukemia of Down Syndrome | RAEB (2% to 19% blasts in blood or 5% to 19% blasts in marrow) |
| Ph-negative CML | RAEB-T (20% to 29% blasts in blood or marrow) |
Data from Hasle H, Niemeyer CM, Chessells JM, et al. A pediatric approach to the WHO classification of myelodysplastic and myeloproliferative diseases. Leukemia 2003;17:277–82.
Immunologic Classification of Acute Leukemia
Acute Lymphoblastic Leukemia
Table 96-3 summarizes antigen expression patterns in ALL.
Table 96-3
Immunophenotypic Subgroups of ALL
| Subtype | Antigen Expression (% of Cases Positive) | Frequency | |||||||||
| CD19 | cCD22 | CD79α | CD10 | CD7 | CD5 | cCD3 | cIg µ | sIg µ | sIg κ or λ | ||
| Early pre-B | 100 | >95* | >95 | 95 | 5 | 0 | 0 | 0 | 0 | 0 | 60% to 65% |
| Pre-B | 100 | 100* | 100 | >95 | 0 | <2 | 0 | 100 | 0 | 0 | 20% to 25% |
| B | 100 | 100* | 100 | 50 | 0 | 0 | 0 | >95 | >95 | >95 | 2% to 3% |
| T | <5 | 0 | 30 | 45 | 100 | 95 | 100a | 0 | 0 | 0 | 15% to 18% |
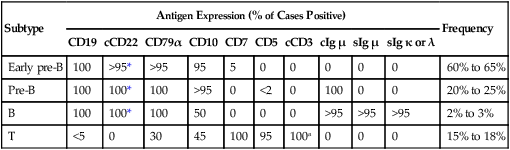
*Detectable on the cell surface membrane in some cases.
Data from Campana D, Behm FG. Immunophenotyping of leukemia. J Immunol Methods 2000;243:59–75.
Early Pre-B Acute Lymphoblastic Leukemia
Leukemic blast cells of early pre-B ALL resemble normal marrow B-cell precursors. Immunoglobulin heavy-chain genes are usually rearranged in these cells but immunoglobulins are not detectable. The leukemic cells of early pre-B ALL always express CD19. Almost all cases have cytoplasmic CD22 and CD79α; surface CD22 expression is also evident in many cases.79 CD10 and terminal deoxynucleotidyl transferase (TdT) are detectable in 90% of cases, and cells in more than 75% of cases express CD34.79 The CD20 antigen is present on a minor proportion of blast cells in one-half of cases.79,80 In 10% to 15% of early pre-B ALL cases, CD45 is very weakly expressed or undetectable; cells that have this immunophenotype are usually hyperdiploid (modal chromosome number >50).79
ALL with rearrangement of the MLL gene typically has an early pre-B ALL phenotype with distinctive features such as expression of CD15, CD65 and surface chondroitin proteoglycan sulfate, and absence of CD10.79
Pre-B Acute Lymphoblastic Leukemia
Approximately 25% of newly diagnosed cases of ALL have a pre-B immunophenotype consisting of accumulation of cytoplasmic immunoglobulin µ heavy chains with no detectable surface immunoglobulins.79 Similar to early pre-B ALL, cells express CD19, CD22, and CD79α. Rearrangement of immunoglobulin light chain genes is evident in some of these leukemias, but κ and λ proteins are not detectable. More than 95% of pre-B ALL express CD10 and TdT, but only two-thirds express CD34.79 In many cases of pre-B ALL, surface CD20 is absent or is weakly expressed.79,80 ZAP-70 expression can be found in cases of B-lineage ALL, particularly those with a pre-B phenotype.81,82
Between 20% and 25% of pre-B ALL cases have either the t(1;19)(q23;p13) or the der(19)t(1;19)(q23;p13).79 The antigen expression profile CD19+, CD22+, CD20±, CD34−, CD45+, cytoplasmic µ+ is characteristic of ALL cases with the t(1;19), but is not specific to these cases.79
Leukemic cells that express both cytoplasmic and surface immunoglobulin µ heavy chains without κ or λ light chains have been designated transitional pre-B ALL,79 but this nomenclature is not widely used and there is no identified genetic abnormality that is characteristic of this subgroup of ALL.
B-Cell Acute Lymphoblastic Leukemia
In 2% to 4% of childhood ALL cases, cells express surface immunoglobulin µ heavy chains plus either κ or λ light chains. The most common type of B-cell (Burkitt) ALL is characterized by L3 morphology according to the FAB classification. Cells express CD19, CD22, CD20, and frequently CD10 and CD23; CD34 is negative. In rare cases, TdT is expressed, or surface immunoglobulin is absent.79 B-cell ALL often represents the leukemic phase of Burkitt lymphoma arising in the abdomen or the head and neck.79 The hallmark of this subset of B-cell ALL is the presence of a reciprocal translocation of chromosome 8 with one of the chromosomes containing an immunoglobulin gene. These translocations, which include the t(8;14)(q24;q32), t(2;8)(p12;q24), and t(8;22)(q24;q11), involve rearrangement of the c-MYC gene.
The less common subtype of B-cell ALL is characterized by blast cells with L1 or L2 morphology. These leukemias may express TdT and CD34, and they express CD20 only weakly.79 Extramedullary masses are not seen at presentation. The t(8;14), t(2;8), and t(8;22) are absent, as are characteristic rearrangements of the c-MYC gene. These cases should be treated as B-cell precursor ALL rather than Burkitt ALL.
T-Lineage Acute Lymphoblastic Leukemia
T-lineage ALL cells have surface CD7 and cytoplasmic CD3 (cCD3) antigens.83,84 More than 90% of T lymphoblasts express CD2, CD5, and TdT. Surface CD1a, CD3, CD4, and CD8 are detected in fewer than 45% of cases.79 The HLA-DR antigen is not commonly expressed, and 40% to 45% of cases are CD10+ and/or CD21+.79 CD79α is also expressed in approximately one-third of cases.79
T-lineage ALL has been divided into three stages of immunophenotypic differentiation: early (CD7+, cCD3+, surface CD3−, CD4−, and CD8−), mid or common (cCD3+, surface CD3−,CD4+, CD8+, and CD1+), and late (surface CD3+, CD1−, and either CD4+ or CD8+). However, as many as 25% of cases of T-lineage ALL have antigen patterns that do not conform to any of these maturation stages. T-cell receptor (TCR) proteins are heterogeneously expressed in T-lineage ALL.85 In approximately two-thirds of cases, membrane CD3 and TCR proteins are absent. In half of these cases, however, TCR proteins (TCRβ, TCRα, or both) are present in the cells’ cytoplasm. Most cases with membrane CD3 and TCR chains express the αβ form of the TCR, whereas a minority express TCRγδ proteins.
Several early studies have yielded conflicting conclusions about the prognostic significance of the expression of surface CD3 and the absence of CD2, CD5, or CD10.88–88 More recently, a new subtype of T-ALL was identified, named early T-cell precursor (ETP)-ALL. ETP-ALL lymphoblasts express CD3 (typically cytoplasmic ) and lack myeloperoxidase.89 The defining features of ETP-ALL are absent expression of CD1a and CD8, dim CD5 expression (i.e., mean fluorescence intensity at least 10-fold lower than that of normal T lymphocytes or expression in less than 75% of blasts), and expression of stem cell/myeloid-associated markers, such as CD34, CD133, HLA-DR, CD13, CD33, and CD11b.89 ETP-ALL represents approximately 12% of T-ALL cases.89 Patients with this leukemia subtype have a dismal outcome, with poor response to initial therapy and a very high risk of relapse.89
Acute Myeloid Leukemia
Table 96-4 summarizes the patterns of antigen expression in AML. The leukemic cells in all myelocytic and monocytic subtypes of AML (M0 through M5) express various combinations of CD13, CD33, CD65, CD117, and myeloperoxidase (MPO).79
Table 96-4
Immunophenotype of AML Subtypes
| FAB Subtype | Antigen Expression (Approximate % of Cases Positive for Marker) | |||||||||||
| CD34 | CD117 | HLA-DR | MPO | CD13 | CD33 | CD15 | CD65 | CD14 | GPA | CD36 | CD41a | |
| M0 | 75 | 75 | 75 | >80 | 75 | 75 | 30 | 30 | 0 | 0 | 0 | 0 |
| M1 | 75 | 75 | 75 | >80 | 75 | 75 | 75 | 75 | 0 | 0 | 0 | 0 |
| M2 | 75 | 75 | >80 | >80 | >80 | >80 | 75 | 75 | 0 | 0 | 0 | 0 |
| M3 | <10 | 30 | <10 | >80 | >80 | >80 | 75 | 75 | 0 | 0 | 0 | 0 |
| M4 | 75 | 75 | >80 | >80 | 75 | >80 | 75 | >80 | 75 | 0 | 30 | 0 |
| M5 | <10 | 30 | >80 | >80 | 75 | >80 | 75 | >80 | 75 | 0 | 75 | 0 |
| M6 | 30 | 30 | 75 | >80 | 75 | 75 | 30 | 75 | 0 | >80 | 75 | 0 |
| M7 | 30 | 30 | 30 | 0 | 30 | 75 | 30 | <10 | 0 | <10 | 75 | >80 |
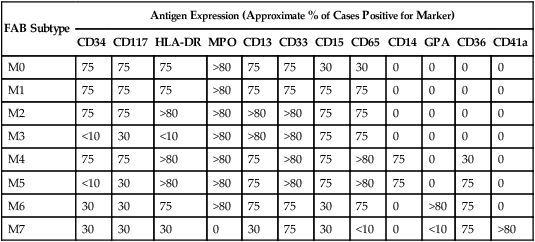
Data from Campana D, Behm FG. Immunophenotyping of leukemia. J Immunol Methods 2000;243:59–75.
Acute Myelocytic Leukemia with Differentiation (M2 AML)
Approximately 35% to 45% of cases of childhood M2 AML have the t(8;21)(q22;q22). Leukemic blast cells commonly express MPO, CD34, CD65, and HLA-DR, but CD13 and CD33 expression is characteristically weak and sometimes is not detectable.79 Most cases weakly express CD19 and, less commonly, CD56.79 By contrast, the leukemic myeloblasts of M2 AML without the t(8;21) may also express MPO, CD34, CD65, and HLA-DR, but the expression of CD13 and CD33 usually exceeds that of myeloblasts that have the t(8;21). In addition, the CD19 antigen is rarely detectable, whereas T-cell−associated CD2 or CD7 is commonly present in these cases.79
Acute Promyelocytic Leukemia (M3 AML)
This group of leukemias includes a microgranular variant referred to as M3v that may morphologically mimic acute monocytic leukemia. Cells of M3 and M3v AML strongly express MPO, CD13, CD33, and CD65 but usually lack HLA-DR.79,90 Expression of CD11b and CD15 is variable, and CD4 and CD56 are seldom detected.79 Atypical expression of CD2 is observed in 40% to 45% of cases, but may be more prevalent in the M3v subtype.79 CD34 is generally absent but may be found in some cases, usually M3v.90 Heterogeneous expression of CD13, the existence of a single primary blast cell population, and a characteristic pattern of CD34 and CD15 expression are reportedly useful in identifying M3 AML.91
Acute Myelomonocytic Leukemia (M4 AML)
Blast cells of most myelomonocytic leukemias express MPO, CD4, CD11b, CD11c, CD13, CD14, CD33, CD34, CD45, CD65, and HLA-DR.79
A relatively uncommon variant of M4 AML, M4Eo, is associated with increased numbers of eosinophils in the bone marrow, with or without peripheral blood eosinophilia. These cases usually express the CBFB-MYH11 chimeric gene, which is often associated with expression of CD2.79
Acute Monocytic Leukemia (M5 AML)
Monoblasts usually express MPO, HLA-DR, CD4, CD11b, CD11c, CD33, and CD65. The cells of some monocytic leukemias express CD117, but CD34 is rarely detected. The cells of most monocytic leukemias also express CD15, CD36, and, not infrequently, CD56. Expression of CD14 is largely restricted to cells of the monocytic lineage, but is often absent in pediatric M5 cases. A variable number of monoblasts may appear to react with antibodies to CD41a and CD61 because of platelet adhesion to the cell surface or glycoprotein IIb/IIIa absorption.79
Acute Erythroleukemia (M6 AML) and Acute Erythroblastic Leukemia
Leukemias composed primarily of erythroid precursors are uncommon. Leukemic erythroblasts usually express CD36, CD71, and glycophorin A, and hemoglobin is detectable in late-stage erythroid precursors. Cells of the myeloid component express CD13, CD33, and MPO. M6 AML may be difficult to distinguish from M0 and M7 AML, because undifferentiated erythroblasts have few or no erythroid-associated antigens, and their antigenic and ultrastructural features may mimic those of early megakaryoblasts. 79
Acute Megakaryoblastic Leukemia (M7 AML)
Distinguishing acute megakaryoblastic leukemia (M7 AML) from ALL, M0 and M5 AML, acute erythroblastic leukemia and metastatic small-cell tumors solely on the basis of cell morphology might be difficult. The leukemic cells of most M7 AML cases express CD41a and CD61, and those of more than half of M7 AML cases express CD42b. Most cases are positive for CD4 and CD33; CD13, CD34, CD36, CD45, and HLA-DR are infrequently detected.79
Acute Myeloid Leukemia Without Morphologic or Cytochemical Evidence of Differentiation (M0 AML)
The term “M0” denotes minimally differentiated myeloid leukemia.92 In general, the expression of CD3, CD79α, or TCR proteins is strongly indicative of lymphoid lineage differentiation. In the absence of these lymphoid markers and of markers associated with the megakaryocytic lineage, the expression of CD13, CD15, CD33, CD65, or MPO is evidence of myeloid lineage commitment.79 Leukemias that are devoid of detectable MPO should be classified as M0 AML only in the absence of lineage-restricted lymphoid and megakaryocytic antigens.79 Although the cells of most M0 cases express CD13 or CD33, some MPO+ cases may lack these antigens.79 The expression of CD117 by leukemic cells is strongly suggestive of AML. Other non–lineage-restricted antigens found on M0 AML cells include CD2, CD4, CD7, CD9, CD10, CD11b, CD19, CD34, CD71, TdT, and HLA-DR.79
Rare Acute Leukemias
In a very rare subset of AML, leukemic cells express markers of basophilic differentiation are classified as acute basophilic leukemia. The immunophenotype is not unlike that of other AML, that is, expression of CD13 and/or CD33, and variable expression of CD34 and HLA-DR. The most characteristic feature is the presence of basophilic cytoplasmic granules which might be detectable only by ultrastructural examination.93
Another uncommon acute leukemia subtype is plasmacytoid dendritic cell type 2 acute leukemia. Leukemic cells are CD4 and CD56 positive and lack strong expression of lymphoid and myeloid markers. Characteristic markers include the interleukin-3 receptor (CD123), CD45RA, CD36, and BDCA-2/CD303.94,95
Acute Leukemias of Ambiguous Lineage
A small subset of acute leukemia (<5% of all cases) remains difficult to classify even after extensive morphologic and immunophenotypic analysis.96,97 Some cases are designated acute undifferentiated (or unclassified) leukemia. Morphologically, these leukemias may resemble ALL or AML, and immunophenotyping studies show the absence of B-lymphoid, T-lymphoid, myeloid, and megakaryocytic antigens.98 The leukemic cells of true acute undifferentiated leukemia lack surface and cytoplasmic antigens associated with B (CD19, CD22, and CD79α), T (CD2, CD3, CD5, and TCR proteins), myelomonocytic (MPO, CD13, CD14, CD33, CD15, and CD65), and megakaryocytic or erythrocytic (CD36, CD41a, CD42b, CD61, and glycophorin A) lineages. Diagnostic studies should also exclude neuroblastoma, Ewing sarcoma, and other small cell tumors.
Immunologic and molecular studies show that many leukemias possess features characteristic of multiple hematopoietic lineages. Acute leukemias whose blast cells simultaneously demonstrate features of more than one lineage (e.g., lymphoid plus myeloid) are currently termed mixed phenotype acute leukemia (MPAL).96,97 The diagnosis of B-lineage ALL should be made when leukemic cells express either cytoplasmic immunoglobulin or CD79α or CD19 plus CD22, regardless of CD13, CD15, CD33, or CD65 expression.79 The diagnosis of T-lineage ALL should be made when leukemic cells express CD7 plus either surface or cCD3, regardless of myeloid antigen expression. A diagnosis of AML is rendered when leukemic cells express MPO or two or more myeloid-associated antigens, including CD13, CD15, CD33, or CD65, in the absence of the lymphoid-associated markers designated above. An immunophenotypic diagnosis of “true” MPAL should be considered when leukemic blast cells coexpress MPO and CD3, MPO and immunoglobulin, or MPO and CD79α. “True” MPAL should not be confused with biclonal or oligoclonal leukemias, which consist of two or more immunophenotypically distinct leukemic cell populations. The latter types of leukemia are very rare.
Expression of myeloid antigens in ALL has no independent prognostic significance in children but can be associated with molecular genetic abnormalities.99 Atypical expression of the myeloid-associated antigen CD15 is characteristic of B-lineage ALL with MLL gene rearrangements. Lymphoid antigen expression in AML cells also lacks prognostic significance in children.99 Recent studies found that overall survival rates for children with mixed phenotype acute leukemia were comparable to those of AML but were inferior to those of ALL.100,101
Cytogenetic and Molecular Classification
Acute Lymphoblastic Leukemia
Hyperdiploid Acute Lymphoblastic Leukemia
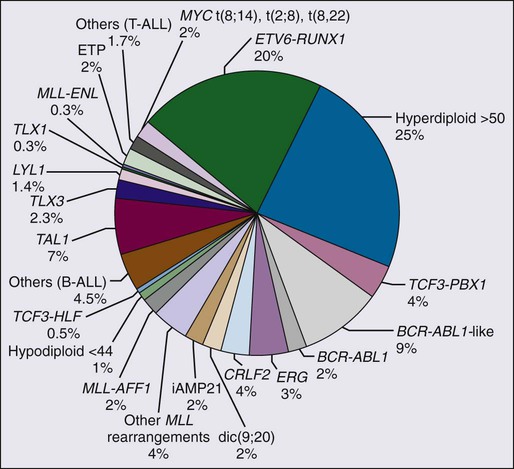
The major cytogenetic and molecular subgroups of childhood ALL are summarized in Figure 96-2. In approximately half of ALL cases, leukemic blast cells have a modal chromosomal number greater than 46. Hyperdiploidy can be identified by conventional karyotyping or by DNA content analysis with flow cytometry. In approximately 50% of hyperdiploid cases, the leukemic cells have additional structural chromosomal abnormalities, including duplication of 1q and isochromosome of 17q; however, no consistent structural abnormality has been identified.
Hyperdiploid cases with a modal chromosome number of 51 to 65, also called “high hyperdiploid ALL,” represent a distinct biological subset of B-lineage ALL with an excellent prognosis,102,103 and overall survival exceeding 95% in some contemporary studies.104 A study of 74 cases of high hyperdiploid ALL with SNP arrays found that the characteristic chromosomal gains are more frequent than previously thought and that nearly 80% of the cases display additional abnormalities.105 Leukemic lymphoblasts with this karyotype have a marked propensity to undergo apoptosis in vitro and in vivo.106,107 In addition, they accumulate greater quantities of methotrexate and its active polyglutamate metabolites than do other leukemic lymphoblasts,108,109 and they reportedly have greater sensitivity to antimetabolites in vitro.110 These features explain the relatively small presenting tumor burden and the good prognosis of this subtype of ALL. Features that have been associated with the most favorable outcome among this subset of ALL include trisomy of chromosomes 4, 10, and 17,111 a chromosome number of 56 or more,112 and the absence of chromosomal translocations.113
In contrast to the favorable prognosis of this ALL subtype, ALL cases with near-triploidy (69 to 81 chromosomes) have a response to therapy similar to that of nonhyperdiploid ALL114; cases with near-tetraploidy (82 to 94 chromosomes) have a high frequency of T-cell imunophenotype.114,115 Hypodiploidy (fewer than 45 chromosomes) is found in less than 2% of ALL cases and is associated with a poor outcome.116,117
Acute Lymphoblastic Leukemia with TCF3-PBX1 (E2A-PBX1) and TCF3-HLF (E2A-HLF) Rearrangements
The t(1;19)(q23;p13) is found in 20% to 25% of pre-B ALL cases. The affected genes are those encoding the TCF3 (or E2A) transcription factor on chromosome 19 and the PBX1 homeodomain-containing transcription factor on chromosome 1.118 The resulting TCF3-PBX1 fusion protein contains the transcriptional activation domains of TCF3 linked to the DNA-binding domain of PBX1. Thus the protein should inappropriately activate the transcription of genes normally regulated by PBX1. PBX1 is required for the maintenance of definitive hematopoiesis and contributes to the growth of subsets of hematopoietic progenitors.119 Ectopic expression of the TCF3-PBX1 chimeric protein in mice leads to the development of lymphomas and myeloid leukemias.120 Some of the oncogenic potential of TCF3-PBX1 could be mediated through the formation of heterocomplexes with HOX proteins.121
Another TCF3 fusion gene is created by the t(11;17), in which TCF3 is fused to the gene that encodes hepatic leukemia factor (HLF).122 HLF is a member of the bZip family of transcription factors. The TCF3-HLF fusion protein contains the transcriptional activation domains of TCF3 linked to the DNA-binding and protein-protein interaction motifs of HLF. Thus this chimeric protein should activate the transcription of genes normally regulated by HLF. In addition, TCF3-HLF itself appears to inhibit apoptosis.122 A zinc-finger transcriptional repressor, SLUG, which functions as an antiapoptotic factor in normal hematopoietic progenitor cells, is aberrantly upregulated by TCF3-HLF.123
Acute Lymphoblastic Leukemia with ETV6-RUNX1 (TEL-AML1) Rearrangements
The t(12;21) translocation forms a chimeric gene consisting of the 5′ portion of the ETV6 gene (also known as TEL) and the nearly complete RUNX1 gene (also known as AML1 or CBFA2).118 This translocation can rarely be identified by conventional cytogenetic banding techniques but can frequently be detected by fluorescence in situ hybridization. The nontranslocated ETV6 allele is frequently deleted. The ETV6-RUNX1 gene fusion is the most common genetic abnormality in pediatric ALL (approximately 20% of cases). In some series, the ETV6-RUNX1 abnormality was not significantly prognostic,124,125 whereas in others it defined a subgroup with excellent prognosis.126–129 ALL cells bearing this abnormality do not show a distinctive propensity to apoptosis.106 Reportedly, however, they have an increased in vitro sensitivity to l-asparaginase,130 as well as to doxorubicin, etoposide, amsacrine, and dexamethasone.131 Similar to T-cell ALL, blast cells with either ETV6-RUNX1 or TCF3-PBX1 fusion accumulate significantly lower levels of methotrexate polyglutamates than those with other genetic abnormalities, suggesting that patients with these genotypes might benefit from an increased dose of methotrexate.132
The ETV6 gene belongs to the Ets family of transcription factors. ETV6 functions as a sequence-specific DNA-binding transcription regulator. It is normally widely expressed and appears to have an essential role in yolk sac angiogenesis, neuronal development, and the establishment of bone marrow hematopoiesis,133 and is a regulator of hematopoietic stem cell survival.134 RUNX1 encodes a transcription factor that binds DNA as a heterodimer with CBF β and is essential for the development of definitive hematopoiesis.133 In addition, the ETV6-RUNX1 protein represses AML1-mediated transcriptional activation through a dominant negative mechanism.133 In general, expression of the ETV6-RUNX1 fusion alone is not sufficient to generate leukemia in animal models and additional cooperating mutations must occur.135,136 Retroviral transduction of murine bone marrow cells with ETV6-RUNX1 caused the occurrence of leukemia resembling ALL in some transplanted mice but this event was more frequent if Arf was inactivated.137 Expression of ETV6-RUNX1 in human cord blood progenitor cells led to the expansion of a putative preleukemic population that had a growth advantage in the presence of transforming growth factor-β.138,139 ETV6-RUNX1 reportedly binds to Smad3, a transforming growth factor-β signaling target, resulting in a lower sensitivity to transforming growth factor-β–mediated inhibition of proliferation.139
Acute Lymphoblastic Leukemia with MLL Gene Rearrangements
Structural alterations involving band 11q23 of chromosome 11 are the most frequent cytogenetic abnormality in infant ALL.140 In most cases, the target is a gene designated MLL, for mixed-lineage leukemia (also known as HRX, ALL-1, and TRX1).118 The most common 11q23 abnormality in ALL is the t(4;11), which produces a chimeric protein that contains the N-terminal portion of MLL linked in-frame to the C-terminal portion of AFF1 (also known as AF-4). However, MLL has been reported in translocations with more than 50 partner genes in cases of leukemia. MLL is crucial for embryonic development and hematopoiesis; it normally regulates expression of HOX genes.118 The leukemia-associated alterations in MLL directly disrupt both of these crucial activities.
The prognosis of leukemias with an MLL rearrangement varies according to the partner gene, age of the patient, and the treatment administered. Treatment outcome differs by age group with infants having the worst outcome.142–142 Infant MLL-AFF1 ALL has a high prevalence of immature, nonproductive and/or oligoclonal antigen-receptor gene rearrangements.141,142
Cells in MLL-rearranged ALL have a characteristic gene expression profile, which differs from that of other ALL subtypes, including other cases of infant leukemia.143,144 Overexpressed genes include several genes normally expressed in nonlymphoid hematopoietic cells, such as FLT3, LMO2, and HOX genes (e.g., HOXA9, HOXA5, HOXA4, and HOXC6),143,145 and the antiapoptotic gene MCL1.146 MLL is essential for embryonic development and hematopoiesis, and MLL fusion proteins are sufficient to transform hematopoietic cells into leukemia-initiating cells.147 In one study, however, lentiviral transduction of MLL-AFF1 in cord CD34+ hematopoietic progenitor cells increased their growth but was not sufficient to initiate leukemogenesis.148 Genome-wide SNP array analysis showed that gene copy number abnormalities are lacking in MLL-rearranged ALL, supporting the notion that MLL abnormalities are sufficient to drive the onset of leukemia.68,149 MLL-rearranged ALL has significant promoter CpG island hypermethylation as compared to other ALL subtypes,152–152 which also affects microRNA expression.153 Treatment with the DNA methyltransferase inhibitor decitabine caused reexpression of some of the genes silenced by methylation and resulted in cytoxicity.152
Acute Lymphoblastic Leukemia with BCR-ABL1 Rearrangements
The t(9;22)(q34;q11) encodes a chimeric gene consisting of the 5′ portion of BCR fused to the 3′ portion of ABL1.154 In CML, breaks occur most often within the major breakpoint cluster region of BCR and encode a 210-kilodalton (kDa) BCR-ABL chimeric tyrosine kinase. In ALL, breaks tend to occur in the minor breakpoint cluster regions, forming a 190-kDa BCR-ABL.155 In each fusion protein, N-terminal sequences of ABL are replaced by BCR sequences. This alteration results in a constitutively active ABL tyrosine kinase that induces aberrant signaling and activates multiple cellular pathways.154 Expression of either chimeric protein results in malignant transformation of hematopoietic cells and causes leukemia in murine experimental systems.156,157 In mice, aggressiveness of BCR-ABL leukemias is enhanced if the activity of the Arf tumor suppressor is compromised.158 Genome-wide analysis of BCR-ABL1 ALL found deletions of IKZF1 in more than 80% of cases; these deletions were also detected in 70% of CML lymphoid blast crisis but not in chronic-phase CML samples.159
As a group, ALL with BCR-ABL1 fusion has been associated with poor response to conventional chemotherapy.160 The development of the tyrosine kinase inhibitor imatinib mesylate (Gleevec or Glivec) has provided a way to turn off molecular mechanisms that drive leukemic cell growth in this subtype of ALL.154 The addition of imatinib increased the frequency of complete remissions and allowed more adults with ALL and BCR-ABL1 to undergo allogeneic transplantation.161 Leukemic cells may develop resistance to this tyrosine kinase inhibitor, and clones with mutations in the BCR-ABL1 kinase domain may outgrow.162 Imatinib has produced encouraging results in children with this disease, and resulted in comparable early disease-free survival rates between patients treated with or without allogeneic transplantation.163 Efforts to enhance efficacy have led to the development of second-generation inhibitors, such as nilotinib and dasatinib,164–167 which are currently being tested in pediatric BCR-ABL1 ALL.168
Acute Lymphoblastic Leukemia with c-MYC Rearrangements
Most B-cell ALL cases have the t(8;14) translocation; less frequently, they have the t(2;8) or the t(8;22).79 These translocations juxtapose the c-MYC protooncogene on chromosome 8 with the IGH@, IGK@ and IGL@ loci on chromosomes 14, 2, and 22, respectively. These rearrangements dysregulate the expression of c-MYC (a transcription factor), resulting in altered cell proliferation and survival.169,170
Genetic Abnormalities in T-cell Acute Lymphoblastic Leukemia
Genes that are dysregulated in T-cell ALL include SCL (TAL-1), LMO1 (TTG-1), LMO2 (TTG-2), and HOX11.57 As a result of the t(1;14), SCL (a gene involved in early hematopoiesis) is inserted into the TCRAD@ locus on chromosome 14; an internal deletion in the 5′ untranslated region of SCL is found in an additional 25% of T-lineage ALL cases. This deletion juxtaposes a locus called SIL with the SCL coding region, resulting in the expression of a fused SIL-SCL transcript that encodes a normal SCL protein.
The t(11;14)(p15;q11) inserts LMO1 into the TCRAD@ locus, whereas the t(11;14)(p13;q11) places LMO2 in this locus. The LMO1 and LMO2 proteins, which are then inappropriately expressed, contain two zinc-binding domains and participate in multiprotein DNA-binding complexes. LMO2, like SCL, plays an essential role in the development of primitive and definitive hematopoiesis.171 Activation of LMO2 by retroviral insertion in its proximity has been implicated in the development of T-cell ALL in patients with X-linked severe combined immunodeficiency who received hematopoietic stem cells transduced with the IL2GR gene.172,173An additional alteration found in T-cell ALL is the deletion from chromosome 9p21of the INK4a and INK4b genes, which encode the p16INK4a and p15INK4b inhibitors of the Cdk4 cyclin D-dependent kinase.174 This locus, which is deleted in more than 50% of T-lineage cases, also encodes another cell-cycle regulatory protein, p19ARF, which arrests cell-cycle progression through p53.175
ABL1 gene fusions, including NUP214-ABL1 (found in up to 6% of cases), EML1-ABL1, BCR-ABL1 and ETV6-ABL1, can occur in T-cell ALL.176
Genetic Abnormalities in Acute Lymphoblastic Leukemia Identified by Genome-Wide Expression and Association Studies, and Genomic Sequencing
ALL cells have characteristic gene expression profiles that can discriminate B-lineage and T-lineage ALL, and various genetic subtypes.5,7,143,177–179 Moreover, they can also identify novel subgroups among cases lacking defining chromosomal abnormalities.5,7,180 Subtypes of T-ALL express different levels of HOX11, TAL1 and LYL1.6 Somewhat disappointingly, more than a decade after its introduction and despite its considerable potential, this technology has not yet been implemented into clinical practice for leukemia subclassification or treatment stratification.
Genome-wide copy number abnormalities and loss of heterozygosity can be screened by using high-resolution SNP arrays. By using this method, abnormalities in genes encoding important regulators of B-cell differentiation were identified in more than 40% of B-lineage ALL cases.68 About one-third of cases had deletions and translocations of the PAX5 gene, and alterations of other genes critical for B-cell development, for example, TCF3, EBF, LEF1, IKZF1 and Aiolos.68 As mentioned earlier, IKZF1 deletions were detected in most cases of BCR-ABL1 ALL,159 whereas activating mutations in the Janus kinases JAK1, JAK2, and JAK3 were detected in 11% of high-risk (BCR-ABL1-negative) ALL cases, resulting in constitutive JAK-STAT activation.181 About half of the children with Down syndrome and ALL, as well as 7% of non-Down syndrome cases with B-lineage ALL, show increased CRLF2 expression with or without a corresponding genomic lesion (IGH@-CRLF2, P2RY8-CRLF2, CRLF2 F232C),182,183 commonly with a concomitant JAK1/2 sequence mutation. CRLF2 encodes a protein that interacts with the interleukin-7 receptor (IL7R) to form a heterodimeric receptor for the cytokine TSLP.182 Of note, gain-of-function mutations in the IL7R gene have also been found in both B- and T-lineage ALL.186–186
Activating mutations of NOTCH1 are frequent in T-ALL and have been implicated in its pathogenesis.63 About half of the cases of T-ALL have alterations of the gene encoding for PTEN, PI3K, or AKT,187 and 16% were reported to have deletions or sequence alterations of LEF1.188 Another 16% of cases have inactivating mutations and deletions of the PHF6 gene, which was associated with overexpression of the transcription factors TLX1 and TLX3.189
A study reported cases of T-ALL with either ectopic expression of NKX2-1 or NKX2-2 or overexpression of the MEF2C transcription factors.190 Expression of the chemokine receptor CCR7 has been implicated in CNS infiltration of T-ALL cells in murine models.191
A recent whole genome sequencing study elucidated the genetic basis of ETP-ALL.186 It identified inactivating mutations of genes (EP300, ETV6, GATA2, GATA3, IKZF1, RUNX1) with the potential of blocking lymphoid development at the ETP stage of T-cell differentiation. Moreover, activating mutations in genes regulating histone modification (EZH2, EED, SUZ12, SETD2, EP300) and cytokine receptor signaling (NRAS, KRAS, FLT3, IL7R, JAK3, JAK1, and BRAF) were also demonstrated, with a mutational spectrum resembling that observed in AML.
Acute Myeloid Leukemia
Acute Promyelocytic Leukemia with t(15;17)
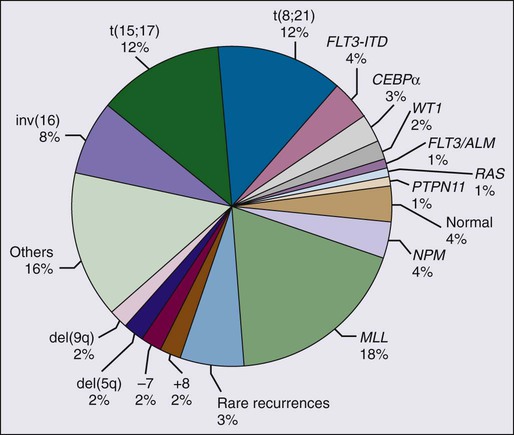
The major cytogenetic and molecular subgroups of childhood AML are summarized in Figure 96-3. Acute promyelocytic leukemia (APL) accounts for approximately 10% of childhood AML cases, and more than 95% of cases of APL show the presence of a t(15;17)(q22;q11) chromosomal translocation. As a result of this translocation, the retinoic acid gene (RARA) on chromosome 17 is fused to the PML gene on chromosome 15, resulting in the formation of a PML-RARA chimeric protein.192 The translocation gives rise to two fusion transcripts: PML-RARA, which is expressed in all cases, and RARA-PML, which is expressed in approximately 80% of cases.192
The PML-RARA gene fusion can cause a syndrome similar to APL in transgenic mouse models.193,194 PML-RARA binds DNA via the RARA domain and acts as a transcriptional repressor. This effect, which should result in a block in myeloid differentiation, may be enhanced by various partners which bind to PML, such as the transcriptional corepressor DAXX, the nuclear receptor corepressors SMRT or NCOR, histone deacetylases, polycomb group proteins, and DNA-methylating complexes. PML-RARA can also affect the transcription of genes beyond those targeted by RARA, partly because of the formation of complexes with other DNA-binding proteins.192 In addition, PML-RARA disrupts PML nuclear bodies; the resulting redistribution of PML might interfere with the growth regulatory activities of PML.195 Pharmacologic doses of all-trans retinoic acid (ATRA) lead to conformational changes in PML-RARA that are sufficient to revert its repressor activity, allowing the recruitment of transcriptional coactivators, including CBP and p300.192,196 However, mutations of the RARA binding domain may lead to resistance to ATRA.197 Arsenic trioxide (As2O3) is another effective treatment for APL but it does not appear to affect transcription in the major way as ATRA does and its precise mechanisms of action in terms of induction of differentiation versus cytotoxicity remain to be fully elucidated.192
Two variants of the t(15;17) translocation have been identified: the t(5;17), which encodes an NPM-RARA fusion oncoprotein,198 and the t(11;17), which encodes a PLZF-RARA fusion protein.199 The latter chimeric protein forms a stable complex with nuclear corepressors and histone deacetylases and is unresponsive to either retinoic acid or ATRA. Thus cases of AML with the t(11;17) have APL morphology but are unresponsive to treatment with ATRA.
Acute Myeloid Leukemia with Alterations of the Core Binding Factor Complex
The RUNX1/CBF β (CBFB) transcription factor complex is essential for normal hematopoiesis.202–202 The two most common chromosomal rearrangements in de novo AML are the t(8;21)(q22;q22) and inv(16)/t(16;16), found in approximately 12% and 6% of cases, respectively.4,203 The t(8;21) targets RUNX1 and inv(16)/t(16;16) targets CBFB.
The t(8;21)(q22;q22) translocation is seen almost exclusively in cases of AML with FAB M2 morphology and accounts for up to 40% of these cases.203 This translocation results in a fusion between RUNX1 (also called AML1, CBF protein α, and PEBP2 α B) and the eight twenty-one (ETO) gene (also known as MTG8) on chromosome 8.201 ETO is the mammalian homolog of the Drosophila gene nervy. The Nervy homology 2 (NHR2) domain in ETO mediates oligomerization and the interactions of the fusion protein with ETO itself as well as MTGR1, MTG16, and corepressor molecules mSin3A and HDAC1 and HDAC3.204 In turn, this contributes to suppress myeloid differentiation and enhance the clonogenic potential of myeloid progenitors.204 The Runt domain of RUNX1 mediates both binding to both DNA and to CBFB. It has been proposed that the leukemogenic effect of RUNX1-ETO is primarily mediated by its DNA binding properties,205 but there is evidence indicating that CBFB contributes to the cellular effects of RUNX1-ETO, such as the enhancement of the clonogenic potential of bone marrow cells, and it is indispensable in leukemogenesis.206 It was shown that RUNX1-ETO is acetylated by the transcriptional coactivator p300 in AML cells, and that this is critical for leukemogenesis, suggesting that lysine acetyltransferases could represent a potential therapeutic target.207
Expression of RUNX1-ETO during murine development through a gene-targeting strategy resulted in an embryonic lethal phenotype that was almost identical to that observed with the loss of RUNX1 or CBFB.200,208 Unlike RUNX1- or CBFB-deficient embryos, which lack detectable hematopoietic progenitors, RUNX1-ETO-expressing embryos contained dysplastic multilineage hematopoietic progenitors with an abnormally high self-renewal capacity. In a conditional “knock-in” mouse, RUNX1-ETO did not block myeloid cell differentiation, nor was it sufficient to induce leukemia.209 However, induction of cooperating mutations resulted in the development of an AML-like disease that resembled human AML1-ETO−associated leukemia.209 AML1-ETO is degraded by treatment with histone deacetylase inhibitors,210 providing a molecular basis for the use of this class of drugs in this type of AML. A recent study indicated that oridonin could bind to RUNX1-ETO, directing its enzymatic cleavage; the truncated protein interfered with the function of the uncleaved RUNX1-ETO and inhibited the potential for leukemogenicity.211
The inv(16)(p13q22) and the variant translocation t(16;16) result in the formation of a chimeric gene consisting of the 5′ portion of CBFB fused to a variable length of the 3′ portion of the smooth muscle myosin heavy chain gene, MYH11.201,202 The encoded CBFB-MYH11 product continues to bind to RUNX1.212 The genetics of the inv(16) chromosomal rearrangement suggest that the encoded product functions in a dominant manner to induce leukemia.213 Further, CBFB-MYH11 has been shown to directly repress AML1-mediated transcription by sequestering RUNX1 into inactive cytoplasmic complexes that are attached to actin-containing filamentous structures.214
When CBFB-MYH11 expression was induced during murine embryogenesis, it resulted in a phenotype nearly identical to that observed with the loss of RUNX1 or CBFB.215 However, CBFB–MYH11 also caused an abnormal shift of primitive erythropoietic differentiation toward immature to mid-mature cells. This result suggests that the chimeric product not only inhibits normal RUNX1/CBFB activity but also provides other signals that result in abnormalities in cell growth and development.215 Definitive hematopoiesis can be restored in CBFB-deficient mice by ectopic expression of CBFB transgenes but not transgenes encoding CBFB–MYH11.216 Transduction of CBFB-MYH11 into human CD34+ cells leads to their abnormal proliferation.217
Acute Myeloid Leukemia with Alterations of MLL
As discussed in the ALL section above, translocations involving 11q23 and the MLL gene result in a gain of MLL function by generating novel chimeric proteins containing the amino terminus of MLL fused in-frame with one of many partner proteins of diverse function. Translocations involving 11q23 are found in 16% to 18% of childhood AML cases.202,203 The two most common 11q23 translocations in AML, t(9;11)(p22;q23) and t(11;19)(q23;p13.3), involve MLLT3 (also known as AF9) and MLLT1 (or ENL), respectively. Both molecules are homologous to proteins involved in RNA polymerization. When MLL–MLLT3 was expressed in mice through a “knock-in” strategy, mice developed AML,218 as did mice in which hematopoietic stem cells had been transduced with MLL-MLLT1.219 Other MLL fusions involving the forkhead transcription factors FKHRL1 and AFX220 and the leucine zipper MLLT10 (or AF10)221 can also induce leukemia in mice when expressed in murine hematopoietic cells. It was shown that that enforced MLL-MLLT3 expression in discrete populations of more differentiated hematopoietic progenitors can also initiate leukemia and that self-renewing cells are frequent, accounting for up to 30% of myeloid cells and express mature myeloid antigens.147,222 Several factors reportedly cooperate with MLL-MLLTI in inducing leukemogenesis, including the protooncogene EVI1,223 the methyltransferase Dot1I,224,225 AKT/FOXO,226 the BET family of chromatin adaptor proteins,227 the polycomb group protein CBX8,228 the histone demethylase KDM1A,229 and others.230
Acute Myeloid Leukemia with Other Genetic Abnormalities
Fms-like tyrosine kinase 3 (FLT3) (also known as fetal liver kinase 2 [flk2] or stem cell tyrosine kinase 1 [STK-1]) is receptor tyrosine kinase that regulates the growth of hematopoietic cells by interacting with its ligand.231 Internal tandem duplications (ITDs) of the FLT3 gene have been reported in approximately 20% of adult AML and 10% to 12% of childhood AML cases.234–234 FLT3 ITDs result in ligand-independent hematopoietic cell growth and induce a myeloproliferative syndrome in murine models.235 FLT3 ITDs are associated with a poor response to chemotherapy and dismal prognosis.234–234 The incorporation of FLT3 kinase inhibitors into current treatment protocols might offer opportunities to improve outcome.236–243
Mutations of the nucleophosmin (NPM1) gene mutations occur in 50% to 60% of adult AML with normal karyotype.244 The prevalence of NPM1 mutations is lower in childhood AML than in the adult counterpart, and account for approximately 8% of cases.247–247 NPM1 encodes a nucleocytoplasmic shuttling protein mainly localized in the nucleolus, but NPM1 mutants localize aberrantly in the leukemic cells cytoplasm, thus allowing the identification of these leukemias by immunocytochemistry.244 In adult AML, NPM1 mutations in the absence of FLT3 ITD and the presence of a normal karyotype identify a prognostically favorable subgroup.248 Childhood AML cases with mutated NPM1 typically have a normal karyotype and tend to occur in older patients.247–247
TET2 mutations are found in 10% to 20% of adult AML,249,250 but one study detected them in only 4 of 104 cases of childhood AML.251 Recurrent mutations in isocitrate dehydrogenase 1 (IDH1) and IDH2 have been reported in about one-third of adult AML cases and are found in a mutually exclusive fashion.254–254 They can catalyze the production of 2-hydroxyglutarate from α-ketoglutarate, prevent histone demethylation and cell differentiation.255 A study of 460 childhood AML cases found somatic IDH1 mutations in eight and IDH2 mutation in 10; IDH mutations were associated with NPM1 mutations.256 Other studies detected IDH1 mutations in around 1% and IDH2 mutations in around 2% of childhood AML cases.257,258
Down syndrome patients are highly predisposed to acute megakaryoblastic leukemia, which has a treatment outcome that is more favorable than in non-Down syndrome patients.24,259 A characteristic feature is the presence of somatic mutations of the gene encoding transcription factor GATA1, leading to exclusive expression of a truncated form GATA1.260,261 Leukemia blasts express both erythroid and megakaryocytic markers, suggesting transformation of an erythroid/megakaryocyte precursor of fetal origin.24,259–261
Genetic Alterations in Myelodysplastic Syndrome and Juvenile Myelomonocytic Leukemia
An abnormal karyotype is found in 55% of children with advanced primary MDS and in 76% with secondary advanced MDS.13,262 Monosomy 7, trisomy 8 and trisomy 21 are the most common numerical abnormalities.13,263 Children affected by congenital syndromes such as neurofibromatosis type I (NF1), Noonan syndrome, or Cbl syndrome are at a higher risk of developing JMML.264 Mutations in one of five genes (NF1, NRAS, KRAS, PTPN11, and CBL) are characteristic of JMML and encode proteins predicted to activate the Ras/MAPK pathway.264
Genetic Abnormalities in Acute Myeloid Leukemia Identified by Genome-Wide Expression and Association Studies, and Genomic Sequencing
Gene expression profiling reliably distinguishes AML from ALL.179–179 A similar discrimination can also be achieved by studying microRNA expression.265
An early study of 130 diagnostic samples of childhood AML with Affymetrix 133A microarray identified discriminating genes for all major genetic subtypes, including t(15;17)/PML-RARA, t(8;21)/RUNX1-ETO, inv(16)/CBFB-MYH11, MLL chimeric fusion genes, and cases classified as FAB-M7.8 Interestingly, the expression signatures generated from the pediatric samples could accurately classify adult de novo AMLs with the same lesions. By combining data sets of 130 AMLs and 137 ALLs, it was possible to identify a gene expression signature for cases with MLL chimeric fusion genes irrespective of lineage.8
Clinical Course and Prognostic Factors
Relapse
Relapse is defined as the reappearance of leukemic cells at any site after remission has occurred. Most relapses occur during treatment or within the first 2 years after its completion, although ALL has been observed to relapse as late as 10 years after diagnosis.266 The bone marrow is the most common site of relapse in both ALL and AML. In children with ALL, the frequency of relapse in extramedullary sites, such as the CNS and testes, has decreased to less than 5% and 2%, respectively. Leukemic relapse occasionally occurs at other sites, including the eye, ear, ovary, uterus, bone, muscle, tonsil, kidney, mediastinum, pleura, and paranasal sinus. Extramedullary relapse in children with ALL frequently presents as an “isolated” finding, but most occurrences are associated with minimal residual disease (MRD) in the bone marrow.267,268
A small fraction of patients experience a recurrence of acute leukemia with an immunophenotype different from that determined at diagnosis. Often, these leukemias are secondary malignancies caused by the mutagenic effects of leukemia treatment.42 In some cases, recurrent leukemia has genetic features that confirm its relationship to the original leukemic clone but has the phenotype of a different lineage (lineage switch). There are reports of leukemias morphologically and immunophenotypically characterized as ALL that relapse as AML (or vice versa) while retaining the karyotypic and molecular features of the original clone.269,270 Some cases of ETP-ALL that relapse might appear as AML, but cell subsets retaining the ETP immunophenotype are usually detectable.89 A study found that in about one-third of late-relapse T-ALL, TCR gene rearrangement sequences were different from those identified at diagnosis, suggesting a second T-ALL rather than a recurrence of the original leukemic clone.271 Genome-wide analysis detected different genetic abnormalities at diagnosis and relapse in several paired samples, with backtracking studies showing that the predominant clone at relapse was often present as a minor clone at diagnosis.272 It was also found that 18% of relapse cases had mutations of CREBBP, which encodes the transcriptional coactivator and histone acetyltransferase CREB-binding protein, resulting in impaired histone acetylation and transcriptional regulation.273 Greaves proposed a model of leukemia clonal evolution that includes a genetic heterogeneity of propagating cells, based on the observation that subclones within an ALL clone have distinct genetic profiles forming altogether a complex nonlinear, branching structure.274
Bone marrow relapse, with or without extramedullary involvement, predicts a poor outcome for most patients; patients with isolated bone marrow relapse generally fare worse than those with combined bone marrow and extramedullary relapse.19,275 In either ALL or AML, the duration of the second remission depends on the duration of the first remission.4 In children with relapsed ALL, factors indicating an especially poor prognosis are short initial remission and T-cell immunophenotype. Other adverse factors include t(9;22), presence of circulating blast cells, or a high leukocyte count at relapse.278–278 Most patients with first relapse ALL achieve a second complete remission but the probability decreases for patients with early relapse; less than a half of those with second marrow relapse achieve complete remission and the probability further decreases for those in third relapse.279 The presence of MRD at the end of second remission induction is a strong adverse prognostic indicator.282–282 Although chemotherapy may secure a prolonged second remission in children with ALL who experience late relapse (e.g., more than 6 months after cessation of therapy), allogeneic hematopoietic stem cell transplantation is the treatment of choice for patients who experience hematologic relapse during therapy or shortly thereafter and for those with T-cell ALL. Among patients with isolated CNS relapse, a long initial remission and a standard-risk status by National Cancer Institute/Rome criteria (i.e., age 1 to 9.9 years and leukocyte count <50 × 109/L at initial diagnosis) were independent favorable prognostic features.283 In children with relapsed AML, outcome is generally poor.284 Relapse occurring at less than 18 months after therapy, and M5 or M7 morphology are associated with a dismal prognosis.19,285
Prognostic Factors in Acute Lymphoblastic Leukemia
Stringent evaluation of the risk of relapse is needed at the time of diagnosis to direct therapy so that patients are neither overtreated nor undertreated. Although age, leukocyte count, leukemic cell genotype, and response to early remission induction therapy are commonly used in risk classification, there is no consensus on the most useful criteria, and there is also no widely accepted system or terminology for defining risk groups. For example, patients have been classified as lower risk, intermediate risk, and higher risk by the Children’s Cancer Group286; as standard risk, medium risk, or high risk by the Berlin-Frankfurt-Münster Consortium287; and as low risk, standard risk, or high risk by St. Jude Children’s Research Hospital.104 In this chapter, we use the St. Jude risk classification system, which is based on presenting features and on results of treatment response based on MRD assays. It should be noted that infants younger than 12 months of age are generally treated by using separate protocols.
The type of treatment regimen remains the most important determinant of outcome. Thus clinical and biological variables may lose their predictive strength when treatment is changed. Presenting age and leukocyte count have generally maintained prognostic strength in B-lineage but not T-lineage ALL.286,288,289 Even in B-lineage ALL, however, their value is limited because as many as 20% of patients who are considered at standard risk by these criteria (age 1 to 9 years with leukocyte count <50 × 109/L) may relapse, and very high-risk cases that require allogeneic hematopoietic stem cell transplantation cannot be reliably distinguished from high-risk cases by these criteria. Of note, a recent study showed that adolescents (age 15 to 18 years) with ALL, a group that historically had a worse prognosis, can attain cure rates similar to those of younger patients with contemporary chemotherapy.290 Likewise, the poor prognosis of male sex observed in some protocols,286,287,291,292 can be abolished by improved treatment.104,288,293 In the studies of the Children’s Oncology Group, African American patients and those with Native American ancestry had a significantly worse outcome than whites, after adjustment for other prognostic features.294,295 By contrast, African Americans fared as well as whites in our single-institution protocols, a finding we attributed to equal access to effective contemporary treatment for both groups of patients.18,296,297 A study of genome-wide germline SNP genotypes showed that Native American ancestry was associated with a higher risk of relapse, which could be reduced by the additional delayed intensification chemotherapy.298
Primary genetic abnormalities of leukemic cells influence their aggressiveness and response to therapy, but are not 100% predictive of outcome. For example, as many as 15% of children with favorable genetic features (ETV6-RUNX1 fusion and hyperdiploidy >50 chromosomes) may eventually experience relapse, whereas approximately one-third of those with high-risk abnormalities [the Philadelphia chromosome with BCR-ABL1 fusion or the t(4;11) with MLL-AFF1 fusion] can be cured with chemotherapy alone.3,104,128,129,140,160,286,287,299–302 A subset of patients has a gene expression profile similar to that of BCR-ABL1–positive cases.180 These cases have a high prevalence of IKZF1 deletions, a genetic abnormality that predicts poor early treatment response and a high risk of relapse.303 JAK mutations or CRLF2 rearrangements have also been associated with a poorer outcome.304 Other genetic features associated with a poorer prognosis include hypodiploidy (<44 chromosomes),116,117 and the TCF3–HLF gene fusion.305 With contemporary treatment, patients with TCF3-PBX1 ALL (a historical high-risk group) have an overall excellent response to initial therapy,104 but retain an increased risk of leukemia relapse in the CNS.306
The ETP-ALL subset has a dismal outcome, among the worse for all subtypes of childhood leukemia.89,307 Among other T-ALL cases, NOTCH1 mutations have been associated with a favorable prognosis or had no prognostic impact.308–311 The most reliable adverse prognostic feature is a high level of MRD after remission induction therapy, because this factor accounts for the entire constellation of leukemia cell biological features (intrinsic drug sensitivity), host pharmacogenetics, leukemic cell microenvironment, treatment adherence, and efficacy of treatment.312 However, a recent large international collaborative study showed that remission induction failure (i.e., the presence of 5% of more blasts at the end of remission induction) failed to predict adverse outcome of B-cell precursor ALL with hyperdiploidy greater than 50 chromosomes or ETV6-RUNX1.313 This is probably because effective treatment components for these genotypes (high-dose methotrexate and mercaptopurine) tend to be used only after remission induction.
Prognostic Factors in Acute Myeloid Leukemia
Patients with APL have a relatively favorable prognosis. Patients with Down syndrome and AML often have a favorable response to therapy and require less intensive chemotherapy.24 Age younger than 2 years and leukocyte count less than 100 × 109/L were significantly associated with better outcome in some series.314 There is also data suggesting that children younger than 10 years benefit more than older children from intensive therapies.315 Although African American children had inferior outcome in some studies,316 this was not the case in recent St. Jude studies.297,317
Cytogenetic and molecular genetic features have become the most important presenting prognostic factors and are used in risk-adapted therapy in AML. In the Medical Research Council (MRC) AML10 trial, the 5-year overall survival estimates for patients with t(8;21) and inv(16) were 69% and 61%, respectively.318 A subsequent analysis of patients treated in the MRC studies confirmed that t(8;21) and inv(16) [together with t(15;17)] are independent good risk features, and identified loss of a sex chromosome in the 8;21 group as being associate with excellent outcome.319 The Pediatric Oncology Group (POG) reported 4-year overall survival estimates of 52% and 75% for children with similar karyotypes treated on the 8821 trial.203 A similar result has been achieved at St. Jude, with 6-year overall survival estimates of 55% for cases with t(8;21) and 70% for cases with inv(16) treated in recent trials.285 In the most recent St. Jude AML02 trial, 3-year event-free survival for the group of patients with either t(8;21)/RUNX1-ETO or inv(16)/CBFB-MYH11 was 86%.320 An analysis of the Berlin-Frankfurt-Münster (BFM) AML98 study confirmed the favorable prognosis of these cytogenetic abnormalities.321
AML patients with the t(9;11) also have had a favorable prognosis in some trials,322,323 but not in others.203 In the MRC AML10 trial, patients with the t(9;11) had an intermediate outcome, with a 3-year overall survival estimate of 50%,318 whereas patients with this or other 11q23 abnormalities had a rather poor outcome on POG 8821 (4-year overall survival 33%).203 In the BFM AML98 study, patients with an MLL gene rearrangement had an inferior outcome overall, particularly those with t(9;11) and additional aberrations, MLL rearrangements other than t(9;11) and t(11;19).321Among patients treated for AML in St. Jude trials from 1987 to 2002, those with the t(9;11) and inv(16) had a better outcome (5-year event-free survival estimate, 70% or higher) than patients in all other cytogenetic or molecular subgroups.285 In the subsequent AML02 trial, patients with the t(9;11) had a 3-year event-free survival of 67%, not significantly better than that of the remaining patients.320 In an international study of 756 children with 11q23- or MLL-rearranged AML, the overall 5-year event-free survival was 44%; patients with t(1;11)(q21;q23) had the best outcome (92%) and those with t(6;11)(q27;q23) the worst (11%).324 Patients with NPM1 mutations reportedly have a relatively favorable outcome,247,325 whereas those with complex karyotypes or monosomy 7 reportedly have an inferior outcome.321
Patients with acute megakaryoblastic leukemia (AML M7), with the exception of those with the t(1;22)/OTT-MAL, have significantly worse outcomes than other subtypes of AML.326,327 In the St. Jude AML02, patients with AML M7 without the t(1;22)/OTT-MAL had a 3-year event free survival of 37%, significantly inferior to that of the remaining patients (67%); this feature remained an adverse prognostic factor in a multivariable analysis.320 The outcome of treatment-related AML is also dismal, with survival rates of only 10% to 20%, despite the use of allogeneic hematopoietic cell transplantation.330–330 Likewise, patients with MDS, AML arising from MDS, or AML with monosomy 7 often have resistant disease that is difficult to cure.203,263,318,331
FLT3 ITD have been associated with a poor prognosis in both adults and children with AML.234,325,332–337 An analysis of 91 children with ALL treated on Children’s Cancer Group (CCG) trials demonstrated an 8-year event-free survival estimate of only 7% for the 15 cases with FLT3 ITD.335 In a subsequent study of 77 FLT3/ITD-positive patients, these investigators found that the length of the duplicated region varied from 6 to 51 amino acids, and patients with longer ITDs had a worse relapse-free survival (19% vs. 51%, P = 0.035).234 Gene expression studies in samples with FLT3 mutations identified an association between high expression of the RUNX3 gene, low expression of the ATRX gene and an inferior outcome.338 Patients with FLT3 ITD typically have higher levels of MRD after remission induction therapy.320,339
Prognosis of Myelodysplastic Syndrome and Juvenile Myelomonocytic Leukemia
The clinical course of children with MDS is variable. The conversion rate to AML of approximately 40% is similar to that observed in adults.263 MDS conversion to AML may occur either with an abrupt increase in blasts or through a gradual progression.13 In only approximately 15% of JMML patients the disease transforms into acute leukemia blasts crisis.263 However, only a very small minority of patients enjoy long-term survival with a relatively indolent disease or spontaneous resolution, which is unpredictable.14 For the majority of patients, the disease course is rapid and fatal within a year. Patients with older age, a low platelet count and high fetal hemoglobin levels fare worse. Stem cell transplantation is considered the standard of care.14 A genome-wide gene expression study in samples of patients with JMML split them into two major groups: 20 had a profile resembling AML and a 10-year probability of survival of 7%; the other 20 had a different gene expression profile and 74% probability of survival.340
Primary Treatment
Acute Lymphoblastic Leukemia
Overview
In the more successful contemporary clinical trials, 5-year event-free survival estimates for children with newly diagnosed ALL range from 76% to 86% (Table 96-5).104,286,287,289,291,292,341–350 The improved cure rate of ALL can be attributed mainly to the development of more effective chemotherapeutic regimens through successive clinical trials. In patients with mature B-cell ALL, short-term (2 to 8 months) regimens of intensive chemotherapy based primarily on cyclophosphamide, methotrexate, cytarabine, and intrathecal therapy currently result in cure rates of 74% to 87%.351–355 The development of a highly effective uricolytic agent, recombinant urate oxidase (rasburicase, Elitek, Fasturtec), improves the results of treatment by reducing early morbidity and mortality caused by tumor lysis syndrome and acute renal failure.356–359
Table 96-5
Results of International Studies of Childhood Acute Myelogenous Leukemia
| Study | Year | Eligible Age (years) | No. of Patients | % 5-Year Event-Free Survival (±1 SE) | |||
| B-Lineage* | |||||||
| Overall | Standard | High | T-Lineage | ||||
| AIEOP-91341 | 1995–2000 | ≤18 | 1743 | 77.1 ± 1.1 | 80.2 ± 1.2 | 69.4 ± 2.2 | 65.7 ± 3.5 |
| BFM-90287 BFM-05287 |
1990–95 1995–99 |
≤18 ≤18 |
2178 2169 |
78.0 ± 0.9 79.6 ± 0.9 |
87.4 ± 1.0 87.4 ± 0.9 |
66.3 ± 2.1 68.1 ± 2.1 |
61.1 ± 2.9 75.3 ± 2.6 |
| CCG-1800286 | 1989–95 | ≤21 | 5121 | 75 ± 1 | 80 ± 1 | 67 ± 2 | 73 ± 2 |
| COALL-CLCG-92342 | 1992–97 | ≤18 | 538 | 76.9 ± 1.9 | 82.1 ± 2.4 | 75.7 ± 3.9 | 71.2 ± 5.1 |
| DCLSG-9291 | 1997–2004 | 1-18 | 492 | 81 ± 1.4 | 86.9 ± 1.6 | 70.3 ± 3.1 | 72.2 ± 4/7 |
| DFCI-00-01541 | 1991–95 | 1-18 | 492 | 80 ± 2 | NA | NA | NA |
| EORTC-58881379,397,542 | 1989–98 | ≤18 | 2065 | 70.9 ± 1.1 | 78.4 ± 1.3 | 57.3 ± 2.4 | 64.4 ± 2.9 |
| NOPHO-2000345 | 2002–2007 | 1-15 | 1023 | 79.4 ± 1.5 | 85 ± 2 | 72 ± 3 | 64 ± 5 |
| POG543 | 1986–94 | ≤21 | 3828 | 70.9 ± 0.8 | 77.4 ± 0.9 | 55.3 ± 1.6 | 51.0 ± 2.4 |
| SJCRH-15104 | 2000–2007 | 1-18 | 498 | 85.6 ± 2.9 | 89.7 ± 3.7 | 82.4 ± 5.2 | 78.4 ± 7.8 |
| TCCSG-L95-14292 | 1994–99 | 1-15 | 597 | 76.8 ± 1.8 | 82.7 ± 2.0 | 67.4 ± 3.6 | 69.7 ± 6.2 |
| UKALL-97/99289 | 1999–2002 | 1-18 | 938 | 80.0 ± 1.3 | 83.1 ± 1.1 | 66.9 ± 1.7 | 68.6 ± 3.2 |
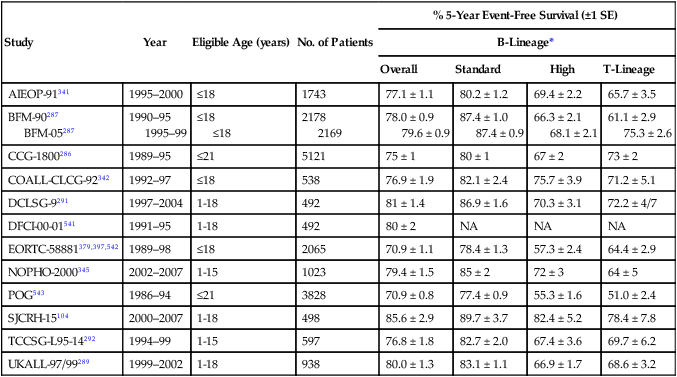
*Standard-risk group: Children 1 to 9 years old with leukocyte count <50 × 109/L; high-risk group: all others, except infants. Differences in “overall” partly reflects the disproportion of high-risk cases referred to some institutions compared with the others.
Remission Induction
Remission induction regimens include a glucocorticoid (prednisone, prednisolone, or dexamethasone), vincristine, and asparaginase with or without daunorubicin. With improved supportive care and chemotherapy, the rate of complete remission now ranges from 96% to 99%.104,286,287,289,291,292,341–350 Attempts have been made to intensify induction therapy, especially for patients with high-risk and very high-risk ALL, on the premise that a more rapid and profound reduction of the leukemic cell burden may forestall the development of drug resistance in leukemic cells. However, several studies suggest that intensive induction therapy may not be necessary for standard-risk patients, providing that they receive postinduction intensification therapy.286,342 Moreover, overly intensive induction therapy may lead to inferior overall outcome because of increased early morbidity and mortality.360,361 Furthermore, in our Total XV study,104 patients with an MRD level of 0.01% to less than 1% at the end of induction received intensified postremission therapy, and achieved a 5-year survival rate of 91%, a rate similar to that (95%) of patients who had negative MRD at the end of induction treatment. Hence, remission induction should be moderate in intensity for standard-risk patients and myelosuppressive therapy should be temporarily delayed in the presence of infection during induction, even in high-risk patients. To this end, we measure MRD level after 2 weeks of remission induction, and use the result to guide the intensity of the subsequent induction therapy. Most remission induction regimens include asparaginase. It should be noted that different forms of asparaginase have different pharmacokinetic profiles as well as toxicity and efficacy.360,362 Compared with Escherichia coli asparaginase, Erwinia asparaginase was associated with inferior antileukemic response but had lower toxicity, a result now attributed to the use of inadequate doses of the latter medication.363 Because of lower immunogenicity, less frequent administration, and the feasibility of intravenous administration, polyethylene glycol-conjugated asparaginase has replaced native E. coli asparaginase in initial treatment in many current protocols.362,364 Because of the cross-reactivity of antibodies to these two forms of asparaginase, patients with allergic reactions to either preparation should be treated subsequently with Erwinia asparaginase.365
Prednisone has traditionally been the glucocorticoid most commonly used in remission induction, but dexamethasone has increasingly replaced prednisone in recent clinical trials.366 Two recent studies showed that dexamethasone, given at 10 mg/m2 per day during remission induction, improved outcome in patients with T-cell ALL and a good response to 7 days of upfront prednisone treatment, and in children under 10 years of age with precursor B-cell ALL, compared with prednisone administered at 60 mg/m2 per day.367,368 However, it should be noted that the efficacy of prednisone and dexamethasone is dose dependent and when the dose ratio of prednisone to dexamethasone is greater than 7, event-free survival estimates are comparable with the two drugs, although dexamethasone still appears to yield improved CNS control.366 These findings notwithstanding, an excellent outcome can also be achieved with a relatively low dose of prednisone (40 mg/m2 per day) during remission induction, provided that postremission treatment is adequate and includes dexamethasone, as shown in our Total XV study.104 Dexamethasone at a dose of 10 mg/m2 is not recommended for remission induction in children 10 years of age or older with precursor B-cell ALL because of the high rates of toxicity and toxic death associated with the treatment,367 a finding partly related to the slower clearance of dexamethasone in this age group.369
Intensification or Consolidation
With restoration of normal hematopoiesis, patients in remission become candidates for intensification (consolidation) therapy. There is no dispute about the importance of this phase of therapy, but there is also no consensus about the optimal regimens and their duration. Delayed intensification with asparaginase, vincristine, and dexamethasone, with or without anthracycline, mercaptopurine and methotrexate, is the most widely used strategy in ALL protocols, and is beneficial to all patients.286,343,370 In Children’s Oncology Group studies, intensification treatment for 6 months is as effective as 10 months of such therapy for standard-risk patients and high-risk patients with a rapid early response.286 Whether high-risk slow early responders would benefit from prolonged intensification therapy remains uncertain.
The use of different intensification regimens in various clinical trials has also led to the identification of effective treatment components for certain subtypes of leukemia. For example, improved outcome of T-lineage ALL in the clinical trials of the Dana Farber Cancer Institute Consortium and CCG has been credited to the intensive use of asparaginase,293,343,371 a finding that has been corroborated by a randomized study of the POG.372 Interestingly, in the study of the Dana Farber Cancer Institute Consortium, patients who tolerated at least 26 weekly doses of asparaginase had a significantly better outcome than those who received fewer doses.293 Intensive asparaginase treatment is also credited for a very low rate of relapse of ALL with the ETV6-RUNX1fusion on the protocols of the Dana Farber Cancer Institute Consortium.293 In line with this clinical observation, leukemic blast cells with the ETV6-RUNX1 fusion are reportedly highly sensitive to asparaginase in vitro.130
Very high doses of methotrexate (5 g/m2) appear to improve outcome in patients with T-lineage ALL.287 This observation is consistent with the finding that T-lineage blast cells accumulate methotrexate polyglutamates (active metabolites of methotrexate) less avidly than do B-lineage blast cells, so that a higher serum concentration of methotrexate is needed for adequate response in T-lineage ALL.373 Nonetheless, high-dose methotrexate also benefits patients with B-lineage ALL.374 Although the optimal dosage of methotrexate for individual genetic subtypes remains to be determined, a dosage of 2.5 g/m2 should be adequate for most of these patients. In a recent study, shortening the infusion time of high-dose methotrexate from 24- to 4-hours reduced its antileukemic effect, especially for patients with T-ALL.109 High-dose intravenous 6-mercaptopurine has proved ineffective.377–377 Consistent with this result is the finding that intravenous high-dose 6-mercaptopurine inhibited de novo purine synthesis minimally and exerted minimal antileukemic effects.378 Similarly, high-dose cytarabine failed to improve the outcome of high-risk ALL in a randomized trial.379
Continuation Treatment
The most successful postremission intensification regimens generally feature continuous therapy,293,380 whereas high-dose pulse therapy with prolonged rest periods to recover from myelosuppression appears to be less effective.287 Children with ALL (except those with mature B-cell leukemia) require prolonged continuation treatment. The attempt to intensify early therapy but shorten the total duration of treatment to 1 year in one study resulted in inferior overall event-free survival.381 The general rule is to continue therapy for a total duration of 2 to 2.5 years.
The combination of methotrexate administered weekly and mercaptopurine administered daily constitutes the standard “backbone” of the ALL continuation regimen. Tailoring the doses to the limits of tolerance (as indicated by low neutrophil counts) has been associated with an improved clinical outcome.382 However, overzealous use of 6-mercaptopurine, so that neutropenia precludes further use of chemotherapy and reduces overall dose intensity, is counterproductive.383 It is well recognized that the rare patient (1 in 300) who has an inherited deficiency of thiopurine S-methyltransferase has extreme sensitivity to mercaptopurine. Patients who are heterozygous for this deficiency (approximately 10%), and have intermediate levels of enzyme activity, may also require moderate dose reduction to avert side effects.384 Identification of the genetic basis of this autosomal codominant trait has made the molecular diagnosis of these cases possible.385 When patients show poor tolerance to methotrexate and mercaptopurine, studies can now be performed to identify and selectively reduce the dosage of the responsible agent, allowing full dosage of the other drug. In randomized trials, thioguanine, given at a daily dose of 40 mg/m2 or more, produced superior antileukemic responses than mercaptopurine but was associated with profound thrombocytopenia, an increased risk of death and an unacceptably high rate (10% to 20%) of hepatic venoocclusive disease.386,387 A meta-analysis of all randomized trials comparing thioguanine with mercaptopurine from United States, United Kingdom, and Germany, showed that the overall event-free survival was not significantly improved with thioguanine.388 Consequently, mercaptopurine remains the preferred drug.
The addition of intermittent pulses of vincristine and a glucocorticoid to the antimetabolite continuation regimen improves the results389 and has been widely adopted. Dexamethasone has been substituted for prednisone during continuation therapy in many clinical trials, because of its superior clinical efficacy.286 However, studies are needed to determine the optimal dosage and duration of dexamethasone therapy during this phase of treatment.
Prevention and Treatment of Central Nervous System Leukemia
Several factors are associated with the occurrence of leukemia in the CNS: presenting risk features, the quantity of leukemic blasts cells in the CSF, and the type of systemic, as well as CNS-directed, therapy. Patients with high-risk genetic features, large leukemic cell burden, T-lineage ALL, and leukemic cells in the CSF (even if iatrogenic from a traumatic lumbar puncture) are at increased risk of CNS relapse and require more intensive CNS-directed therapy.76,390–392 Because of the adverse consequence of traumatic lumbar puncture at the time of diagnosis, when patients have circulating blast cells, we have routinely performed this procedure under deep sedation or general anesthesia, transfused thrombocytopenic patients with platelets, and administered intrathecal chemotherapy immediately after injection of CSF. High-dose methotrexate, although useful in preventing hematologic or testicular relapse, generally has only a marginal effect on the control of CNS leukemia. However, in one study, high-dose methotrexate plus intrathecal methotrexate reduced CNS relapse, although it did not affect relapse at other sites or overall surviva1.289 Additional analyses of the method of delivery of high-dose methotrexate and folic acid rescue are needed to explain this finding. By contrast, dexamethasone was definitely shown to improve CNS control.286,376,393 In one randomized trial, triple intrathecal therapy with methotrexate, hydrocortisone, and cytarabine was more effective than intrathecal methotrexate alone in preventing CNS relapse, but was associated with an increased frequency of bone marrow or testicular relapse.394 One explanation for this seemingly paradoxical finding is that an “isolated” CNS relapse is in fact an early manifestation of systemic relapse, and the better CNS control secured by triple intrathecal therapy does not suppress overt relapse in other sites. If so, more effective systemic therapy is needed before the full benefit of triple intrathecal therapy can be realized.
Cranial irradiation is an effective CNS-directed therapy but can cause substantial neurotoxicity and occasional brain tumors, prompting efforts to replace it with intensive intrathecal and systemic chemotherapy as much as possible.293,380,395,396 The dose of radiation can be lowered to 12 Gy without increasing the risk of CNS relapse, provided that effective systemic chemotherapy is used.395 In two early studies that omitted cranial irradiation altogether, the cumulative risk of isolated CNS relapse was 4.2% and 3%, and the rate of any CNS relapse (including combined CNS and hematologic relapse) was 8.3% and 6%, respectively.397,398 However, the overall 8-year event survival estimates for the two studies were only 60.7% ± 4% (standard error [SE]) and 68.4% ± 1.2%. A recent study (Total XV) at St. Jude Children’s Research Hospital demonstrated that prophylactic cranial irradiation could be completely omitted without jeopardizing overall outcome in the context of effective risk-adapted intrathecal and systemic chemotherapy: the 5-year survival rate for the 498 patients enrolled in this study was 93.5% and the cumulative risk of an isolated CNS relapse rate was only 2.7%.104 The Dutch ALL-9 study also omitted prophylactic cranial irradiation, producing a 5-year event-free survival rate of 81% and a cumulative risk of isolated CNS relapse rate of 2.6%.399 Triple intrathecal therapy was used in both Total XV study and Dutch ALL-9 clinical trial.
Patients with isolated CNS relapse who did not receive cranial irradiation as initial CNS-directed therapy have a very high retrieval rate; in those who had a long initial remission before the CNS event, the long-term prognosis may even be similar to that of newly diagnosed patients.104,283,400 In the St. Jude Total XV study, all of the 11 patients with isolated CNS relapse were in subsequent remission for 4 to 9 years after retrieval therapy.104 Thus with effective systemic and intrathecal therapy, prophylactic cranial irradiation can be safely omitted from all children with ALL regardless of their presenting features. At St. Jude, cranial irradiation is reserved for salvage therapy.
Infant Acute Lymphoblastic Leukemia
Event-free survival estimates for infants with ALL, especially those with 11q23/MLL rearrangements, remain low, ranging from 20% to 45%. In several recent clinical trials, high-dose cytarabine, high-dose methotrexate, and intensive consolidation/reinduction therapy appeared to improve outcome.401–405 The Interfant-99 study stratified 482 infants according to 7-day prednisone response, and applied a hybrid regimen based on ALL chemotherapy with the inclusion of low-dose and high-dose cytarabine in sequential courses. The event-free survival rate at 4 years was 47%, with most relapses occurring within 1 year from diagnosis. There was no benefit from a late intensification course with high-dose cytarabine and high-dose methotrexate which produced more toxicity.302 A study of 30 infants with ALL diagnosed in the first month of life (i.e., congenital ALL) reported a 2-year relapse rate significantly higher than that of older infants (60.0% ± 9.3% vs. 34.2% ± 2.3%) and a 2-year event-free survival rate of only 20%.406
Intensive systemic and intrathecal treatment, without cranial irradiation, appear to provide adequate CNS protection, even in infants who have CNS leukemia at diagnosis.404,405,407 Most investigators now treat infants as a unique subgroup with multiple drugs given at high dosages, without cranial irradiation. The role of allogeneic hematopoietic stem cell transplantation in this age group remains controversial.140,408–410 In an analysis of 277 infants with MLL+ ALL who were enrolled in the Interfant-99 study, the survival advantage for those who received hematopoietic stem cell transplantation (HSCT) was restricted to a subgroup of patients with age less than 6 months and either poor response to steroids at day 8 or leukocytes more than or equal to 300 × 109/L. For the remaining patients, there was no advantage for HSCT over chemotherapy only.411 Recent findings suggested that aberrant DNA methylation occurs in the majority of infant ALL cases with MLL rearrangement,151,152 raising the possibility of using demethylating therapy in these patients.
Pharmacokinetic and Pharmacogenomic Variables
The rate of metabolism and systemic clearance of antileukemic agents is widely variable, as is the absorption of orally administered chemotherapy. Both low systemic exposure to methotrexate and low-dose intensity of 6-mercaptopurine have been associated with an inferior treatment outcome.384,412 Importantly, concomitant administration of cytochrome P450 enzyme-inducing anticonvulsants (phenytoin, phenobarbital, carbamazepine, or a combination) significantly increases the systemic clearance rates of several antileukemic agents and is associated with lower efficacy of chemotherapy.413 At St. Jude, anticonvulsants that are less likely to induce the activity of drug-metabolizing enzymes (e.g., Keppra, gabapentin, valproic acid) are used instead.
Genetic polymorphisms of several drug-metabolizing enzymes are also associated with treatment outcome. Patients who have homozygous or heterozygous deficiency of thiopurine methyltransferase, the enzyme that catalyzes the S-methylation (inactivation) of mercaptopurine, tend to have better event-free survival, probably because they receive a higher effective dose intensity of mercaptopurine.384 However, the thiopurine methyltransferase genetic polymorphism is also linked to acute dose-limiting toxicity,384 the risk of irradiation-induced brain tumor,414 and therapy-related AML,415 in the context of antimetabolite-based therapy. Hence, therapy must be adjusted in patients who have homozygous mutant genotypes of this enzyme and in many heterozygotes. With this approach, genetic polymorphism of this enzyme was no longer associated with clinical outcome in a recent study.416 The null genotype (absence of both alleles) for GSTM1 or GSTT1 and the GSTP1 Val105/Val105 genes are also associated with increased treatment-related toxicity417,418 and a lower risk of relapse,419 perhaps because of reduced detoxification of cytotoxic chemotherapy. A tandem-repeat polymorphism within the enhancer region of the thymidylate synthase (TYMS) gene, a major target of methotrexate, has been associated with increased expression of the enzyme and a higher relapse hazard.420 Rocha et al.421 found that 16 polymorphisms in genes involved in drug metabolism, including GSTM1 and TYMS, were associated with treatment outcome in one study.421 de Jonge et al.422 found that polymorphisms in genes involved in folate metabolism, such as methylenetetrahydrofolate reductase (MTHFR) and methionine synthase reductase (MTRR) affected methotrexate sensitivity in vitro. Yang et al.423 identified 102 SNPs associated with early response to treatment, including 21 in genes associated with drug disposition and 5 in the interleukin 15 gene. Stocco et al.424 reported that patients with a nonfunctional allele of the inosine triphosphate pyrophosphatase gene had significantly higher concentrations of methyl mercaptopurine nucleotides and a higher probability of severe febrile neutropenia, whereas Trevino et al.425 found an association between SNPs in the organic anion transporter polypeptide SLCO1B1, methotrexate’s pharmacokinetics and gastrointestinal toxicity. Somatic mutations in genes regulating the degradation of DNA mismatch repair enzymes were described in 11% of children with ALL; in cell lines, this defect resulted in increased resistance to thiopurines.426 In a recent study, a SNP in PDE4B (rs6683977) was associated with hematologic relapse; primary ALL cells expressing high levels of PDE4B were more resistant to prednisolone.298 Notably, the presence of additional chromosomes in leukemia cells can create discordance between germline and leukemia-cell pharmacogenomic phenotypes.427
Acute Myeloid Leukemia
Remission Induction
With the exception of APL, which is now treated initially with ATRA in combination with chemotherapy (generally at least an anthracycline),428,429 all cases of AML are treated with induction chemotherapy comprising cytarabine and a topoisomerase II inhibitor (anthracycline, idarubicin, doxorubicin or mitoxantrone) with or without a third agent (etoposide or 6-thioguanine) (see Table 96-5).320,430–435 Rates of remission induction range from 74% to 94% among contemporary clinical trials (Table 96-6), partly because of differences in the timing of remission studies (i.e., after 1, 2, or multiple courses of therapy). Nonetheless, many attempts have been made to modify remission induction therapy, not only to increase the rate of remission, but to improve its “quality,” which, in turn, can favorably affect treatment outcome.
Table 96-6
Results of Selected Recent Clinical Trials for Childhood Acute Myelogenous Leukemia
| Study | Years | Treatment Schedule | No. of Patients | Remission Rate | Early Mortality | Overall Outcome | Conclusions |
| ANZCCSG AML2430 | 1993–1999 | Remission induction Ida/Ara-C/6TG HD Ara-C Consolidation Ida/Ara-C/VP16 Ara-C/AMSA Interim therapy Ara-C/6TG Postconsolidation Allo HSCT or Auto HSCT |
160 | 91.2% | 5% | 5-yr EFS 41% 5-yr OS 55% |
Idarubicin was more toxic than daunorubicin (used in preceding AML1 trial) during remission induction. |
| BFM AML93431,432 | 1993–1998 | Remission induction Dauno/Ara-C/VP16 vs. Ida/Ara-C/VP16 Consolidation 7-Day, 6-week consolidation plus Mito/Ara-C for high-risk patients Intensification HD Ara-C/VP16 Continuation (18 months) 6TG/Ara-C plus cranial radiation Allo HSCT for high-risk patients |
471 | 82% | 7% | 5-yr EFS 51% ± 2% 5-yr OS 60% ± 3% |
Idarubicin reduced blast cells more profoundly than daunorubicin during the first 2 weeks of remission induction in high-risk cases. Improved outcome for high-risk cases was attributed to mitoxantrone and high-dose cytarabine. |
| CCG 2891433,544 | 1989–1995 | Remission induction DCTER × 2 Consolidation DCTER × 2 Postconsolidation Allo HSCT for patients with suitable donor Others: Auto HSCT or 4 cycles chemotherapy |
652 | 74% | 8% | 3-yr EFS Standard timing 27% Intensive timing 42% 3-yr OS Standard timing 39% Intensive timing 51% |
OS was improved by timing-intensive treatment. Outcome of allogeneic transplantation was superior to outcome of autologous transplant or chemotherapy. Intensive chemotherapy was as efficacious as autologous transplantation. |
| LAME 89/91434 | 1988–1996 | Remission induction Ara-C/Mito Consolidation Allo HSCT for patients with suitable donor Others: chemotherapy VP16/Ara-C/Dauno AMSA HD Ara-C/Asp × 2 ± Continuation (18 months) 6MP/Ara-C |
268 | 90% | 5% | 6-yr EFS 48% ± 6% 6-yr OS 60% ± 6% |
Low-dose continuation treatment had no benefit and may contribute to drug resistance and poor salvage rate after relapse. |
| MRC AML12438,545,546 | 1988–1995 | Remission induction ADE × 2 vs. MAE × 2 Consolidation MACE MidAC or ICE Postconsolidation Allo HSCT for standard- and poor-risk patients Others: MidAC or no chemotherapy |
564 | 92% | 4% | 5-yr EFS 56% 5-yr OS 66% |
Mitoxantrone was superior to daunorubicin for disease-free survival; the addition of fifth course of intensive chemotherapy failed to improve outcome. |
| NOPHO-AML93547 | 1993–2000 | Remission induction 6TG/Ara-C/VP16/Doxo Mito/Ara-C or 6TG/Ara-C/VP16/Doxo Consolidation HD Ara-C/Mito HD Ara-C/VP16 HD Ara-C HD Ara-C/VP16 |
219 | 91% | — | 7-yr EFS 49% | Allowing hypoplastic marrow to recover after induction before reinstituting chemotherapy reduced toxic death rate. |
| POG 9421440,548 | 1995–1999 | Remission induction DAT vs. HDAT HD Ara-C Consolidation Allo HSCT for patients with suitable donor Others: chemotherapy: VP16/Mito ± CsA HD Ara-C VP16/Mito ± CsA |
632 | 90% | — | 3-yr EFS 30.5% to 43.2% 3-yr OS 51.3% to 55.4% |
High-dose cytarabine during induction did not improve complete remission rate but tended to improve EFS. |
| JCACSG AML99435 | 2000–2002 | Remission induction 1 VP16/Ara-C/Mito or IDA 2 VP16/Ara-C/IDA (if M3 marrow after induction 1) Consolidation Allo HSCT for all high-risk patients and intermediate-risk patients with matched related donor Others: 5 to 6 cycles of VP16/cytarabine-based chemotherapy |
240 | 94.6% | 1.7 | 5-yr EFS 61.6% 5-yr OS 75.6% |
A reduction in the number of consolidation cycles together with dose-dense use of cytarabine improved overall results. |
| SJCRH AML02320 | 2002–2008 | Remission induction Dauno/Ara-C/VP16 × 2 ± gemtuzumab ozogamicin Consolidation Cytarabine-based therapy × 3 Postconsolidation Allo HSCT for standard-risk or high-risk patients with matched-sibling donor |
216 | 94% | 0.9% | 3-yr EFS 63% 3-yr OS 71% |
MRD-directed therapy, triple intrathecal therapy, and antifungal and antibacterial prophylaxis improved outcome. |
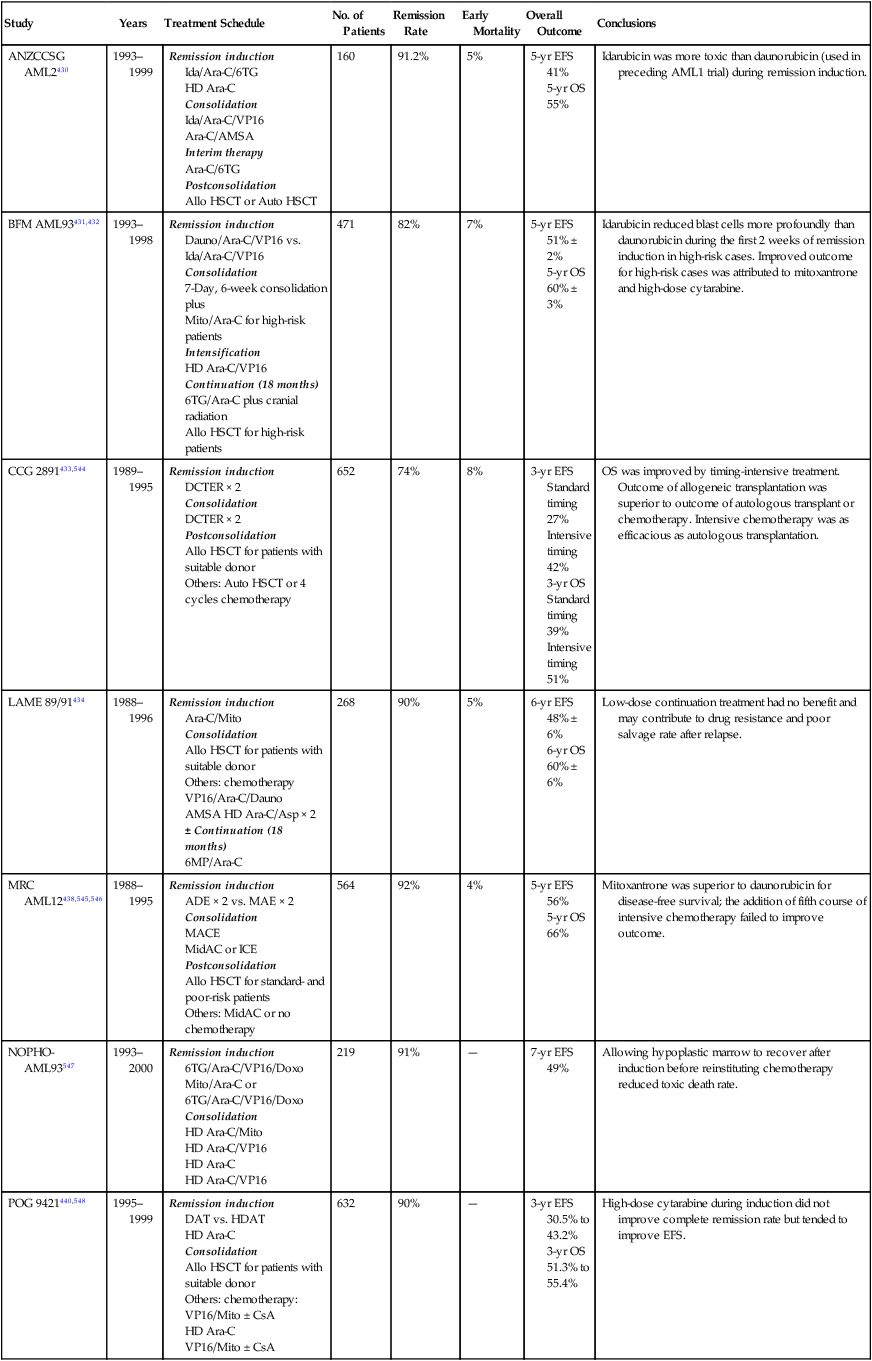
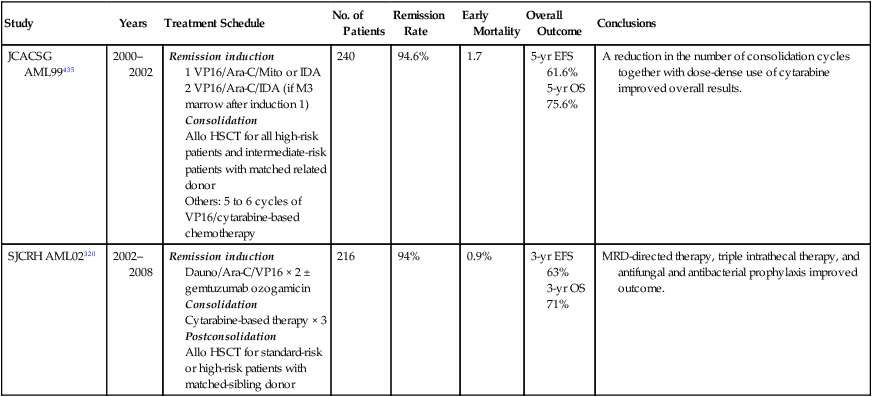
EFS, Event-free survival; MRD, minimal residual disease; OS, overall survival.
Modifications of remission induction include the use of additional agents or different topoisomerase II inhibitors, increased drug dosages, increased duration of drug exposure, and decreased intervals between treatment courses.320,430–436 Because idarubicin has faster cellular uptake, increased cellular retention, less in vitro drug resistance, longer plasma half-life of the active metabolites, and potentially less cardiotoxicity than daunorubicin,437 investigators of the BFM consortium compared the clinical efficacy of these two agents during remission induction in their AML93 study.431,432 Idarubicin yielded a significantly lower bone marrow blast cell count on day 15 than did daunorubicin. Although long-term outcome did not differ significantly between the two randomized groups, the subset of patients who had more than 5% blast cells in the bone marrow on day 15 appeared to benefit from idarubicin. By contrast, the Australian and New Zealand CCG found daunorubicin to be as effective as idarubicin and less toxic.430 In the MRC AML12 trial, 504 children with AML were randomly assigned to mitoxantrone+cytarabine+etoposide or daunorubicin+cytarabine+etoposide as induction chemotherapy and 270 entered a second randomization comparing a total of 4 versus 5 courses of treatment.438 There was no difference in complete remission rate between the induction regimens, but there was a benefit for mitoxantrone with regard to relapse rate (32% vs. 39) and disease-free survival rate (63% vs. 55%), but this did not result in superior event-free or overall survival.438 There was no survival benefit for patients receiving a fifth course of treatment.
The former CCG pursued the approach of timed-sequential therapy (i.e., intensification of therapy) by reducing the interval between two induction courses. The intensive-timing arm had a remission induction rate comparable to that of the standard-timing arm, despite a much higher rate of early mortality (11% vs. 4%). Although the intensive-timing arm yielded a superior overall outcome, regardless of the type of postremission therapy,433,434 this approach would not be considered acceptable in contemporary clinical trials because of its associated high rate of early toxic death. In a subsequent study, these investigators found that patients with a negative genotype (i.e., homozygous polymorphism) for glutathione-S-transferase theta, a detoxifying enzyme, experienced greater toxicity and mortality than did patients with a least one wild-type allele.417
The former POG has used high-dose cytarabine to intensify therapy. In the POG 8498 study, patients were randomly assigned to receive 2 courses of DAT (daunorubicin, cytarabine, and 6-thioguanine) or 1 course of DAT followed by a course of high-dose cytarabine.439 The two treatment arms had comparable remission rates (both 85%), but patients who received high-dose cytarabine had a higher estimate of 3-year event-free survival (34% vs. 29%). In the POG 9421 study, patients were randomly assigned to receive DAT induction at standard dose or DAT with cytarabine at a high dose. Remission rates were somewhat lower in the standard arm (87% vs. 91%), as were 3-year event-free survival estimates (34% vs. 40.4%, P = 0.17).440
The United Kingdom MRC used a prolonged daily exposure approach to intensify therapy. They found that prolonged treatment resulted in greater toxicity but an improved remission rate and a shorter time to remission.441 In the MRC AML-10 trial, patients randomly assigned to receive 6-thioguanine or etoposide as the third induction agent had a comparable overall outcome.442
The Japanese AML 99 trial achieved excellent results by using a remission induction therapy consisting of etoposide 150 mg/m2 on days 1 to 5, cytarabine 200 mg/m2 on days 6 to 12 and mitoxantrone 5 mg/m2 on days 6 to 10 for children younger than 2; and etoposide 100 mg/m2 on days 1 to 3 and 200 mg/m2 on days 11 to 13, cytarabine 500 mg/m2 on days 4 to 6 and 500 mg/m2 on days 11 to 13, and idarubicin 8 mg/m2 on days 4 to 6 for older children.435 In the St. Jude AML02 study, which also achieved excellent results, patients were randomly assigned to receive daunorubicin (50 mg/m2 on days 2, 4, and 6) and etoposide (100 mg/m2 on days 2 to 6) plus either high-dose cytarabine (3 g/m2 every 12 hours on day 1, 3, and 5) or low-dose cytarabine (100 mg/m2 every 12 hours on days 1 to 10) during induction 1. In induction 2, patients received low-dose cytarabine, daunorubicin, and etoposide (ADE) alone or in combination with 3 mg/m2 gentuzumab.320 Of note, there was no significant difference in remission or MRD-negativity rates between the high-dose and low-dose cytarabine arms.320 Gemtuzumab was administered during remission induction in the recently reported Children’s Oncology Group AAML03P1 trial.443
In summary, intensified remission induction in general improves long-term outcome. However, vigilance in supportive care is important to reduce early mortality.320,435,438 Patients with Down syndrome should not receive intensified therapy, because they have more drug-sensitive disease and are more susceptible to treatment-related toxicity than the general population.24,444
Consolidation and Other Postremission Therapy
Without postremission therapy, relapse is nearly inevitable.4 Although more courses of consolidation therapy are thought to be better, the optimal number is uncertain.4 In most clinical trials, postremission consolidation therapy lasts for 6 to 12 months in patients who do not undergo HSCT.
The optimal consolidation therapy has yet to be determined but generally includes high-dose cytarabine. In the BFM AML93 study, the improved outcome of high-risk cases was attributed to intensification with high-dose cytarabine and mitoxantrone.431 This drug combination is also an integral component of the MRC AML10 trial.442 The combination of high-dose cytarabine and l-asparaginase (Capizzi II regimen) was credited for the improved outcome in the CCG-213 and CCG-213P studies.445,446 Consolidation therapy with high-dose cytarabine alone also resulted in an improved outcome in the POG 8498 study.439 The St. Jude AML02 study demonstrated that intensity of consolidation can be effectively guided by monitoring MRD.320
The need for continuation therapy beyond consolidation therapy is less certain. Although the BFM study group achieved excellent results with continuation therapy lasting 18 to 24 months,431,432 other studies could not demonstrate the clinical benefit of this phase of therapy.447,448 In fact, a randomized study by the CCG (213P) showed that 2 years of continuation treatment after intensification therapy resulted in a worse outcome than no continuation treatment.445 In the Leucámie Aiquë Myéloïde Enfant (LAME) 89/91 study, low-dose continuation treatment of 18 months also resulted in worse overall survival than no continuation treatment.434 The investigators attributed this finding to the development of drug resistance during continuation therapy, leading to a poor salvage rate. Hence, most study groups, with the exception of the BFM group, have abandoned the use of continuation therapy in AML. It should be noted that cases of APL benefit from prolonged continuation treatment with ATRA and, possibly, with 6-mercaptopurine and methotrexate.449
Central Nervous System-Directed Therapy
Relatively little attention has been paid to CNS-directed therapy for AML, because control of hematologic disease remains the focus of treatment. Suboptimal systemic therapy may allow hematologic relapse to precede meningeal relapse. In most clinical trials, intrathecal cytarabine with or without methotrexate and systemic high-dose cytarabine are used as CNS prophylaxis. However, the St. Jude AML02 trial demonstrated the superiority of triple intrathecal therapy over intrathecal cytarabine in CNS control.320 The BFM AML-87 study attempted to address whether cranial irradiation is necessary in childhood AML.450 In that randomized study, children who received cranial irradiation had longer relapse-free survival than those receiving only intrathecal therapy, although there was only a marginal difference between the two groups in the rate of CNS relapse. The early termination of randomization in that study prevents firm conclusions; moreover, many other clinical trials have yielded similar outcomes without the use of cranial irradiation (see Table 96-6). Therefore cranial irradiation may not be necessary if systemic and intrathecal chemotherapy is adequate. Even less is known about the optimal treatment of overt CNS leukemia at presentation. In an earlier study in our institution, this factor lacked prognostic significance,451 and these patients might be cured without the use of cranial irradiation.436 The trials that have produced the highest cure rates reported to date (St. Jude AML02 and the Japanese AML 99) both omitted prophylactic cranial irradiation and relied on triple intrathecal therapy and systemic therapy for control of CNS disease.320,435
Hematopoietic Stem Cell Transplantation
The indications for transplantation should be periodically reevaluated. At present, among children with ALL, those with early hematologic relapse, ETP-ALL, patients with T-cell ALL with poor early response, and patients with high levels of MRD after remission induction therapy (with the exceptions of patients 1 to 5 years old with hyperdiploidy >50 or ETV6-RUNX1) are clear candidates for transplantation.89,313,452,453 Transplantation has not improved outcome in other types of very high-risk leukemia, including infant cases and those with MLL rearrangement.140,300
Autologous HSCT has generally been associated with a high rate of relapse in childhood ALL and has failed to show any survival benefit over chemotherapy in most studies.456–456 The benefit of in vitro purging to rid autografts of residual leukemia cells remains unproved.457 Hence, autologous transplantation is not recommended by most investigators.
Allogeneic HSCT in children with AML has been shown in most clinical trials to reduce the risk of relapse and to improve overall survival, compared with either autologous transplant or chemotherapy alone, despite a higher rate of morbidity and mortality.4,433 However, the indications for this procedure during first remission are still debated. Some investigators favor allogeneic transplantation for all patients who have a suitable donor, because this procedure yielded a superior outcome, regardless of the risk group, in their study.433 Others do not recommend allogeneic transplantation for patients at lower risk, especially in view of recent improved results with chemotherapy, and reserve this procedure for relapsed AML.442,457 They contend that most patients with relapsed AML can be readily salvaged with HSCT and newly diagnosed patients should be spared the risk of unnecessary transplant-related morbidity and mortality.
Notwithstanding the controversy of allogeneic transplantation, there is general consensus that patients with very high-risk AML [monosomy 5 or 7, del (5q), 3q abnormalities, acute megakaryoblastic leukemia without the t(1;22)/OTT-MAL, or poor response to remission induction therapy] are candidates for this procedure, perhaps even if alternative or unrelated donors are the only options.457,458 In the St. Jude AML02 trial, standard-risk patients, that is, those lacking low-risk [t(8;21)/RUNX1-ETO, inv(16)/CBFB–MHY11, or t(9;11)/MLL-MLLT3] or high-risk [-7, FLT3-ITD, t(6;9), megakaryoblastic leukemia without the t(1;22)/OTT-MAL, treatment-related AML, or AML arising from MDS] features who had a matched related donor were eligible for transplant; patients with high-risk presenting features, and those with poor response to therapy (>25% blasts after Induction I or persistent MRD after 3 courses of therapy) were also considered high-risk and candidates for allogeneic HSCT.320 Transplantation is also the treatment of choice for most patients with MDS. By contrast, it is not recommended for patients with Down syndrome or APL in first remission, which has a favorable prognosis with current therapy.457,458
Treatment Sequelae
Improved supportive care has reduced the rate of early death to less than 2%.4 Induction therapy with prednisone, vincristine, and l-asparaginase, may cause hyperglycemia and thrombosis. The intensified use of methotrexate and glucocorticoids has caused an increased frequency of neurotoxicity and, in older children and adults, osteonecrosis. High cumulative doses of anthracyclines can produce severe cardiomyopathy, especially in young children. Cranial irradiation causes neuropsychological deficits, endocrine abnormalities that lead to obesity, short stature, precocious puberty, osteoporosis, and second neoplasms within the irradiated field.461–461 In a review of 525 children with AML enrolled in the Nordic Society of Paediatric Haematology and Oncology (NOPHO)–AML-84, -88 and -93 trials, 70 (13%) died before starting treatment or from treatment-related complications. Death within the first 2 weeks was primarily a result of bleeding or leukostasis, whereas after day 15 infection was the main cause of death.462
Development of therapy-related AML has been linked to the use of topoisomerase II inhibitors (teniposide and etoposide), and the risk is apparently dependent on the treatment schedule and the concomitant use of other agents (e.g., l-asparaginase, alkylating agents, and perhaps antimetabolites).328 Children who receive cranial irradiation at 6 years of age or younger are most susceptible to the development of brain tumors. This risk is increased by the intensive use of antimetabolite drugs before and during cranial irradiation.414 It should be noted that there is no safe dose of cranial irradiation. In the BFM 90 study, which used 12-Gy cranial irradiation, the cumulative risk of second neoplasms had already reached 1.7% at 15 years postinduction,395 and is expected to increase substantially with additional follow-up.