[level-membership-for-pulmolory-and-respiratory-category]Chapter 1
Anatomy and physiology of the respiratory system
This chapter is not intended to provide a comprehensive description of the anatomy and physiology of the respiratory system; rather it is intended to provide a level of understanding that is required to underpin the remainder of this book. Readers wishing to gain a deeper insight into this interesting area are referred to the work of Davies & Moores (2010) and Lumb (2010).
THORACIC STRUCTURE AND FUNCTION
The respiratory system is illustrated in Figure 1.1 and is made up of all the structures that guide air into the lungs (nose, mouth, and airways), plus the lungs themselves and the structures that surround the lungs (thoracic cavity, including the rib cage). The right lung comprises three lobes, whilst the left has two, which allows space for the heart to lie between the left lobes, sloping toward the left. The weight of both adult lungs is between 0.7 and 1.0 kg (1.5 and 2.2 pounds) when weighed at autopsy; however, in life they probably weigh twice this amount because the blood vessels within the lungs (pulmonary circulation) will be filled with about 0.9 litres of blood (weighing about 0.95 kg [2.1 pounds]). In other words, the adult human has about 2 kg (4.4 pounds) of lung tissue hanging inside the rib cage.

The airways
The airways branch a total of 23 times, creating a tree-like structure that ends in the alveoli, where the exchange of oxygen (O2) and carbon dioxide (CO2) takes place (Fig. 1.2). The branches follow an irregular, dichotomous pattern in which each airway gives rise to two ‘daughter’ airways. The structure is irregular because the daughter branches may not be of equal size. The number of airways (N) in each generation (Z) is given by the equation N = Z2.
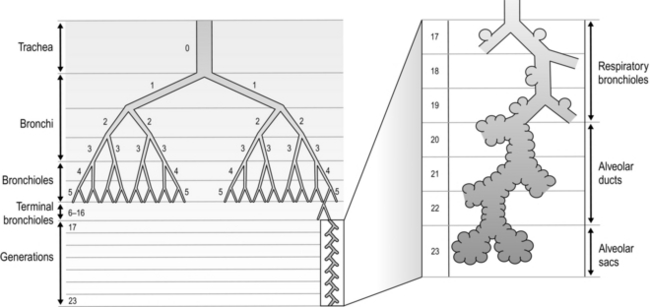
Figure 1.2 Diagram illustrating the branching structure of the lung airways. (With permission from Davies A, Moores C, 2010. The respiratory system. Churchill Livingstone, London, p. 15, Fig. 2.4.)
Air enters via the nose and mouth; then it travels into the pharynx, through the glottis and down the trachea. Next, the air travels into the right and left bronchi, and then through the branching structure of the remaining airways to the alveoli. The alveoli are collections of air sacs, similar to a bunch of grapes, which are surrounded by a dense network of capillaries (think of a bunch of grapes inside a net shopping bag; Fig. 1.1). The regions of the lung without alveoli (including the airways) are known as the conducting zone (branches 1–16), whilst the regions with alveoli are known as the respiratory zone (17–23), i.e., the zone where oxygen and carbon dioxide are exchanged (Fig. 1.2). From branch 17 onwards (respiratory bronchioles), the airways begin to display alveolar buds in their walls, and by branch 20 onwards virtually the entire airway is made up of alveoli (alveolar ducts). An important feature of the conducting airways is that the larger airways, such as the trachea, are reinforced with cartilage rings that help prevent collapse, whereas the walls of smaller airways contain no supporting skeleton. The small airways possess rings of smooth muscle that, when contracted, narrow the airways (bronchoconstriction). From branch 3 onwards, the airways are surrounded by lung parenchyma, and the elastic forces that operate to recoil the lung parenchyma help to tug the airways open during exhalation (airway tethering), with their radial traction (see section ‘Mechanics of breathing: Airway resistance’).
The alveoli
The branching structure of the lungs is an impressive work of evolution that has resulted in adult human lungs having a combined surface area of about 60 m2 (646 square feet), which is about the same as a singles badminton court and about 40 times the area of the skin (see Fig. 1.23). Why the need for such a huge area? Like so much of evolution, the respiratory system is a slave to the laws of physics. As will be described in detail in the next section, the exchange of oxygen (O2) and carbon dioxide (CO2) between the 300 million alveoli and the capillaries surrounding them occurs via passive diffusion. For this process to keep pace with the metabolic needs of the average person, especially during exercise, a vast surface area (number of alveoli and capillaries) is required for diffusion.
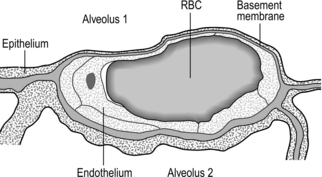
Figure 1.3 Drawing taken from an electron micrograph section of an alveolus showing the alveolar–capillary membrane. RBC = red blood cell. (With permission from Davies A, Moores C, 2010. The respiratory system. Churchill Livingstone, London, p.18, Fig. 2.9.)
However, this vast lung surface area would be of little use without the unique and intimate interrelationship that exists between the alveoli and their capillary network. Figure 1.3 illustrates the key feature of this structure, i.e., the minimal distance separating the alveolar air from the capillary blood. Note that on one side of the capillary the alveolar and capillary cells fuse to form a very thin septum, whilst on the opposite side of the capillary the septum is thicker, providing stability and resisting collapse.
The blood vessels
The second circulation in the lungs arises from the aorta as the bronchial arteries, which meet the metabolic requirements of the conducting airways by perfusing the walls of the airways as far as the respiratory bronchioles (after which O2 requirements are met by alveolar gas exchange). Around one-quarter to one-third of the venous effluent from the bronchial circulation drains into the bronchial veins and thence to the right atrium. The remainder drains directly into the pulmonary veins via bronchopulmonary–arterial anastomoses, contributing to shunting of deoxygenated blood into the pulmonary veins. This shunt is the reason that the alveolar to arterial pressure difference for oxygen exists (see section ‘Gas exchange, Diffusion’ below).
The nerves
The respiratory system is under both somatic and autonomic nervous control. The somatic system provides motor control of respiratory pump muscles, whereas the autonomic system provides both motor (efferent) and sensory (afferent) nerves to the lungs. For information on somatic nerve innervation of respiratory muscles see ‘The muscles’ (below).
The muscles
Respiratory pump muscles
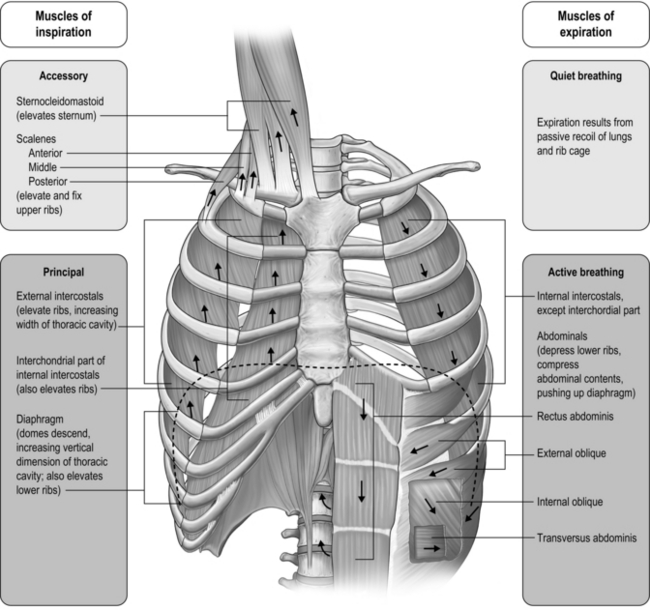
The respiratory pump muscles are a complex arrangement that form a semi-rigid bellows around the lungs. Essentially, all muscles that attach to the rib cage have the potential to generate a breathing action, but the principal muscles are shown in Figure 1.4. Muscles that expand the thoracic cavity are inspiratory muscles and induce inhalation, whereas those that compress the thoracic cavity are expiratory and induce exhalation. These muscles possess exactly the same basic structure as all other skeletal muscles, and they work in concert to expand or compress the thoracic cavity. The structure of the rib cage is described in the section ‘Gross structure of the respiratory system’ (below).
Functional properties of respiratory pump muscles
• Type I: Slow contracting and relatively weak, but very resistant to fatigue
• Type IIA: Moderately fast and strongly contracting, with high resistance to fatigue
• Type IIX (also known as type IIB): Fast and very strong, but with only moderate resistance to fatigue.
It comes as no surprise to learn that the proportion of oxidative fibres (type I and type IIA) within the diaphragm and inspiratory intercostals is approximately 80% (Gollnick et al, 1972), whilst that of the expiratory intercostals is almost 100%. This compares with around 35–45% for limb muscles (Gollnick et al, 1972). The fibres of the abdominal muscles tend to be much more variable in their composition, reflecting the multiplicity of their roles. Another important factor determining muscle fatigue is its blood supply. Inadequate blood flow (ischaemia) not only limits oxygen delivery, it also limits the delivery of substrates and the removal of metabolic by-products, all of which can hasten fatigue. The diaphragm and rib cage muscles are supplied by numerous arteries. The diaphragm, for example, is perfused by three arteries, as well as benefiting from anastamoses that provide collateral sources of blood flow between arteries. The diaphragm also has an extremely dense capillary network and a capacity to increase its blood flow that exceeds that of limb muscles (Polla et al, 2004). The diaphragm maintains perfusion at contraction forces that occlude blood flow in limb muscles. This advantage derives from the fact that it is a thin sheet of muscle that produces a negative intrathoracic pressure during contraction; this pressure gradient maintains blood flow (Buchler et al, 1985). It has been suggested that this abundant and persistent arterial supply protects the diaphragm fibres from ischaemia (Hussain, 1996), providing resistance to fatigue.
In the past, the highly fatigue-resistant characteristics of the respiratory pump muscles contributed to a key assumption regarding the likelihood that the respiratory muscles contributed to exercise limitation. Physiologists assumed that the respiratory pump muscles, especially the diaphragm, were so well evolved from their continuous work that they were immune to fatigue. It wasn’t until the 1990s that this myth was finally shattered, when exercise-induced diaphragm fatigue was measured in healthy young athletes (see Ch. 3, section ‘Respiratory muscle involvement in exercise limitation, Healthy people’).
Upper airway muscles
The first question to address is why upper airway muscles are relevant to breathing. The simple answer is that, without them, upper airway resistance would be intolerable. During normal resting breathing, the vocal folds abduct during inhalation in order to widen the laryngeal glottic opening, permitting unobstructed air flow through the larynx (Brancatisano et al, 1984). This occurs via reflex activation of the posterior cricoarytenoid (PCA) muscle. Without this activity, the vocal folds would collapse across that laryngeal opening, causing an increase in resistance to upper airway flow and leading to increased breathing effort and dyspnoea. The strength of contraction of the PCA muscles has been shown to be proportional to factors that are associated with increased levels of respiratory drive, as well as the negativity of intrathoracic pressure (Suzuki & Kirchner, 1969). During vigorous breathing the action of the PCA is supplemented by contraction of the cricothyroid (CT), which acts to tension the vocal folds, increasing the anteroposterior dimension of the larynx (Hoh, 2005). Active closure of the vocal folds (adduction) is performed by the lateral cricoarytenoid muscle (LCA), thyroarytenoid (TA) and interarytenoid (IA), but only the PCA is involved in resting breathing. However, during tidal breathing most of the closure is brought about by relaxation of the PCA rather than by activation of the adductor muscles (Murakami & Kirchner, 1972). Transient, reflex modulation of the area of the laryngeal portion of the airway plays an important role in controlling breathing frequency, duty cycle and end-expiratory lung volume, as narrowing of the airway provides an important braking effect during expiration. Active adduction is associated with activities such as vocalization, coughing and straining.
The fibre type of human laryngeal muscles has not been studied nearly so extensively as limb muscles, but a number of key observations have been made with respect to the vocal fold abductors (PCA and CT). The PCA and CT contain around 66% and 45% type I fibres, respectively. The type II fibres of these muscles are limited to IIA and IIX, but the latter are very few in number. In common with limb muscles, PCA and CT appear to contain no IIB fibres (Hoh, 2005). The proportion of fast IIX fibres appears to be larger in the adductor muscles (TA and LCA), which probably imparts a higher velocity of shortening. This may be functionally important in their role as protectors of the airway (Li et al, 2004).
Because of its role in vocalization, the LCA has been studied in relation to its fatigability. Intramuscular EMG (electromyography) suggests that prolonged, loud vocalization exercises result in changes within the EMG that are consistent with the development of muscle fatigue (Boucher et al, 2006). Thus, it is reasonable to suggest that under similarly challenging conditions for abduction (e.g., vigorous breathing) PCA and CT might be similarly susceptible to fatigue. This is discussed in relation to exercise intolerance in Chapter 3 (section ‘Respiratory muscle involvement in exercise limitation’).
Gross structure of the respiratory system
The respiratory system is housed within the thoracic cavity, which is formed by the rib cage, vertebrae, sternum and diaphragm. Within the thorax there are three further cavities: the left and right pleural cavities and the mediastinum (Fig. 1.5).
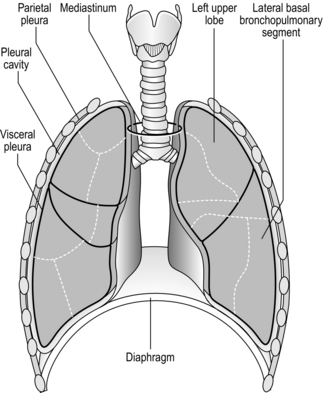
Figure 1.5 Gross anatomy of the lungs. (With permission from Davies A, Moores C, 2010. The respiratory system. Churchill Livingstone, London, p. 21, Fig. 2.12.)
The arrangement and movements generated by the respiratory muscles are described above (in ‘The muscles’). The skeletal structures that translate the muscle actions into movements are complex. The rib cage structure is such that the vertebral articulation of the ribs is higher than the sternal attachments; consequently, the ribs slope downwards anteriorly (Fig. 1.6).
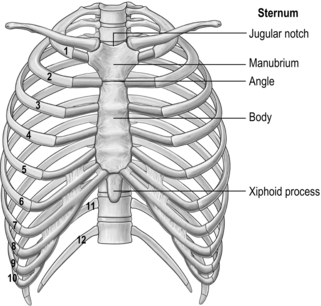
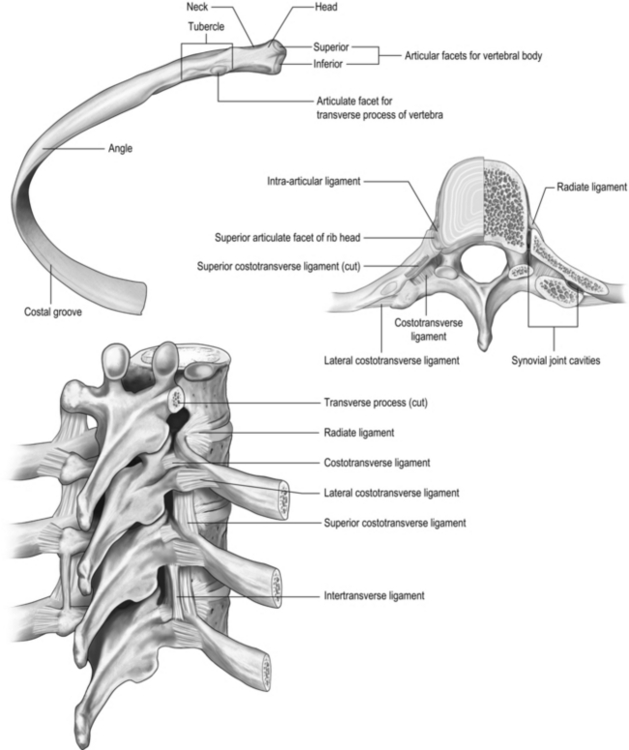
All 12 ribs articulate with the vertebrae, but only the first six connect individually to the sternum. Ribs 7–10 articulate with the lower sternum via a common cartilage, whilst ribs 11 and 12 have no anterior connections (‘floating ribs’). The head of most ribs articulates with the bodies of two adjacent vertebrae, whilst their tubercles articulate with the transverse process of one of these vertebrae. Nerves and blood vessels run in a channel on the underside of the ribs called the costal groove (Fig. 1.7).
GAS EXCHANGE

However, the partial pressure of oxygen within the alveoli (PAO2) is not 149 mmHg because the inhaled breath is diluted by the air that remained in the lungs at the end of the previous breath (end-expiratory lung volume, EELV). The extent of the dilution depends upon a number of factors, including the EELV and the tidal volume (VT); typically PAO2 will be around 104 mmHg, giving a diffusion gradient of around 65 mmHg. Thus, VT affects both the flow of gas delivered to the alveoli (via the dead space to VT ratio; see ‘Lung volumes and capacities’, below), and the extent to which inspired PO2 (PIO2) is diluted by the EELV (inspired to alveolar gradient). This mixing of old and new gas also affects the diffusion gradient and exchange of CO2 because it has the effect of raising the partial pressure of CO2 (PCO2) in the alveoli (PACO2). Thus, it is easy to see how changes in breathing pattern can influence the driving pressure for gas exchange, leading to hypoxaemia and hypercapnia.
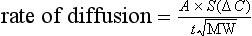
where A is the diffusion area, S is the solubility coefficient of the gas, ΔC is concentration gradient for the gas (alveolar to pulmonary arterial), t is the membrane thickness (alveolar plus capillary), and MW is the molecular weight of the gas molecule (its physical size). Although CO2 is 23 times more soluble than O2, it has a larger MW making the actual diffusion rate 20 times greater. However, equilibrium between the alveolus and venous blood occurs at around the same time for both CO2 and O2 because of the lower ΔC and slower release of CO2 from the blood compared with that of O2. Importantly, the A in the Fick equation is not the lung surface area, but rather the surface area where there is both ventilation and perfusion, i.e., where air and blood meet. As will be explained in later sections, many factors can influence the distribution of both ventilation and perfusion, leading to ventilation / perfusion ( /
/  ) inequality, a reduction in A and an impairment of diffusion.
There is one final factor that influences the efficiency of gas exchange between alveolus and blood, viz., the characteristics of the blood supply to the alveolus, and in particular the time available for the diffusion and binding / release of O2 and CO2. Figure 1.8 is a diagrammatic illustration of the change in pulmonary blood gases as the blood traverses the lungs. Under resting conditions, the blood spends around 0.75 seconds in contact with the alveolar regions of the lung, during which time it will traverse a number of alveoli.
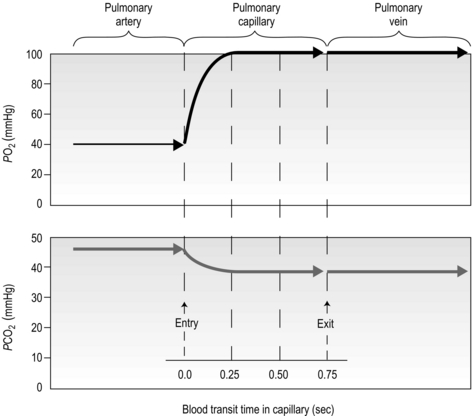
Figure 1.8 Equilibrium time for O2 and CO2 as blood traverses the alveolar capillaries under resting conditions. (With permission from Hicks GH, 2000. Cardiopulmonary anatomy and physiology. WB Saunders, Philadelphia, p. 365, Fig. 12-17.)
It is clear from Figure 1.8 that equilibration of both gases occurs early in the journey through the capillary, and that within 0.25 seconds diffusion ceases because there is no longer a gradient and exchange is complete. The only way to increase the exchange of gas is to increase the throughput of blood. In this scenario, gas exchange is perfusion limited. Many people find it hard to understand that, in healthy people at sea level, breathing more during exercise does not improve the amount of oxygen leaving the lungs; this is because it’s already ‘as good as it gets’. However, diffusion limitation can arise in healthy people under very specific conditions including: (1) exposure to high altitude (reducing the diffusion gradient), (2) during maximal exercise, when (a) cardiac output can be so high that blood traverses the lung capillaries before full equilibration can take place, (b) cardiac output can be so high that it outstrips the ability of the respiratory pump to deliver adequate alveolar ventilation (VA), (c)  /
/  inequality develops due to the mechanical effects of acute pulmonary oedema compressing alveoli and capillaries, and (d) the diffusion distance is increased by acute pulmonary oedema. Exercise-induced arterial hypoxaemia in healthy well-trained individuals at sea level is relatively rare and the specific contributions of the putative contributor remains incompletely understood (Guenette & Sheel, 2007).
 /
/  inequality due to disturbed lung mechanics and breathing pattern abnormalities
Perfusion
The pulmonary vasculature is supplied via a separate, low-pressure branch of the cardiovascular system. Deoxygenated blood is returned to the lungs via the right side of the heart and the pulmonary artery. The latter is the only artery in the body to carry deoxygenated blood, which is distributed to a huge capillary network within the lungs (Fig. 1.9).
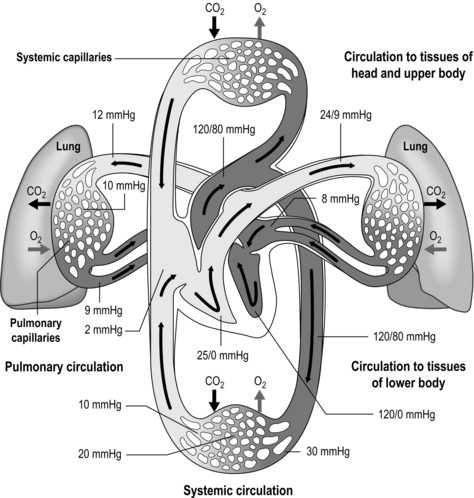
Figure 1.9 Schematic depicting pulmonary and systemic circulations and pressures. (With permission from Thibodeau GA, Patton KT, 1995. Anatomy and physiology, 3rd edn, Mosby, St Louis.)
As well as illustrating the flow of blood through both branches of the circulation, the diagram in Figure 1.9 also illustrates the pressures present within each part. Systolic / diastolic pressure in the pulmonary artery is around only 24 / 9 mmHg, compared with 120 / 80 mmHg in the aorta. The pulmonary circuit is at low pressure because of the thin, delicate walls of the capillary network, which minimizes the diffusion distance. Even small increases in pulmonary arterial pressure lead to fluid leakage and pulmonary oedema. Since the pulmonary circulation receives virtually the entire cardiac output, the fact that the pressures within it are low indicates that it has a low resistance. The reason for this low resistance is the extensiveness of its capillary network; as was described above, the capillary network can be thought of as a sheet of blood enveloping the alveoli.
One factor that has a strong influence upon the patency of pulmonary capillaries is alveolar pressure, which can compress the vessels. This increases their resistance, leading to redistribution of blood and heterogeneity of blood flow within the lungs. In addition, gravity, which also influences alveolar pressure (see ‘Pressures within the thorax’, below), has a potent influence upon blood flow distribution within the lungs. The effect is due to the hydrostatic pressure gradient that exists from the apex to the base of the lungs. It is very potent because pulmonary arterial pressure is so low that it is only just sufficient to pump blood to the lung apices. Perfusion pressure at the base of the lungs is equivalent to pulmonary arterial pressure, plus the hydrostatic pressure difference between the heart and base of the lungs. At the apex, perfusion pressure is equivalent to pulmonary arterial pressure, minus the hydrostatic pressure difference between the heart and apex of the lungs. This means that blood flow is distributed preferentially to the base of the lungs. As will be described in a later section (‘Pressures within the thorax’), ventilation is also distributed preferentially to the base of the lungs. However, the relative distribution of ventilation and perfusion is imperfect; there is around a three- to four-fold difference in ventilation from apex to base, compared with only a 16-fold difference in perfusion. Accordingly, there is a gradient of ventilation perfusion ratios ( /
/  ), and gas exchange, throughout the lungs. These variations in gas exchange also lead to local variations in the alveolar gas partial pressures. These phenomena are summarized in Figure 1.10.
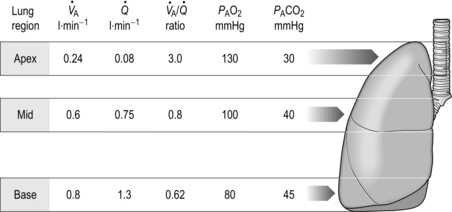
Figure 1.10 Variations in alveolar ventilation ( A) and perfusion (
 ). (With permission from Hicks GH, 2000. Cardiopulmonary anatomy and physiology. WB Saunders, Philadelphia, p. 352, Fig. 12-9.)
In summary, the factors influencing blood-flow distribution in the lungs include:
• Gravity (via alveolar pressure and hydrostatic pressure)
• Pulmonary arterial resistance
• Lung volume (via alveolar pressure)
• Alveolar gas pressure (influenced by lung volume and gravity).
• Hypoxic pulmonary vasoconstriction (HPV) is a unique response to hypoxia; in systemic blood vessels, hypoxia elicits vasodilatation. The logic of the differing responses is obvious since there is no point in perfusing areas of the lung that are poorly ventilated. In contrast, in the periphery, hypoxic tissue requires an increase in oxygen delivery and dilatation is the way to achieve this. The effect of HPV is to direct blood to ventilated regions, thereby improving  /
/  for the lung as a whole. In patients with conditions such as COPD (chronic obstructive pulmonary disease), in whom alveolar hypoxia is a chronic phenomenon, HPV can result in extensive pulmonary vasoconstriction. This increases PVR and the load placed upon the right side of the heart. As a result, both pulmonary oedema and right heart failure (cor pulmonale) can ensue.
• The pulmonary circulation is also influenced by a number of endogenous substances that induce vasodilatation via nitric oxide (NO) release by pulmonary vessel endothelial cells. These substances include acetylcholine, bradykinin, thrombin, serotonin, adenosine diphosphate and histamine. In addition, mechanical factors such as stretching and vessel wall shear stress may also induce release of NO and vasodilatation.
• The pulmonary vasculature falls under the influence of the autonomic nervous system. Sympathetic stimulation releases norepinephrine (noradrenaline), which stimulates α1-receptors in the smooth muscle of pulmonary arteries and arterioles, inducing vasoconstriction. The parasympathetic nervous system releases acetylcholine, which induces vasodilatation via the NO system described above. A recent study suggests that sympathoexcitation due to muscle metaboreflex activation induces pulmonary vasoconstriction (Lykidis et al, 2008), which has implications for gas exchange and exercise tolerance.
OXYGEN AND CARBON DIOXIDE TRANSPORT
Oxygen transport
The molecule Hb allows the blood to carry around 20 ml·l−1, which means that a normal resting cardiac output of 5 l·min−1 can deliver the required 250 ml·min−1 for resting metabolism. Each Hb molecule consists of a protein (globin) and haem (an iron-containing pigment). Globin consists of four protein chains (two α and two β), each connected to a haem group; thus each Hb contains four protein chains and four haem groups (Fig. 1.11). Each of the four haem groups can bind to one O2 molecule, so conceptually each Hb molecule has four ‘hooks’ available to attach to four molecules of O2.
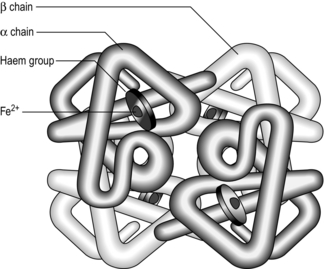
Figure 1.11 Schematic of the haemoglobin molecule. (With permission from Davies A, Moores C, 2010. The respiratory system. Churchill Livingstone, London, p. 101, Fig. 8.1, top.)

Thus, the chemical properties of Hb promote the loading of O2 (oxygenation) in the high-PO2 environment of the lungs, and unloading of O2 by the low-PO2 environment in the tissues. The binding of O2 to a haem group changes the shape of its protein chain, making it easier for the next O2 to bind to an adjacent haem group, and so on. This property is what gives the oxyhaemoglobin dissociation curve its characteristic sigmoid shape (Fig. 1.12).
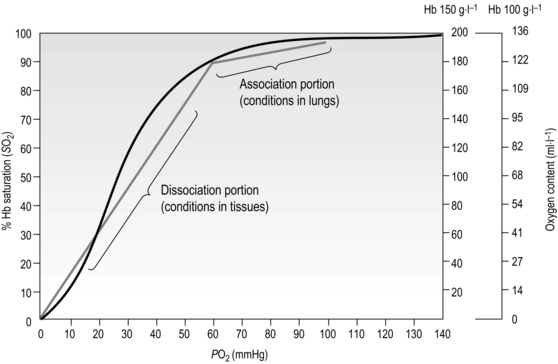
Figure 1.12 Association and dissociation of oxygen from haemoglobin (Hb). Note that the blood of a patient with anaemia, who may have a Hb content of only 100 g·l−1, can carry only 136 ml·l−1 of O2 (O2 content) when fully saturated, compared to an O2 content of 175–200 ml·l−1 in someone with normal Hb content of 150 g·l−1; but both people may have fully saturated Hb. (With permission from Beachey W, 1998. Respiratory care anatomy and physiology, 2nd edn. Mosby, St Louis, p. 140, Fig. 8.5.)
From Figure 1.12 it is apparent that the partial pressure of oxygen (PO2) plays a major role in determining Hb saturation (SO2), i.e., the percentage of haem groups that are bound to O2. The PO2 is the partial pressure of dissolved oxygen, and its arterial level is determined by the efficiency of diffusion from alveolus to plasma. i.e., movement of O2 from an area of high to an area of low PO2. Although 100% saturation may, on the face of it, indicate efficient O2 transport, the Hb content needs to be borne in mind when interpreting this (see Fig. 1.12 for details).
Whether O2 is loaded or unloaded from the Hb is determined by the prevailing PO2. In Figure 1.12 it is apparent that there is a range over which loading (association) and unloading (dissociation) take place. The difference in the gradient of the two regions has important functional consequences, since it means that loading takes place over a wide range of PO2, with the result that over 90% saturation can be achieved from a PO2 as low as 60 mmHg. Similarly, when the blood reaches the tissues, where unloading is required, relatively small decreases in PO2 result in a large unloading of O2. In theory, blood and tissue PO2 will equilibrate given sufficient time; however, this does not arise under normal circumstances because the blood transits the tissues before equilibration can take place. In anaemia, though, where O2 content is low, unloading even a small amount of O2 causes a steep fall in blood PO2 (because the absolute amount of O2 is low) reducing the driving pressure for further movement of oxygen to the tissues. Under these conditions, the supply of O2 to the tissues is impaired, creating tissue hypoxia despite normal arterial PO2, and saturation levels.
The position of the oxyhaemoglobin dissociation curve on the PO2 axis undergoes cyclic changes as the blood navigates the body. The curve shifts left or right depending upon the local conditions, and this is another property that has evolved to optimize loading and unloading of O2. There are four factors that determine the position of the curve on the PO2 axis (Fig. 1.13):
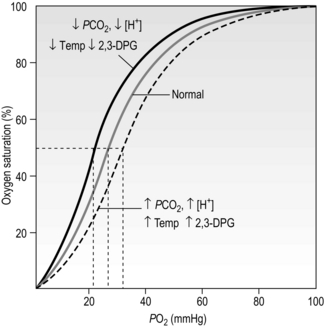
Figure 1.13 Effects of blood pH [H +], carbon dioxide partial pressure (PCO2), temperature (Temp), and 2,3-diphosphoglycerate (2,3-DPG) upon the position of the oxyhaemoglobin dissociation curve. (With permission from Beachey W, 1998. Respiratory care anatomy and physiology, 2nd edn. Mosby, St Louis, p. 143, Fig. 8.10.)
• Blood pH: The hydrogen ion concentration [H +] influences the affinity of Hb for O2. Increases in [H +] (decrease pH) decrease affinity and shift the curve rightwards, a phenomenon known as the Bohr shift. This promotes unloading of O2, but does not affect loading (because the curve is flat in this region). The conditions under which [H +] is elevated are the conditions that exist in metabolizing tissues. A decrease of as little as 0.2 pH units can increase the release of O2 by 25% at tissue levels of PO2.
• Carbon dioxide: As mentioned earlier, CO2 reacts with Hb (see next section) to form carboxyhaemoglobin. This reaction also shifts the curve rightwards, promoting unloading of O2 in the tissues, where CO2 is higher, and vice versa in the lungs.
• Temperature: An increase in temperature also shifts the curve to the right. Metabolizing tissues are warmer and have higher O2 requirements; the shift promotes unloading of O2 in warm tissues, and vice versa in cold tissues (where metabolism and O2 requirements are lower).
• 2,3-Diphosphoglycerate (2,3-DPG): 2,3-DPG is synthesized in RBCs and appears to be an important adaptive mechanism in conditions where tissue oxygen is low (anaemia, high altitude), or tissue O2 consumption is high (high intensity exercise). Elevation of 2,3-DPG shifts the curve rightwards. The level of 2,3-DPG is also elevated in diseases where there is hypoxaemia, such as COPD.
Carbon dioxide transport
 ), or in combination with proteins (carbamino compounds). The much smaller amount of CO2 carried in the RBCs belies the huge importance of the RBCs in CO2 transport; the RBCs are responsible for converting the CO2 into
  , which is then transported in the plasma.
protein NH2 + CO2 ↔ protein
 NHCOO− + H+
At the tissue level, even small additions of CO2 to the blood induce a rapid increase in PCO2, which creates a driving pressure that promotes movement of CO2 into the RBCs. The combination of CO2 with water is slow in the plasma, but is catalysed by carbonic anhydrase inside the RBC, driving the production of HCO3 − and H + inside the RBC. The reaction is kept in motion by the removal of H + by Hb, and the diffusion of HCO3 − into the plasma. The loss of the negative HCO3 − from the RBC would result in a change in the electrical charge of the RBCs, were it not for the movement of chloride ions (Cl −) into the RBC from the plasma (chloride shift; Fig. 1.14). The chloride shift also ensures the continued production and movement of HCO3 − out of the RBC.
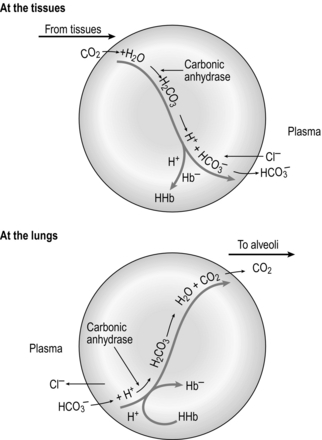
Figure 1.14 Schematic illustrating the formation of bicarbonate within red blood cells. (With permission from Davies A, Moores C, 2010. The respiratory system. Churchill Livingstone, London, p. 109, Fig. 8.6, top.)
Inside the RBC, CO2 combines readily with Hb to form carbamino haemoglobin (Hb NHCOO −):
 NH2 + CO2 ↔ Hb
 NHCOO− + H+
 ), are also buffered by Hb. It is important to understand that Hb carries O2 and CO2 at different sites: O2 in combination with its haem groups, and CO2 in combination with its amino groups. The deoxygenation of Hb at the tissue level increases the affinity of Hb for CO2 (Haldane effect). In contrast, carboxyhaemoglobin has a decreased affinity for O2 (Bohr effect). Thus, at a given PCO2, deoxygenated blood carries more CO2 than oxygenated blood. Deoxyhaemoglobin is also a weaker acid than oxyhaemoglobin and can therefore accept more H+, increasing the ability of the blood to carry CO2.
At the lungs, CO2 is released readily, and the oxygenation of Hb reduces its affinity for CO2 (see Fig. 1.14). All of the reactions above move to the left, CO2 is released from the RBCs, it transits the plasma in solution and is then blown off via the lungs. Of the CO2 eliminated at the lungs, 8% was transported there in simple solution, 80% as bicarbonate and 12% as carbamino compounds.
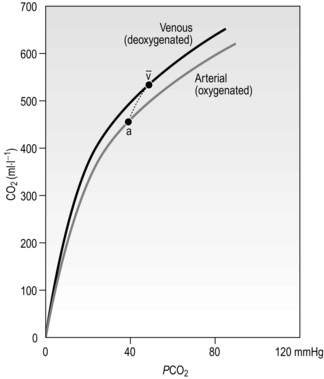
Figure 1.15 shows the relationship between PCO2 and the CO2 content of the blood. Note two differences compared with the oxygen dissociation curve in Figure 1.13: (1) it is much more linear, and (2) because there is no carrier molecule the y-axis is content, not saturation. In addition, because of the Haldane effect described above, the physiological dissociation curve is as indicated by the short dashed line. Consequently, additional CO2 is loaded and unloaded when O2 is being unloaded and loaded, respectively.
ACID–BASE BALANCE

Since this book is about the respiratory system, the current section will focus upon the role of breathing in acid–base balance. A more comprehensive description of the broader topic of acid–base balance can be found elsewhere (Davies & Moores, 2010).

Carbonic acid is a weak acid, which means that it does not dissociate completely to liberate H+, i.e., it liberates fewer H + ions than a strong acid. Because this reaction is reversible, addition of H + or removal of CO2 drives the equation to the left, effectively mopping up H+.
 , so that the ratio of HCO3 − to CO2 remains at 20. The beauty of this respiratory / renal buffering system is that, unlike other buffers such as haemoglobin, it is infinite.
The interrelationship of  , CO2 and pH is described by the Henderson–Hasselbach equation:
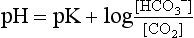
where pK is the pH at which the system works best to resist changes in pH; for normal arterial blood, its value is 6.10. By knowing two of the three variables ( , CO2 or pH), it is possible to calculate the third. Similarly, by knowing pH and pK, the ratio of HCO3 − to CO2 can be calculated (normally 20). Thus the equation allows prediction of the consequences of changes to each of the variables, as well as diagnosis of the source of abnormalities. An excellent tool for this purpose is the so-called Davenport diagram (Fig. 1.16), which despite being two dimensional is able to accommodate the three dimensions of
  , CO2 and pH by using isopleths of differing concentrations of CO2 (PCO2; the dotted lines on Fig. 1.16).
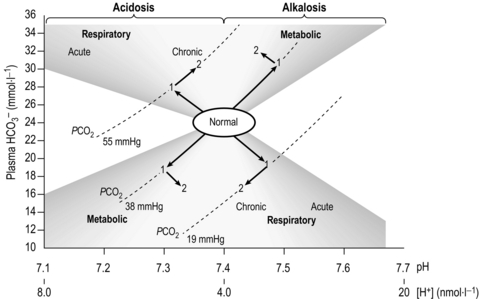
Figure 1.16 The Davenport diagram depicting the interrelationship of  , CO2 and pH. See text for details. (With permission from Davies A, Moores C, 2010. The respiratory system. Churchill Livingstone, London, p. 118, Fig. 8.11, top.)
• Respiratory alkalosis results when minute ventilation ( E) exceeds that required to remove metabolic CO2 production leading to loss of CO2 and an increase in pH (down and to the right).
• Respiratory acidosis results when  E is insufficient to remove metabolic CO2 production leading to retention of CO2 and a decrease in pH (up and to the left).
• Metabolic alkalosis results when there is a loss of H + (e.g., vomiting) leading to an increase in pH (up and to the right).
• Metabolic acidosis results when there is an excess of H + (e.g., exercise) leading to a decrease in pH (down and to the left).
• Standard bicarbonate is the bicarbonate concentration of the sample if it were exposed to a standard PCO2 of 5.3 kPa (40 mmHg), at a temperature of 37 degrees centigrade.
• Base excess and base deficit is the quantity of acid or alkali, respectively, required to return the sample (in vitro) to a normal pH at a PCO2 of 5.3 kPa (40 mmHg), at a temperature of 37 degrees centigrade. It is zero in a normal blood sample, and is represented on Figure 1.16 as the vertical displacement due to movement along the dotted lines.
 E and dyspnoea tend to be much higher in the presence of deconditioning, contributing to exercise intolerance.
CONTROL OF BREATHING
Despite over a century of research, the precise factors controlling breathing remain one of the great mysteries and controversies of physiology (Forster et al, 2012). At the heart of the mystery is the exquisite precision with which the respiratory controller is able to maintain homeostasis during metabolic disturbances such as exercise. The traditional, some would argue oversimplistic, view of the controller is that it operates like a heating thermostat, sensing departure from a predetermined set point and taking the action necessary to restore the status quo. Providing an understanding of the contemporary debate surrounding the control of breathing is beyond the scope of this book; instead, the following section will provide an overview of the system and its principal components. Interested readers can find out more about the one of the oldest controversies in physiology elsewhere (Poon et al, 2007).
Unlike the automatic control of the cardiovascular system, the respiratory system is under direct voluntary control, which is essential for a wide range of everyday activities, e.g., speaking, blowing, sniffing, straining, lifting, etc. The respiratory control centre resides within the brainstem, receiving a myriad of inputs from somatic receptors, as well as from other parts of the brain. The ‘job’ of the controller is to deliver a minute ventilation ( E) that is appropriate for the prevailing metabolic demand and external environment, thereby minimizing disturbances to internal homeostasis due to states such as exercise and hypoxia. In delivering a given
  E, the controller must also determine an appropriate breathing pattern, i.e., tidal volume (VT ) and respiratory frequency (fr). Furthermore, it must have sufficient plasticity that it can adapt to the effects of disease and traumatic injury. This is no mean feat, and it is perhaps unsurprising that a full understanding remains elusive. Figure 1.17 summarizes the principal factors that contribute to the control of breathing.
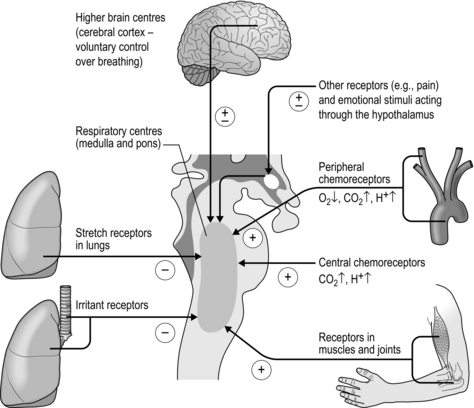
Figure 1.17 The principal afferent inputs to the respiratory control centres of the medulla and pons.
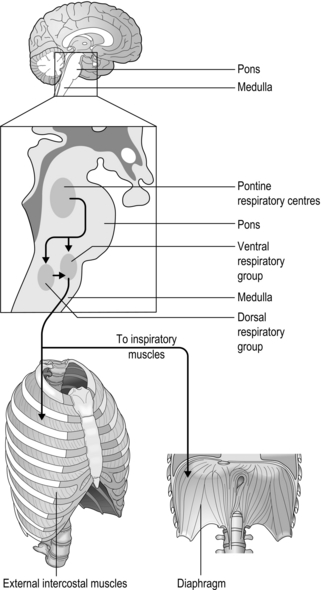
The rhythm generator
The basic rhythm of breathing originates from a central pattern generator located within the brainstem, which consists of the medulla and pons (Fig. 1.18). The basic pattern is refined by inputs from other regions of the brain and the thorax, producing a smoother, more refined basic pattern of breathing. During resting breathing, which requires only inspiratory muscle activity (see ‘Mechanics of breathing’), it is thought that the group of inspiratory neurons in the medulla drives inspiration until a critical level of inhibition from thoracic receptors and higher brainstem centres (pons) switches off their output; this initiates passive exhalation.
Afferent inputs to the respiratory controller
Hering–Breuer reflex
Named after the physiologists who first described it in 1868, this reflex has both respiratory and cardiovascular roles. The reflex originates from stretch receptors within the smooth muscle of the airways, and signals the extent of lung inflation. The input to the respiratory controller of these ‘slowly adapting pulmonary receptors’ occurs via the vagi, and is inhibitory to inhalation, but the signal also inhibits vagal restraint of heart rate, causing heart rate to quicken slightly during inhalation. If lung compliance is low, intrapleural pressure must be more negative for a given change in lung volume (see ‘Mechanics of breathing’). This increases the stretch receptor discharge because it creates greater mechanical stress across the airway, thereby terminating inhalation at a lower VT. This contributes to the rapid shallow breathing that is a feature of conditions that ‘stiffen’ the lungs, e.g., fibrosis, pulmonary hypertension. Another contributor is the sense of effort that arises from the greater contraction force of the inspiratory muscles.
Peripheral proprioceptors and metaboreceptors
The respiratory muscles also contain unmyelinated group III and IV afferents that sense the metabolic state of the muscle, specifically the accumulation of metabolites such as lactate. These so-called metaboreceptors are present in all muscles, and although they appear to have no role in the control of breathing they are important in the reflex control of the cardiovascular system. The respiratory muscle metaboreflex has been found to play a very important part in limiting respiratory and limb muscle perfusion during exercise, and will be discussed in more detail in Chapter 3 (Sheel et al, 2001).
Chemical control of breathing
 E as appropriate.
There are chemoreceptors at central and peripheral locations (see Fig. 1.17). The central chemoreceptors are located within the medulla and are responsive to hypercapnia and acidaemia. The peripheral chemoreceptors are located in the carotid arteries and aortic arch; they also respond to hypercapnia and acidaemia, as well as hypoxia. Around 80% of the total ventilatory response to CO2 is thought to derive from the peripheral chemoreceptors.
 E. The CSF contains no protein buffers, so changes in PCO2 stimulate breathing very quickly, but not as quickly as the peripheral chemoreceptors; thus the central chemoreceptors are thought to act primarily as monitors of steady-state PCO2 and brain perfusion. There is no medullary sensitivity to O2, and there is no response to changes in PCO2 below about 35 mmHg, or above about 70 mmHg.
Peripheral chemoreceptors
The peripheral chemoreceptors are located within the carotid bodies and aortic arch, the latter making the least important input to the respiratory controller (Fig. 1.19). The receptors in these locations respond extremely quickly to changes in CO2 by stimulating  E, and they are regarded as being the main sensing mechanisms for rapid changes in PCO2. The peripheral chemoreceptors also provide the only means of sensing hypoxaemia and acidaemia (H + cannot cross the blood–brain barrier to stimulate the central chemoreceptors). The structures in which the chemoreceptors are located are highly vascular, and have an extremely high blood flow – so high that their own metabolic requirements make virtually no impact on the composition of the blood flowing through them.
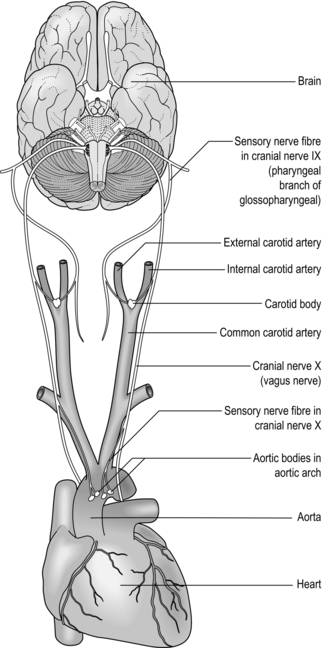
Figure 1.19 The peripheral chemoreceptors of the carotid bodies and aortic arch communicate with the respiratory controller via cranial nerves IX and X (glossopharyngeal and vagus, respectively).
At normal arterial PCO2 and [H +], the partial pressure of oxygen (PO2) in arterial blood must fall below around 60 mmHg before an increase in  E is stimulated. This is because of the sigmoid shape of the oxygen dissociation curve (see ‘Oxygen and carbon dioxide transport’), which dictates that haemoglobin saturation is relatively unaffected by changes in PO2 until the 60 mmHg threshold is exceeded. Accordingly, O2 plays no role in the control of breathing in healthy people at sea level. However, hypercapnia and acidaemia increase the sensitivity of the peripheral chemoreceptors, so in disease states where hypoxaemia and hypercapnia coexist breathing can be stimulated very strongly, especially during exercise. In contrast hypocapnia, which arises during acute exposure to hypoxia, depresses the ventilatory response to hypoxia. The peripheral chemoreceptors are also sensitive to a reduction in their perfusion.
Control of exercise hyperpnoea
Most recently, a new model has emerged, one that has its origin in the 1960s (Priban & Fincham, 1965), and has the process of optimization at its heart (Poon, 1983). The model proposes that the respiratory controller regulates  E and breathing pattern in such a way as to ‘keep the operating point of the blood at the optimum while using a minimum of energy’ (Priban & Fincham, 1965). This model is attractive for a number of reasons, but primarily because it recognizes the importance of respiratory sensation in the breathing strategy that is adopted. In addition, the model predicts not only the exercise hyperpnoea, but also respiratory system responses to a range of other challenges including chemoreceptor stimulation and loaded breathing, as well as respiratory muscle fatigue and weakness. Hitherto, the ventilatory response, and the breathing pattern used to deliver it, were thought to be regulated independently via a hierarchy of discrete feedbacks (Poon et al, 1992); the optimization model incorporates control of both
  E and breathing pattern into a single, unifying paradigm. Figure 1.20 contrasts the optimization model with the traditional, reductionist approach.
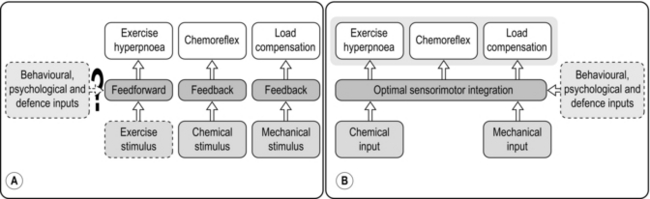
Figure 1.20 (A) The traditional hierarchical reductionist model of respiratory control, (B) the integrative optimization model of respiratory control. (With permission from Poon CS, Tin C, Yu Y, 2007. Respir. Physiol. Neurobiol. 159, 1–13.)
Numerous studies have shown that the ventilatory response to feedback stimuli, and to integrated responses such as exercise, is modulated by the work of breathing, suggesting that the final  E and breathing pattern are a ‘negotiated’ response by the controller to a range of feedback signals (Poon et al, 2007). Importantly, the optimization model of control also predicts correctly the behaviour of breathing pattern after a period of inspiratory muscle training, since an important facet of the model is the capacity of the respiratory pump to deliver a given ventilatory response; this capacity is related directly to the condition of the inspiratory muscles, entering the model via the ‘Mechanical input’ and modulated via the ‘Behavioural, physiological and defence inputs’ in Figure 1.20B.
MECHANICS OF BREATHING
Pressures within the thorax


where P1 and V1 are the original pressure and volume, and P2 and V2 are the new pressure and volume.
There are a number of different pressures within the thorax, each created by the physical properties of the surrounding tissues and their movements. Furthermore, some of these pressures also differ because of the effects of gravity upon the thoracic structures. The pressure that provides the primary driving force that links respiratory muscle actions to movement of air is intrapleural pressure, which is the pressure surrounding the lungs. Even when the respiratory muscles are relaxed, intrapleural pressure (Ppl) remains slightly negative relative to the inside of the alveoli (alveolar pressure, Palv) and to atmospheric pressure. The Ppl is created by a balance of two forces: the elasticity of the lungs pulling inwards and the chest wall pulling outwards (Fig. 1.21); the result is a slight vacuum of the intrapleural space (Ppl). Any connection between either the alveoli, or the atmosphere (through the chest wall), will cause Ppl to increase and the lung to collapse, as occurs in a pneumothorax.
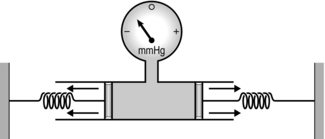
Figure 1.21 A simple model illustrating how intrapleural pressure is generated by the opposing forces of lung and chest wall elasticity. (With permission from Davies A, Moores C, 2010. The respiratory system. Churchill Livingstone, London, p. 30, Fig. 3.2.)
As mentioned previously, gravity influences thoracic pressures, resulting in gradients between the uppermost point and the lowermost point within the thorax. The gradients are largest in the upright position, and are the result of the fluid behaviour of the lung parenchyma (tissue). The lungs literally hang inside the thoracic cavity, and the effect of this mass upon Ppl can be measured as a slightly more negative pressure at the apex of the lung than at the base. This occurs because the elastic force pulling inwards is supplemented at the top of the lungs by the force of gravity pulling the lungs downwards and away from the inside of the upper thoracic cavity. In contrast, at the base of the thorax the lungs are pressing outwards slightly against the lower thoracic cavity. This is also the reason why the basal regions of the lung are better ventilated. This may appear counterintuitive, but the more negative apical Ppl means that the apical alveoli are more distended, have a higher recoil pressure and are therefore less compliant (less easy to expand; see ‘Lung compliance’). Accordingly, air will flow preferentially to the more compliant, basal alveoli.
Lung and thoracic cage compliance
Recalling the earlier ‘balloon in jar’ model of the thorax can also assist in understanding another important property of the lungs, viz., compliance. Compliance is the reciprocal of elastance, representing the ease with which a material can be stretched; the lung behaves to a certain extent according to Hooke’s law, which states that an elastic structure changes dimensions in proportion to the force applied to it. In the case of the lungs, the force is pressure and the dimension is volume. The interrelationship of pressure and volume of the lungs is more complex than Hooke’s law implies, because the proportionality (linearity) of the relationship is limited. Indeed, the pressure and volume relationship of the lungs is sigmoid, and also shows a property called hysteresis, i.e., it is different during inflation and deflation (Fig. 1.22).
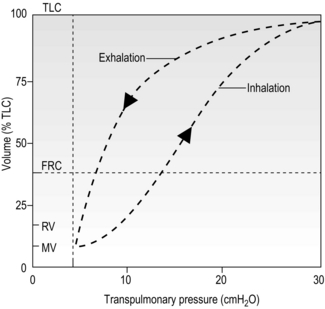
Figure 1.22 Diagram illustrating the pressure–volume relationship of the lungs during inhalation and exhalation. The differing characteristics during inflation and deflation are called hysteresis (see text for details). TLC, total lung capacity; FRC, functional residual volume; RV, residual volume; MV, minimal volume. (With permission from Berne RM, Levy MN, 1993. Physiology, 3rd edn, Mosby, St Louis.)
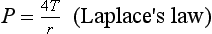
where P is pressure inside the sphere, T is wall tension and r is radius of curvature. Because the alveoli have only one surface exposed to the air, 4T becomes 2T for the alveoli.
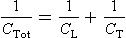
where CTot is total compliance, CL is lung compliance and CT is thoracic compliance. Note that the combined compliance in parallel is always smaller than any of the individual compliances, whereas the opposite is true for compliances in series.
Airway resistance

where R is resistance, P1 − P2 is driving pressure, and  is air flow.
The resistance to air flow through a tube is produced by friction between the gas molecules themselves, as well as friction between the gas molecules and the wall of the tube. Accordingly, resistance is greater when gas density or viscosity is higher, and tube diameter is narrower. The resistance of the respiratory system is a dynamic property that is determined by both anatomy and physiology. The anatomy of the airways is such that their branching structure results in an increase in the total cross-sectional area of the airways, which expands exponentially after the 10th generation (Fig. 1.23).
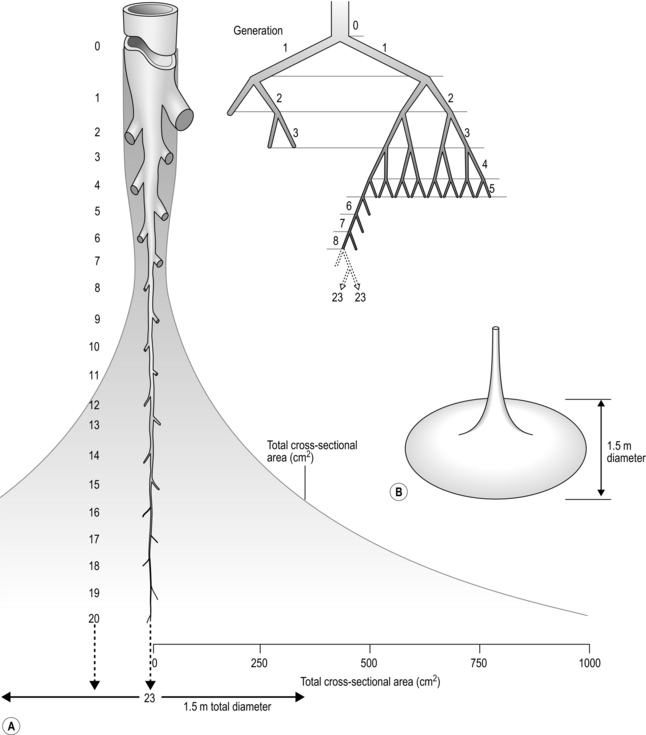
Figure 1.23 Schematic illustrating changes in airway diameter and total cross-sectional area with successive airway generation in two (A) and three dimensions (B). (With permission from Davies A, Moores C, 2010. The respiratory system. Churchill Livingstone, London, p. 47, Fig. 4.9.)
Accompanying the increase in total surface area is a decrease in the individual surface area of each airway generation. As can be seen from Figure 1.23, the rapid increase in the number of airways more than offsets the effect of their decreasing diameter upon total airway resistance. Accordingly, of the airway resistance emanating below the larynx, 80% derives from the trachea and bronchi.
Another important factor that influences airway resistance is bronchial smooth muscle tone, which exerts an extremely powerful influence upon airway resistance. This site of variable airway resistance is in a part of the bronchial tree (generations 7–14) where the beneficial effects of airway proliferation upon total cross-sectional area are relatively modest. Accordingly, any reduction in their diameter exerts a potent influence upon resistance in this part of the bronchial tree. Conditions such as asthma influence bronchial smooth muscle tone. Readers are referred elsewhere for further information about the pathophysiology of asthma (Murphy & O’Byrne, 2010).
Exhalation mechanics
During passive exhalation, which occurs through elastic recoil, intrapleural pressure remains negative and the pressure across the intrathoracic airways tends to keep the airways open. However, during exercise hyperpnoea and forced exhalation, the intrapleural pressure becomes positive and mechanical factors that were holding the airways open, such as radial traction, are reduced. As a result, airway diameter reduces, leading to dynamic airway collapse and attendant expiratory flow limitation (Fig. 1.24). The small airways are most vulnerable to collapse as they depend entirely upon factors such as radial traction for their patency.
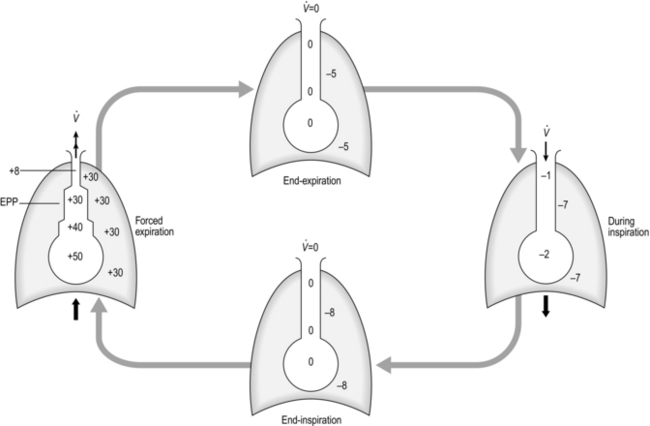
Figure 1.24 Schematic illustrating pressure changes (in cmH2O) across intrathoracic airways during different phases of respiration. See text for details. EPP, equal pressure point. (With permission from Davies A, Moores C, 2010. The respiratory system. Churchill Livingstone, London, p. 55, Fig. 4.18.)
As can be seen in Figure 1.24, during forced exhalation there is a pressure gradient inside the airways (most positive at the alveolar end, decreasing to atmospheric pressure at the mouth); there is a point along the airway tree where intrapleural pressure equals the pressure inside the airway. This point is known as the equal pressure point (EPP), which moves progressively towards the smaller airways as lung volume decreases. This migration occurs because the contribution of the elastic recoil of the lung to the production of a positive pressure inside the airway diminishes as lung volume diminishes. Air is trapped behind the collapsed airways, but exerting more expiratory force simply tightens the collapse. In healthy lungs, the EPP does not arise above FRC, but where airway walls and / or alveoli have been damaged by disease the lungs’ elastic recoil and radial traction are reduced and the EPP arises above FRC. Dynamic airway collapse underlies the characteristic triangular shape of the expiratory limb of a flow volume loop in healthy lungs, as well as its scooped appearance in obstructive lung disease (see ‘Lung volumes and capacities’).
Effects of lung properties upon breathing
The lungs have a heterogeneous distribution of compliance, resistance and intrapleural pressure, which affect the dynamics of inflation, the distribution of air flow and the work of breathing. This arises because the system connects to the atmosphere via a single conduit (trachea), and all parts must respond within the same duration of inspiratory and expiratory time. Thus, the parts of the lung with high resistance and / or low compliance fill more slowly and / or less completely. During exercise, the time available for filling and emptying the lungs is reduced, exacerbating heterogeneity. In addition, expiratory flow limitation may slow exhalation to the extent that inhalation may commence whilst the pressure inside some airways is still positive, creating an intrinsic (i.e., auto) positive end-inspiratory pressure (PEEPi). These phenomena induce a process known as hyperinflation, which maintains expiratory air flow but at a cost. Hyperinflation forces tidal volume (VT) towards total lung capacity (TLC), where the elastic load to breathing is higher. Thus, somewhat counter-intuitively, the work of the inspiratory muscles is increased by expiratory flow limitation (see also Fig. 3.1). The heterogeneity of air distribution in the lungs also affects gas exchange via its effect upon ventilation / perfusion inequalities, i.e., parts of the lung may be perfused, but not ventilated, and vice versa, reducing the area available for gas exchange (see ‘Gas exchange’, above). Areas of the lung where ventilation and perfusion are mismatched, and do not contribute effectively to gas exchange, are known as alveolar dead space.
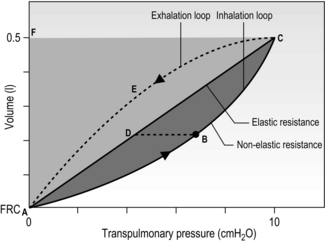
Work of breathing
Respiratory work is done when pressure (generated by respiratory muscles) moves air into or out of the lungs. Figure 1.25 is a schematic pressure–volume relationship, illustrating the elastic and resistive work of breathing (WOB) for a 0.5-litre tidal inhalation above FRC. The inspiratory work done in overcoming elastic opposition to lung inflation is given by the area ADCFA, whilst the work done to overcome the flow-resistive (frictional) forces is given by ABCDA. The total WOB is therefore given by the area ABCFA. If inspiratory effort is halted mid-inhalation, and the airway is occluded, pressure falls to point D. Slightly more than half (~ 65%) of the WOB at rest overcomes elastic forces, with the remainder overcoming airway resistance. Exercise and disease alter this ratio; for example, increasing VT elevates elastic work, whereas higher flow rates increase the flow-resistive component of the WOB. By mechanisms that are not fully understood, the respiratory control system selects a balance of VT and breathing frequency that tends to minimize the WOB for a given situation.
Lung volumes and capacities
 E). (The dot over the V indicates that this is a flow and not a volume.)
 E displays a more than 10-fold increase between rest and peak exercise, with typical resting values of 8–10 l·min−1 and values approaching 150–200 l·min−1 during maximal exercise in highly trained athletes. The highest values for
  E are recorded in athletes such as rowers, where it is not uncommon for
  E to reach 250 l·min−1 at peak exercise in elite, open-class oarsmen. In contrast, peak
  E in a patient with moderate COPD may be only 40 l·min−1.
During exercise  E increases via a combination of increases in VT and fr (see Ch. 2), and the increase in VT occurs by utilizing reserve lung capacities for inspiration and expiration. All but one of the volume subdivisions of the total lung capacity can be measured using a simple spirometer (residual volume, and thus also functional residual capacity, requires specialized equipment). The so-called static lung volumes are illustrated in Figure 1.26 and definitions are provided below:
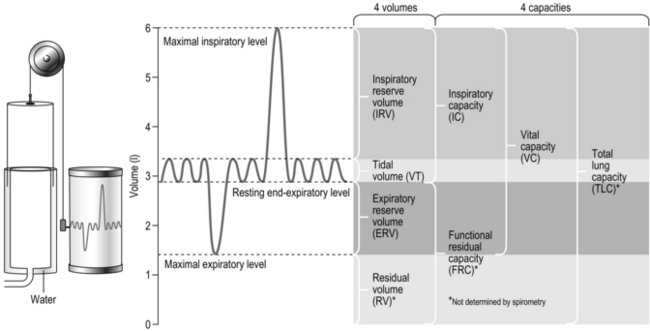
Figure 1.26 Static lung volumes and capacities on a volume–time spirogram, with typical healthy adult values shown.
• Total lung capacity (TLC): The volume of air in the lungs at full inspiration. This cannot be measured without access to specialized equipment.
• Vital capacity (VC): The maximum volume that can be exhaled / inhaled between the lungs being completely inflated and the end of a full expiration. VC can be measured during either a ‘forced’ (with maximal effort; FVC) or relaxed manoeuvre (VC). The relaxed manoeuvre is more appropriate for patients with lung disease whose airways tend to collapse during a forced manoeuvre.
• Residual volume (RV): The volume of air remaining in the lungs at the end of a full expiration. This cannot be measured without access to specialized equipment.
• Functional residual capacity (FRC): The volume of air remaining in the lungs after a resting tidal breath. This changes during exercise, when it becomes known as end-expiratory lung volume (EELV).
• Expiratory and inspiratory reserve volumes (ERV / IRV): The volumes available between the beginning or end of tidal breath and TLC and RV, respectively.
Lung function is influenced by a number of physiological and demographic factors, as well as by the presence of disease. For example, there is a strong influence of body size, gender and age, as well as ethnicity. For this reason, there are population-specific prediction equations that assist in the interpretation of measured values. Generally, lung volumes are greater in larger individuals, are lower in women, and decrease with age. A component of the effect of gender appears to be independent of the effect of body size (Becklake, 1986).
A description of the methods used to assess lung volumes is beyond the scope of this book, and the reader is referred to the joint American Thoracic Society and European Respiratory Society guidelines for further information on assessment (Wanger et al, 2005) and interpretation (Pellegrino et al, 2005).
The condition of the airways (as distinct from the measurement of lung volumes) can be assessed by referencing changes in volume to time, thereby deriving flow (dynamic lung function). Obstructive lung diseases such as asthma are diagnosed by measuring the rate of expiratory air flow during forced expiratory manoeuvres. By plotting either volume against time (Fig. 1.27A) or flow against volume (by integration of the flow signal) (Fig. 1.27B), a ‘spirogram’ is constructed. Figure 1.27A and B illustrate each of these approaches and identify a number of parameters that provide information about airway function (see figure legend for details). The most commonly used index of airway calibre is the forced expiratory volume in 1 second (FEV1), which can be assessed using either a bellows (wedge) spirometer, or using electronic spirometry. Because FEV1 is influenced by vital capacity, it is expressed as a fraction of vital capacity (FEV%).
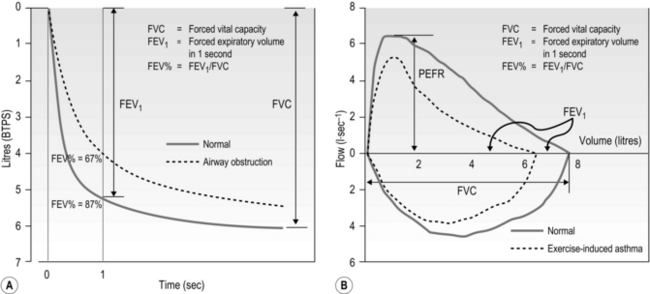
Figure 1.27 Dynamic lung volumes. (A) Volume plotted against time, (B) flow plotted against volume, with values shown before (solid lines) and after (dashed lines) exercise for a patient with exercise-induced asthma. In (B) the volume corresponding to FEV1 under the normal and obstructed conditions is identified. BTPS, body temperature and pressure saturated; PEFR, peak expiratory flow rate.
Electronic spirometers allow the construction of so-called flow–volume loops (Fig. 1.27B). A description of the methods used to undertake spirometry is beyond the scope of this book, and the reader is referred to the joint American Thoracic Society and European Respiratory Society guidelines for further information on assessment (Miller et al, 2005) and interpretation (Pellegrino et al, 2005).
Finally, consideration of the effect of the dead-space volume is required, since this becomes more important functionally in older people and those with lung and / or heart disease. Gas exchange takes place only in areas of the lung that have alveoli, and within these regions it takes place only in those units where there is adequate ventilation and perfusion. Accordingly, there are two types of dead space in the lung: (1) the conducting airways, and (2) alveolar dead space; their sum is known as physiological dead space. Only that part of VT entering perfused alveoli contributes to gas exchange; the remainder ventilates the dead space and is ‘wasted’. The proportion of wasted total ventilation is determined by the ratio of dead space volume to tidal volume (VD / VT). It therefore depends not only upon the influence of anatomy and physiology, but also upon breathing pattern. If VT is low then a greater proportion of the breath is wasted in the dead space. As a consequence, in order to deliver the required level of alveolar air flow ( A), breathing frequency and total
  E must increase, raising the work of breathing. For instance, consider an example in which the gas exchange requirement of running on level ground corresponds to an alveolar ventilation of 54 l·min−1. Table 1.1 illustrates the repercussions of two different breathing strategies that will both deliver this
  A.
A.
Table 1.1
Influence of VT upon the  E requirement of exercise
| Deep breathing | Shallow breathing |
| Alveolar ventilation = 54 l·min−1 | Alveolar ventilation = 54 l·min−1 |
| Dead-space ventilation = 4.3 l·min−1 | Dead-space ventilation = 9.5 l·min−1 |
| Minute ventilation = 58.3 l·min−1 | Minute ventilation = 63.5 l·min−1 |
| Physiological dead space = 0.15 l | Physiological dead space = 0.15 l |
| Tidal volume = 2.0 l | Tidal volume = 1.0 l |
| Dead space / tidal volume = 0.15 / 2 = 7.5% | Dead space / tidal volume = 0.15 / 1 = 15% |
| Breathing frequency = 29.2 breaths·min−1 | Breathing frequency = 63.5 breaths·min−1 |
Mechanical properties of respiratory pump muscles
The ability of the respiratory muscles to generate the pressure differentials that bring about lung ventilation is influenced by the act of breathing itself. Breathing results in changes in the length (lung volume) and the speed (air-flow rate) of muscle shortening, both of which change the ability of the respiratory muscles to generate pressure (Leblanc et al, 1988). The implications of these interactions are important, especially in patients where disease exacerbates the detrimental influence of changing volume and flow.
The length–tension (volume–pressure) relationship of the respiratory pump muscles is illustrated in Figure 1.28. The capacity to generate inspiratory pressure is greatest when the lungs are empty and smallest when they are full (Rahn et al, 1946). Conversely, the capacity to generate expiratory pressure is greatest when the lungs are full and smallest when they are empty. Thus, inhalation and exhalation commence at the lung volumes where the respective muscles are strongest. This relationship has functional implications because, as VT increases with increasing exercise intensity, it expands into the inspiratory reserve volume. Thus, the end of inhalation (end-inspiratory lung volume, EILV) occurs closer to TLC, which is also the region where the inspiratory muscles are weakest (see also Ch. 2, Fig. 2.1). This so-called functional weakening of the inspiratory muscles during lung inflation increases susceptibility to fatigue, for two reasons: (1) the muscles are weaker, and (2) they must overcome a higher elastic load (see ‘Mechanics of breathing’, below). Functional weakening also has implications for the perception of dyspnoea (see ‘Dyspnoea and breathing effort’, below), as well as how the respiratory muscles can be overloaded during resistance training, which will be considered in Chapter 6.
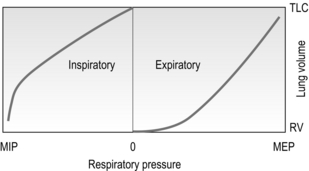
Figure 1.28 Schematic illustrating the effect of lung volume on the static pressure generating capacity of the respiratory muscles. Note that MIP is maximized at RV, whereas MEP is maximized at TLC. The pressure lines do not intersect at TLC and RV because of the effects of gas compression and decompression upon lung volume, respectively. RV = residual volume; TLC = total lung capacity; MIP = maximal inspiratory pressure; MEP = maximal expiratory pressure.
The force–velocity (pressure–flow) relationship of the respiratory pump muscles also has important repercussions. Unfortunately, this relationship is impossible to study in isolation from the volume–pressure relationship since the velocity component is the velocity of shortening, which implies a change in length. In the only study of its kind to date (Leblanc et al, 1988), the effects of both the volume–pressure and pressure–flow relationships of the inspiratory muscles were characterized and their influence upon pressure generating capacity quantified; the capacity of the inspiratory muscles to generate dynamic pressure was predicted to decrease by 17% for each 10% of the total lung capacity that is accounted for by an increased VT above functional residual capacity, and by 5% for each l·s−1 increase in inspiratory flow (Fig. 1.29).
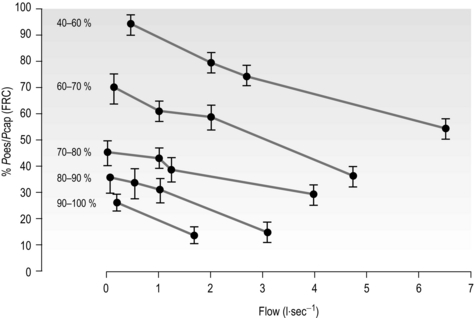
Figure 1.29 Maximum inspiratory oesophageal pressure (Poes). Pcap, maximal pressure generating capacity. (Reproduced from Leblanc P, Summers E, Inman MD, et al, 1988. J. Appl. Physiol. 64, 2482–2489 with permission of JAP.)
Thus, as VT and inspiratory flow increase with exercise, a given level of tension represents a relatively greater percentage of the maximum tension that can be developed, and requires a greater inspiratory motor drive. In moderately fit, healthy individuals, the peak dynamic pressure generated by the inspiratory muscles, expressed relative to the ability to generate pressure at the lung volumes and flows adopted during maximal exercise, is only 40–60% (Leblanc et al, 1988). However, in circumstances where muscle-operating length is reduced (e.g., hyperinflated patients with COPD), or where the velocity of shortening must increase to meet elevated flow requirements (e.g., tachypnoeic patients with heart failure), this percentage may increase considerably. Such conditions arise in a number of disease states, and they render the inspiratory muscles, in particular, vulnerable to fatigue.
The non-respiratory roles of the respiratory muscles are described in Chapter 3, and the assessment of respiratory muscle function is described in Chapter 6 (‘Assessment of respiratory muscle function’).
DYSPNOEA AND BREATHING EFFORT
Dyspnoea, or breathlessness, is defined as an ‘uncomfortable sensation of breathing’, or ‘the consciousness of the necessity for increased respiratory effort’ (Meakins, 1923). By definition then, dyspnoea is a subjective experience, and one that is therefore influenced by a combination of physiological and psychological factors (Williams et al, 2010). Patients with conditions as wide ranging as cancer and neurological disorders experience disabling bouts of dyspnoea, but the clinical groups that most commonly present with disabling dyspnoea as their primary symptom are those with asthma, COPD and heart failure. A comprehensive review of the pathophysiology of dyspnoea is beyond the scope of this book, but what follows is an overview of the subject, with particular emphasis upon the role of breathing mechanics and the respiratory muscles in its genesis.
The conscious awareness of dyspnoea is a distillation of the somatic feedback arising from numerous chemical and mechanical receptors, modulated by psychological factors related to the affective state of the individual (Williams et al, 2010). There are three principal dimensions of dyspnoea: (1) ‘air hunger’, (2) work / effort and (3) chest tightness.
In healthy people, ‘air hunger’, is perceived as being more unpleasant than work / effort, and its unpleasantness varies independently of its intensity (Banzett et al, 2008). The relative importance of different descriptors of dyspnoea has also been explored by applying a technique called principal component analysis (Smith et al, 2009). Descriptors were compared in patients with asthma, COPD, interstitial lung disease and idiopathic hyperventilation and in healthy people. Interestingly, air hunger was found to be the dominant quality of dyspnoea during exercise, irrespective of the pathophysiological differences between the individuals reporting it. The authors suggest that the attainment of a mechanical limit to breathing at the end of exercise may provide a unifying explanation for their observations. Of course, the attainment of this limit is influenced to some extent by the ability of the inspiratory muscles to utilize the available inspiratory reserve volume to expand tidal volume. Thus, the mechanical work of the inspiratory muscles may also contribute to the sensation of air hunger during exercise. This is consistent with the notion that dyspnoea can be explained by a single model that is applicable to a wide range of clinical conditions (Moxham & Jolley, 2009). This model is based upon the balance, or lack of it, between the demand for inspiratory muscle work and the capacity of the muscles to meet this demand.
The closest functional correlates of dyspnoea are not indices of airway obstruction or gas exchange impairment, but inspiratory muscle function (O’Donnell et al, 1987; Killian & Jones, 1988) and the degree of lung hyperinflation (O’Donnell et al, 1998; Marin et al, 2001) – in other words, the relative load upon the inspiratory muscles. The sense of effort associated with any muscular act is the result of a balance between the force that is being demanded and the muscle’s capacity to supply force (its strength), i.e., the demand / capacity relationship. A helpful analogy is to consider the sensations associated with lifting an object. If the object is heavy, the sense of effort associated with lifting it is high compared with lifting a light object. However, if we increase the strength of the muscles (give them greater capacity) then the effort of lifting a given object is reduced because the muscles’ capacity to supply force has been increased. These principles apply equally well to the muscles employed during breathing.
Central to this demand / capacity model of dyspnoea are the neurophysiological mechanisms responsible for sensing the breathing effort or, as Meakins (1923) put it, ‘the consciousness of the necessity for increased respiratory effort’. Meakins’ definition of dyspnoea was the first to provide a unifying theory to explain the presence of dyspnoea in both patients and healthy people, and was developed further in the 1960s, when the term ‘length–tension inappropriateness’ (LTI) was created to explain how the sensation of dyspnoea might be transduced to consciousness (Campbell, 1966). Campbell argued that human beings have a quantitative, conscious appreciation of the degree of effort associated with breathing and that dissociation, or a mismatch, between the central respiratory motor activity (efferent output) and the mechanical response of the respiratory system (afferent feedback) produces a sensation of respiratory discomfort, or dyspnoea. More recently, the LTI paradigm has been ‘rebranded’ as neuromechanical uncoupling, and generalized to include not only afferent sensory inputs from respiratory muscles but also information emanating from receptors throughout the respiratory system (ATS, 1999). When viewed in the context of neuromechanical uncoupling, the role of respiratory muscle function in the perception of dyspnoea becomes intuitively predictable. Thus the intensity of dyspnoea is increased when changes in respiratory muscle length (i.e., volume) or tension (i.e., pressure) are inappropriate for the outgoing motor command. In turn, changes in capacity of the muscles to deliver ventilation, or in the mechanical loads that they must overcome in doing so, contribute to the perceived appropriateness of the ventilatory response, relative to the motor command. Furthermore, the size of the motor command itself is influenced by the contractile properties of the inspiratory muscles and the loads they overcome during breathing. The greater the magnitude of the discrepancy between efferent drive and afferent feedback, the greater is the intensity of dyspnoea.
Disease affects both sides of the demand / capacity relationship, weakening respiratory muscles and increasing the mechanical loads that they must overcome in order to sustain breathing (see Ch. 3, ‘Changes in breathing mechanics and respiratory muscle function’). Acting via neuromechanical uncoupling, this imbalance is perceived as dyspnoea. Thus, dyspnoea is the inevitable consequence of inspiratory muscle weakness combined with an increase in the elastic and / or resistive work of breathing. In the early and mild stages of disease, this imbalance may manifest itself only during exercise, but as the severity of the impairments increases then dyspnoea occurs also at rest.
The assessment of dyspnoea and breathing effort is described in Chapter 7 (‘Assessing patient needs’).
References
ATS. Dyspnea: Mechanisms, assessment, and management: A consensus statement. Am. J. Respir. Crit. Care Med. 1999;159:321–340.
Banzett, R.B., Pedersen, S.H., Schwartzstein, R.M., et al. The affective dimension of laboratory dyspnea: air hunger is more unpleasant than work / effort. Am. J. Respir. Crit. Care Med. 2008;177:1384–1390.
Beachey, W. Respiratory care anatomy and physiology, second ed. St Louis: Mosby; 1998.
Becklake, M.R. Concepts of normality applied to the measurement of lung function. Am. J. Med. 1986;80:1158–1164.
Berne, R.M., Levy, M.N. Physiology, third ed. St Louis: Mosby; 1993.
Boucher, V.J., Ahmarani, C., Ayad, T. Physiologic features of vocal fatigue: electromyographic spectral-compression in laryngeal muscles. Laryngoscope. 2006;116:959–965.
Brancatisano, T.P., Dodd, D.S., Engel, L.A. Respiratory activity of posterior cricoarytenoid muscle and vocal cords in humans. J. Appl. Physiol. 1984;57:1143–1149.
Buchler, B., Magder, S., Katsardis, H., et al. Effects of pleural pressure and abdominal pressure on diaphragmatic blood flow. J. Appl. Physiol. 1985;58:691–697.
Campbell, E.J.M. The relationship of the sensation of breathlessness to the act of breathing. In: Howell J.B.L., ed. Breathlessness. London: Blackwell Scientific; 1966:55–64.
Davies, A., Moores, C. The respiratory system: basic science and clinical conditions. London: Churchill Livingstone Elsevier; 2010.
Forster, H.V., Haouzi, P., Dempsey, J.A. Control of breathing during exercise. Comp. Physiol. 2012;2(1):743–777.
Gollnick, P.D., Armstrong, R.B., Saubert, C.W., et al. Enzyme activity and fiber composition in skeletal muscle of untrained and trained men. J. Appl. Physiol. 1972;33:312–319.
Guenette, J.A., Sheel, A.W. Exercise-induced arterial hypoxaemia in active young women. Appl. Physiol. Nutr. Metab. 2007;32:1263–1273.
Hicks, G.H. Cardiopulmonary anatomy and physiology. Philadelphia: WB Saunders; 2000.
Hoh, J.F. Laryngeal muscle fibre types. Acta Physiol. Scand. 2005;183:133–149.
Hussain, S.N. Regulation of ventilatory muscle blood flow. J. Appl. Physiol. 1996;81:1455–1468.
Killian, K.J., Jones, N.L. Respiratory muscles and dyspnea. Clin. Chest Med. 1988;9:237–248.
Leblanc, P., Summers, E., Inman, M.D., et al. Inspiratory muscles during exercise: a problem of supply and demand. J. Appl. Physiol. 1988;64:2482–2489.
Li, Z.B., Lehar, M., Nakagawa, H., et al. Differential expression of myosin heavy chain isoforms between abductor and adductor muscles in the human larynx. Otolaryngol. Head Neck Surg. 2004;130:217–222.
Lumb, A.B. Nunn’s applied respiratory physiology. Churchill Livingstone Elsevier; 2010.
Lykidis, C.K., White, M.J., Balanos, G.M. The pulmonary vascular response to the sustained activation of the muscle metaboreflex in man. Exp. Physiol. 2008;93:247–253.
Marin, J.M., Carrizo, S.J., Gascon, M., et al. Inspiratory capacity, dynamic hyperinflation, breathlessness, and exercise performance during the 6-minute-walk test in chronic obstructive pulmonary disease. Am. J. Respir. Crit. Care Med. 2001;163:1395–1399.
Meakins, J. The cause and treatment of dyspnea in cardiovascular disease. Br. Med. J. 1923;1:1043–1045.
Miller, M.R., Hankinson, J., Brusasco, V., et al. Standardisation of spirometry. Eur. Respir. J. 2005;26:319–338.
Moxham, J., Jolley, C. Breathlessness, fatigue and the respiratory muscles. Clin. Med. 2009;9:448–452.
Murakami, Y., Kirchner, J.A. Mechanical and physiological properties of reflex laryngeal closure. Ann. Otol. Rhinol. Laryngol. 1972;81:59–71.
Murphy, D.M., O’Byrne, P.M. Recent advances in the pathophysiology of asthma. Chest. 2010;137:1417–1426.
O’Donnell, D.E., Sanii, R., Anthonisen, N.R., et al. Effect of dynamic airway compression on breathing pattern and respiratory sensation in severe chronic obstructive pulmonary disease. Am. Rev. Respir. Dis. 1987;135:912–918.
O’Donnell, D.E., Lam, M., Webb, K.A. Measurement of symptoms, lung hyperinflation, and endurance during exercise in chronic obstructive pulmonary disease. Am. J. Respir. Crit. Care Med. 1998;158:1557–1565.
Pellegrino, R., Viegi, G., Brusasco, V., et al. Interpretative strategies for lung function tests. Eur. Respir. J. 2005;26:948–968.
Polla, B., D’Antona, G., Bottinelli, R., et al. Respiratory muscle fibres: specialisation and plasticity. Thorax. 2004;59:808–817.
Poon, C.S. Optimal control of ventilation in hypoxia, hypercapnia and exercise. New York: Elsevier; 1983.
Poon, C.S., Lin, S.L., Knudson, O.B. Optimization character of inspiratory neural drive. J. Appl. Physiol. 1992;72:2005–2017.
Poon, C.S., Tin, C., Yu, Y. Homeostasis of exercise hyperpnea and optimal sensorimotor integration: the internal model paradigm. Respir. Physiol. Neurobiol. 2007;159:1–13. [discussion 14–20].
Priban, I.P., Fincham, W.F. Self-adaptive control and respiratory system. Nature. 1965;208:339–343.
Rahn, H., Otis, A.B., Chadwick, L.E., et al. The pressure–volume diagram of the thorax and lung. Am. J. Physiol. 1946;146:161–178.
Sheel, A.W., Derchak, P.A., Morgan, B.J., et al. Fatiguing inspiratory muscle work causes reflex reduction in resting leg blood flow in humans. J. Physiol. 2001;537:277–289.
Smith, J., Albert, P., Bertella, E., et al. Qualitative aspects of breathlessness in health and disease. Thorax. 2009;64:713–718.
Suzuki, M., Kirchner, J. The posterior cricoarytenoid as an inspiratory muscle. Ann. Otol. Rhinol. Laryngol. 1969;78:849–863.
Thibodeau, G.A., Patton, K.T. Anatomy and physiology, third ed. St Louis: Mosby; 1996.
Wanger, J., Clausen, J.L., Coates, A., et al. Standardisation of the measurement of lung volumes. Eur. Respir. J. 2005;26:511–522.
Williams, M., Cafarella, P., Olds, T., et al. Affective descriptors of the sensation of breathlessness are more highly associated with severity of impairment than physical descriptors in people with chronic obstructive pulmonary disease. Chest. 2010;138(2):315–322.
[/level-membership-for-pulmolory-and-respiratory-category][not-level-membership-for-pulmolory-and-respiratory-category]Chapter 1
Anatomy and physiology of the respiratory system
This chapter is not intended to provide a comprehensive description of the anatomy and physiology of the respiratory system; rather it is intended to provide a level of understanding that is required to underpin the remainder of this book. Readers wishing to gain a deeper insight into this interesting area are referred to the work of Davies & Moores (2010) and Lumb (2010).
THORACIC STRUCTURE AND FUNCTION
The respiratory system is illustrated in Figure 1.1 and is made up of all the structures that guide air into the lungs (nose, mouth, and airways), plus the lungs themselves and the structures that surround the lungs (thoracic cavity, including the rib cage). The right lung comprises three lobes, whilst the left has two, which allows space for the heart to lie between the left lobes, sloping toward the left. The weight of both adult lungs is between 0.7 and 1.0 kg (1.5 and 2.2 pounds) when weighed at autopsy; however, in life they probably weigh twice this amount because the blood vessels within the lungs (pulmonary circulation) will be filled with about 0.9 litres of blood (weighing about 0.95 kg [2.1 pounds]). In other words, the adult human has about 2 kg (4.4 pounds) of lung tissue hanging inside the rib cage.
The airways
The airways branch a total of 23 times, creating a tree-like structure that ends in the alveoli, where the exchange of oxygen (O2) and carbon dioxide (CO2) takes place (Fig. 1.2). The branches follow an irregular, dichotomous pattern in which each airway gives rise to two ‘daughter’ airways. The structure is irregular because the daughter branches may not be of equal size. The number of airways (N) in each generation (Z) is given by the equation N = Z2.
Figure 1.2 Diagram illustrating the branching structure of the lung airways. (With permission from Davies A, Moores C, 2010. The respiratory system. Churchill Livingstone, London, p. 15, Fig. 2.4.)
Air enters via the nose and mouth; then it travels into the pharynx, through the glottis and down the trachea. Next, the air travels into the right and left bronchi, and then through the branching structure of the remaining airways to the alveoli. The alveoli are collections of air sacs, similar to a bunch of grapes, which are surrounded by a dense network of capillaries (think of a bunch of grapes inside a net shopping bag; Fig. 1.1). The regions of the lung without alveoli (including the airways) are known as the conducting zone (branches 1–16), whilst the regions with alveoli are known as the respiratory zone (17–23), i.e., the zone where oxygen and carbon dioxide are exchanged (Fig. 1.2). From branch 17 onwards (respiratory bronchioles), the airways begin to display alveolar buds in their walls, and by branch 20 onwards virtually the entire airway is made up of alveoli (alveolar ducts). An important feature of the conducting airways is that the larger airways, such as the trachea, are reinforced with cartilage rings that help prevent collapse, whereas the walls of smaller airways contain no supporting skeleton. The small airways possess rings of smooth muscle that, when contracted, narrow the airways (bronchoconstriction). From branch 3 onwards, the airways are surrounded by lung parenchyma, and the elastic forces that operate to recoil the lung parenchyma help to tug the airways open during exhalation (airway tethering), with their radial traction (see section ‘Mechanics of breathing: Airway resistance’).
The alveoli
The branching structure of the lungs is an impressive work of evolution that has resulted in adult human lungs having a combined surface area of about 60 m2 (646 square feet), which is about the same as a singles badminton court and about 40 times the area of the skin (see Fig. 1.23). Why the need for such a huge area? Like so much of evolution, the respiratory system is a slave to the laws of physics. As will be described in detail in the next section, the exchange of oxygen (O2) and carbon dioxide (CO2) between the 300 million alveoli and the capillaries surrounding them occurs via passive diffusion. For this process to keep pace with the metabolic needs of the average person, especially during exercise, a vast surface area (number of alveoli and capillaries) is required for diffusion.
Figure 1.3 Drawing taken from an electron micrograph section of an alveolus showing the alveolar–capillary membrane. RBC = red blood cell. (With permission from Davies A, Moores C, 2010. The respiratory system. Churchill Livingstone, London, p.18, Fig. 2.9.)
However, this vast lung surface area would be of little use without the unique and intimate interrelationship that exists between the alveoli and their capillary network. Figure 1.3 illustrates the key feature of this structure, i.e., the minimal distance separating the alveolar air from the capillary blood. Note that on one side of the capillary the alveolar and capillary cells fuse to form a very thin septum, whilst on the opposite side of the capillary the septum is thicker, providing stability and resisting collapse.
The blood vessels
The second circulation in the lungs arises from the aorta as the bronchial arteries, which meet the metabolic requirements of the conducting airways by perfusing the walls of the airways as far as the respiratory bronchioles (after which O2 requirements are met by alveolar gas exchange). Around one-quarter to one-third of the venous effluent from the bronchial circulation drains into the bronchial veins and thence to the right atrium. The remainder drains directly into the pulmonary veins via bronchopulmonary–arterial anastomoses, contributing to shunting of deoxygenated blood into the pulmonary veins. This shunt is the reason that the alveolar to arterial pressure difference for oxygen exists (see section ‘Gas exchange, Diffusion’ below).
The nerves
The respiratory system is under both somatic and autonomic nervous control. The somatic system provides motor control of respiratory pump muscles, whereas the autonomic system provides both motor (efferent) and sensory (afferent) nerves to the lungs. For information on somatic nerve innervation of respiratory muscles see ‘The muscles’ (below).
The muscles
Respiratory pump muscles
The respiratory pump muscles are a complex arrangement that form a semi-rigid bellows around the lungs. Essentially, all muscles that attach to the rib cage have the potential to generate a breathing action, but the principal muscles are shown in Figure 1.4. Muscles that expand the thoracic cavity are inspiratory muscles and induce inhalation, whereas those that compress the thoracic cavity are expiratory and induce exhalation. These muscles possess exactly the same basic structure as all other skeletal muscles, and they work in concert to expand or compress the thoracic cavity. The structure of the rib cage is described in the section ‘Gross structure of the respiratory system’ (below).
Functional properties of respiratory pump muscles
• Type I: Slow contracting and relatively weak, but very resistant to fatigue
• Type IIA: Moderately fast and strongly contracting, with high resistance to fatigue
• Type IIX (also known as type IIB): Fast and very strong, but with only moderate resistance to fatigue.
It comes as no surprise to learn that the proportion of oxidative fibres (type I and type IIA) within the diaphragm and inspiratory intercostals is approximately 80% (Gollnick et al, 1972), whilst that of the expiratory intercostals is almost 100%. This compares with around 35–45% for limb muscles (Gollnick et al, 1972). The fibres of the abdominal muscles tend to be much more variable in their composition, reflecting the multiplicity of their roles. Another important factor determining muscle fatigue is its blood supply. Inadequate blood flow (ischaemia) not only limits oxygen delivery, it also limits the delivery of substrates and the removal of metabolic by-products, all of which can hasten fatigue. The diaphragm and rib cage muscles are supplied by numerous arteries. The diaphragm, for example, is perfused by three arteries, as well as benefiting from anastamoses that provide collateral sources of blood flow between arteries. The diaphragm also has an extremely dense capillary network and a capacity to increase its blood flow that exceeds that of limb muscles (Polla et al, 2004). The diaphragm maintains perfusion at contraction forces that occlude blood flow in limb muscles. This advantage derives from the fact that it is a thin sheet of muscle that produces a negative intrathoracic pressure during contraction; this pressure gradient maintains blood flow (Buchler et al, 1985). It has been suggested that this abundant and persistent arterial supply protects the diaphragm fibres from ischaemia (Hussain, 1996), providing resistance to fatigue.
In the past, the highly fatigue-resistant characteristics of the respiratory pump muscles contributed to a key assumption regarding the likelihood that the respiratory muscles contributed to exercise limitation. Physiologists assumed that the respiratory pump muscles, especially the diaphragm, were so well evolved from their continuous work that they were immune to fatigue. It wasn’t until the 1990s that this myth was finally shattered, when exercise-induced diaphragm fatigue was measured in healthy young athletes (see Ch. 3, section ‘Respiratory muscle involvement in exercise limitation, Healthy people’).
Upper airway muscles
The first question to address is why upper airway muscles are relevant to breathing. The simple answer is that, without them, upper airway resistance would be intolerable. During normal resting breathing, the vocal folds abduct during inhalation in order to widen the laryngeal glottic opening, permitting unobstructed air flow through the larynx (Brancatisano et al, 1984). This occurs via reflex activation of the posterior cricoarytenoid (PCA) muscle. Without this activity, the vocal folds would collapse across that laryngeal opening, causing an increase in resistance to upper airway flow and leading to increased breathing effort and dyspnoea. The strength of contraction of the PCA muscles has been shown to be proportional to factors that are associated with increased levels of respiratory drive, as well as the negativity of intrathoracic pressure (Suzuki & Kirchner, 1969). During vigorous breathing the action of the PCA is supplemented by contraction of the cricothyroid (CT), which acts to tension the vocal folds, increasing the anteroposterior dimension of the larynx (Hoh, 2005). Active closure of the vocal folds (adduction) is performed by the lateral cricoarytenoid muscle (LCA), thyroarytenoid (TA) and interarytenoid (IA), but only the PCA is involved in resting breathing. However, during tidal breathing most of the closure is brought about by relaxation of the PCA rather than by activation of the adductor muscles (Murakami & Kirchner, 1972). Transient, reflex modulation of the area of the laryngeal portion of the airway plays an important role in controlling breathing frequency, duty cycle and end-expiratory lung volume, as narrowing of the airway provides an important braking effect during expiration. Active adduction is associated with activities such as vocalization, coughing and straining.
The fibre type of human laryngeal muscles has not been studied nearly so extensively as limb muscles, but a number of key observations have been made with respect to the vocal fold abductors (PCA and CT). The PCA and CT contain around 66% and 45% type I fibres, respectively. The type II fibres of these muscles are limited to IIA and IIX, but the latter are very few in number. In common with limb muscles, PCA and CT appear to contain no IIB fibres (Hoh, 2005). The proportion of fast IIX fibres appears to be larger in the adductor muscles (TA and LCA), which probably imparts a higher velocity of shortening. This may be functionally important in their role as protectors of the airway (Li et al, 2004).
Because of its role in vocalization, the LCA has been studied in relation to its fatigability. Intramuscular EMG (electromyography) suggests that prolonged, loud vocalization exercises result in changes within the EMG that are consistent with the development of muscle fatigue (Boucher et al, 2006). Thus, it is reasonable to suggest that under similarly challenging conditions for abduction (e.g., vigorous breathing) PCA and CT might be similarly susceptible to fatigue. This is discussed in relation to exercise intolerance in Chapter 3 (section ‘Respiratory muscle involvement in exercise limitation’).
Gross structure of the respiratory system
The respiratory system is housed within the thoracic cavity, which is formed by the rib cage, vertebrae, sternum and diaphragm. Within the thorax there are three further cavities: the left and right pleural cavities and the mediastinum (Fig. 1.5).
Figure 1.5 Gross anatomy of the lungs. (With permission from Davies A, Moores C, 2010. The respiratory system. Churchill Livingstone, London, p. 21, Fig. 2.12.)
The arrangement and movements generated by the respiratory muscles are described above (in ‘The muscles’). The skeletal structures that translate the muscle actions into movements are complex. The rib cage structure is such that the vertebral articulation of the ribs is higher than the sternal attachments; consequently, the ribs slope downwards anteriorly (Fig. 1.6).
All 12 ribs articulate with the vertebrae, but only the first six connect individually to the sternum. Ribs 7–10 articulate with the lower sternum via a common cartilage, whilst ribs 11 and 12 have no anterior connections (‘floating ribs’). The head of most ribs articulates with the bodies of two adjacent vertebrae, whilst their tubercles articulate with the transverse process of one of these vertebrae. Nerves and blood vessels run in a channel on the underside of the ribs called the costal groove (Fig. 1.7).
GAS EXCHANGE
However, the partial pressure of oxygen within the alveoli (PAO2) is not 149 mmHg because the inhaled breath is diluted by the air that remained in the lungs at the end of the previous breath (end-expiratory lung volume, EELV). The extent of the dilution depends upon a number of factors, including the EELV and the tidal volume (VT); typically PAO2 will be around 104 mmHg, giving a diffusion gradient of around 65 mmHg. Thus, VT affects both the flow of gas delivered to the alveoli (via the dead space to VT ratio; see ‘Lung volumes and capacities’, below), and the extent to which inspired PO2 (PIO2) is diluted by the EELV (inspired to alveolar gradient). This mixing of old and new gas also affects the diffusion gradient and exchange of CO2 because it has the effect of raising the partial pressure of CO2 (PCO2) in the alveoli (PACO2). Thus, it is easy to see how changes in breathing pattern can influence the driving pressure for gas exchange, leading to hypoxaemia and hypercapnia.
where A is the diffusion area, S is the solubility coefficient of the gas, ΔC is concentration gradient for the gas (alveolar to pulmonary arterial), t is the membrane thickness (alveolar plus capillary), and MW is the molecular weight of the gas molecule (its physical size). Although CO2 is 23 times more soluble than O2, it has a larger MW making the actual diffusion rate 20 times greater. However, equilibrium between the alveolus and venous blood occurs at around the same time for both CO2 and O2 because of the lower ΔC and slower release of CO2 from the blood compared with that of O2. Importantly, the A in the Fick equation is not the lung surface area, but rather the surface area where there is both ventilation and perfusion, i.e., where air and blood meet. As will be explained in later sections, many factors can influence the distribution of both ventilation and perfusion, leading to ventilation / perfusion ( / ) inequality, a reduction in A and an impairment of diffusion.
There is one final factor that influences the efficiency of gas exchange between alveolus and blood, viz., the characteristics of the blood supply to the alveolus, and in particular the time available for the diffusion and binding / release of O2 and CO2. Figure 1.8 is a diagrammatic illustration of the change in pulmonary blood gases as the blood traverses the lungs. Under resting conditions, the blood spends around 0.75 seconds in contact with the alveolar regions of the lung, during which time it will traverse a number of alveoli.
Figure 1.8 Equilibrium time for O2 and CO2 as blood traverses the alveolar capillaries under resting conditions. (With permission from Hicks GH, 2000. Cardiopulmonary anatomy and physiology. WB Saunders, Philadelphia, p. 365, Fig. 12-17.)
It is clear from Figure 1.8 that equilibration of both gases occurs early in the journey through the capillary, and that within 0.25 seconds diffusion ceases because there is no longer a gradient and exchange is complete. The only way to increase the exchange of gas is to increase the throughput of blood. In this scenario, gas exchange is perfusion limited. Many people find it hard to understand that, in healthy people at sea level, breathing more during exercise does not improve the amount of oxygen leaving the lungs; this is because it’s already ‘as good as it gets’. However, diffusion limitation can arise in healthy people under very specific conditions including: (1) exposure to high altitude (reducing the diffusion gradient), (2) during maximal exercise, when (a) cardiac output can be so high that blood traverses the lung capillaries before full equilibration can take place, (b) cardiac output can be so high that it outstrips the ability of the respiratory pump to deliver adequate alveolar ventilation (VA), (c) / inequality develops due to the mechanical effects of acute pulmonary oedema compressing alveoli and capillaries, and (d) the diffusion distance is increased by acute pulmonary oedema. Exercise-induced arterial hypoxaemia in healthy well-trained individuals at sea level is relatively rare and the specific contributions of the putative contributor remains incompletely understood (Guenette & Sheel, 2007).
Perfusion
The pulmonary vasculature is supplied via a separate, low-pressure branch of the cardiovascular system. Deoxygenated blood is returned to the lungs via the right side of the heart and the pulmonary artery. The latter is the only artery in the body to carry deoxygenated blood, which is distributed to a huge capillary network within the lungs (Fig. 1.9).
Figure 1.9 Schematic depicting pulmonary and systemic circulations and pressures. (With permission from Thibodeau GA, Patton KT, 1995. Anatomy and physiology, 3rd edn, Mosby, St Louis.)
As well as illustrating the flow of blood through both branches of the circulation, the diagram in Figure 1.9 also illustrates the pressures present within each part. Systolic / diastolic pressure in the pulmonary artery is around only 24 / 9 mmHg, compared with 120 / 80 mmHg in the aorta. The pulmonary circuit is at low pressure because of the thin, delicate walls of the capillary network, which minimizes the diffusion distance. Even small increases in pulmonary arterial pressure lead to fluid leakage and pulmonary oedema. Since the pulmonary circulation receives virtually the entire cardiac output, the fact that the pressures within it are low indicates that it has a low resistance. The reason for this low resistance is the extensiveness of its capillary network; as was described above, the capillary network can be thought of as a sheet of blood enveloping the alveoli.
One factor that has a strong influence upon the patency of pulmonary capillaries is alveolar pressure, which can compress the vessels. This increases their resistance, leading to redistribution of blood and heterogeneity of blood flow within the lungs. In addition, gravity, which also influences alveolar pressure (see ‘Pressures within the thorax’, below), has a potent influence upon blood flow distribution within the lungs. The effect is due to the hydrostatic pressure gradient that exists from the apex to the base of the lungs. It is very potent because pulmonary arterial pressure is so low that it is only just sufficient to pump blood to the lung apices. Perfusion pressure at the base of the lungs is equivalent to pulmonary arterial pressure, plus the hydrostatic pressure difference between the heart and base of the lungs. At the apex, perfusion pressure is equivalent to pulmonary arterial pressure, minus the hydrostatic pressure difference between the heart and apex of the lungs. This means that blood flow is distributed preferentially to the base of the lungs. As will be described in a later section (‘Pressures within the thorax’), ventilation is also distributed preferentially to the base of the lungs. However, the relative distribution of ventilation and perfusion is imperfect; there is around a three- to four-fold difference in ventilation from apex to base, compared with only a 16-fold difference in perfusion. Accordingly, there is a gradient of ventilation perfusion ratios ( / ), and gas exchange, throughout the lungs. These variations in gas exchange also lead to local variations in the alveolar gas partial pressures. These phenomena are summarized in Figure 1.10.
Figure 1.10 Variations in alveolar ventilation (A) and perfusion (). (With permission from Hicks GH, 2000. Cardiopulmonary anatomy and physiology. WB Saunders, Philadelphia, p. 352, Fig. 12-9.)
In summary, the factors influencing blood-flow distribution in the lungs include:
• Gravity (via alveolar pressure and hydrostatic pressure)
• Pulmonary arterial resistance
• Lung volume (via alveolar pressure)
• Alveolar gas pressure (influenced by lung volume and gravity).
• Hypoxic pulmonary vasoconstriction (HPV) is a unique response to hypoxia; in systemic blood vessels, hypoxia elicits vasodilatation. The logic of the differing responses is obvious since there is no point in perfusing areas of the lung that are poorly ventilated. In contrast, in the periphery, hypoxic tissue requires an increase in oxygen delivery and dilatation is the way to achieve this. The effect of HPV is to direct blood to ventilated regions, thereby improving / for the lung as a whole. In patients with conditions such as COPD (chronic obstructive pulmonary disease), in whom alveolar hypoxia is a chronic phenomenon, HPV can result in extensive pulmonary vasoconstriction. This increases PVR and the load placed upon the right side of the heart. As a result, both pulmonary oedema and right heart failure (cor pulmonale) can ensue.
• The pulmonary circulation is also influenced by a number of endogenous substances that induce vasodilatation via nitric oxide (NO) release by pulmonary vessel endothelial cells. These substances include acetylcholine, bradykinin, thrombin, serotonin, adenosine diphosphate and histamine. In addition, mechanical factors such as stretching and vessel wall shear stress may also induce release of NO and vasodilatation.
• The pulmonary vasculature falls under the influence of the autonomic nervous system. Sympathetic stimulation releases norepinephrine (noradrenaline), which stimulates α1-receptors in the smooth muscle of pulmonary arteries and arterioles, inducing vasoconstriction. The parasympathetic nervous system releases acetylcholine, which induces vasodilatation via the NO system described above. A recent study suggests that sympathoexcitation due to muscle metaboreflex activation induces pulmonary vasoconstriction (Lykidis et al, 2008), which has implications for gas exchange and exercise tolerance.
