Chapter 2
Exercise physiology and training principles
In Chapter 1, we learned of the close anatomical and functional relationships between the respiratory and cardiovascular systems; indeed, they are so integrated that we often refer to the ‘cardiorespiratory’ system. This intimacy is essential for the efficient transport of respired gases to and from the metabolizing tissues of the body. Whilst the cardiorespiratory system operates comfortably within its capacity under resting conditions, during exercise the system imposes a limit upon oxygen delivery, and thence exercise tolerance. In order to understand how the respiratory system contributes to exercise limitation, it is necessary to understand a little of the integrated response of the healthy cardiorespiratory system to exercise, as well as how the individual systems respond to training. This chapter will describe the responses of the cardiorespiratory system to exercise, the limitations it imposes upon exercise tolerance, the concept of cardiorespiratory fitness, and the responses of the cardiorespiratory system to different types of training.
CARDIORESPIRATORY RESPONSES TO EXERCISE
Respiratory
 E) of 7.5 l·min− 1 (15 × 0.5). The volume of each breath (tidal volume: VT) depends on body size and metabolic rate. Larger people have larger lungs and take larger breaths; they also require more energy and oxygen (O2) to support their metabolism; accordingly, they require a larger
  E.
E. E of 120 to 160 l·min− 1. However, in Olympic-class male endurance athletes, VT can be over 5 litres, resulting in a
  E of 250 to 300 l·min− 1.
 E that is equivalent to that seen in thoroughbred racehorses! Take the rower Sir Matthew Pinsent as an example. In his 20s, this four-time Olympic gold medalist (1992, 1996, 2000, 2004) and 13-time senior world champion possessed the largest lungs of any British athlete; his forced vital capacity (FVC) was 8.25 litres. Sir Matthew stood just under 2 m (6 feet 5 inches) tall and weighed around 108 kg (240 pounds); a man of his size would normally have a FVC of about 6 litres, whilst the average man has a FVC closer to 5 litres. During a 2000-meter rowing race, Sir Matthew would generate a massive 460 watts of propulsive power for around 6 minutes, requiring a peak oxygen uptake (
 O2peak) of around 8 l·min− 1 and a
  E of close to 300 l·min− 1. The total volume of air that was moved into and out of his lungs during a race would have been close to 1700 litres, requiring a power output by his respiratory muscles of around 85 watts. These are truly staggering statistics, and they give some insight into what the human cardiorespiratory system is capable of achieving.
The respiratory pump during exercise
During exercise, the rate and depth of breathing are increased in order to deliver a higher  E and oxygen uptake (
 O2); this response is known as the exercise hyperpnoea, and requires the respiratory muscles to contract more forcefully and to shorten more quickly. At rest, expiratory muscles make very little contribution to breathing, but during exercise they contribute to raising VT and expiratory air-flow rate. However, at all intensities of exercise the majority of the work of breathing is undertaken by the inspiratory muscles; expiration is always assisted to some extent by the elastic energy that is stored in the expanded lungs and rib cage from the preceding inhalation. This elastic energy is ‘donated’ by the contraction of the inspiratory muscles as they stretched and expanded the chest during inhalation. Recent studies have estimated that, during maximal exercise, the work of the inspiratory respiratory muscles demands approximately 16% of the available oxygen (Harms & Dempsey, 1999), which puts into perspective how strenuous breathing can be in healthy young people.
The strategy that the respiratory controller adopts in order to deliver a given  E depends upon a number of factors, especially in the presence of disease. Chapter 1 described how the respiratory controller most likely regulates ventilation and breathing pattern so as to ‘keep the operating point of the blood at the optimum while using a minimum of energy’ (Priban & Fincham, 1965). Figure 2.1 illustrates how tidal volume changes as exercise intensity increases, placing it within the subdivisions of the lung volumes that are illustrated in Figure 2.1. Initially, during light exercise, VT increases by the person exhaling more deeply, and utilizing the expiratory reserve volume, but this increase is quickly supplemented as a result of the deeper inhalation and utilization of the inspiratory reserve volume.
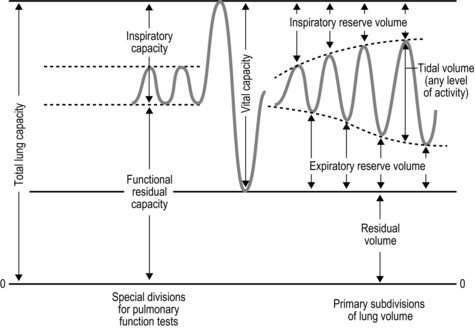
Figure 2.1 Changes in tidal volume during exercise of increasing intensity. Note how tidal volume increases as exercise intensity increases. This increase in tidal volume results from utilization of both the inspiratory and expiratory reserve volumes. (From Astrand P-O, Rodahl K, Stromme S, 2003. Textbook of work physiology: physiological bases of exercise, 4th edn. Human Kinetics, Champaign, IL, p. 185, with permission.)
Eventually, VT reaches a point where it does not increase any further, despite a continuing need to increase  E. This can be seen more clearly in Figure 2.2, which shows how
  E, VT, fr and
  O2 change during incremental cycling to the limit of tolerance in a well-trained athlete. Each point on the plot represents an individual breath, and there are two key features to note. Firstly, unlike the linear response of
  O2 to incremental exercise,
  E is non-linear, rising steeply at about 70% of maximal intensity. As a result, the
  E required at 80% of maximum capacity is not twice the amount required at 40%; rather, it is more like four or five times greater. Secondly, as VT levels off, fr rises steeply to meet the need for an escalating
  E.
E.
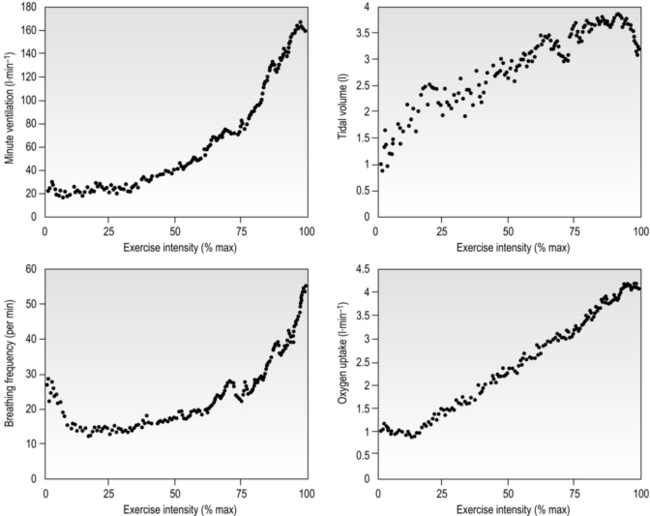
Figure 2.2 Changes in breathing during incremental cycling in a well-trained triathlete. Each dot corresponds to 1 breath. (Adapted from McConnell AK, 2011. Breathe strong, perform better. Human Kinetics, Champaign, IL, with permission.)
The non-linear increase of  E results from the role that breathing plays in compensating for the escalating metabolic acidosis. Chapter 1 described how breathing plays an important role in regulating blood and tissue pH by manipulating the excretion of CO2 at the lungs. At the lactate threshold (LaT), lactic acid (also known as lactate) production exceeds its degradation leading to accumulation of lactic acid in the muscles and blood (see ‘Cardiorespiratory fitness, Lactate threshold’ below). Above the LaT,
  E exceeds that required to deliver O2, and the primary role of the respiratory system is stabilizing pH by removal of CO2 via the lungs. This process is known as a ventilatory compensation for a metabolic acidosis (see Ch. 1,‘Acid–base balance’). The steep increase in
  E at the LaT is a response to stimulation of the peripheral chemoreceptors by the hydrogen ion component of lactic acid (see Ch. 1, ‘Chemical control of breathing’). This ventilatory response is central to the system that minimizes the acidification of the body and the negative influence of this upon muscle function and fatigue (Box 2.1). As will be described in the section ‘Lactate threshold’ below, the inflection of the response of
  E can be used to estimate the exercise intensity at which blood lactate accumulation commences, i.e., the so-called ventilatory threshold. The LaT and ventilatory threshold are related to the same physiological phenomenon, and are often used synonymously. However, they are not identical: the ventilatory threshold lags behind the LaT slightly because it is a response to the elevated hydrogen ion concentration in the blood.
The increasing reliance upon fr to raise  E at high intensities of exercise arises because it becomes too uncomfortable to continue to increase VT; typically, this occurs when VT is around 60% of FVC. As VT increases, progressively greater inspiratory muscle force is required to overcome the elastance of the respiratory system. Higher inspiratory muscle force output increases effort and breathing discomfort (see Ch. 1, ‘Dyspnoea and breathing effort’). Eventually, the sensory feedback from the inspiratory muscles signals the respiratory centre to change the pattern of breathing, and to increase fr more steeply instead of VT. The respiratory centre has an exquisite system for minimizing breathing discomfort, which also optimizes efficiency. This drive to optimize is also observed in the breathing pattern derangements that are seen in the presence of disease (see Ch. 3).
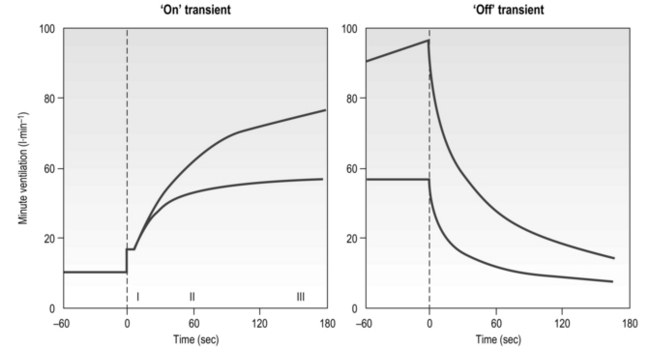
The influence of the LaT upon the exercise hyperpnoea can also be observed during constant intensity exercise. Figure 2.3 illustrates the typical ventilatory responses to two intensities of exercise, one below and one above the LaT. In both intensity domains, the ‘on’ transient response of  E has three phases: phase I is an almost instantaneous increase, which is followed by the monoexponential increase of phase II, and finally phase III, which is either a plateau or a continued, slow increase. During light and moderate-intensity exercise, phase III is a plateau (steady state); in contrast, during heavy exercise phase III continues to show a gradual increase throughout exercise, never achieving a steady state. The absence of a steady state in phase III is due to the presence of a ventilatory compensation for the metabolic acidosis. Unfortunately, this compensation is imperfect, and does not offset the fall in pH completely; accordingly, exercise above the LaT is non-sustainable. At exercise cessation, the ‘off’ transient also displays an abrupt fall in
  E, followed by exponential decline; the recovery of
  E following heavy exercise takes much longer than that following light and moderate exercise because of a continued drive to breathe originating from the metabolic acidosis.
Cardiovascular
A detailed description of the cardiovascular system is beyond the scope of this book, and readers are referred to the numerous excellent textbooks on cardiovascular physiology for a comprehensive description of cardiovascular structure and function (e.g., Levick, 2009). The following section provides an overview of the integrated response of the cardiovascular system to exercise.
 ) of around 5 l·min− 1 (65 × 0.075 l). The SV depends upon body size, training status and metabolic rate. Larger and fitter people both have larger hearts, which eject a larger SV. In the case of fitter people, this may be around 100 ml, and the increase results in a lower resting heart rate (fc) since resting
  is unchanged. In contrast, the larger SV of larger individuals is supporting a higher energy and oxygen (O2) demand, which requires a higher
  ; thus their resting fc is unchanged.
 reaches around 22 l·min− 1 at maximal exercise. In Olympic-class endurance athletes,
  has been measured at 40 l·min− 1, thanks to a SV that can be as high as 210 ml.
 O2peak of around 8 l·min− 1 would have required a maximal cardiac output of around 40 l·min− 1.
The cardiovascular system during exercise
During exercise, both fc and SV increase progressively in order to deliver an appropriate  to the pulmonary and peripheral circulations. As is the case with the increase in respiratory VT during exercise, SV also displays a non-linear response, showing a plateau at around 40–50% of maximal exercise capacity. The reasons for this are complex, but include a number of mechanical limitations that arise from both the filling of the ventricle during diastole and the ability of the heart to eject blood during systole (Gonzalez-Alonso, 2012).
Commensurate with this plateau in SV is a plateau in  . As was mentioned above, SV is very amenable to training, and provides the only mechanism by which maximal
  can be increased; this will be described in the section ‘Principles of cardiorespiratory training, Training adaptations’ (below).
 during exercise, the integrated response of the cardiovascular system must also distribute blood to the parts of the body where it is needed most. So far as exercising muscle blood flow is concerned, this regulation takes place with exquisite precision such that muscle O2 demand and supply are regulated tightly. However, if this increase were to take place without a compensatory restriction of blood flow elsewhere in the peripheral circulation, arterial blood pressure would be in jeopardy. Accordingly, the integrated response of the cardiovascular system during exercise includes redistribution of blood flow such that it is directed to areas of urgent O2 demand, at the expense of areas such as the splanchnic circulations. For example, renal blood flow falls by about 75% during maximal exercise.
The control of exercising muscle blood flow is complex, and the factors responsible change as exercise progresses (Hussain & Comtois, 2005). At the immediate onset of exercise, rhythmic contraction of exercising muscles facilitates unidirectional ejection of blood through the venules and deep veins (backflow is prevented by venous valves); during relaxation, venous pressure drops, facilitating the inflow of blood via the arterial circulation. This pumping action also stimulates an increase in muscle blood flow via the release of local vessel endothelial factors that respond to ‘shear stress’ inside the arterioles; in other words, the physical stress exerted on the vessel endothelium by flowing blood stimulates the vessel to relax and dilate. As exercise progresses, muscle metabolism leads to an increase in local metabolites such as CO2, lactic acid, adenosine, potassium ions and osmolarity, as well as a decline in O2. This vasodilator stimulus supplements that from endothelial factors to produce a full-blown exercise hyperaemia (Hussain & Comtois, 2005).
The maximal capacity of the exercising muscles to accommodate blood flow far exceeds the ability of the  to supply it. Accordingly, blood flow to exercising muscles, as well as non-exercising tissues, must be regulated by the sympathetic nervous system, whose job it is to defend arterial blood pressure (ABP). Without this regulatory restraint by the sympathetic nervous system, ABP would fall precipitously. One important component of the mechanism(s) contributing to this restraint is feedback from muscle metaboreceptors (Sinoway & Prophet, 1990). The afferent arm of the resulting reflex response (metaboreflex) is mediated by simple group III and IV afferents residing within skeletal muscles. These afferents sense both mechanical and metabolic stimuli during exercise, and, amongst other things, induce sympathetically mediated, active vasoconstriction in all tissues, including exercising muscles. In tissues with low metabolism this output stimulates powerful vasoconstriction, whist in exercising muscles the resultant vasoconstriction is a balance between the local vasodilatory influence and the neural vasoconstrictor influence.
In Chapter 3 (section ‘Respiratory muscle involvement in exercise limitation, Healthy people’) we will consider the ramifications of activation of the metaboreflex originating from exercising respiratory muscles.
MECHANISMS OF FATIGUE
Fatigue is a complex phenomenon that has been studied extensively for over a century. Fatigue and exercise are linked inextricably, and it is impossible to consider exercise without also considering fatigue. But precisely what factors lead human beings to slow down and / or stop exercising, or muscles to cease to generate the force they once could? Despite the extensive literature addressing the phenomenon of fatigue, our understanding remains incomplete. This section is intended to provide a ‘working knowledge’ of fatigue mechanisms for the purposes of understanding the factors that contribute to exercise intolerance in patients, and of specific respiratory muscle fatigue. For a more comprehensive review of fatigue the reader is referred to the excellent overview of skeletal muscle physiology by David Jones and colleagues (Jones et al, 2004), and to the comprehensive guide to muscle fatigue edited by Williams & Ratel (2009).
Definition of fatigue
Even agreeing upon a definition of fatigue has proved elusive – not least because its presence, or otherwise, can be specific to the test, timing and conditions used to detect it. For example, changes in muscle responses to electrical stimulation can differ at different stimulation frequencies such that ‘fatigue’ is revealed only at the ‘right’ frequency. Similarly, any definition of fatigue must recognize that force-generating capacity is not the only muscle property that is affected by the process of fatigue; reductions in muscle power and speed are also indicators of fatigue (see below). Early definitions were oversimplistic, relying upon measurement of isometric force, e.g., ‘the inability to maintain the required or expected force’ (Bigland-Ritchie, 1981). This is not to imply that such definitions are invalid; indeed, this definition is used extensively in the literature as a method to identify respiratory muscle fatigue and to test its relationship to exercise tolerance (Romer & Polkey, 2008). However, this definition is limited and, in 1992, Enoka & Stuart proposed the following definition of fatigue, which encapsulates a number of important characteristics of fatigue that previous definitions had neglected: ‘an acute impairment of performance that includes both an increase in the perceived effort necessary to exert a desired force and an eventual inability to produce this force’ (Enoka & Stuart, 1992). Although Enoka & Stuart’s 1992 definition still focuses upon force as the outcome measure of function, it acknowledges a number of important features of fatigue: (1) the transiency of fatigue, (2) that fatigue can be manifested during movements (not just isometric contractions), (3) that fatigue is associated with sensations, and (4) that fatigue is a process (not an end point). However, although this definition hints at the fact that fatigue can be present before performance declines, and / or task failure occurs, it is not explicit. This important concept is explored in the section ‘Task failure and task dependency’
Indicators of fatigue
For reasons of technical expediency, laboratory studies of fatigue have tended to focus upon measurement of isometric force in the identification of fatigue. These contractions are used to both induce and to measure a decline in function. When asked to maintain a maximal isometric contraction of a limb muscle, with biofeedback of force and encouragement, people can typically sustain the contraction for around a minute. Over the course of the minute, force declines progressively and muscle discomfort rises. Eventually there is an almost complete loss of force, which is followed swiftly by intolerance and cessation of contraction. The difficulty with tests such as this is two-fold: (1) they are not physiological, and (2) it is impossible to distinguish loss of force due to declining effort from loss due to declining function. One way to overcome the second issue is to stimulate the muscle briefly with an electrical stimulus to assess the contractile state of the muscle per se. However, this process is not without its own limitations (see above), and also does not distinguish between decline in effort and decline in the motor drive to the muscle from the spinal cord and brain. Notwithstanding this, electrical stimulation experiments have revealed that fatigue at the level of the contractile machinery is not only associated with a decline in maximal force, it is also associated with slowing of the rate of force development and the rate of relaxation (Cady et al, 1989). Since muscle power is the product of force and speed of contraction, it is obvious that fatigue is associated with a loss of muscle power output.
Potential sites and causes of fatigue
In 1981, Brenda Bigland-Ritchie published a model that identified a number of potential sites / factors influencing fatigue, extending from the motor cortex to the muscle contractile machinery; it also included the influence of the supply the energy for interaction between the contractile proteins (Bigland-Ritchie, 1981). In sequence, these sites / factors were:
1. Excitatory input to the motor cortex
2. Excitatory drive to lower motoneurons
Traditional models of fatigue have separated the sites / factors numbered 1 to 6, and classified these as being ‘central’, whilst those numbered 4 to 8 have been classified as being ‘peripheral’. Thus, some locations are involved in both central and peripheral fatigue. Moreover, central fatigue can be located within both the central and peripheral nervous systems, being characterized by a decrease in the neural drive to the muscle. To a large extent, these early classifications of fatigue were made artificially on the basis of the experimental techniques available to study changes in muscle functional properties. In particular, the so-called twitch interpolation technique was used as a method of distinguishing fatigue originating upstream and downstream of the site of electrical stimulation (motor nerve or muscle) (Merton, 1954). The technique was first described by Denny-Brown (1928) and involves the electrical (or latterly, magnetic) stimulation of the muscle of interest, or its motor nerve. The stimulus is delivered during a voluntary contraction of the muscle, and the resulting total force depends upon the extent to which the pool of motor units accessed by the external stimulus has been activated by the voluntary effort. For example, if 100% of motor units accessible to the stimulus are activated by the voluntary drive, no additional force will be evoked by the external stimulation. In contrast, if the voluntary drive has activated only a proportion of this motor unit pool, more motor units will be recruited by the stimulation, and a ‘twitch’ of additional force will be measureable. The latter is indicative of a failure of voluntary neural drive, or ‘central fatigue’. Thus, as Merton (1954) put it, ‘If the equality [between voluntary and electrically evoked forces] still holds, then the site of fatigue must be peripheral to the point [of stimulation] of the nerve; otherwise it is central, wholly or partly’. Using electrical stimulation techniques, it has also been possible to demonstrate that well-motivated people are capable of activating muscles maximally, such that no additional force is generated electrically, compared with voluntary muscle contraction (Merton, 1954), including the respiratory muscles (Similowski et al, 1996).
Early research on fatigue mechanisms tended to focus upon the sites located at the muscle level. This was partly for pragmatic reasons, but also because Merton’s muscle stimulation studies (Merton, 1954) had shown that, during maximal isometric contractions of the adductor pollicis, force could not be restored by strenuous stimulation of the muscles. Because the muscle action potential remained unchanged, the finding indicated the decline in force was due to failure within the muscle and not to failure of neuromuscular transmission. Consequently the neuromuscular junction, the influence of fuel availability and the role of accumulated metabolic ‘waste products’ became a focus of research. At one time, prolonged exercise was understood to be limited by running out of fuel, whereas high-intensity exercise was limited by running out of fuel and / or accumulation of lactic acid (McKenna & Hargreaves, 2008). In other words, fatigue was considered to be a sign of a system in crisis. However, contemporary research on fatigue recognizes not only the important contribution of the brain, but also the fact that fatigue is not a sign of catastrophic failure, but of a system making an integrated response that conserves and optimizes function. For these reasons, and for those explored below in the section ‘Afferent feedback and fatigue’, classification of fatigue as either ‘central’ or ‘peripheral’ has become increasing irrelevant.
Before considering the role of feedback from exercising muscles in fatigue processes, the potential causes of fatigue at the level of the muscle will be discussed briefly (sites 4 to 8; Bigland-Ritchie, 1981). In theory, the neuromuscular junction could present a limit to muscle activation by ‘running out’ of the neurotransmitter acetylcholine. However, there appears to be little evidence to support a role for the neuromuscular junction in fatigue (Bigland-Ritchie et al, 1982). In contrast, a reduction in sarcolemmal excitability is a potential contributor to fatigue. Failure of action potential propagation can arise for a number of reasons. For example, changes in the concentrations of sodium and potassium ions around the muscles fibres can reduce the excitability of those fibres, with a result that force is reduced (Jones et al, 2004). The next step in the process of muscle contraction is excitation–contraction coupling, which involves the release of calcium from the sarcoplasmic reticulum (SR). Calcium release, its interaction with troponin, and reuptake into the SR, are fundamental to the contraction and relaxation of muscle fibres. Hence, if release or binding of calcium to troponin is impaired, force can be reduced. Similarly, if reuptake is impaired, relaxation could be slowed. Experiments using single fibres of mouse muscle indicate that repeated bouts of high-intensity exercise can lead to a reduction in calcium release, which is associated with a loss of force (Westerblad et al, 1993). The intramuscular factors implicated in impairing calcium release are ATP, magnesium ions and inorganic phosphate, either separately or in combination; studies in patients with McArdle’s syndrome suggest that pH does not contribute to impaired release of calcium (Jones et al, 2004). However, pH does influence the interaction between calcium and troponin, as do phosphate ions. Although both pH and the concentration of phosphate ions change during fatiguing exercise, the interaction between calcium and troponin is not thought to play an important role in human muscle fatigue (Jones et al, 2004). Finally, calcium removal has for many years been considered responsible for the slowing of muscle relaxation in fatigued muscle. However, there is no evidence for this association in human muscle (Jones et al, 2004).
The final stage of muscle contraction is the interaction between the contractile proteins actin and myosin, which generates muscle shortening. Studies on single fibres of fatigued mouse muscle indicate that, even when the fibres are saturated with calcium, the force generated is around 20% lower than that of the unfatigued muscle (Westerblad et al, 1993). This suggests that failure of cross-bridge function contributes to fatigue-related force deficits. Cross-bridge kinetics also influence rates of muscle shortening and relaxation and, since changes in maximum shortening velocity can be accounted for only by slowing of cross-bridge kinetics, this is a key index of cross-bridge dysfunction (Jones et al, 2004). But what factors induce such dysfunction? Because of the reversible nature of the reactions that liberate energy from ATP, it is theoretically possible that accumulation of inorganic phosphate and ADP, or depletion of ATP are responsible. However, there is currently no evidence that accumulation of inorganic phosphate and ADP, or depletion of ATP, lead to cross-bridge dysfunction (Jones et al, 2004), so other candidates must be sought. The ‘usual suspect’ is pH, but substantial detrimental effects of increases in hydrogen ion concentration ([H+]) appear to be limited to unphysiological ranges of muscle temperature (Jones et al, 2004). To date, there is no consensus regarding the specific metabolites that are responsible for cross-bridge dysfunction. Experiments have typically manipulated one metabolite at a time, and it is conceivable that when changes in metabolites are combined their effects become far more potent (Jones et al, 2004), but for now this remains speculation.
Afferent feedback, fatigue and perception of effort
Latterly, feedback signals from exercising muscles have been recognized as making an important contribution to central fatigue mechanisms, as well as to perception of effort. These afferents, their sites of action, and influences upon muscle activation are complex, and beyond the scope of this section (see Gandevia, 1998). However, one group of afferents has particular relevance in the context of respiratory muscle training, viz., group III and IV non-myelinated fibres (see Chs 3 and 4). Virtually silent at rest, these small-diameter afferents increase their discharge during muscle contraction in response to stimuli from changes in the temperature, chemical and mechanical properties of the muscle milieu. For this reason, they are often referred to as ‘metaboreceptors’, and they project to a number of sites within the central nervous system. This means they have many roles, including cardiovascular and respiratory system regulation, and effort perception (Amann et al, 2010), as well as fatigue.
Feedback from group III and IV afferents has been implicated in central fatigue mechanisms via inhibition of central motor output (Gandevia, 2001). It has been suggested (Gandevia, 2001) that afferent feedback from exercising muscles protects locomotor and respiratory muscles from catastrophic fatigue, indeed: ‘An extreme example [of central fatigue] occurs with exercise of the inspiratory muscles in which task failure can occur with minimal peripheral fatigue’ (Gandevia, 2001). Observations such as this, and more recent studies on leg muscles, have led to the hypothesis that, ‘feedback from fatiguing muscle plays an important role in the determination of central motor drive and force output, so that the development of peripheral muscle fatigue is confined to a certain level’ (Amann & Dempsey, 2008b) – in other words, that the magnitude of exercise-induced muscle fatigue is a regulated variable (Amann & Dempsey, 2008a).
The importance of group III and IV afferent feedback in regulating integrated exercise responses was illustrated recently by an elegant study in which a cycle time trial was undertaken with and without the selective μ-opioid receptor agonist fentanyl, an agent affecting only afferent fibres (Amann et al, 2009). During a self-paced 5 km (5000 m) time trial, intrathecal fentanyl was associated with greater quadriceps fatigue, a higher central motor output and greater perceived exertion compared with placebo. A higher power output in the first half of the fentanyl time trial was offset by a lower power output in the second, resulting in no change in performance time. However, compared with placebo the decline in quadriceps twitch force was greater with fentanyl (45.6% vs 33.1%) and was associated with ambulatory problems post-exercise. The authors suggest their data ‘emphasize the critical role of locomotor muscle afferents in determining the subject’s choice of the “optimal” exercise intensity that will allow for maximal performance while preserving a certain level of locomotor muscle “functional reserve” at end-exercise’ (Amann et al, 2009). The specific contribution of respiratory muscle groups III and IV afferents to central fatigue during whole-body exercise awaits investigation. Given the importance of protecting diaphragm function, it is reasonable to speculate that the inhibitory feedback from inspiratory muscle afferents during exercise influences both respiratory and locomotor central motor output. As we will discover in Chapters 3 and 4, feedback from inspiratory muscle metaboreceptors makes an important contribution to cardiovascular control, regulation of limb blood flow and hence to factors that affect development of muscle fatigue (McConnell & Lomax, 2006; Romer et al, 2006).
Task failure and task dependency
An important distinction that has been made within the past two decades is between the concepts of fatigue and task failure (Barry & Enoka, 2007; Astrand et al, 2003). Typical experimental designs used to elucidate fatigue are to quantify: (1) the decline in maximum contraction force (voluntary or evoked electrically) during a bout of fatiguing contractions, and (2) the decline in force or power immediately after the fatiguing contractions (Enoka & Duchateau, 2008). These experiments reveal that fatigue is an evolving process that may or may not lead to task failure and cessation of exercise (Bigland-Ritchie & Woods, 1984). In their 2007 update of Enoka & Stuart’s 1992 review, Barry & Enoka (2007) acknowledge that ‘The most common definition of fatigue in the past decade is that it corresponds to an exercise-induced reduction in the ability of the muscle to produce force or power, whether or not the task can be sustained’. For this reason, the notion of fatiguing contractions is an important one, since is describes an intensity domain in which fatigue begins early in the task, but does not necessarily lead to an inability to sustain the task, or indeed to any measurable failure in, say, maximum voluntary contraction force at its cessation. This is an important concept, since the lack of residual respiratory muscle fatigue post-exercise (e.g., an impairment of diaphragm function) is often cited as an argument for the futility of inspiratory muscle training (Polkey & Moxham, 2004). As has been explained above, failure of muscle activation can occur at any number of sites, not just the contractile machinery.
Furthermore, just as any definition of fatigue must accommodate multiple factors, the process of fatigue itself is multifactorial and, ultimately, task dependent. Research has now shown that the factors precipitating fatigue are specific to the task, and include participant motivation, pattern of muscle activation, intensity and duration of activity, and continuous or intermittent activity (Barry & Enoka, 2007). For example, studies comparing the responses of older and younger men to two types of muscle contractions showed that older men were more fatigable during dynamic contractions, whilst younger men were more fatigable during isometric contractions (Barry & Enoka, 2007). The explanation for these differences resides in an understanding that there is no single cause of fatigue. As was described above, several linked processes contribute to muscle contraction, and impairment of any one process, or any combination of processes, can result in fatigue. Different tasks impair different physiological processes, thereby determining the task specificity of fatigue. For maximal-intensity tasks, the development of fatigue is linked closely to the decline in performance, and task failure. In contrast, for sub-maximal intensity tasks, fatigue may develop but might not lead to task failure. Because an activity such as breathing generally requires sub-maximal intensity work by the respiratory pump muscles, contractile fatigue of these muscles may not be the cause of task failure, even when the task involves breathing against a load.
Indeed, task failure may not be the result of fatigue of the principal muscles involved in the task (Enoka & Duchateau, 2008). For example, when human beings inhale against inspiratory loads ranging between 75% and 90% of the maximal strength of their inspiratory muscles, all reach task failure within 20 minutes (McKenzie et al, 1997). However, none exhibited inspiratory muscle fatigue; instead, task failure was associated with hypercapnia and dyspnoea. Even in similar studies, where the work history of the inspiratory muscles has been manipulated to induce prior fatigue, task failure was not related to the severity of inspiratory muscle fatigue (Rohrbach et al, 2003). Rather, task failure appeared to be related to hypercapnia and / or arterial oxygen desaturation.
An enlightening model used to elucidate the mechanisms contributing to task failure of limb muscles has been to compare the responses to two tasks of differing difficulty (Hunter et al, 2004). In one task the limb is fixed, and a predetermined isometric force must be sustained for as long as possible. In the second task, an inertial load (requiring the same muscle force as the first task) must be maintained in a specified position for as long as possible. The latter is the more difficult task, which is reflected in the shorter time to task failure (Hunter et al, 2004). By comparing performance of these two tasks it is possible to identify the adjustments that limit the duration of the more difficult task. These studies have revealed that the neural strategies utilized to deliver the two tasks differ. In the more difficult task, heightened activation of the muscle stretch reflex from the unsupported limb appears to lead to earlier recruitment of the motor unit pool and more rapid termination of the task (Maluf & Enoka, 2005). The additional challenge generated by postural control of the limb has also been studied in the context of the role of synergistic and accessory muscle contributions to the task (Rudroff et al, 2007). Unsurprisingly, tasks that required an accessory muscle contribution were briefer than those that did not.
These data provide empirical confirmation of the anecdotal observation that lifting free weights is more challenging than lifting ‘machine’ weights (where there is typically only one plane of movement). Confirmation of the highly task-dependent nature of fatigue supports an argument for the development of ‘functional’ tests of muscle fatigue, as well as for the application of functional principles to muscle training, especially where the objective is to improve performance in activities of daily living (Maluf & Enoka, 2005).
As will be described in Chapter 3, the respiratory muscles are engaged in a number of non-respiratory tasks related to postural control and stabilization of the trunk. Based upon knowledge gained from limb muscles (Maluf & Enoka, 2005), it is reasonable to postulate that a respiratory task such as sustaining exercise hyperpnoea will be more challenging, and potentially limiting, under conditions where these muscles are also engaged in non-respiratory tasks.
CARDIORESPIRATORY LIMITATION OF EXERCISE TOLERANCE
Whether one is an Olympic athlete or a patient with cardiorespiratory disease, exercise is limited by the unpleasant sensations that it precipitates; even athletes cannot ignore the discomforts of exercise. Principally, these sensations originate from the work of the muscles involved, i.e., the locomotor and respiratory muscles. When overloaded, the former provoke feelings of local discomfort and ‘fatigue’, whereas the latter stimulate the central sensation of dyspnoea and ‘fatigue’. When the contributions of leg effort and dyspnoea to exercise limitation are assessed, over 60% of healthy people cease exercise because of the combined contribution of the two symptoms (Hamilton et al, 1996). Interestingly, the Borg CR-10 rating of dyspnoea at exercise cessation in healthy people can be higher (6 units) than the rating in a similar group of patients with respiratory disease (5 units) (Hamilton et al, 1996). These data indicate that, even in healthy people, dyspnoea is a troubling symptom that makes an important contribution to the decision to stop exercising.
The transport of O2 to the working muscles involves five stages:
1. Alveolar ventilation: Delivery of atmospheric air to the alveoli (breathing)
2. Pulmonary diffusion: Transfer of O2 from the alveoli to the capillary blood
3. Transport by the blood I: Loading of O2 at the lungs
4. Transport by the blood II: Delivery of O2 to the muscle cells via the circulation
5. Tissue diffusion: Transfer of O2 from the muscle capillary blood to the muscle cells.
In Chapter 1 we learned that, in healthy people, the ability of the lungs to oxygenate the pulmonary arterial blood (stages 1 and 2) is not a limiting factor in the supply of O2 to the tissues, and that, at sea level, most human beings are ‘perfusion limited’. In other words, the amount of blood flowing through the pulmonary capillaries limits the amount of O2 that can be delivered to the periphery (stages 3 and 4). As is the case with stage 1, stage 5 is not a limiting factor at sea level.
To understand the influence of the factors that contribute to stage 3, let’s consider the amount of O2 in l·min− 1 that can be delivered to the working muscles under two conditions that increase the ability of the blood to transport O2: (1) if the concentration of haemoglobin [Hb] in the blood is increased, and (2) if the  is increased (Table 2.1).
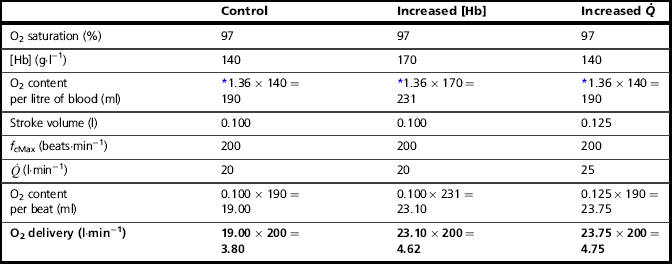
Thus, increasing [Hb] and / or  can increase the amount of O2 delivered to the exercising muscles by more than 20%. In practice, athletes can increase [Hb] legally by only one means, i.e., acclimatization to high altitude. However, the capacity to increase [Hb] by this method is very limited, and not all individuals respond to altitude exposure by increasing [Hb] – hence the temptation to partake in the illegal practice of ‘blood doping’. In contrast to difficulties in manipulating [Hb], SV is very amenable to training, and can be elevated by around 30% (see ‘Training adaptations, Cardiovascular’, below).
 ), which determines the carrying capacity of the entire system. For example, if another truck is added to the fleet ([Hb] is increased), or the throughput of trucks can be increased (
 ), then the quantity of goods departing the depot can also be increased. Now consider what happens at the delivery end of the process. With a finite number of trucks, and many stores to supply, the trucks must have access to a network of roads (blood vessels) that allow them to take their goods as close to the stores as possible. If the road network is plentiful and the fleet has lots of trucks, then it is possible to deliver the goods to the doorstep of every store; delivery is fast and efficient, and the stores do not run out of goods. However, if there aren’t enough trucks to go around, then the trucks must prioritize the stores they deliver to, and not all stores are supplied promptly; consequently, the delivery service fails to keep pace with customer demand, with the result that the stores run out of goods before the next truck arrives. The limiting factor at both ends of the delivery process is the throughput of trucks; similarly, the rate-limiting step in the oxygen transport system is therefore
  .
.There is one more stage in the process of O2 usage, as compared with O2 transport, to be considered, i.e., the ability of the muscles to consume the O2 that is supplied. In our analogy above, this is akin to the customer demand for the goods in the stores. Demand generally exceeds the ability to supply, and muscles could do more work if they were supplied with more O2. This is known because in studies comparing one-legged and two-legged cycling at the same power output the oxygen consumption of two-legged cycling is lower than twice that of one-legged cycling (Davies & Sargeant, 1974). In other words, when one leg has exclusive access to the entire  , it is capable of consuming more oxygen, and doing more work, than when the work and
  are shared by two legs. The concept of O2 usage will be considered in the section ‘Maximal oxygen uptake and oxygen uptake kinetics’ (below).
Before closing this section on cardiorespiratory limitations, we need to consider a breathing-related limitation that has an impact upon O2 transport. This may appear to be a contradictory statement, because earlier in this section it was stated that breathing does not limit stages 1 and 2, above. However, this is not the site at which breathing influences O2 transport. The mechanical and metabolic work of breathing has been shown to affect the delivery of O2 to exercising muscles (Harms et al, 1998). Breathing influences the share of  that the locomotor muscles receive, such that an increase in the work of breathing reduces locomotor muscle blood flow, thereby reducing exercise tolerance (Harms et al, 2000). This influence is exerted via a respiratory muscle metaboreflex (see above), which is discussed in more detail in Chapter 3 (section ‘Respiratory muscle involvement in exercise limitation, Healthy people’).
CARDIORESPIRATORY FITNESS
 is the rate-limiting step in the transport of O2 to exercising muscles. In this section the ability of the body to utilize O2 to undertake external work will be discussed.
 in O2 transport. In an extension to that analogy, we can think of O2 uptake (
 O2) by the muscles as being akin to the sales of the goods, which are a function of the rate of delivery and the customer demand; both are required in order to achieve sales. In the same way, muscle
  O2 is a function of blood flow and O2 utilization. The utilization of O2 is the amount of O2 extracted from the blood as it passes through the tissue, i.e., the arterial to mixed venous O2 difference (a–
 O2). Thus, the
  O2 of a muscle is given by the equation:
 O2 =
O2 =  × a–
× a– O2
O2 O2.
O2. O2 of the entire body can be measured by using the a–
 O2 difference measured at the lungs. Typically, this gradient is around 5 ml at rest, but can be three times this value during heavy exercise. The change is generated by an increased extraction of O2 by the muscles, which produces a reduction in mixed venous O2 content and a wider a–
 O2 difference. However, measuring
  and pulmonary a–
 O2 difference is a highly invasive method of assessing total body
  O2; fortunately, it can also be estimated by subtracting the amount of oxygen exhaled from the amount inhaled at the mouth.
The maximal oxygen uptake ( O2max; also called maximal oxygen consumption or aerobic capacity) is an index that combines both the maximal ability to transport and to utilize O2. It can be defined for an exercising muscle group, but is more frequently defined for the whole body during exercise by measuring
  O2 at the mouth. During exercise at sea level requiring the involvement of > 30% of the total muscle mass,
  O2max is limited by
  , and not by the ability of the muscles to consume O2 (Gonzalez-Alonso & Calbet, 2003). For this reason,
  O2max is used as an index of cardiovascular function, as well as of ‘aerobic fitness’.
Typically,  O2max is estimated by undertaking an incremental exercise test to the limit of tolerance. An example of the
  O2 response to such a test is provided in the bottom right panel of Figure 2.2. The gold standard criterion for a test that is limited by physiological factors is a plateau of
  O2, despite an increase in the external work done. If this plateau is not observable, a number of secondary criteria can be used to imply maximality. These include, either individually or in combination, the following (Poole et al, 2008):
• Respiratory exchange ratio ≥ 1.00, 1.10, or 1.15
• Peak heart rate within 10 beats·min− 1, or 5% of age-predicted maximum
However, use of these indirect criteria has been shown to underestimate  O2max by as much as 27% (Poole et al, 2008). Accordingly, prudence is advised, and the term
  O2 peak (
 O2peak) should be used in order to distinguish the value from a true
  O2max that was limited by central cardiovascular function (
 ). The term
  O2peak is also used in situations where none of these criteria have been met, as will be the case in many patients who are symptom limited by factors such as dyspnoea.
 O2max. Hence, endurance athletes tend to have high values, but so too do very large people with a large muscle mass. Accordingly,
  O2max is often expressed as a relative value by dividing the value expressed in ml·min− 1 by body mass in kilograms to give relative
  O2max in ml·min− 1.kg− 1. Body mass also needs to be borne in mind when considering weight-bearing and non-weight-bearing exercise. For example, being heavy is no disadvantage when cycling a stationary ergometer, but is a considerable disadvantage during walking and running. Accordingly, compared with an overweight individual with a low relative
  O2max, a slight individual with a high relative
  O2max may have a lower ability to sustain a moderate power output on a cycle ergometer, but a much greater ability to sustain ambulation at a moderate speed.
 O2max does not necessarily imply that they will be a good marathon runner. Although, as a population, marathon runners all have a high relative
  O2max, within this population, performance is not predicted by
  O2max. In other words, two athletes with the same relative
  O2max can have very different marathon running times. This is because of the influence of two other factors upon performance: (1) the lactate threshold (LaT) and (2) exercise economy. Each will be considered below.
The response of  O2max to training will be considered in the section ‘Training adaptations’, below.
 O2max. However, in highly trained endurance athletes it may be as high at 90%
  O2max. This is why athletes with the same
  O2max can have very different marathon performances; the athlete whose LaT occurs at the highest percentage of his or her
  O2max can sustain a higher running speed over the course of the marathon.
Exercise economy
The final piece in the performance jigsaw is exercise economy, i.e., the oxygen cost of exercise. At the very top of elite sport, where  O2max and LaT have been optimized, economy appears to be the factor that differentiates world champions from ‘also rans’ (Foster & Lucia, 2007).
As well as being determined by external factors such as the effects of aerodynamic drag, movement economy is determined by a number of intrinsic factors (Saunders et al, 2004):
1. Motor skills (e.g., pedalling efficiently in cycling)
2. Biomechanical factors (e.g., the return of elastic energy during running)
3. Anthropometry (e.g., small, light limbs)
4. Metabolic adaptations within muscles that enhance the amount of energy liberated per unit of oxygen utilized.
Exercise economy is responsive to training, but improvements are difficult to obtain, and scientific evidence to support particular training interventions is limited (Midgley et al, 2007). Accordingly, this aspect of performance will not be considered any further. However, it should be clear that, in patients with obvious difficulties with ambulation, interventions that improve exercise economy also improve exercise tolerance.
PRINCIPLES OF CARDIORESPIRATORY TRAINING
 O2max and LaT, and these factors will be the focus of this section.
The principles of training specificity are discussed in detail in relation to muscle training in Chapter 5, ‘General training principles’. Suffice to say for the purposes of the following section, the principles of overload, specificity and reversibility also apply to whole-body training. In short, muscles and systems need to be overloaded in order to elicit adaptation, these adaptations are specific to the training stimulus that is applied, and they reverse if the overload is removed.
Cardiovascular training adaptations
Oxygen delivery to the exercising muscles can be increased by improving the function of both the heart and the circulatory system. From the preceding sections it will be apparent that the limitations imposed by  upon O2 transport make the pumping capacity of the heart a prime candidate for improvement. Since the heart’s main function is as a pump, the specificity principle dictates that overload must tax the heart’s ability to eject a bolus of blood into the circulation, i.e., improving SV. The determinants of SV are the volume of blood returning to the heart (venous return), the ability of the left ventricle to accommodate blood and the efficiency with which the ventricle is able to eject the blood it contains. In practice this means undertaking whole-body activities that elevate heart rate; however, just as the resistance training of skeletal muscles requires the right combination of load and duration (repetitions), so too does training the myocardium. Typically, for very-high-intensity exercise, the duration of the training stimulus should be ≥ 90 seconds, whilst for sub-maximal exercise it should be ≥ 10 minutes (Jones & Poole, 2009). These types of ‘aerobic’ activities also deliver a training stimulus to the rest of the circulatory system, and to the exercising muscles. Improving circulatory and muscle function will improve
  O2max and LaT, with
  O2max typically having the potential to increase by around 20% in a previously sedentary individual. However, the magnitude of this increase can be greater in people with extremely low baseline function, and also depends upon the intensity and duration of the training stimulus, as well as the frequency and duration of the training programme. Responsiveness to training also varies enormously between individuals owing to genetic predisposition. Just as training can ‘give’
  O2max, inactivity can ‘taketh away’, with a loss of
  O2max at the rate of around 1% per day over a period of up to 30 days of bed rest (Convertino, 1997).
 O2max and LaT fall into three main categories: myocardial, circulatory and muscle adaptations.
Myocardial adaptations
The intrinsic efficiency of the heart improves such that myocardial oxygen cost at a given metabolic rate is lower. The lower fc (bradycardia) at any given metabolic rate is a manifestation of the increase in SV that follows aerobic training (Wilmore et al, 2001a). This increase is made possible by both an increase in the volume of blood returning to the heart (venous return or pre-load) and an increase in left and right ventricular volumes (Scharhag et al, 2002), which is required to accommodate a larger volume of blood at the end of diastole (end-diastolic volume, EDV). Another critical feature of the myocardial response to training is an improvement in the efficiency with which blood is ejected from the ventricles. The resulting reduction in end-systolic volume (ESV) (Scharhag et al, 2002) is due to hypertrophy of the muscle cells, as well as the potentiating influence of pre-load stretch upon the Frank–Starling mechanism (see above). Many of the changes to myocardial function are mutually reinforcing; for example, the increased SV results in a bradycardia, which improves ventricular filling (pre-load) by lengthening diastole. The bradycardia also contributes to lowering myocardial work and thus O2 cost.
Circulatory adaptations
Exercise requires vasodilatation in muscle vascular beds, and vasoconstriction in regions with low metabolic requirements, the latter being a compensatory measure to defend ABP. The volume of fluid within a closed, pump-driven system represents an obvious limitation to the ability to accommodate large changes in the volume of the system (active muscle vasodilatation), without jeopardizing its driving pressure (ABP). Aerobic training stimulates an immediate expansion of the plasma volume, which results from fluid shifts that are secondary to an increased blood albumin concentration (Gillen et al, 1991). A week or so after the increase in plasma volume is an increase in the number of red blood cells (RBCs); however, plasma volume expands relatively more than the number of RBCs, with the result that [Hb] is lower in the trained state. The increase in the number of RBCs increases O2-carrying capacity, whilst the decrease in [Hb] improves flow, thanks to a decrease in viscosity (El-Sayed et al, 2005). Accompanying these improvements in the properties of the blood are enhancements to the structure and function of the vasculature that improve its blood-flow capacity (Laughlin & Roseguini, 2008). Larger blood vessels undergo arteriogenesis, increasing their diameter, whilst the capillary network is expanded through angiogenesis. The former increases the capacitance of the peripheral vasculature, whilst the latter slows capillary transit time and brings blood closer to the muscle cells, increasing oxygen extraction (Wilmore et al, 2001a). There is also an improvement in the functional properties of the vasculature, which increase exercise blood-flow capacity; these are underpinned by changes to vessel endothelial and smooth muscle properties (Laughlin & Roseguini, 2008). These vascular changes appear to show a high degree of heterogeneity and are specific to the type of training (e.g., high vs moderate intensity). Finally, training induces a lower sympathetic nervous system activity, resulting in an attenuated ABP response to exercise, and a slight (< 3 mmHg) reduction in resting ABP (Wilmore et al, 2001b).
Muscle adaptations
The enhancement is the efficiency of the O2 delivery system are accompanied by an enhanced ability of the muscle cells to utilize O2 to liberate energy for work. Oxygen is utilized within the cells’ mitochondria to liberate energy from pyruvate, in the form of ATP, to fuel muscle contraction. Endurance training induces an increase in the size and number of muscle cell mitochondria, which results in an increase in overall mitochondrial enzyme activity (Holloszy & Booth, 1976). Amongst other metabolic changes elicited by the enhanced enzyme activity is a reduction in lactic acid production (Stallknecht et al, 1998), which is the alternative destination for pyruvate when the oxidative capacity of the cells is limited.
Respiratory training adaptations
In light of the huge capacity of the cardiovascular system to adapt to training, one might expect the lungs to exhibit a similar degree of plasticity. To most people’s surprise, the lungs show no training response. Unlikely though it seems, training does not increase lung volumes, improve lung function, or enhance the ability of the lungs to transfer oxygen to the blood, even in athletes who have trained for many years (Wagner, 2005).
Notwithstanding this inability to adapt to training, the observation that the lung function of athletes such as swimmers and rowers is superior to that of their non-athletic contemporaries has led to speculation that physical training, especially during childhood and adolescence, may enhance the development of the lungs (Armour et al, 1993). However, one cannot exclude the possibility that, for some sports, having large lungs may provide an advantage that leads to success. Hence only competitors with larger than normal lungs succeed and remain to compete in their chosen sport as adults.
Notwithstanding the intransigence of the lungs per se to adapt to training, the musculature of the respiratory pump (Powers & Criswell, 1996) and upper airway (Vincent et al, 2002) has been shown to respond to endurance training. There is also evidence that endurance training raises the intensity of inspiratory muscle work required to activate the inspiratory muscle metaboreflex (Callegaro et al, 2011). This reflex is know to impair O2 delivery to exercising locomotor muscles (Harms et al, 1997) and to exacerbate fatigue (Romer et al, 2006).
Whole-body exercise training also results in higher peak  E during exercise, as well as a lower ventilatory equivalent for oxygen (
 E /
E /  O2), i.e., a reduced breathing requirement for exercise. The latter results from an increase in VT, and a corresponding improvement in the dead space to tidal volume ratio (VD / VT), which increases alveolar ventilation (VA), lessening the
  E requirement. As was discussed above (see ‘Cardiorespiratory limitation of exercise tolerance’), an improved respiratory-pumping capacity does not enhance blood oxygenation, but it does enhance the ability to make a respiratory compensation for a metabolic acidosis.
The response of the respiratory musculature to specific resistance training and the associated functional benefits are described in detail in Chapter 4.
METHODS OF CARDIORESPIRATORY TRAINING
The physiological changes that underpin a training-induced increase in aerobic exercise performance / tolerance involve the integrated overload of the cardiovascular, respiratory and neuromuscular systems. The optimal training stimulus is therefore any exercise that overloads the entire aerobic energy transfer system, from lungs to mitochondria. The activities that facilitate this type of overload involve repeated, rhythmic contractions of large muscle groups at intensities that can be sustained for ≥ 10 minutes (see ‘Exercise modality’, below).
 O2max and the LaT. As we learned above, these two parameters normally increase in concert with one another, but it is also possible to tailor training to emphasize the overloading stimulus to one or other parameter. In the following sections, the characteristics of training programmes to increase in
  O2max and LaT are described.
Exercise modality
However, the specificity principle limits the extent to which cardiorespiratory improvements transfer between different exercise modalities (Millet et al, 2009). In other words, a 15% increase in  O2max achieved through cycle training will not necessarily result in the same improvement in
  O2max during running. The reasons for this are not fully understood, but probably arise because of the specificity of the peripheral adaptations to muscle structure and function, as well as biomechanics. Notwithstanding these limitations, many athletes uses a range of exercise modalities, so-called ‘cross training’, as a means of lessening boredom, and of reducing the risk of overuse injuries. Cross training can also enhance adherence to training, especially at a recreational level.
 O2max might be one of the main physiological outcomes that a particular training programme targets, maximizing
  O2max is unlikely to be the goal from the perspective of the individual undertaking the training. For example, an amateur competitive runner is more likely to be focussed on, say improving their 10 km time. Although
  O2max improvement may contribute to the achievement of personal goals, it is not an end in itself particularly, as the limitation to the 10 km performance may not reside in
  O2max but in the running speed corresponding to the LaT. With goals and specificity in mind, if one is training to increase 10 km running performance then this is best achieved through the practice of running, and using a training regimen that overloads both
  O2max and LaT.
Before closing this section, there is one final aspect of specificity to consider, i.e., the role of the trunk musculature in specific exercise modalities (see also Ch. 3, ‘Non-respiratory functions of the respiratory muscles’). A striking phenomenon, particularly in non-athletes, is the greater intensity of dyspnoea at equivalent  O2 during walking / running than during cycling. The mechanism underpinning this is the involvement of the respiratory musculature in postural control during running – a challenge that is not present during cycling, especially on a stationary ergometer. In other words, the respiratory muscles are required to multi-task during running, which increases respiratory muscle work and exacerbates dyspnoea. The implications of this are three-fold: (1) if training overload is limited by dyspnoea during walking / running, then an alternative modality (e.g., cycling) might enhance the overall aerobic training response, (2) if reducing dyspnoea during activities of daily living is a goal, then using cycling as a means of training does not deliver a sufficiently specific training overload, because it does not address the postural role of the trunk muscles during exercise, and (3) supplementing or preceding the aerobic training with specific respiratory muscle and postural training may enhance the final training outcome by reducing limitations arising from dyspnoea.
Aerobic capacity ( O2max)
 O2max. Improvement of
  O2max is therefore underpinned principally by the improvement of O2 delivery by the cardiovascular system. Accordingly, training interventions that are intended to increase
  O2max must overload the cardiovascular contribution to O2 delivery. Improvement in
  O2max has become synonymous with the concept of ‘endurance’ training, i.e., undertaking prolonged, moderate-intensity exercise. However, this traditional view is changing and there is evidence supporting alternative training to enhance
  O2max.
 O2max:
• Intensity: The percentage of  O2max of the training. This can be expressed in range of ways, including the percentage of: (1) total
  O2max, (2)
  O2 reserve (
 O2maxR), (3) maximal fc, (4) fc reserve and (5) metabolic equivalent of the task (MET). Irrespective of baseline function, the improvements in
  O2max are greater with exercise of vigorous intensity than with moderate intensity (Swain, 2005) (Table 2.2).
Table 2.2
Minimum intensity and effective intensity ranges, duration and frequency of training required to increase  O2max in individuals with low, moderate and high baseline
  O2max1
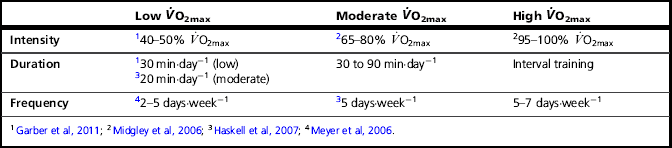
• Duration: The duration of each individual bout of exercise has received much attention, and current recommendations advise a minimum daily goal of ≥ 30 minutes per day (5 days per week), which can be accumulated in individual bouts of ≥ 10 minutes (Garber et al, 2011). Because the duration of exercise required to elicit a training effect is inversely related to duration, higher-intensity exercise requires a daily accumulation of only 20 minutes (Table 2.2).
• Frequency: The weekly frequency of training has also received specific attention, and current recommendations advise a minimum daily goal of 5 days per week (≥ 30 minutes per day) (Garber et al, 2011). However, in previously untrained individuals, accumulating the same total duration (150 minutes per week) in as little as 2 days per week can yield the same increase in  O2max (Meyer et al, 2006) (Table 2.2).
There is no ‘magic bullet’ training regimen for increasing  O2max, but Table 2.2 attempts to provide some approximate, evidence-based guidance. As well as bearing in mind the enormous heterogeneity of responsiveness to training, the necessity to vary and progress the stimulus must also be borne in mind. In addition, the table provides minimum thresholds; optimized benefits are achieved by maximizing training intensity. For example, in previously sedentary men, training at 80%
  O2max three times per week elicited a greater increase in
  O2max than training at 60%
  O2max, at equivalent caloric expenditure per training session (400 kcal).
The progression of training is essential, as improvements in absolute  O2max will render a given percentage of
  O2max relatively less intense. Any of the three aforementioned components of the training prescription can be varied in order to maintain overload. Current guidelines make no specific recommendations, but common sense suggests that a combination of all three components is required (Garber et al, 2011).
Lactate threshold
The intensity of exercise corresponding to the LaT is determined primarily by the oxidative capacity of the active muscle mass (Ivy et al, 1980). As was discussed above, the LaT represents the intensity at which the production of lactic acid exceeds its breakdown. Endurance training appears to increase the intensity of exercise corresponding to the LaT by enhancing the ability to break down lactic acid (Donovan & Brooks, 1983). Thus exercise regimens that overload the lactate clearance mechanisms are required in order to elicit improvement in LaT. A typical training session to achieve this goal will be ~ 20 minutes in duration at an intensity of ~ 90%  O2max. However, there are a variety of methods that can be used to enhance LaT, including interval training at maximal (100%
  O2max) and supramaximal (130%
  O2max) intensities, in bouts that are sustained for ~ 3 minutes and 30 seconds, respectively (Esfarjani & Laursen, 2007). These training regimens also improve
  O2max, with the largest increase in both parameters (~ 10%) observed after interval training at 100%
  O2max for ~ 3 minutes (8 bouts per session, two times per week) (Esfarjani & Laursen, 2007).
 O2max, it may also be better tolerated in individuals in whom the escalating intensity of exercise-related symptoms can limit the ability to undertake continuous exercise, e.g., dyspnoeic patients. Notwithstanding this, high-intensity training may also be contraindicated for certain individuals, especially those with cardiovascular disease. Accordingly, the design of a training regimen needs to be made on the basis of the clinical profile of the individual involved.
References
Amann, M., Dempsey, J.A. The concept of peripheral locomotor muscle fatigue as a regulated variable. J. Physiol. 2008;586:2029–2030.
Amann, M., Dempsey, J.A. Locomotor muscle fatigue modifies central motor drive in healthy humans and imposes a limitation to exercise performance. J. Physiol. 2008;586:161–173.
Amann, M., Proctor, L.T., Sebranek, J.J., et al. Opioid-mediated muscle afferents inhibit central motor drive and limit peripheral muscle fatigue development in humans. J. Physiol. 2009;587:271–283.
Amann, M., Blain, G.M., Proctor, L.T., et al. Group III and IV muscle afferents contribute to ventilatory and cardiovascular response to rhythmic exercise in humans. J. Appl. Physiol. 2010;109:966–976.
Armour, J., Donnelly, P.M., Bye, P.T. The large lungs of elite swimmers: an increased alveolar number? Eur. Respir. J. 1993;6(2):237–247.
Astrand, P.O., Rodahl, K., Stromme, S. Textbook of work physiology: Physiological bases of exercise, fourth ed. Champaign, IL: Human Kinetics; 2003. [p. 185].
Barry, B.K., Enoka, R.M. The neurobiology of muscle fatigue: 15 years later. Integrative and Comparative Biology. 2007;47:465–473.
Bigland-Ritchie, B. EMG and fatigue of human voluntary and stimulated contractions. In: Porter R., Whelan J., eds. Human muscle fatigue: physiological mechanisms. London: Pitman Medical; 1981:130–156.
Bigland-Ritchie, B., Woods, J.J. Changes in muscle contractile properties and neural control during human muscular fatigue. Muscle Nerve. 1984;7:691–699.
Bigland-Ritchie, B., Kukulka, C.G., Lippold, O.C., et al. The absence of neuromuscular transmission failure in sustained maximal voluntary contractions. J. Physiol. 1982;330:265–278.
Cady, E.B., Elshove, H., Jones, D.A., et al. The metabolic causes of slow relaxation in fatigued human skeletal muscle. J. Physiol. 1989;418:327–337.
Callegaro, C.C., Ribeiro, J.P., Tan, C.O., et al. Attenuated inspiratory muscle metaboreflex in endurance-trained individuals. Respir. Physiol. Neurobiol. 2011;177:24–29.
Convertino, V.A. Cardiovascular consequences of bed rest: effect on maximal oxygen uptake. Med. Sci. Sports Exerc. 1997;29:191–196.
Davies, C.T., Sargeant, A.J. Physiological responses to one- and two-leg exercise breathing air and 45 percent oxygen. J. Appl. Physiol. 1974;36:142–148.
Denny-Brown, D.E. On inhibition as a reflex accompaniment of the tendon jerk and of other forms of active muscular response. Proc. R. Soc. Lond. B Biol. Sci. 1928;103:321–326.
Donovan, C.M., Brooks, G.A. Endurance training affects lactate clearance, not lactate production. Am. J. Physiol. 1983;244:E83–E92.
El-Sayed, M.S., Ali, N., El-Sayed Ali, Z. Haemorheology in exercise and training. Sports Med. 2005;35:649–670.
Enoka, R.M., Duchateau, J. Muscle fatigue: what, why and how it influences muscle function. J. Physiol. 2008;586:11–23.
Enoka, R.M., Stuart, D.G. Neurobiology of muscle fatigue. J. Appl. Physiol. 1992;72:1631–1648.
Esfarjani, F., Laursen, P.B. Manipulating high-intensity interval training: effects on VO2max, the lactate threshold and 3000 m running performance in moderately trained males. J. Sci. Med. Sport. 2007;10:27–35.
Foster, C., Lucia, A. Running economy: the forgotten factor in elite performance. Sports Med. 2007;37:316–319.
Gandevia, S.C. Neural control in human muscle fatigue: changes in muscle afferents, motoneurones and motor cortical drive [corrected]. Acta Physiol. Scand. 1998;162:275–283.
Gandevia, S.C. Spinal and supraspinal factors in human muscle fatigue. Physiol. Rev. 2001;81:1725–1789.
Garber, C.E., Blissmer, B., Deschenes, M.R., et al, American College of Sports Medicine position stand. Quantity and quality of exercise for developing and maintaining cardiorespiratory, musculoskeletal, and neuromotor fitness in apparently healthy adults: guidance for prescribing exercise. Med. Sci. Sports Exerc. 2011;43:1334–1359.
Gillen, C.M., Lee, R., Mack, G.W., et al. Plasma volume expansion in humans after a single intense exercise protocol. J. Appl. Physiol. 1991;71:1914–1920.
Gonzalez-Alonso, J. Human thermoregulation and the cardiovascular system. Exp. Physiol. 2012;97:340–346.
Gonzalez-Alonso, J., Calbet, J.A. Reductions in systemic and skeletal muscle blood flow and oxygen delivery limit maximal aerobic capacity in humans. Circulation. 2003;107:824–830.
Hamilton, A.L., Killian, K.J., Summers, E., et al. Quantification of intensity of sensations during muscular work by normal subjects. J. Appl. Physiol. 1996;81:1156–1161.
Harms, C.A., Dempsey, J.A. Cardiovascular consequences of exercise hyperpnea. Exerc. Sport Sci. Rev. 1999;27:37–62.
Harms, C.A., Babcock, M.A., McClaran, S.R., et al. Respiratory muscle work compromises leg blood flow during maximal exercise. J. Appl. Physiol. 1997;82:1573–1583.
Harms, C.A., Wetter, T.J., McClaran, S.R., et al. Effects of respiratory muscle work on cardiac output and its distribution during maximal exercise. J. Appl. Physiol. 1998;85:609–618.
Harms, C.A., Wetter, T.J., St Croix, C.M., et al. Effects of respiratory muscle work on exercise performance. J. Appl. Physiol. 2000;89:131–138.
Haskell, W.L., Lee, I.M., Pate, R.R., et al. Physical activity and public health: updated recommendation for adults from the American College of Sports Medicine and the American Heart Association. Med. Sci. Sports Exerc. 2007;39:1423–1434.
Holloszy, J.O., Booth, F.W. Biochemical adaptations to endurance exercise in muscle. Annu. Rev. Physiol. 1976;38:273–291.
Hunter, S.K., Duchateau, J., Enoka, R.M. Muscle fatigue and the mechanisms of task failure. Exerc. Sport Sci. Rev. 2004;32:44–49.
Hussain, S.N.A., Comtois, A.S. Regulation of skeletal muscle blood flow during exercise. In: Hamid Q., Shannon J., Martin J., eds. Physiologic basis of respiratory disease. Hamilton, ONT: Decker; 2005:555–566.
Ivy, J.L., Withers, R.T., Van Handel, P.J., et al. Muscle respiratory capacity and fiber type as determinants of the lactate threshold. J. Appl. Physiol. 1980;48:523–527.
Jones, A.M., Poole, D.C. Physiological demands of endurance exercise. In: Maughan R.J., ed. Olympic textbook of science in sport. Oxford: Blackwell; 2009:43–55.
Jones, D.A., de Haan, A., Round, J.M. Skeletal muscle: from molecules to muscles. London: Churchill Livingstone; 2004.
Laughlin, M.H., Roseguini, B. Mechanisms for exercise training-induced increases in skeletal muscle blood flow capacity: differences with interval sprint training versus aerobic endurance training. J. Physiol. Pharmacol. 2008;59(Suppl. 7):71–88.
Levick, R.J. An introduction to cardiovascular physiology. London: Hodder Arnold; 2009.
Maluf, K.S., Enoka, R.M. Task failure during fatiguing contractions performed by humans. J. Appl. Physiol. 2005;99:389–396.
McConnell, A.K. Breathe strong, perform better. Champaign, IL: Human Kinetics Publishers; 2011.
McConnell, A.K., Lomax, M. The influence of inspiratory muscle work history and specific inspiratory muscle training upon human limb muscle fatigue. J. Physiol. 2006;577:445–457.
McKenna, M.J., Hargreaves, M. Resolving fatigue mechanisms determining exercise performance: integrative physiology at its finest!. J. Appl. Physiol. 2008;104:286–287.
McKenzie, D.K., Allen, G.M., Butler, J.E., et al. Task failure with lack of diaphragm fatigue during inspiratory resistive loading in human subjects. J. Appl. Physiol. 1997;82:2011–2019.
Merton, P.A. Voluntary strength and fatigue. J. Physiol. 1954;123:553–564.
Meyer, T., Auracher, M., Heeg, K., et al. Does cumulating endurance training at the weekends impair training effectiveness? Eur. J. Cardiovasc. Prev. Rehabil. 2006;13:578–584.
Midgley, A.W., McNaughton, L.R., Wilkinson, M. Is there an optimal training intensity for enhancing the maximal oxygen uptake of distance runners? Empirical research findings, current opinions, physiological rationale and practical recommendations. Sports Med. 2006;36:117–132.
Midgley, A.W., McNaughton, L.R., Jones, A.M. Training to enhance the physiological determinants of long-distance running performance: can valid recommendations be given to runners and coaches based on current scientific knowledge? Sports Med. 2007;37:857–880.
Millet, G.P., Vleck, V.E., Bentley, D.J. Physiological differences between cycling and running: lessons from triathletes. Sports Med. 2009;39:179–206.
Polkey, M.I., Moxham, J. Improvement in volitional tests of muscle function alone may not be adequate evidence that inspiratory muscle training is effective. Eur. Respir. J. 2004;23:5–6.
Poole, D.C., Wilkerson, D.P., Jones, A.M. Validity of criteria for establishing maximal O2 uptake during ramp exercise tests. Eur. J. Appl. Physiol. 2008;102:403–410.
Powers, S.K., Criswell, D. Adaptive strategies of respiratory muscles in response to endurance exercise. Med. Sci. Sports Exerc. 1996;28:1115–1122.
Priban, I.P., Fincham, W.F. Self-adaptive control and respiratory system. Nature. 1965;208:339–343.
Rohrbach, M., Perret, C., Kayser, B., et al. Task failure from inspiratory resistive loaded breathing: a role for inspiratory muscle fatigue? Eur. J. Appl. Physiol. 2003;90:405–410.
Romer, L.M., Polkey, M.I. Exercise-induced respiratory muscle fatigue: implications for performance. J. Appl. Physiol. 2008;104:879–888.
Romer, L.M., Lovering, A.T., Haverkamp, H.C., et al. Effect of inspiratory muscle work on peripheral fatigue of locomotor muscles in healthy humans. J. Physiol. 2006;571:425–439.
Rudroff, T., Barry, B.K., Stone, A.L., et al. Accessory muscle activity contributes to the variation in time to task failure for different arm postures and loads. J. Appl. Physiol. 2007;102:1000–1006.
Saunders, P.U., Pyne, D.B., Telford, R.D., et al. Factors affecting running economy in trained distance runners. Sports Med. 2004;34:465–485.
Scharhag, J., Schneider, G., Urhausen, A., et al. Athlete’s heart: right and left ventricular mass and function in male endurance athletes and untrained individuals determined by magnetic resonance imaging. J. Am. Coll. Cardiol. 2002;40:1856–1863.
Similowski, T., Duguet, A., Straus, C., et al. Assessment of the voluntary activation of the diaphragm using cervical and cortical magnetic stimulation. Eur. Respir. J. 1996;9:1224–1231.
Sinoway, L., Prophet, S. Skeletal muscle metaboreceptor stimulation opposes peak metabolic vasodilation in humans. Circ. Res. 1990;66:1576–1584.
Stallknecht, B., Vissing, J., Galbo, H. Lactate production and clearance in exercise. Effects of training. A mini-review. Scand. J. Med. Sci. Sports. 1998;8:127–131.
Swain, D.P. Moderate or vigorous intensity exercise: which is better for improving aerobic fitness? Prev. Cardiol. 2005;8:55–58.
Vincent, H.K., Shanely, R.A., Stewart, D.J., et al. Adaptation of upper airway muscles to chronic endurance exercise. Am. J. Respir. Crit. Care Med. 2002;166:287–293.
Wagner, P.D. Why doesn’t exercise grow the lungs when other factors do? Exerc. Sport Sci. Rev. 2005;33(1):3–8.
Westerblad, H., Duty, S., Allen, D.G. Intracellular calcium concentration during low-frequency fatigue in isolated single fibers of mouse skeletal muscle. J. Appl. Physiol. 1993;75:382–388.
Williams C., Ratel S., eds. Human muscle fatigue. London: Routledge, 2009.
Wilmore, J.H., Stanforth, P.R., Gagnon, J., et al. Cardiac output and stroke volume changes with endurance training: the HERITAGE Family Study. Med. Sci. Sports Exerc. 2001;33:99–106.
Wilmore, J.H., Stanforth, P.R., Gagnon, J., et al. Heart rate and blood pressure changes with endurance training: the HERITAGE Family Study. Med. Sci. Sports Exerc. 2001;33:107–116.


