[level-membership-for-emergency-medicine-category]Chapter 1
Vital Signs Measurement
Measuring the temperature, pulse, respiratory rate (RR), blood pressure, and pulse oximetry is generally recommended for all emergency department (ED) patients, in addition to assessment of pain in the appropriate patient population. For very minor problems or for some fast-track patients (e.g., suture removal), a full set of vital signs may not be required, but this is best decided on a case-by-case basis rather than by strict protocol. Vital signs may not only indicate the severity of illness but also dictate the urgency of intervention. Although a single set of abnormal values suggests pathology, findings on triage or the initial vital signs may be spurious and simply be related to stress, anxiety, pain, or fear. It would be incorrect and not standard of care to attribute initial triage blood pressure, RR, or pulse rate to specific pathology or to retrospectively assume that diagnostic or treatment interventions should have been initiated based solely on these readings. The greatest utility of vital signs, therefore, is their observation and trends over time. Deteriorating vital signs are an important indicator of a compromised physiologic condition, and improving values provide reassurance that the patient is responding to therapy. When a patient undergoes treatment over an extended period, it is essential that the vital signs be repeated as appropriate to the clinical scenario, particularly those that were previously abnormal. In some clinical circumstances it is advisable to monitor the vital signs continuously.1
Vital signs should be measured and recorded at intervals as dictated by clinical judgment or the patient’s clinical state or after any significant change in these parameters. Adhering to protocols or disease categories may not be useful or productive. An abnormal vital sign may constitute the patient’s entire complaint, as in a febrile infant, or it may be the only indication of the potential for serious illness, as in a patient with resting tachycardia.2
Emergency medical service (EMS) personnel begin assessment of the patient’s status and vital signs in the prehospital setting. Surges of epinephrine and norepinephrine commonly occur during transport by the EMS, and these hormones are known to alter vital signs and lead to increases in the heart rate of greater than 10%.3 Vagal influences may also influence EMS-derived vital signs. Prehospital vital signs should always be interpreted with the entire clinical scenario in perspective.
Background
Early recognition of vital signs dates back to the fourth century bc, when Herophilus first described sphygmology, or palpation of the pulse in terms of size, frequency, force, and rhythm. Chinese clinicians (second century bc) timed the pulse by the RR of the examiner in the belief that four pulsations per respiration was normal for adults. The study of pulses was greatly influenced by Galen, who expanded the subject into a rather complex and obscure art form and wrote 18 books on the subject.4
Blood pressure was first measured directly in 1733 by Hales, who recorded arterial pressure in a mare by cannulation with a brass pipe and a blood-filled glass column.5 Frank used large-bore catheters connected to a rubber membrane in a 1903 manometer.6 Invention of inflatable cuff manometers (Riva-Rocci, 1896) and discovery of the arterial phase sounds (Korotkoff, 1905) allowed the development of indirect measurement of blood pressure.5,6
Clinical thermometry was introduced by Sanctorius in 1625, with early thermometers being filled with alcohol. Mercury column thermometers were introduced by Fahrenheit in 1714. Although their routine use was supported by Boerhaave, thermometry was not established as routine clinical practice until the 1870s.7
Normal Values
Published vital sign norms for children are not as well accepted as those for adult patients. Table 1-1 and Table 1-2 report normal vital signs for children by age group as means and standard deviations. In Table 1-1, the values for pulse and blood pressure for 0- to 2-month-olds are adapted from studies of newborn populations (i.e., <7 days).8–10 During the newborn period, normal arterial blood pressure rises rapidly. Values for pulse and respiration in children older than 3 years reflect an average of male and female values for 0- to 1-, 3-, 9-, and 16-year-old populations. The values for blood pressure reflect an average of male and female values for the 1- to 6-month-old and the 3-, 9-, and 16-year-old populations.11 Newer studies have reassessed the reference values for RR in children.12–14 Table 1-2 reflects age-related changes and the effect of the state of wakefulness on RR in children up to 3 years of age.14 A study evaluating resting RRs in pediatric ED patients up to the age of 18, however, indicated considerable patient variability and somewhat higher RRs than those shown in Table 1-2.12
TABLE 1-1
Normal Values for Vital Signs in Infants and Children (Means ± SD)
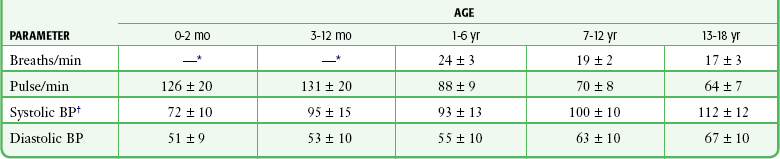
BP, blood pressure; SD, standard deviation.
*For data on children 0 to 36 moths, see Table 1-2.
†As an estimate, for children 1 to 10 years of age, (2 × age [yr]) + 90 mm Hg = 50th percentile for systolic BP.
TABLE 1-2
Normal Respiratory Rates (Breaths/min) in Children Up to 3 Years of Age (Means ± SD)
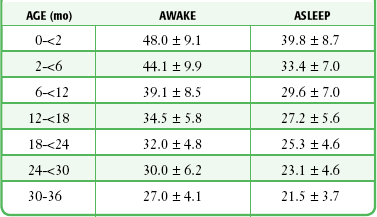
Adapted from Rusconi F, Castagneto M, Gagliardi L, et al. Reference values for respiratory rate in the first 3 years of life. Pediatrics. 1994;94:351.
For the adult population, normal blood pressure values have been established. Although systolic blood pressure increases with age, normotensive or normal systolic blood pressure is defined as 90 to 140 mm Hg, and normotensive or normal diastolic blood pressure is defined as 60 to 90 mm Hg. The recent literature suggests defining an “optimal” blood pressure as 115/75 because values at or below this level have been associated with minimal vascular mortality.15 It has been suggested that the definition of hypertension be further expanded to integrate a global cardiovascular risk assessment.16,17 Although most patients have similar blood pressure in both arms, Pesola and coworkers found that 18% of their hypertensive population18 and 15% of their normotensive population had a difference of greater than 10 mm Hg in systolic blood pressure between arms.19
Within the adult population, optimal definitions for normal systolic blood pressure probably vary by age, and particular differentiation should be made in regard to geriatric patients in the emergency setting. The recent literature suggests redefining values representative of hypotension in the elderly, especially in the setting of trauma. Systolic blood pressure readings ranging from approximately 90 to 120 mm Hg have been associated with occult hypoperfusion and increased mortality in geriatric trauma patients.20–22
In 1928 the New York Heart Association, by consensus, established the normal limits for the resting heart rate as 60 beats/min and 100 beats/min. More recent data indicate that 45 beats/min and 95 beats/min may better define the heart rate limits of normal sinus rhythm in adults of all ages. Spodick recommended that the operational definition for the limits of the resting heart rate in adults be 50 beats/min and 90 beats/min.23,24 This view is widely supported among cardiologists,25,26 but these ranges have not been validated in the ED setting. There is currently no consensus on what constitutes a normal adult RR; however, an RR range of 12 to 24 breaths/min is generally accepted in the existing literature as the norm for adults.27,28
Pregnancy results in alterations in the normal adult values for pulse and blood pressure. The RR is unchanged, although the physiologic hyperventilation of pregnancy is well recognized and results from increased tidal volume and decreased residual and expiratory reserve volume.29 The resting pulse rate increases throughout pregnancy to 10% to 15% over baseline values. The norms for systolic and diastolic blood pressure are dependent on patient positioning. When a pregnant patient is sitting or standing, systolic pressure is essentially unchanged. Diastolic pressure declines until approximately 28 weeks’ gestation, at which time it begins to rise to nonpregnant levels. When a pregnant patient is in the lateral decubitus position, both systolic and diastolic pressure declines until the 28th week and then begins to rise to nonpregnant levels (Table 1-3).30
TABLE 1-3
Vital Signs during Pregnancy in the Lateral Decubitus Position (Means ± SD)
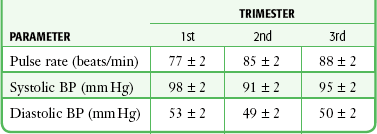
BP, blood pressure; SD, standard deviation.
Adapted from Katz R, Karliner JS, Resnik R. Effects of a natural volume overload state (pregnancy) on left ventricular performance in normal human subjects. Circulation. 1978;58:434. By permission of the American Heart Association.
Respiration
Breathing is initiated and primarily controlled in the medullary respiratory center of the brainstem. The respiratory center is modulated by the pneumotaxic center, which limits the length of the inspiratory signal and greatly influences the RR and apneustic center in the pons.31 Respiratory frequency reveals only a glimpse of the entire clinical picture. The pattern, effort, and volume of respiration may be more indicative of altered respiratory physiology. An abnormality in respiration may be a primary complaint or a manifestation of other systemic diseases. Increased RRs may be seen in patients with a variety of pulmonary or cardiac diseases, but acidosis, anemia, temperature, stress, and drugs (such as stimulants and salicylates) can significantly alter the RR in the absence of cardiopulmonary dysfunction.
Indications and Contraindications
The respiratory status of both adults and children plays a crucial role in determining the overall assessment of illness. Although it is a sensitive yet nonspecific indicator of respiratory dysfunction, the RR can also predict nonpulmonary morbidity. Several prehospital and hospital-based illness or injury severity scores feature the RR as a cardinal value. A prehospital RR of less than 10 or greater than 29 breaths/min is associated with major injury in 73% of children.32 Using tachypnea alone as a predictor of pulmonary pathology, infants with an RR higher than 60 are found to be hypoxic 80% of the time.33 Pediatric studies have linked abnormal RRs to in-hospital mortality and the level of care required in the ED.34,35 In a retrospective study exploring predictors of critical care admission for adult ED patients who were initially triaged as having low to moderate acuity, an abnormal RR at the first nursing assessment increased the odds of critical care admission by a factor of 1.66.36 An RR higher than 25 breaths/min in prehospital trauma patients was associated with increased mortality.37 Pre-arrest respiratory insufficiency (RR >36 breaths/min or pulse oximetry <90%) was an independent predictor of mortality (odds ratio [OR], 4.2) in patients with EMS-witnessed cardiac arrest.38 Although some studies have associated abnormal RRs in adult ED patients with increased mortality,39,40 a recent large prospective cohort study of adult patients found that an initial abnormal RR on triage in the ED was not an independent predictor of hospital mortality.41
Procedure
To measure RR (inspirations per minute), count the respirations when the patient is unaware that his or her breathing is being observed. Count for a full minute to most accurately determine the RR. The frequency of breathing is less regular than the pulse, and inaccurate measurement is more likely to occur if the count is taken for a shorter interval. An infant’s RR can easily be determined by observing or palpating the excursion of the chest or the abdominal wall.42 Infants should be observed for grunting respirations, which are produced by expiration against a partly closed glottis (an attempt to maintain positive airway pressure).
Interpretation
The reproducibility of RR measurements may be limited by significant interobserver variability.43,44 Clinicians should recognize this inherent variability and interpret the RR with caution. Rates obtained by nurses versus medical students varied significantly, as did those obtained by medical students versus residents and attending clinicians.45 Interobserver variability may account for a difference of up to 6 breaths/min, and variability in the same observer may account for up to 5 breaths/min.45 A study comparing RRs obtained by triage nurses with an electronic monitor found that neither provided an accurate measurement of the RR in the ED, thus suggesting that new clinical strategies for obtaining this vital sign may be necessary.46
Current texts vary considerably in their definition of a normal RR and cite published values that range from 8 to 24 breaths/min. In a study that specifically investigated normal RRs in an ED (afebrile ambulatory patients without respiratory complaints), females had a mean RR of 20.9 breaths/min and males had a mean RR of 19.4 breaths/min. The researchers concluded that a normal RR in the adult patient population was 16 to 24 breaths/min.45 Other studies have provided additional information on normal resting and sleep-state RRs in children younger than 7 years.9–14 RRs obtained with a stethoscope were higher than those obtained by observation (mean difference, 2.6 breaths/min in awake and 1.8 breaths/min in asleep children). Smoothed percentile curves demonstrated a larger dispersion at birth (5th percentile, 34 breaths/min; 95th percentile, 68 breaths/min), whereas dispersion was less at 36 months of age (5th percentile, 18 breaths/min; 95th percentile, 30 breaths/min).
The RR will generally increase in the presence of fever. It is often difficult to determine whether tachypnea is a primary finding or is simply associated with hyperpyrexia. A study of children younger than 2 years in whom pneumonia was subsequently diagnosed found that age-appropriate limits for resting tachypnea in the presence of fever could be defined. A sensitivity of 74% and specificity of 77% for pneumonia were found when children 6 months of age had an RR higher than 59 breaths/min, when those aged 6 to 11 months had an RR higher than 52 breaths/min, and when those 1 to 2 years old had an RR higher than 42 breaths/min.47 Even in the face of physiologic compensation for fever, interpretation of the RR alone can help predict the presence of pulmonary disease.
Respiratory Pattern and Amplitude
Hyperventilation and hypoventilation can result from an extensive variety of disorders and may be related to pulmonary or extrapulmonary pathology. Abnormal respiratory patterns can be characteristic of metabolic or central nervous system pathologic conditions (Fig. 1-1) and may aid in the differential diagnosis. Kussmaul respirations describe the hyperventilation pattern seen in diabetics with ketoacidosis. Hyperpnea, or a normal RR but clinically significant hyperventilation secondary to increased tidal volume, may be seen with salicylate poisoning.48
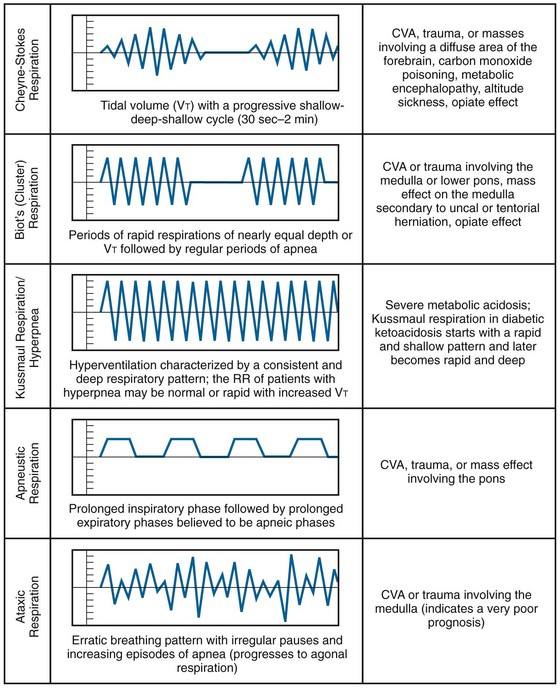
Figure 1-1 Abnormal respiratory patterns. CVA, cerebrovascular accident; RR, respiratory rate. (Adapted from Breathing Patterns. © 2011—D’Urbano J—Breath Sounds. Available at http://www.BreathSounds.org.)
Observe the respiratory patterns carefully in children. In infants it is essential to distinguish normal periodic breathing from apnea. By definition, periodic breathing consists of three or more respiratory pauses longer than 3 seconds in duration with less than 20 seconds between pauses. There is no associated bradycardia or cyanosis. This contrasts with apnea, which is a particular problem in preterm infants. Apnea is defined as a respiratory pause longer than 20 seconds. It may be associated with bradycardia and hypoxia.42 Periodic breathing and apnea are believed to be disorders on a continuum, both stemming from abnormal physiologic control of respiration. Periodic breathing is considered a benign disorder, but infants with symptomatic apneic episodes that result in apparent life-threatening events are thought to be at increased risk for sudden infant death syndrome.49
Pulse
Indications and Contraindications
Assessment of blood flow by palpation of the pulse can be used to gauge the presence of cardiac contractility and not just the electrical rhythm. Caution should be taken to not over-generalize the presence or strength of a pulse in predicting blood pressure. The necessity for repeated pulse evaluations is dictated by the clinical complaint and the status of the patient. Continuous monitoring is not routine but may be helpful when the clinical situation may predict significant variability in heart rate, as in the setting of sepsis.50 An association between absence of a radial pulse or absence of both radial and femoral pulses and hypotension has been demonstrated in hypovolemic trauma patients. The variability in individual response prohibits the use of this parameter as an absolute gauge of blood pressure.51
Procedure
Depending on the clinical scenario, pulses are palpable at numerous sites, although for convenience the radial pulse at the wrist is routinely used. Use the tips of the first and second fingers to palpate the pulse. The two advantages of this technique are that (1) the fingertips are quite sensitive, thereby enabling the pulse to be located easily and counted, and (2) the examiner’s own pulse may be erroneously counted if the thumb is used instead of the first and second fingers. Pulses are also easily palpated at the carotid, brachial, femoral, posterior tibial, and dorsalis pedis arteries. Palpate the pulse at the brachial artery to appreciate its contour and amplitude. Locate the pulse at the medial aspect of the elbow and note that it is more easily palpated when the elbow is held slightly flexed.52 Determine the pulse rate by counting for 1 minute, particularly if any abnormality is present. Common convention in the acute care setting is to count a regular pulse for 15 seconds and multiply the resulting number by 4 to determine the beats per minute.
In newborns, use direct heart auscultation and umbilical palpation as the methods of choice to determine the heart rate. Instantaneous changes in newborn heart rates are best indicated to the resuscitation team by the clinician tapping out each heartbeat.53 In unstable children, palpate the central arteries, particularly the femoral and brachial pulses, instead of the more peripheral arteries. In a comparison of four methods of determining the heart rate in infants, listening at the apex of the heart was found to be more accurate than palpation of the brachial, carotid, or femoral pulses.54 Of the sites for palpation of the heart rate, the femoral artery has proved most valuable, especially in hypotensive infants.55
Interpretation
Consider the individual’s physiology when interpreting the pulse. In infants and children, interpret the pulse rate with reference to age (See Table 1-1). Pulse varies with respiration: it increases with inspiration and slows with expiration. This is known as sinus dysrhythmia and is physiologic.
Although bradycardia is defined as a heart rate lower than 60 beats/min in adults, a well-conditioned athlete may have a normal resting heart rate of 30 to 40 beats/min.56,57 As discussed earlier, a redefinition of bradycardia to less than 45 beats/min and tachycardia to greater than 95 beats/min has been proposed based on a normal healthy population.24,58 Such definitions include 95% of the population and do not address any given individual’s normal baseline rate.
Heart Rhythm
In addition to determining the pulse rate, obtain information about the regularity of the pulse by palpation. An irregular pulse suggests atrial fibrillation or flutter with variable block, and accurate assessment of the pulse should be done by auscultation of the apical cardiac sounds. The apical pulse is frequently greater than the peripheral pulse because of inadequate filling time and stroke volume, with resultant nontransmitted beats. A greater pulse deficit generally reflects more severe disease.59
Pulse Amplitude and Contour
Accurate examination and description of pulse amplitude and contour can provide additional clinical information and aid in decision making. Superimposition of one pathophysiologic state on another may modify the pulse. For example, sepsis may result in variable pulse amplitudes, depending on the stage in the development of the disease at initial evaluation of the patient. Early in sepsis, cardiac output increases and vascular resistance decreases, which causes bounding pulses. In advanced sepsis or septic shock, falling cardiac output and increased vascular resistance are seen, and pulses are diminished.60 Definable age-related changes in pulse amplitude and contour can be identified. Such changes are due to an increase in arterial stiffness, which results in increased pulse wave velocity and progressively earlier wave reflection. This leads to increased pulse amplitude in the elderly at all commonly measured sites (carotid, femoral, and radial).60 In addition to these age-related changes, pulse wave analysis may be useful in determining arterial stiffness and the likelihood of atherosclerotic disease in a vascular laboratory setting.61 Weak pulses can be a significant finding in patients with hypotension if present globally or an indication of limb ischemia if isolated to one extremity. Bounding pulses can be seen with a widened pulse pressure, which is discussed later in the section on blood pressure. Routine measurement of pulse amplitude is not reproducible by simple palpation and requires instrumentation not available in EDs.
Pulses during Cardiopulmonary Resuscitation
Palpated “femoral pulses” during chest compression may represent either forward arterial blood flow or “to-and-fro” movement of blood from the right side of the heart to the venous system. A carotid pulse is preferred when assessing the adequacy of chest compressions during cardiopulmonary resuscitation (see Chapter 17).
Arterial Blood Pressure
Changes in arterial blood pressure over time may indicate success of treatment or worsening of the patient’s overall condition. An abrupt reduction in a patient’s arterial blood pressure usually indicates the need for immediate intervention or reconsideration of therapy. The current section discusses indirect blood pressure monitoring, and intraarterial techniques are considered elsewhere. Discussion of the specific use of the Doppler device for measurement of pulse and blood pressure and for measurement of orthostatic blood pressure and changes in pulse follow this section. Despite an association between the absence of hypotension and a radial pulse or between hypotension and the absence of both radial and femoral pulses, in the setting of trauma, the variability in individual response prohibits the use of this parameter as an absolute gauge of blood pressure.52
Physiology
Arterial blood pressure indicates the overall state of hemodynamic interaction between cardiac output and peripheral vascular resistance. Arterial blood pressure is the lateral pressure or force exerted by blood on the vessel wall. It indirectly measures perfusion, and blood flow equals the change in pressure divided by resistance. Because peripheral vascular resistance varies, a normal blood pressure does not confirm adequate perfusion.62 Mean arterial blood pressure (MAP) can be estimated by adding one third of the pulse pressure (i.e., the difference between systolic and diastolic blood pressure) to diastolic pressure or by using the following measure.63

Indications and Contraindications
Patients with minor ambulatory complaints unrelated to the cardiovascular system may not necessarily need their blood pressure measured in the ED, but those with hemodynamic instability need frequent monitoring of blood pressure. In children there is a significant amount of variability regarding standard situations that require measurement of blood pressure. In general, the younger the patient, the less likely blood pressure will be measured.64,65 In newborns, infants, and even toddlers, capillary refill is sometimes substituted for standard blood pressure measurement, although viewing these tests as equivalent can lead to significant errors.
In low-flow states, Doppler measurement of blood pressure may be obtained rapidly. Repeated measurements will provide an evaluation of the adequacy of resuscitation in patients whose blood pressure cannot be auscultated by standard techniques and in those in whom intraarterial blood pressure measurements are either contraindicated or technically unobtainable.66,67 Placing a catheter for direct intraarterial measurement of blood pressure has a higher risk for complications, but it may be performed safely in the ED. In particular, direct measurement of arterial pressure during pulseless electrical rhythms may help discriminate between severe shock and otherwise nonresuscitatable status.68 Alternative noninvasive devices for continuous blood pressure measurement (CBPM) have been introduced clinically, with varying success. One common method of CBPM uses finger cuffs equipped with infrared (IR) photoplethysmography and sophisticated technology for quantification of finger blood pressure levels. Finapres (Ohmeda, Madison, WI) was the first commercial product using this technique, and several newer products are on the market today. A number of commercial systems use an alternative method of arterial applanation tonometry to measure CBPM. Further study is needed for solid validation of devices using these techniques.69,70
Equipment
Cuff Type
The equipment required for indirect blood pressure measurement includes a sphygmomanometer (cuff with an inflatable bladder, inflating bulb, controlled exhaust for deflation, and manometer) and a stethoscope, Doppler device (for auscultation), or oscillometric device.71–74 A common practice in the prehospital and interhospital transport setting is to forego auscultatory blood pressure measurements with a stethoscope and instead obtain systolic values only by palpation of the first Korotkoff sound. This practice, though sometimes the only feasible method of obtaining any value in a noisy environment, poses a significant potential for error. In a study of critically ill patients transferred between hospitals, palpated systolic blood pressure values underestimated manometric values by nearly 30%.
According to the American Heart Association guidelines, the sphygmomanometer cuff should be an appropriate size for the patient to ensure an accurate reading. The width of the bladder should be at least 40% of the distance of the limb’s midpoint (i.e., from the acromion process to the lateral epicondyle). This published figure of the ideal width, when studied in a validation review, may be higher, up to approximately 50%.75 The length of the bladder should be 80% of the midarm circumference or twice the recommended width.66 Discrepancies in matching upper arm size with cuff size have been demonstrated to produce significant errors in critically ill populations when compared with invasive intraarterial blood pressure measurements.76 The availability of appropriately sized cuffs appears to be a pervasive problem, especially since about 80% of patients do not fit the standard 12-cm large cuffs.77 In one study, 90% of aneroid devices had only one size of cuff available.78 A second study phase from this group showed no marked improvement in agreement of oscillatory and invasive measurements despite correct cuff size.79
Manometers require annual servicing. Mercury columns may require the addition of mercury to bring the edge of the meniscus to the zero mark. The air vent or filter at the top of the mercury column should also be checked for clogging. An aneroid manometer should be calibrated against a mercury column at least yearly. If the aneroid indicator is not at zero at rest, the device should not be used.80 Digital manometers may not be validated for all patient groups and could give inaccurate readings.
Automatic sphygmomanometers may improve physiologic monitoring with their alarm and self-cycling capabilities. They offer indirect arterial blood pressure measurement with little pain and without the risks associated with invasive arterial lines.81 Accuracy of measurements does not suffer during rapid cycling, but the potential for vascular injury from nearly continuous arterial compression dictates that most automated blood pressure units will revert back to less frequent (i.e., every 15 to 20 minute) cycling as a safety precaution. Oscillometric blood pressure monitors detect motion of the blood pressure cuff transmitted from the underlying artery. A sudden increase in the amplitude of arterial oscillations occurs with systolic pressure and MAP, and an abrupt decrease occurs with diastolic pressure.82
In adult patients, numerous studies have focused on the reliability of auscultatory versus automated blood pressure measurements. Mercury column versus Dinamap readings showed increased disparity with systolic blood pressure greater than 140 mm Hg, the range at which accuracy should be most rigorously sought to correctly identify hypertension. In general, automated blood pressure devices yield higher systolic and lower diastolic blood pressure.83 The range of error in automated devices was, on average, 4.0 to 8.6 mm Hg.84,85 Unfortunately, these studies represent populations without critical illness and do not reflect the accuracy of readings at the extremes of hypertension and hypotension, thus making generalization to an ED population difficult.85,86
Procedure
Obtain indirect blood pressure measurements at the patient’s bedside by palpation, auscultation, Doppler, or oscillometric methods. The technique is straightforward and accurate when the equipment is well maintained, calibrated, and used by clinicians who follow accepted standards. The patient may be lying or sitting, as long as the site of measurement is at the level of the right atrium and the arm is supported.66,74 Unless the arm is kept perpendicular to the body with the elbow resting on a desk, measurements will be 9 to 14 mm Hg higher, regardless of body position.75,87 Allowing the arm to be parallel to the body when supine but supporting the arm perpendicular to the body when measuring blood pressure may create a pseudo-drop in blood pressure. These changes are thought to be dependent on the mechanical properties of the arteries themselves and not associated with hydrostatic pressure alone.88
To palpate arterial blood pressure, inflate the cuff to 30 mm Hg above the level at which the palpable pulse disappears. Once properly inflated, palpate directly over the artery and deflate the cuff at a rate of 2 to 3 mm Hg/sec. Report the initial appearance of arterial pulsations as the palpable blood pressure. This practice, known as the Riva-Rocci palpatory technique, has shown mixed results in yielding accurate estimations of blood pressure. One study determined that the average underestimation of systolic blood pressure was 6 mm Hg.89 Another operative study looking at the combination of palpated systolic blood pressure and observed visual return of continuous pulse oximetry reported an underestimation of 10 to 20 mm Hg.85 The same technique is used with the Doppler device, but the palpated pulse is replaced with the Doppler auditory signal. Measurement of arterial pressure by palpation and Doppler yields only estimates of systolic blood pressure. The Doppler method is preferred when determining blood pressure in infants.86
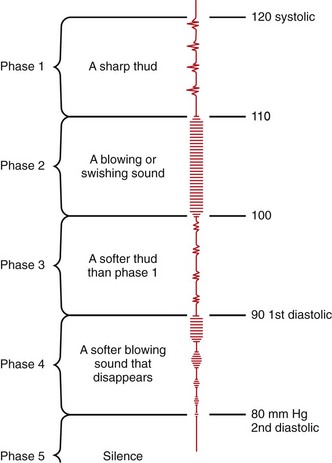
When auscultating blood pressure at the brachial artery, apply the blood pressure cuff about 2.5 cm above the antecubital fossa with the center of the bladder over the artery.74 Apply the bell of the stethoscope directly over the brachial artery with as little pressure as possible.90 Systolic arterial blood pressure is defined as the first appearance of faint, clear, tapping sounds that gradually increase in intensity (Korotkoff phase I). Diastolic blood pressure is defined as the point at which the sounds disappear (Korotkoff phase V).74–91 In children, phase IV defines diastolic blood pressure (Fig. 1-2).7 Phase IV is marked by a distinct, abrupt muffling of sound when a soft, blowing quality is heard.
It is best to measure by auscultation over the brachial artery because of accepted standardization of the measured values. Alternative sites include the radial, popliteal, posterior tibial, or dorsalis pedis arteries, although any fully compressible extremity artery may be used. Studies evaluating direct and indirect blood pressure measurements have demonstrated good correlation between these methods.92,93
It may not be feasible to obtain upper extremity blood pressure measurements because of patient access issues, particularly those encountered in the prehospital setting. Forearm measurements may be obtained more easily and show fair correlation to standard upper extremity values (within 20 mm Hg in 86% of systolic measurements and 94% of diastolic measurements).94 Alternatively, noninvasive finger blood pressure measurements have shown promise when compared with standard upper extremity readings. The overall discrepancy in an ED study was 0.1 mm Hg with a standard deviation of ±5.02 mm Hg when comparing finger blood pressure and invasive MAP via radial artery cannulation.95
Novel noninvasive continuous finger cuff technology offers the benefit of uninterrupted monitoring and has the advantage over invasive techniques of being safer and immediately available. Noninvasive finger cuff measurements have shown reasonable correlation, even in critically ill populations in the ED.70 Wrist blood pressure has shown to have good average accuracy in the surgical environment when compared with oscillometric devices. Patient comfort is reported to be greater with these devices. The typically stated contraindications to the acquisition of upper arm blood pressure (limitation after mastectomy, etc.) may not apply.96
The accuracy of the palpatory, Doppler, and oscillometric methods has also been investigated.97–99 When phase I and V Korotkoff sounds are used, indirect methods typically underestimate systolic and diastolic pressure by several millimeters of mercury.97–100 During shock, the palpatory and auscultatory methods underestimate simultaneous direct arterial pressure measurements.101 The flush method, in which return of color after deflation of the cuff is used to estimate blood pressure in infants, may underestimate systolic blood pressure by up to 40 mm Hg.102 This method is unreliable and not recommended.
Complications
Complications of indirect blood pressure measurements are minimal when the proper procedure is followed. Inadvertent prolonged application of an inflated blood pressure cuff may result in falsely elevated diastolic pressure and ischemia distal to the site of application.76 Invasive blood pressure monitoring is associated with a number of potential problems (see Chapter 20).
Interpretation
Normal blood pressure increases with decreasing distance from the heart and aorta. Blood pressure tends to increase with age and is generally higher in males. Individual factors that influence blood pressure include body posture, emotional or painful stimuli, environmental influences, vasoactive foods or medications, and the state of muscular and cerebral activity. Exercise and sustained isometric muscular contraction increase blood pressure in proportion to the strength of the contraction. A normal diurnal pattern of blood pressure consists of an increase throughout the day with a significant, rapid decline during early, deep sleep.103
Normal lower limits of systolic blood pressure in infants and children can be estimated by adding 2 times the age (in years) to 70 mm Hg. The 50th percentile for a child’s systolic arterial blood pressure from 1 to 10 years of age can be estimated by adding 2 times the age (in years) to 90 mm Hg. Children older than 2 years are considered hypotensive when systolic blood pressure is less than 80 mm Hg.104 Children are able to maintain MAP until very late during shock.105 The finding of a normal blood pressure in a child with signs of poor perfusion should not dissuade the clinician from appropriate treatment. Most adults are considered hypotensive if systolic blood pressure is lower than 90 mm Hg, but some individuals normally exhibit a systolic pressure in that range. In the elderly, the presence of normotension within defined or published limits may not be reassuring. When considering systolic blood pressure cutoffs for trauma patients, 85 mm Hg for patients aged 18 to 35, 96 mm Hg for patients aged 36 to 64, and 117 mm Hg for those older than 65 have been proposed as new standards for hypotension.20 When accompanied by signs of shock, immediate treatment is indicated. In patients with shock, blood flow cannot be reliably inferred from heart rate and blood pressure values.106,107
Hypertension
Adults are hypertensive if either systolic or diastolic pressure consistently exceeds 140 or 90 mm Hg, respectively.108,109 A meta-analysis showed strong correlation of blood pressure to vascular and overall mortality down to at least 115/75.110 Some authors have suggested altering the blood pressure definitions to include an “optimal” blood pressure of 115/75.15 Other authors have suggested incorporating blood pressure into a global cardiovascular risk assessment that includes other associated risk factors.16,17 The applicability of population norms for hypertension in a stressful emergency situation is controversial. One should not make diagnostic or therapeutic decisions based solely on an abnormal initial measurement. Patients with hypertension require repeated measurements to assess whether therapy is required in the ED. Because sustained hypertension may be seen in more than a third of initially hypertensive ED patients, careful evaluation and follow-up are required.111 The phenomenon of white coat hypertension (WCH) is defined as a persistent elevation in blood pressure in the clinical setting only. The prevalence of WCH is between 20% and 94%, depending on the frequency of reassessment of the clinical setting.112 It is unclear whether patients who have isolated hypertension in the clinical setting (WCH) are at increased risk for the development of hypertension and subsequent end-organ damage.113
Measurement Errors
Erroneous blood pressure measurements may result from several factors.114 Falsely low blood pressure may be caused by using an overly wide cuff, by placing excessive pressure on the head of the stethoscope, or by rapid cuff deflation.115,116 Falsely high blood pressure may be caused by the use of an overly narrow cuff, anxiety, pain, tobacco use, exertion, an unsupported arm, or slow inflation of the cuff.117 There appears to be a statistically significant difference in the error rate associated with patients weighing more than 95 kg, whether from obesity or as a result of muscular upper arms from body building.118,119
Of note, 41% of adults observed at the University of Pittsburgh required non–standard-sized cuffs, and the use of small cuffs was associated with a mean error of 8.5 and 4.6 mm Hg in systolic and diastolic pressure, respectively.116 Other studies have confirmed relatively high rates of inappropriately diagnosed hypertension in obese patients based on erroneous cuff size.118 Other specific study populations in this area have been critically ill patients, in whom disparate cuff size can lead to significant inaccuracies based on arm circumference.82
Hypotensive patients have unreliable Korotkoff sounds, but Doppler measurements are well correlated with direct arterial systolic pressure measurements in hypotensive patients.120 An auscultatory gap can be appreciated in hypertensive patients and may mislead the clinician. It is heard during the latter part of phase I and should not be confused with diastolic readings. Auscultation until the manometer reading approaches zero should prevent misinterpretation. In patients with aortic insufficiency or hyperthyroidism, in those who have just finished exercising, and in children younger than 5 years, measurement of diastolic blood pressure should occur at Korotkoff phase IV. Extremes of blood pressure, both hypotension and hypertension, have been found to be factors contributing to measurement errors in critically ill pediatric patients. Predictably falsely high readings for noninvasive versus invasive measurements have been obtained in hypotensive patients and falsely low values in hypertensive states.121
Hemiplegic patients may exhibit different blood pressure in the affected and unaffected arms.122 A flaccid extremity tends to yield lower systolic and diastolic pressure, whereas a spastic extremity tends to yield higher values than the extremity with normal motor tone. Although these differences are generally small, it is preferable to monitor blood pressure in the unaffected limb.
Numerous errors may occur in the accurate measurement of blood pressure. The only way to combat them is to first be cognizant of practices contributing to them. Unfortunately, few nurses can identify causes of potentially erroneous readings. In a study examining nurses’ ability to obtain accurate readings, proper technique in determining systolic blood pressure could be identified 61% of the time; diastolic blood pressure, 71% of the time; and an auscultatory gap, 54% of the time. Nurses were able to correctly identify faulty equipment 58% of the time, assess cuff size 57% of the time, determine appropriate inflation pressure 29% of the time, note the appropriate deflation rate 62% of the time, and determine correct arm positioning 14% of the time.123
With the increasing number of patients with heart failure, those receiving bridging measures to transplantation, or those treated with long-term circulatory augmentation devices in the form of left ventricular assist devices (LVADs), it useful to understand the difficulty in interpreting blood pressure measurements in these patients. All types of VADs fit into two categories: (1) pulsatile and (2) nonpulsatile. Pulse and blood pressure readings in patients with pulsatile VADs (Thoratec, HeartMate IP and VE, Novacor) are comparable to values in the general non-VAD population. Nonpulsatile VADs (Levitronix Centri Mag, Tandem Heart, Impella, DeBakey LVAD, HeartMateII) function by either centrifugal or axial blood flow, and this has a significant impact on the ability to detect pulses.124 Typically, these patients appear to be perfusing well with adequate skin warmth and capillary refill even though pulses may be absent. Blood pressure readings can be obtained with these nonpulsatile flow devices, but diastolic blood pressure, pulse pressure values, and MAP vary significantly depending on the speed of the pump.125
Differential Brachial Artery Pressure
The presence of a systolic blood pressure differences of 10 to 20 mm Hg between the arms suggests a normal condition. If greater, it may indicate advanced focal atherosclerosis, coarctation of the aorta proximal to the left subclavian artery, type A aortic dissection, aortic arch syndromes, or other vascular processes preferentially affecting one extremity. The utility of upper extremity bilateral blood pressure measurements has recently come into question. One study found a 10-mm Hg systolic or diastolic difference in 53% of patients in the emergency setting and a 20-mm Hg or higher difference in 19% of patients.126 Although these numbers have not generally been found to be of this magnitude in metaanalysis,127 the unique setting of the study in the ED makes correlation particularly salient for the emergency physician. The reliability of peripheral pulse deficits in diagnosing or excluding type A aortic dissection is a frequently cited reason for evaluating blood pressure in both arms. In a metaanalysis, Teece and Hogg noted that the absence of a clinical pulse deficit to exclude thoracic dissection in patients with chest pain was just 31%, and the authors concluded that peripheral pulse deficits are far too insensitive to warrant their use as a means of excluding thoracic aortic dissection in patients with chest pain.128 Given that many in the general population have significant differences in blood pressure in each arm, the diagnostic value of this frequently cited indication for obtaining bilateral brachial blood pressure is unproven. Essentially, most patients with a type A aortic dissection will not have a measurable blood pressure discrepancy between the arms, and most of those who do have such a finding will not have dissection.
Brachial pressure differences did not appear to be linked to age, gender, race, MAP, cardiovascular risk, or final discharge diagnosis. Smaller interarm differences have been reported in the ED setting (18% in hypertensive patients and 15% in normotensive patients when a cutoff greater than 10 mm Hg was used).18,19 Though not tested, a method proposed to minimize these differences in the ED is to take simultaneous blood pressure readings from both the left and right extremities with two calibrated automated blood pressure units.129
Pulsus Paradoxus
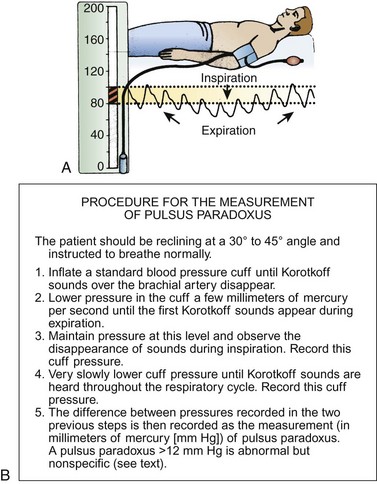
Normal respiration briefly decreases systolic blood pressure by approximately 10 mm Hg during inspiration. Pulsus paradoxus occurs when there is greater a than 12–mm Hg decrease in systolic blood pressure during inspiration. Pulsus paradoxus may occur in patients with chronic obstructive pulmonary disease, pneumothorax, severe asthma, or pericardial tamponade.101
To measure a paradoxical pulse, have the patient lie comfortably in the supine position at a 30- to 45-degree angle and breathing normally in an unlabored fashion (which are unusual conditions in a patient suspected of having cardiac tamponade, severe asthma, chronic obstructive pulmonary disease, or pneumothorax).130 Inflate the blood pressure cuff well above systolic pressure and slowly deflate it until the systolic sounds that are synchronous with expiration are first heard (Fig. 1-3). Initially, the arterial pulse will be heard only during expiration and will disappear during inspiration. Deflate the cuff further until arterial sounds are heard throughout the respiratory cycle. Palpation at the radial or femoral arteries may yield complete disappearance during inspiration. When present, this technique is a quick bedside confirmation of the possibility of severe tamponade.
An alternative method for determination of pulsus paradoxus is by visually observing loss of the pulse oximetry waveform and then its reappearance.131 The plethysmographic method has been validated in intensive care unit settings.
If the difference between inspiratory and expiratory pressure is greater than 12 mm Hg, the paradoxical pulse is abnormally wide.130,131 Most patients with proven tamponade have a difference of 20 to 30 mm Hg or greater during the respiratory cycle.130–132 This may not be true of patients with very narrow pulse pressures (typical of advanced tamponade), who have a “deceptively small” paradoxical pulse of 5 to 15 mm Hg.132–134
Pulsus paradoxus has been correlated with the amount of impairment of cardiac output by tamponade. In an uninjured patient with pericardial effusion, a pulsus paradoxus greater than 25 mm Hg (in the absence of relative hypotension) is both sensitive and specific for moderate or severe versus mild tamponade.130,135 An echocardiographic study found that an abnormal pulsus paradoxus had a sensitivity of 79%, a specificity of 40%, a positive predictive value of 81%, and a negative predictive value of 40% for right ventricular diastolic collapse.135–137 The absence of a paradoxical pulse does not rule out tamponade.
In the pediatric population, pulsus paradoxus has been studied to determine the severity of obstructive and restrictive pulmonary disease,136 most commonly asthma. A value of 15 mm Hg or greater correlates well with the clinical score, peak expiratory value, flow rate, oxygen saturation, and subsequent need for admission.137
Despite the disease entities that a widened pulsus paradoxus may suggest, it is a difficult test to perform adequately with only a sphygmomanometer. Because it is a useful clinical tool, new aids should be developed and used to reliably predict this important vital sign.138
Shock Index
The ratio of pulse rate to systolic blood pressure has been suggested as a measure of clinical shock. The shock index (SI) has a normal range of 0.5 to 0.7. Although calculating the SI is not standard of care in the ED, a number of clinical scenarios have been studied in which the SI can be used as a predictor of severe illness or injury. An SI above 0.85 to 0.90 suggests acute illness in medical patients and a marked increase in the potential for gross hemodynamic instability in trauma patients.139–142 The SI has been studied for use in a variety of clinical scenarios from severe pneumonia to first-trimester risk for ectopic pregnancy to sepsis. It has been found to be a valid gauge of the severity of illness.143–145 Some studies, however, have found that the initial pulse rate alone had nearly the same predictive power as the SI for the severity of illness. Although the SI appears to correlate with the left ventricular stroke work index, it has little correlation with systemic oxygen transport in patients with hemorrhagic and septic shock.146
Doppler Ultrasound for Evaluation of Pulse and Blood Pressure
Indications and Contraindications
Doppler ultrasound is commonly used in the ED for the measurement of blood pressure in low-flow states, evaluation of lower extremity peripheral perfusion, and assessment of fetal heart sounds after the first trimester of pregnancy. Doppler’s sensitivity allows detection of systolic blood pressure down to 30 mm Hg in the evaluation of a patient in shock. In a patient with peripheral vascular disease in whom there is concern about the adequacy of peripheral perfusion, the ankle-brachial index provides a rapid, reproducible, and standardized assessment.145 Fetal heart sounds provide a baseline assessment of any pregnant patient with 12 weeks’ gestation or longer in the setting of abdominal trauma or fetal distress as a result of a complication of pregnancy. The use of Doppler ultrasound for the evaluation of deep venous thrombosis is a valuable tool, but specific training and experience are required to attain proficiency. Discussion of this topic is beyond the scope of this chapter.
Procedure
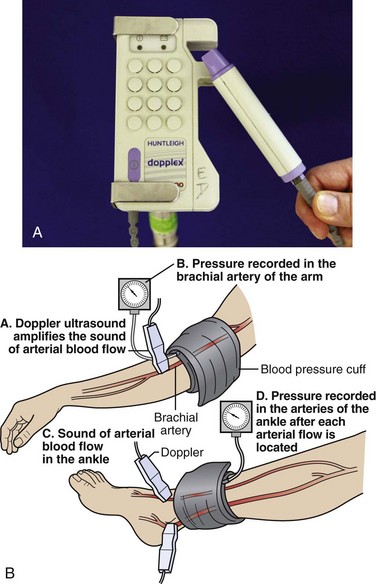
In the evaluation of peripheral vascular disease, one may determine the ankle-brachial index. It is standard for this procedure to be performed in a formal vascular laboratory. However, an approximation of pressures can be determined in the ED (Fig. 1-4). Usually, only the ankle-brachial index is considered for ED purposes. Examine both brachial arteries at the medial aspect of the antecubital fossa. Angle the probe until the most satisfactory signal is obtained. Inflate the cuff and slowly deflate it until the systolic pulse is heard. Repeat the procedure for the posterior tibial and dorsalis pedis arteries of both lower extremities. This procedure may be done with oscillometric devices but lacks sensitivity in identifying disease.146
Interpretation
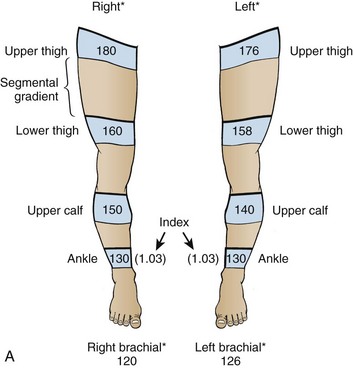
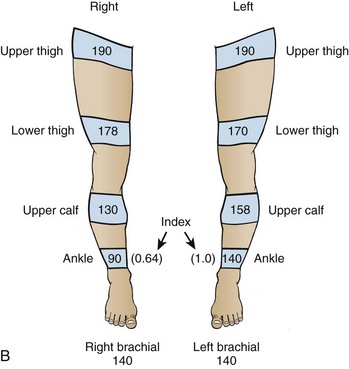
As noted earlier, in low-flow states, Doppler ultrasound can detect blood pressure as low as 30 mm Hg. Calculate the ankle-brachial index of each limb by dividing the higher systolic pressure of the posterior tibial or the dorsalis pedis artery of the limb by the higher of the systolic pressures in the brachial arteries. In normal individuals the index should be greater than 1.0 (Fig. 1-5). Patients with claudication have values between 0.6 and 0.8. Values lower than 0.5 indicate severe impairment and are consistent with rest pain or gangrene.147 When the lower extremity has been amputated or injured, brachial-brachial indices can be used (i.e., comparison of systolic blood pressure in the injured or diseased upper extremity with the other extremity). Patients with ankle-brachial index values of 0.9 or lower have increased cardiovascular morbidity and mortality.148 One study of 323 penetrating extremity wounds found that an ankle-brachial index (or brachial-brachial index) lower than 0.9 was 72.5% sensitive and 100% specific for vascular injuries.149 Segmental lower extremity pressure measurements may help identify the level of the obstruction (Table 1-4).150 Obese patients, diabetic patients, or those with calcified vessels that are not compressible may have abnormally high systolic pressure (e.g., 250 to 300 mm Hg) and indices that do not accurately reflect flow. Normal fetal heart tones should be between 120 and 140 beats/min. Fetal heart tones may be heard as early as the 12th week of gestation.
TABLE 1-4
Use of Segmental Lower Extremity Pressure to Identify the Level of Obstruction
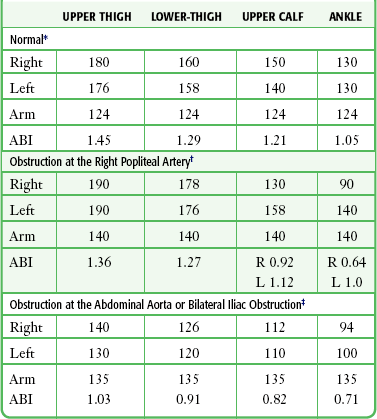
*Typical pressures in a normal subject. The findings, based on resting pressures, show no evidence of occlusive disease of the large or medium-sized arteries. Normal findings are as follows: (1) ABI of 1.0 or higher, (2) all segmental pressure gradients lower than 30 mm Hg, and (3) upper thigh pressure at least 40 mm Hg above brachial pressure.
†Typical pressures in a patient with obstruction of the right popliteal or tibial arteries. Significant findings are as follows: (1) ABI less than 0.9 in the right leg, (2) abnormally high gradient from the ankle to below the knee and again from below to above the knee in the right leg, and (3) upper thigh pressure 50 mm Hg higher than brachial pressure, consistent with normal flow at the aorta-iliac level. The findings are suggestive of right popliteal occlusion or right anterior and posterior tibial occlusion, or both.
‡Typical pressures in a patient with obstruction of the abdominal aorta or bilateral iliac obstruction. Significant findings are as follows: (1) ABI of less than 0.9 in both legs, (2) all segmental gradients lower than 30 mm Hg, and (3) both upper thigh pressures relatively low with respect to brachial pressure. The findings are suggestive of severe aortoiliac occlusive disease.
Vital Sign Determination of Volume Status
Many techniques have been advocated to assess volume status. Unfortunately, most procedures lack a database against which to judge their reliability. Recommended methods include evaluation of skin color; skin turgor; skin temperature; supine, serial, and orthostatic vital signs; neck vein status; transcutaneous oximetry; and hemodynamic monitoring (e.g., monitoring of central venous pressure). Serial vital sign measurements have been used for assessing blood loss, but they do not reliably detect small degrees of blood loss.147,151,152 Up to 15% of the total blood volume can be lost with minimal hemodynamic changes or any alteration in supine vital signs.153 A decrease in pulse pressure occurs with acute blood loss,154 but the patient’s baseline blood pressure values are often unknown. Clinical examination of neck veins adds useful information but is less precise than measurement of central venous pressure. Most clinicians use skin color, temperature, and moisture as a reflection of skin perfusion and sympathetic tone. This is not an accurate guide to circulatory volume because the vasomotor tone of the skin is affected by numerous diseases, as well as by emotional and environmental factors. Capillary refill has been advocated as a noninvasive test for hypovolemia, but it has been found to be inaccurate in adults (see the following discussion regarding its use in children).155 The ideal test for determining volume status would rapidly and accurately detect 5% or greater depletion of volume with a noninvasive technique. At present, no such test exists.
Orthostatic Vital Signs Measurement
Although orthostatic testing is commonly cited as a method to detect hypovolemia, it is frequently misleading and has less clinical value than often touted. The medical literature is inconsistent regarding values representative of a positive or negative orthostatic test, and its value for estimating volume status is probably overstated. In patients with an acute loss of less than 20% of total blood volume, orthostatic vital signs have been shown to lack both sensitivity and specificity.156
Physiologic Response to Hypovolemia
Acute blood loss or severe hypovolemia related to dehydration decreases venous return.157 This can be seen with acute blood loss (usually greater than 20% of blood volume), severe burns, or prolonged vomiting or diarrhea that depletes body fluids. As a result, cardiac output falls and clinical manifestations of shock ensue. Several compensatory mechanisms are initiated by acute hypovolemia (Box 1-1). The dominant compensatory mechanism in shock is a reduction in carotid sinus baroreceptor inhibition of sympathetic outflow to the cardiovascular system. This increased sympathetic outflow results in several effects: (1) arteriolar vasoconstriction, which greatly increases peripheral vascular resistance; (2) constriction of venous capacitance vessels, which increases venous return to the heart; and (3) an increase in the heart rate and force of contraction, which helps maintain cardiac output despite significant loss of volume.153
The value of sympathetic reflex compensation is illustrated by the fact that 30% to 40% of blood volume can be lost before death occurs. When sympathetic reflexes are absent, loss of only 15% to 20% of blood volume may cause death.158 Increased sympathetic nerve activity results in the commonly recognized physical signs of shock, including pallor, cool clammy skin, rapid heart rate, muscle weakness, and venous constriction. An inadequate immediate compensatory response will result in dizziness, altered mental status, or loss of consciousness.159 The central nervous system response to ischemia further stimulates the sympathetic nervous system after arterial pressure falls below 50 mm Hg.128 Subsequent compensatory mechanisms that work to restore blood volume to a normal level include the release of angiotensin and antidiuretic hormone (vasopressin). This causes arteriolar vasoconstriction, conservation of salt and water by the kidneys, and a shift in fluid from the interstitium to the intravascular space.159
Several investigators have examined the changes in blood pressure and pulse that occur in supine patients with blood loss.153,154,160 Collectively, these studies have shown variable individual hemodynamic responses to acute blood loss of up to 1 L. The frequent inability to detect significant loss of volume with supine vital signs and the observation that syncope frequently develops in patients with acute volume loss on rising led to investigation of the use of orthostatic vital signs to detect occult hypovolemia.
Physiologic Response to Changes in Posture
When an individual assumes the upright posture, complex homeostatic mechanisms compensate for the effects of gravity on the circulation to maintain cerebral perfusion with minimal change in vital signs. These responses include (1) baroreceptor-mediated arteriolar vasoconstriction, (2) venous constriction and increased muscle tone in the legs and the abdomen to augment venous return, (3) sympathetic-mediated inotropic and chronotropic effects on the heart, and (4) activation of the renin-angiotensin-aldosterone system.159 These compensatory mechanisms preserve cerebral perfusion in the upright position with minimal changes in vital signs. When a normal subject stands, the pulse increases by an average of 13 beats/min, systolic blood pressure falls slightly or does not change, and diastolic pressure rises slightly or does not change.160 In patients with vasodepressor syncope, the normal compensatory reflexes that preserve cerebral perfusion with changes in posture are altered. The normally increased sympathetic tone on standing is paradoxically inhibited, and an exaggerated enhancement of parasympathetic activity (bradycardia) occurs and can lead to syncope.154
Few data exist regarding the true effect of acute blood loss on postural vital signs, and this parameter varies greatly among individuals experiencing hypovolemia. One study of 23 young adult volunteers from whom 500 to 1200 mL of blood was withdrawn found no reliable change in postural blood pressure, but a consistent postural increase in pulse of 35% to 40% was noted after 500-mL blood loss.161 Of the six subjects from whom approximately 1000 mL of blood was withdrawn, only two were able to tolerate standing, and each had a postural increase in pulse of greater than 30 beats/min. The other four subjects experienced severe symptoms on standing, followed by marked bradycardia and syncope if they were not allowed to lie down.
Following phlebotomy of 450 to 1000 mL of blood from healthy volunteers, the criterion of an increase in pulse of 30 beats/min or the presence of severe symptoms (syncope or near-syncope) during a supine-to-standing test accurately distinguished between 1000-mL blood loss and no blood loss. The sensitivity and specificity of using the aforementioned criteria for detecting 1000-mL blood loss (Box 1-2) were both 98%, for an accuracy of 96% (2% false-negative results and 2% false-positive results). The investigators were unable to consistently detect blood loss of 500 mL with these criteria, though.162 In a similar study, the change in heart rate with postural changes after 500-mL phlebotomy was more discriminatory for blood loss than were changes in blood pressure or a change in the bioimpedance-based stroke index. Of note, these authors found that a change in heart rate of 30 beats/min or greater was 13.2% sensitive and 99.5% specific for 500-mL blood loss and that a change in heart rate of 20 beats/min or greater was 44.7% sensitive and 95.4% specific. The finding of a significant rise in pulse, though insensitive for 500-mL blood loss, was relatively specific in these healthy adult blood donors.161 In the most recent meta-analysis of orthostatic vital signs, the authors concluded that a large postural pulse change (>30 beats/min) or severe postural dizziness precluding the completion of vital sign measurements is required to clinically diagnose hypovolemia secondary to acute blood loss. The analysis demonstrated that orthostatic vital signs are often absent after moderate amounts of blood loss, thus significantly limiting the test’s sensitivity (22%) in this scenario.162 A consensus statement defined orthostatic hypotension as a reduction in systolic blood pressure of at least 20 mm Hg or a reduction in diastolic blood pressure of at least 10 mm Hg within 3 minutes of standing but appropriately reinforces that this is a physical finding rather than a disease process.159
Variables Affecting Orthostatic Vital Signs
Many conditions affect the compensatory mechanisms that allow patients to assume the upright posture (Box 1-3).158 Most of the conditions that affect postural blood pressure regulation involve a pathologic condition that affects the sympathetic nervous system. Orthostatic hypotension caused by autonomic insufficiency is not usually accompanied by tachycardia, but the orthostatic hypotension produced by acute volume depletion is commonly accompanied by a pronounced reflex tachycardia. Even in normal subjects, passive tilting generates a high incidence of orthostatic syncope.163
Because of decreased vasomotor tone, limited chronotropic response, and other factors, the elderly have a higher incidence of orthostatic hypotension leading to syncope and fall-related injuries.164 Carotid sinus hypersensitivity may play a greater role than orthostasis in geriatric syncope.165 Note that drugs that antagonize the normal autonomic compensatory mechanisms can also produce orthostatic changes. These changes can be severe enough to produce frank syncope, especially in the elderly. A study of patients with syncope seen in an ED found that orthostatic hypotension was considered to be the cause of the syncope in 24% and that the largest proportion of these cases were drug related. Patients with orthostatic hypotension as the cause of syncope were older, had more comorbid conditions, and were found to be more frequently taking antihypertensive medications.166 Advanced patient age is an independent risk factor for orthostatic blood pressure changes but does not appear to have a direct correlation to the presence of chronic cardiovascular disease, disability, or body mass index.167
Patients with hypertension may also have abnormal vasomotor responses to tilt testing and demonstrate more instability.168 Chronic anemia patients, who exhibit compensated blood volume, seem to have the same postural response as normal subjects do.169 Ethanol ingestion exaggerates postural pulse changes and mimics the hemodynamic changes seen with acute blood loss.170
The utility of orthostatic vital signs in children has been questioned. Healthy adolescents had changes in heart rate of 21.5 ± 21.2 beats/min and variable changes in systolic blood pressure (+19 to −17 mm Hg) after 2 minutes of standing.171 A study comparing mildly dehydrated children with normal children found a significant difference in the orthostatic rise in pulse, but no difference in orthostatic blood pressure. The investigators concluded that an orthostatic increase in pulse of greater than 25 beats/min constitutes a positive tilt test and less than 20 beats/min constitutes a negative test (sensitivity of 75%, specificity of 95%, and predictive value of 92% when using near-syncope or an increase in heart rate greater than 25 beats/min).172
Another complicating factor in interpreting orthostatic vital signs is the development of paradoxical bradycardia in the presence of blood loss. Bradycardia in the face of hemorrhage has generally been considered a preterminal finding of irreversible shock, but bradycardia has been documented in hypovolemic, yet conscious trauma patients as well. It has been reported that when orthostatic syncope occurs, it is accompanied by hypotension and often bradycardia.149,151 Many central nervous system factors can contribute to vagally mediated syncope in ED patients with acute traumatic blood loss, including pain, the sight of blood, anxiety, and nausea. This paradoxical bradycardia may be more frequently associated with rapid and massive bleeding. Patients with more gradual blood loss tend to have a more typical tachycardic response. When the patient’s clinical findings are consistent with loss of volume or shock, the clinician should not allow the absence of tachycardia to change the assessment.
Indications and Contraindications
When the volume status of a patient is assessed with use of orthostatic vital signs, several points should be remembered. Many factors influence orthostatic blood pressure, including age, preexisting medical conditions, medications, and autonomic dysfunction (see Box 1-3). Data relating the effect of blood loss to orthostatic vital signs are limited to phlebotomized healthy volunteers. Great care must be used when extrapolating these data to patients with anemia, dehydration, or painful trauma. The clinician must consider the patient’s clinical condition coupled with the orthostatic vital signs when evaluating a patient for volume depletion.
Orthostatic vital signs are often used to assess a patient’s response to therapy. In patients receiving intravenous rehydration therapy, serial orthostatic vital signs are widely used to judge the end point of therapy before release. In one study, individual orthostatic vital sign response to saline infusion in women with hyperemesis gravidarum was associated with other measures of rehydration, including weight gain and decreased urine specific gravity.173 Although the individual improvement in orthostatic vital signs in response to rehydration was of clinical value, the initial orthostatic vital signs were considered insufficient as the sole indicator of clinical dehydration in this population.
Technique
To obtain orthostatic vital signs, record the blood pressure and pulse after the patient has been in the supine position for 2 to 3 minutes (see Box 1-2). Allow the patient to rest quietly and do not perform any painful or invasive procedures during the test.
Next, ask the patient to stand and be prepared to assist if severe symptoms or syncope develop. A supine-to-standing test is more accurate than a supine-to-sitting one. If severe symptoms develop on standing, defined as syncope or extreme dizziness requiring the patient to lie down, the test is considered positive and should be terminated. If not symptomatic, allow the patient to stand for 1 minute and then record the blood pressure and pulse. A 1-minute interval resulted in the greatest difference between control and 1000-mL phlebotomy groups in one study.162
A number of studies have been conducted on normotensive, normovolemic patients to assess end points for orthostatic vital sign parameters. Such studies have included sitting-to-standing methods and varying rates of postural changes,174 including lying times of 5 to 10 minutes and standing times of 0 to 2 minutes.175 Arm position may affect postural changes in blood pressure and should be held constant to accurately assess orthostatic change.176 Complications include syncope with resulting falls and injuries.
Interpretation
The most sensitive criteria for orthostasis is tachycardia or symptoms of cerebral hypoperfusion (e.g., near-syncope). Although changes in blood pressure may be seen, they are too variable to be an indicator of loss of blood volume. Specific population-based thresholds for changes in pulse rate and blood pressure have some value in identifying patients at high risk for significant loss of blood volume, but great individual variability limits the use of this technique as a screening test. That is, a loss of 500 mL, and occasionally more, may be associated with a negative orthostatic vital sign assessment.165,177 The use of serial measurements to ascertain the response to therapy of patients considered to be at risk for loss of volume appears to have clinical utility.178
In the setting of suspected blood loss, if the patient has a rise in pulse of 30 beats/min or manifests severe symptoms and other complicating factors have been excluded, blood loss is highly likely (2% false-positive rate). The presence of a negative test indicates only that acute blood loss of 1000 mL is unlikely (2% false-negative rate) and that blood loss of 500 mL cannot be excluded (43% to 87% false-negative rate).162,165–177,179 Orthostatic changes in the shock index were no more sensitive than established tilt test criteria in discriminating normal individuals from those with moderate acute blood loss (450 mL).178
Criteria for significant orthostatic changes in blood pressure cannot be definitively set for the following reasons: (1) large variability in postural blood pressure has been found in the adult ED population180–185; (2) the results of studies using passive tilt tables cannot be extrapolated to the bedside use of orthostatic vital signs; (3) studies using healthy patients with acute blood loss may not reflect the orthostatic changes seen in the elderly or those with chronic bleeding, dehydration, and other medical problems; and (4) many studies of orthostatic changes never used a criterion standard in their determinations.
Capillary Refill
The capillary refill test is a measurement of the interval of time from the release of nail bed or soft tissue pressure sufficient to blanch the nail bed or superficial soft tissue until the return to normal coloration. Delayed capillary refill is an indication of reduced skin turgor, often as a result of volume depletion or limited perfusion. Measurement of capillary refill time (CRT) appears to be somewhat accurate in children, but its accuracy in assessing dehydration and reduced perfusion in adults is highly suspect.158,159,161–181 Skin elasticity is the characteristic that allows skin to spring back to its original shape after it has been deformed, and the speed of refilling the capillary bed after compression is responsible for the return of color to the skin.
Procedure
The preferred sites for determining CRT are the nail bed, the thenar surface of the palm, and the heel. Alternative sites may have different CRTs, and the current standards are best developed for capillary refill determined at the nail bed.186 Regardless of the site chosen, position the extremity at about the level of the right atrium. The minimum pressure necessary to produce blanching yields the most reproducible values. Release the nail bed and begin timing with a stopwatch or simply by counting out “one-thousand-one, one-thousand-two” for an approximation of the interval. Stop the clock when the nail bed becomes pink again. Interobserver reliability has been shown to be moderate, with kappa values less of than 0.5 in the evaluation of both adults and children.182,183
Interpretation
The normal CRT increases with age and is slightly longer in female patients. It is further increased by degrees of dehydration or hypoperfusion. Hypothermia, hyponatremia, congestive heart failure, malnutrition, and edema all increase CRT. Environmental conditions such as ambient air temperature can falsely alter capillary refill.182 Fever alone did not appear to prolong or shorten CRT in children,183 but a study of healthy adults found a 5% decrease in CRT for each degree Celsius rise in patient temperature.187,188
The main difficulty in interpreting CRT is that normal values in healthy patients fall into a wide range. In 30 normal infants 2 to 24 months of age, mean CRT was 0.8 ± 0.3 second. Measurements obtained from the nail bed were more reproducible than those from the heel. Combined results from four studies evaluating capillary refill revealed a pooled sensitivity of 0.60 (95% confidence interval [CI], 0.29 to 0.91) and a specificity of 0.85 (95% CI, 0.72 to 0.98) for detecting 5% dehydration in children.189 The presence of a 2-second or longer delay in CRT when combined with any two or more of the findings of absent tears, dry mucous membranes, or ill general appearance predicted clinical dehydration (>5% deficit in body weight) in children (1 month to 5 years of age) with 87% sensitivity and 82% specificity.190–192
Frequent monitoring of capillary refill may be useful in assessing responses to rapid fluid resuscitation in children. A normal CRT of 2 seconds or less has recently been shown to correlate with superior vena cava oxygen saturation (Svco2) of 70% or higher in critically ill children.186,192 The role of serial CRT measurements for assessing the response to rehydration in adults is unknown, but it does not appear to be useful for assessing acute loss of blood volume. Lima and colleagues193 studied the prognostic value of the subjective assessment of peripheral perfusion in critically ill patients following initial resuscitation. When an abnormal CRT was defined as greater than 4.5 seconds, coupled with extremity coolness, these parameters identified patients who had been hemodynamically stabilized but continued to have more severe organ dysfunction and higher lactate levels. In adults, CRT was found to be less sensitive and less specific than orthostatic vital signs in detecting 450-mL blood loss during blood donation.161
Temperature
Detection of abnormal body temperature may facilitate proper diagnosis and evaluation of complaints of patients in the ED. An inability to maintain normal body temperature is indicative of a vast number of potentially serious disorders, including infections, neoplasms, shock, toxic reactions, and environmental exposures.192,194–197 Fever in neutropenic, immunocompromised, or intravenous drug–abusing patients may be more reliable than laboratory tests or clinician assessment in diagnosing serious illness.187,194 Infants are particularly sensitive to thermal stress and may demonstrate lower body temperatures during critical illness.188,195 In one study, although higher rates of serious bacterial infection were found in neonates who had documented fever (OR, 3.23) on admission, in only 8.4% of neonates with historical fever was serious bacterial infection later diagnosed.196 Pre-triage or home assessment of body temperature is fraught with difficulty and unreliability. Whether taken by the oral, rectal, or tympanic routes, reports of fever at home are very difficult to interpret in the clinical setting.194,197 Some studies report rates as low as 13% in frequency when measuring temperature in the critically ill or injured.198
Physiology
Under normal conditions, the temperature of deep central body tissues (i.e., core temperature) remains at 37°C ± 0.6°C (98.6°F ± 1.08°F).199 Core body temperature can be maintained within a narrow range while environmental temperature varies from as much as 13°C to 60°C (55°F to 140°F),199 but surface temperature rises and falls with the environmental and other influences. Mean oral temperature is 36.8°C ± 0.4°C (98.2°F ± 0.7°F).200 Maintenance of normal body temperature requires a balance of heat production and heat loss. Heat loss occurs by radiation, conduction, and evaporation. Approximately 60%, 18%, and 22% of heat loss, respectively, occurs by these methods. Heat loss is increased by wind, water, and lack of insulation (e.g., clothing). Sweating, vasodilation, and decreased heat production serve to decrease temperature. Piloerection, vasoconstriction, and increased heat production serve to increase body temperature. Heat production is increased by shivering, fat catabolism, and increased thyroid hormone production.
Temperature is controlled by feedback mechanisms operating through the preoptic area of the hypothalamus. Heat-sensitive neurons in this area increase their rate of firing during experimental heating. Receptors in the skin, spinal cord, abdominal viscera, and central veins primarily detect cold and provide feedback to the hypothalamus that signals an increase in heat production. Stimuli that change core body temperature result in reflex changes in mechanisms that increase either heat loss or heat production.197–206
Indications and Contraindications
Measurement of oral temperature requires a cooperative adult or child. Patients who are uncooperative, hemodynamically unstable, septic, or in respiratory distress (with an RR >20 beats/min) require a method of measuring temperature other than the traditional oral route.201 This group includes children younger than 5 years and patients who are intubated. Recent ingestion of hot or cold beverages can alter oral temperature readings for 5 to 30 minutes and can falsely elevate a normal temperature or mask a fever.202
Special techniques of measuring core body temperature may be indicated in certain patients (e.g., those with profound hypothermia, frostbite, or hyperthermia). Measurement of core body temperature is indicated in these individuals because it accurately measures the effects of treatment. This is the group of patients who will benefit the most from continuous temperature measurements.203
Measurement Sites
The following sites accurately reflect core body temperature and changes in it: the distal third of the esophagus, the tympanic membrane (TM) (with a direct thermistor in contact with the anterior inferior quadrant of the TM),204,205 and the pulmonary artery.206,207 Other sites may represent core body temperature under certain conditions, for example, (1) the rectum when the temperature is obtained at least 8 cm from the anus with an indwelling thermistor and the body temperature is relatively constant and (2) the bladder when measured with an indwelling thermistor.208
Rectal temperature is often considered the criterion standard for body temperature in ambulatory patients and it is often used routinely in children younger than 3 years.209 Its advantages include accuracy, sensitivity, and availability. One intensive care unit study found that rectal probe temperatures demonstrated limited variability or bias when compared with pulmonary artery temperatures.210 Disadvantages include longer intervals for measurement, safety concerns, and inconvenience. Neutropenia and recent rectal surgery represent relative contraindications to measurement of rectal temperature. Thermistor probes (i.e., small thermocouples with instantaneous readouts) for esophageal and vascular temperature measurement provide continuous temperature readouts when attached to a potentiometer. Thermistor probes are available for measurement of esophageal, bladder, and rectal temperature with appropriate monitors.
Peripheral Body Sites Approximating Core Temperature
A body temperature measurement by IR radiation can be detected from the ear, including the auditory canal and TM, and is easy to use, hygienic, convenient, and quick. It can be used as a general screening technique, particularly in cases in which temperature is not of great importance, such as in minor trauma. Though clearly superior to axillary temperature readings,211 controversy remains regarding the sensitivity and specificity of IR TM readings in the ED. More work is being done in the pediatric population, with an overall sensitivity of between 50% and 80% and a specificity of 85%. The lower sensitivities are found in newborns and infants younger than 3 years.212–214 Systematic reviews of pediatric studies have pooled data suggesting 65% sensitivity, but this is likely to be unacceptable in the clinical setting.215 A recent study found that neither TM nor skin thermometers could reliably predict rectal temperature, and it concurred that these methods could not replace rectal temperature measurement as the “gold standard” for detecting fever in the pediatric population.216 Adult studies, though generally more favorable in recommending TM temperatures, have shown gaps in reliability as well.217 However, a recent systematic review suggested that TM and oral thermometry provides an accurate measure of core temperature in critically ill adults with fever.218 Temporal artery scanning to detect fever is increasingly being examined. In general, these devices show better sensitivity in detecting fever in infants than TM thermistors do (66% versus 49% sensitivity) and may be useful in excluding fever,219 defined as a rectal temperature higher than 38.3°C if the temporal artery readings are lower than 37.7°C.220 The point can be argued that a sensitivity of 60% in any population lacks the required sensitivity to be useful clinically. A theoretical disadvantage of TM temperatures might be a falsely elevated estimate of the core temperature in the presence of otitis media. In one study, TM thermometers accurately reflected oral temperatures in children with otitis media.221
Although probably not a concern in the ED, prehospital providers who might wish to measure IR TM temperature at low ambient temperatures should be aware that below 24.6°C, the TM readings will greatly underestimate core temperatures.222 EMS personnel should also be aware that in a cohort of exhausted marathon runners, rectal and IR TM temperatures have only moderate correlation.223 When hyperthermia or hypothermia is clinically suspected and the IR TM temperature does not confirm an abnormal temperature, a rectal temperature should be obtained.
Axillary and tactile temperature assessments have been demonstrated to be unreliable and insensitive. They should not be used as screening methods for core temperature abnormalities in the ED.224–226 Single-use Tempa-DOT thermometers show progressive temperature dot darkening with increasing temperature, and these thermometers have been adopted by many EDs. These temperature devices have been shown to have 100% sensitivity and approximately 80% specificity for identification of fever when temperature was obtained orally in both adults and children.227 The most rudimentary method for temperature measurement, parental assessment by tactile touch, is associated with a measured fever approximately 75% of the time.228 Clinician estimation of fever is almost identical (70%).229
Procedure
Begin the temperature measurement by selecting the body site. Consider the accuracy of using a certain site to reflect core temperature, the sensitivity of the site to changes in temperature, the convenience, the time required, the safety, and the availability of the site.230 Insert the temperature probe and allow the probe to equilibrate with the temperature of the local body tissues.
Proper placement of the temperature probes significantly influences the results of oral, rectal, esophageal, and vascular temperature.231–233 Obtain sublingual oral temperatures in either the right or the left posterior sublingual pocket with the mouth closed.234 Though anxiety-producing for parents, biting and breaking a mercury thermometer is generally inconsequential with regard to ingestion of either glass or mercury. Obtain a rectal temperature with the patient in the left or right lateral decubitus position and advance the probe gently to a depth of 3 to 5 cm to ensure accurate, atraumatic results.235 Complications associated with rectal temperature measurements are extremely rare but include rectal perforation, pneumoperitoneum, bacteremia, dysrhythmias, and syncope.236 Falsely low but supranormal rectal temperature measurements may be seen during shock.237 Rectal temperature may also lag behind changes in core temperature.
Though not commonly used, measurement of the temperature of a freshly voided urine specimen can validate measurement of temperature at other body sites.238 Urinary bladder temperature measurement has been demonstrated to be similar to pulmonary artery catheter temperature.239
Digital electronic probes are commonly used for the measurement of oral temperature in ambulatory patients.236 Electronic methods of temperature measurement are based on the thermocouple principle. Modern electronic thermometers signal once extrapolation of the temperature-time curve occurs. Current in vitro standards call for an accuracy of ±0.1°C (±0.18°F) over the range of 37°C to 39°C (98.6°F to 102.2°F). Disadvantages include factors that affect clinical accuracy and sensitivity. Disposable single-use oral thermometers are now available and are as reliable as mercury or TM thermometers.234 In the pediatric population, pacifier thermometers record supralingual readings in infants. The average time needed to record a reading with a pacifier thermometer is 3 minutes and 23 seconds, thus making its application in emergency medicine limited, although its sensitivity (72%) and specificity (98%) rival that of alternative methods.240 Various IR ear thermometers are available commercially with varying operating temperature ranges, features, and reported accuracy.241 Complications associated with axillary, oral, ear IR, and liquid crystal thermometers are rare or unreported. TM perforation and pain have been reported as complications of placement of the thermistor probe in the auditory canal.
Interpretation
Normal values for body temperature are affected by the following variables: (1) site and methods used for measurement, (2) perfusion, (3) environmental exposure, (4) pregnancy, (5) activity level, and (6) time of day. Clinicians must interpret body temperature with knowledge of the range of normal values at the intended site of measurement. Although core body temperature remains nearly constant (37.0°C ± 0.6°C or 98.6°F ± 0.18°F), surface temperature rises and falls with changes in ambient temperature, exercise, and time of day. The definition of fever varies by the site of measurement and is defined by a temperature greater than 2 standard deviations above the mean. Fever has been defined as an oral temperature of 37.8°C or higher (100.0°F),235 a rectal temperature of 38.0°C or higher (100.4°F),242 or an IR ear temperature of 37.6°C or higher (99.6°F).235 Based on measurement of temperatures in normal, healthy infants, it is recommended that fever be defined as a rectal temperature of 38°C or higher in infants younger than 30 days, 38.1°C or higher in infants 30 to 60 days (1 to 2 months), and 38.2°C or higher in infants 60 to 90 days old (2 to 3 months).243 Hypothermia has been defined as a core body temperature lower than 35°C (<95°F), and hyperthermia has been defined as a core body temperature higher than 41°C (>105.8°F) with accompanying symptoms and signs.207,244 A useful nomogram and formulas for conversion of centigrade to Fahrenheit are provided in Figure 1-6.
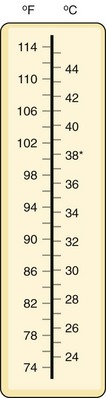
 and add 32. To change Fahrenheit to Celsius, subtract 32 from the Fahrenheit number and multiply by
  . *100.4°F.
Normal ranges and suggested febrile thresholds for common body sites and methods should be considered in the interpretation of temperature values (Table 1-5). Interpretation of temperature measurements during clinical assessment must consider the use of antipyretics, level of activity, pregnancy, environmental exposure, and patient age. Body temperature is increased during sustained exercise, pregnancy, and the luteal phase of the menstrual cycle. Temperature also increases in the late afternoon because of diurnal variation. Body temperature is generally reduced with advanced age, and age may have an impact on the magnitude of fever. Axillary temperatures have low sensitivity but a high specificity for fever. Axillary temperatures should not be used to screen for fever.
TABLE 1-5
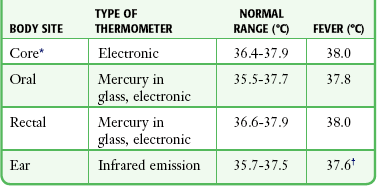
*Temperature obtained with a properly positioned pulmonary artery, esophageal, or tympanic membrane thermistor.
†For unadjusted ear temperature using the Thermoscan Pro-1 (Thermoscan, Inc., San Diego, CA).
Oral temperature measurements are affected by the ingestion of hot or cold liquids,218 tachypnea,245 and cold ambient air.246 Before taking an oral temperature, the examiner should inquire about these features and possibly delay taking the temperature. A 2.7°C (4.9°F) reduction in oral temperature measurement was found when the probe was placed under the tip of the tongue instead of under the posterior sublingual pocket.234 Given the extrapolation that occurs with rapidly reading thermocouple devices and IR detectors, it is not surprising that the sensitivity of these devices for detection of fever is only 86% to 88%.247 Many clinicians have adopted the adage that when an elevated temperature is suspected or crucial in decision making but not evident with an oral thermocouple probe or IR TM thermometer, measurement with a mercury-in-glass thermometer is indicated.
When rapid changes in body temperature occur, oral and TM temperature measurements appear to be more reliable than rectal temperature. In 20 adults examined during open heart surgery, oral temperatures showed a better correlation with blood temperature during rapid cooling and rewarming.240
Infrequently, ED patients require constant monitoring of temperature (e.g., in cases of profound hypothermia or hyperthermia). This can usually be performed by using a bladder or esophageal probe attached to a potentiometer. Patients with indwelling central venous or pulmonary arterial catheters may have electronic thermistors inserted into the central circulation to measure core body temperature. As noted earlier, rectal temperature measurements are less desirable for monitoring patients undergoing rapid changes in core temperature. Periodic IR TM temperature monitoring may represent one useful option in a hypothermic patient.248
Interpretation of ear IR temperatures requires knowledge of the mode of thermometer operation and ambient temperature. Occlusion of the ear canal by cerumen may produce a falsely low reading.249 Most IR ear thermometers have different modes that allow users to predict the equivalent temperature at other body sites. IR ear thermometers appear to be moderately sensitive for fever.250 If these devices are used, the clinician must be aware of the potential for a falsely low temperature. When in doubt, the measurement should be repeated with a more standard method.
Patients, parents, and caregivers often misinterpret the significance of a fever, and the term “fever phobia” has been coined to describe the ubiquitous and unsubstantiated fear that fever, by itself, is harmful or has diagnostic or prognostic significance.197 Some of the highest fevers are the result of benign viral infections. Fever has been demonstrated to increase the body’s immune response, thus making aggressive fever reduction counterproductive. Most individuals, especially children, feel better when a high fever is lowered. However, uninitiated medical personnel may contribute to the incidence of fever phobia. Routine administration of antipyretics in the ED for any fever, regardless of the degree of discomfort, has fueled unwarranted concern and may result in potentially harmful interventions, unnecessary testing and treatments, avoidable side effects of medications, and additional patient anxiety. Mandatory medical evaluation for any fever, the use of alcohol sponge baths, waking a sleeping child to administer antipyretics, alternating ibuprofen with acetaminophen, around-the-clock use of antipyretics, and misconceptions about fever causing brain damage are some of the myths that are still extant in some EDs and throughout the general population. An ED protocol stating that any child be afebrile or demonstrate a significant decrease in hyperpyrexia or even have a temperature reading repeated before discharge has no scientific validity.
Pain as a Vital Sign
There is no question that at least temporary pain relief is one intervention that any clinician can usually accomplish with relative ease, but the concept of using pain as “the fifth vital sign” has not met with universal agreement.251 Literal interpretation of this concept can be fraught with problems, and because of the subjective nature of pain, measurement and interpretation are, by nature, imprecise. Initiatives mandating documentation of pain as the fifth vital sign have not been associated with improvement in pain management.252 A prospective, multicenter study evaluating the current state of ED pain management practices concluded that there is high pain intensity as demonstrated by intense pain on arrival (median rating, 8 of 10) and suboptimal pain management practices, with assessment of pain occurring in 83%, 40% receiving no analgesics, lengthy delays in analgesic administration, and a large proportion of patients reporting moderate to severe pain at discharge (74%).253 Assuming weight-based dosing for acute pain management, analgesic regimens did not conform to the recommended regimens in a study of ED patients.254 Simply mandating the recording of a triage pain score has been shown to improve time to initial analgesic treatment.255
Pain can cause sympathetically mediated changes in vital signs. With regard to the quantitative effect of pain, it is well established that standard vital signs (pulse, respiration, blood pressure) do not meaningfully correlate with the level of perceived pain, even in patients with substantial pain, regardless of age, gender, or diagnosis.256 A recent retrospective study of patients with confirmed painful diagnoses showed no clinically significant associations between self-reported triage pain scores and heart rate, blood pressure, or RR.257 Contentions that the judicious use of analgesics will obscure a clinical condition or otherwise adversely affect clinical care are antiquated, unscientific, and inhumane. In short, pain control facilitates the overall ED encounter for both the patient and clinician.
Two types of pain are of concern to ED clinicians. Acute pain is defined as the normal predicted physiologic response to a noxious chemical or thermal stimulus. It is generally time limited. Chronic pain is defined as persistent or episodic pain of a duration or intensity that adversely affects the function or well-being of the patient. Pain of either variety is the most common chief complaint of more than 50% of ED patients, with the figure approaching 75% in some studies.258 Special focus should be placed on pain based on goals of the Joint Commission on Accreditation of Healthcare Organizations (JCAHO), which mandates that all hospitals develop comprehensive programs for the measurement, treatment, and documentation of pain.259
Procedure/Interpretation
Although JCAHO has required organizations to assess the nature and intensity of pain in all patients, there is no perfect measurement tool suitable for the wide variety of patients and clinical settings experienced in EDs. Pain is a complex, subjective, multifaceted, personal experience that is difficult to easily quantify in all individuals. The perfect pain assessment tool for the ED setting would be simple and rapid to administer while providing a precise, reliable, and valid measure of pain regardless of a patient’s age, cultural background, and cognitive or physical impairments. Although numerous instruments to measure acute pain have been proposed, none meets all the criteria necessary to satisfy this definition. Regardless of the instrument chosen to measure pain, the primary focus should be to allow patients to personally report their pain and to rate it from a personal viewpoint. It is widely accepted that health professionals cannot rate pain intensity as accurately as patients themselves.260,261 Even though a patient’s reporting of pain intensity can be frustrating to the clinician, a patient’s self- report of the pain is considered the gold standard for the initial assessment of pain and tracking of a response to interventions. Such patient reporting is not necessarily a gold standard to mandate specific interventions.262
Multiple unidimensional acute pain measurement instruments have been published, and many have been independently validated. These tools are limited to quantifying pain severity only and may overlook the other multidimensional aspects of an individual’s pain experience. Common unidimensional pain instruments include the verbal rating scale (VRS), numerical rating scale (NRS), visual analog scale (VAS), and graphic rating scales (Fig. 1-7). A systematic review recently evaluated a variety of graphic scales in pediatric patients and supported use of the Faces Pain Scale (FPS), the Faces Pain Scale-Revised (FPS-R), the Oucher Pain Scale, and the Wong-Baker Faces Pain Rating Scale (WBFPRS).263 Clinicians need to be aware of the possibility of misinterpreted application of self-reported pain intensity measurement tools that use facial expression.264 The VRS is administered by asking the patient to rate the severity of the pain by using a set of descriptors such as “none,” “mild,” “moderate,” or “severe.” These tests are rapid and easy to use but may be less responsive to changes in severity of pain because of the small number of categories.265 Language and cultural barriers can also limit effectiveness. In the prehospital setting, the verbal NRS appears to be the most appropriate pain measure to administer to adult patients. It is practical and valid. The Oucher scale or the FPS is suitable to assess pain in children.266
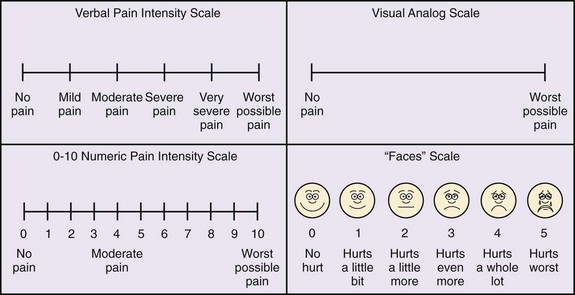
The NRS consists of numbers on a line, and patients are asked to score their pain after explanation of the scale.267 For example, 1 means no pain and 10 means the worst pain ever experienced. The NRS has been validated for verbal administration but may be difficult to use in cognitively impaired patients, who may have difficulty translating pain into numbers.262
Probably the most used pain scale in the ED is the 1 to 10 VAS. The VAS uses a 10-cm line bounded on each end by perpendicular stops and descriptors. Zero equates to no pain, and 10 equates to the worst pain ever experienced. The initial score is not as important as change during treatment. Generally, a change in VAS scores has been shown to be valid and reliable if self-completion is appropriate.268 There is wide variability in this technique, and at least a 13- to 30-mm (1.3- to 3-cm) change on the scale is required to validate clinically relevant worsening or relief.262 Low completion rates may be seen in patients with visual or cognitive impairment. In one ED study, failure rates with the VAS were 15% versus 0% with the NRS.269 Graphic rating scales are useful for patients with limited cognitive and expressive ability, especially children. They may also be helpful to overcome language or cultural differences. In an ED survey, the WBFPRS was the most common (81.7% of responding facilities) pain measurement tool used for pediatric pain assessment.267 The FPS-R was developed to overcome potential cultural differences in how patients perceive tears or the act of smiling.
Multidimensional pain measurement tools attempt to provide more insight by incorporating affective, sensory, and cognitive aspects of the pain experience into the measurement process. Multidimensional measurement tools require more time to administer and are mostly impractical for routine use in the ED. One exception may be the short-form McGill Pain Questionnaire (SF-MPQ), which is reported to take only 2 to 5 minutes to complete.270 The SF-MPQ has been shown to be reliable and valid,267 but little study has been performed in the ED setting. These tools may be difficult to administer in patients with hearing or visual difficulty and in those with limited cognitive ability, such as children or the elderly.
Overall Goal of Pain Relief
The goal of EP pain management is to adequately relieve or control pain without compromising diagnosis, treatment plans, or the safety of the patient and population. The ideal objective is to totally relieve pain (0 on the pain scale). This goal is difficult to consistently achieve in the complex ED milieu. It is best accomplished by combining clinician experience, real-time clinical judgment, repeated evaluation, and discussion with the patient and family. Concerns about the abuse potential of addictive pharmaceuticals often weigh into the decision-making process for emergency physicians, and universal prescriptive reporting services can be used to assist in patient care and safe prescribing practices.270,271 Strict adherence to protocols, patient self-reporting on any pain scale, or reliance on a dogmatic approach to relief of a patient’s pain can be fraught with peril. It is best to treat the patient, not the pain scale.
References
1. Edmonds, ZV, Mower, WR, Lovato, LM, et al. The reliability of vital sign measurements. Ann Emerg Med. 2002;39:233–237.
2. Alcock, K, Clancy, M, Crouch, R. Physiological observations of patients admitted from A&E. Nurs Stand. 2002;16(34):33–37.
3. Dorges, V, Wenzel, V, Kuhl, A, et al. Emergency medical service transport–induced stress? An experimental approach with healthy volunteers. Resuscitation. 2001;49:151–157.
4. Bedford, DE. The ancient art of feeling the pulse. Br Heart J. 1951;13:423–437.
5. Major, RH. The history of taking the blood pressure. Ann Med Hist. 1930;2:47.
6. O’Rourke, RA. Physical examination of the arteries and veins. In: Hurst JW, ed. The Heart. 6th ed. New York: McGraw-Hill; 1986:138.
7. Brock, L. The development of clinical thermometry. Guy’s Hosp Rep. 1972;121:307–314.
8. Report of the Second Task Force on Blood Pressure Control in Children—1987. Task Force on Blood Pressure Control in Children. National Heart, Lung, and Blood Institute, Bethesda, Maryland. Pediatrics. 1987;79:1–25.
9. Haddad, HM, Hsia, DY, Gellis, SS. Studies on respiratory rate in the newborn; its use in the evaluation of respiratory distress in infants of diabetic mothers. Pediatrics. 1956;17:204–213.
10. Ziegler, RF. Electrocardiographic Studies in Normal Infants and Children. Springfield, IL: Charles C Thomas; 1951.
11. Iliff, A, Lee, VA. Pulse rate, respiratory rate, and body temperature of children between two months and eighteen years of age. Child Dev. 1952;23:237–245.
12. Hooker, EA, Danzl, DF, Brueggmeyer, M, et al. Respiratory rates in pediatric emergency patients. J Emerg Med. 1992;10:407–410.
13. Marks, MK, South, M, Carlin, JB. Reference ranges for respiratory rate measured by thermistry (12-84 months). Arch Dis Child. 1993;69:569–572.
14. Rusconi, F, Castagneto, M, Gagliardi, L, et al. Reference values for respiratory rate in the first 3 years of life. Pediatrics. 1994;94:350–355.
15. Freitag, MH, Vasan, RS. What is normal blood pressure? Curr Opin Nephrol Hypertens. 2003;12:285–292.
16. Giles, TD, Berk, BC, Black, HR, et al. Expanding the definition and classification of hypertension. J Clin Hypertens (Greenwich). 2005;7:505–512.
17. Khosla, N, Black, HR. Expanding the definition of hypertension to incorporate global cardiovascular risk. Curr Hypertens Rep. 2006;8:384–390.
18. Pesola, GR, Pesola, HR, Nelson, MJ, et al. The normal difference in bilateral indirect blood pressure recordings in normotensive individuals. Am J Emerg Med. 2001;19:43–45.
19. Pesola, GR, Pesola, HR, Lin, M, et al. The normal difference in bilateral indirect blood pressure recordings in hypertensive individuals. Acad Emerg Med. 2002;9:342–345.
20. Oyetunji, TA, Chang, DC, Crompton, JG, et al. Redefining hypotension in the elderly: normotensive is not ressuring. Arch Surg. 2011;146:865–869.
21. Heffernan, D, Thakkar, RK, Monaghan, SF, et al. Normal presenting vital signs are unreliable in geriatric blunt trauma victims. J Trauma. 2010;69:813–820.
22. Martin, JT, Bonadies, JA. “Normal” vital signs belie occult hypoperfusion in geriatric trauma patients. Am Surg. 2010;76:65–69.
23. Spodick, DH, Raju, P, Bishop, RL, et al. Operational definition of normal sinus heart rate. Am J Cardiol. 1992;69:1245–1246.
24. Spodick, DH. Redefinition of normal sinus heart rate. Chest. 1993;104:939–941.
25. Ziegler, D, Laux, G, Dannehl, K, et al. Assessment of cardiovascular autonomic function: age-related normal ranges and reproducibility of spectral analysis, vector analysis, and standard tests of heart rate variation and blood pressure responses. Diabet Med. 1992;9:166.
26. Spodick, DH. Survey of selected cardiologists for an operational definition of normal sinus heart rate. Am J Cardiol. 1993;72:487–488.
27. Kennedy, S. Detecting changes in the respiratory status of ward patients. Nurs Stand. 2007;21(49):42–46.
28. Parkes, R. Rate of respiration: the forgotten vital sign. Emerg Nurs. 2011;19(2):12–19.
29. Key, TC, Resnik, R. Maternal changes in pregnancy. In Danforth DN, Scott JR, eds.: Obstetrics and Gynecology, 5th ed, Philadelphia: Lippincott, 1986.
30. Katz, R, Karliner, JS, Resnik, R. Effects of a natural volume overload state (pregnancy) on left ventricular performance in normal human subjects. Circulation. 1978;58:434–441.
31. Levitsky, MG. Pulmonary Physiology. New York: McGraw-Hill; 1982.
32. Engum, SA, Mitchell, MK, Scherer, LR, et al. Prehospital triage in the injured pediatric patient. J Pediatr Surg. 2000;35:82–87.
33. Rajesh, VT, Singhi, S, Kataria, S. Tachypnea is a good predictor of hypoxia in acutely ill infants under 2 months. Arch Dis Child. 2000;82:46–49.
34. Gorelick, MH, Lee, C, Cronan, K, et al. Pediatric emergency assessment tool (PEAT): a risk-adjustment measure for pediatric emergency patients. Acad Emerg Med. 2001;8:156–162.
35. Orr, RA, Venkataraman, ST, McCloskey, KA, et al. Measurement of pediatric illness severity using simple pretransport variables. Prehosp Emerg Care. 2001;5:127–133.
36. Considine, J, Thomas, S, Potter, R. Predictors of critical care admission in emergency department patients triaged as low to moderate urgency. J Adv Nurs. 2009;65:818–827.
37. Husum, H, Gilbert, M, Wisborg, T, et al. Respiratory rate as a prehospital triage tool in rural trauma. J Trauma. 2003;55:466–470.
38. Skrifvars, MB, Boyd, J, Kuisma, M. Prearrest signs of shock and respiratory insufficiency in out-of-hospital cardiac arrests witnessed by crew of the emergency medical service. Am J Emerg Med. 2009;27:440–448.
39. Olsson, T, Lind, L. Comparison of the Rapid Emergency Medicine Score and APACHE II in nonsurgical emergency department patients. Acad Emerg Med. 2003;10:1040–1048.
40. Olsson, T, Terent, A, Lind, L. Rapid Emergency Medicine score: a new prognostic tool for in-hospital mortality in nonsurgical emergency department patients. J Intern Med. 2004;255:579–587.
41. Merz, TM, Etter, R, Mende, L, et al. Risk assessment in the first fifteen minutes: a prospective cohort study of a simple physiological scoring system in the emergency department. Crit Care. 2011;15:R25.
42. Bates, B. A Guide to Physical Examination and History Taking, 10th ed. Philadelphia: Lippincott; 2008.
43. Edmonds, ZV, Mower, WR, Lovato, LM, et al. The reliability of vital sign measurements. Ann Emerg Med. 2002;39:233–237.
44. Hooker, EA, O’Brien, DJ, Danzl, DF, et al. Respiratory rates in emergency department patients. J Emerg Med. 1989;7:129–132.
45. Lim, WS, Carty, SM, Macfarlane, JT, et al. Respiratory rate measurement in adults—how reliable is it? Respir Med. 2002;96:31–33.
46. Lovett, PB, Buchwald, JM, Stürmann, K, et al. The vexatious vital: neither clinical measurements by nurses nor an electronic monitor provides accurate measurements of respiratory rate in triage. Ann Emerg Med. 2005;45:68–76.
47. Taylor, JA, Del Beccaro, M, Done, S, et al. Establishing clinically relevant standards for tachypnea in febrile children younger than 2 years. Arch Pediatr Adolesc Med. 1995;149:283–287.
48. O’Malley, GF. Emergency department management of the salicylate-poisoned patient. Emerg Med Clin North Am. 2007;25:333–346.
49. Rigatto, H. Apnea. Pediatr Clin North Am. 1982;29:1105–1116.
50. Barnaby, D, Ferrick, K, Kaplan, DT, et al. Heart rate variability in emergency department patients with sepsis. Acad Emerg Med. 2002;9:661–670.
51. Deakin, CD, Low, JL. Accuracy of the advanced trauma life support guidelines for predicting systolic blood pressure using carotid, femoral, and radial pulses: observational study. Br Med J Clin Res Ed. 2000;321:673–674.
52. Burnside, JW, McGlynn, TJ. Physical Diagnosis, 17th ed. Baltimore: Williams & Wilkins; 1986.
53. Textbook of Pediatric Advanced Life Support. Dallas: American Heart Association, 1994.
54. Sarti, A, Savron, F, Casotto, V, et al. Heartbeat assessment in infants: a comparison of four clinical methods. Pediatr Crit Care Med. 2005;6:212–215.
55. Sarti, A, Savron, F, Ronfani, L, et al. Comparison of three sites to check the pulse and count heart rate in hypotensive infants. Paediatr Anaesth. 2006;16:394–398.
56. Oakley, GD. The athletic heart. Cardiol Clin. 1987;5:319–329.
57. Scharf, M, Brem, MH, Wilhelm, M, et al. Atrial and ventricular functional and structural adaptations of the heart in elite triathletes assessed with cardiac MR imaging. Radiology. 2010;257:71–79.
58. Opthof, T. The normal range and determinants of the intrinsic heart rate in man. Cardiovasc Res. 2000;45:173–176.
59. Kelly, R, Hayward, C, Avolio, A, et al. Noninvasive determination of age-related changes in the human arterial pulse. Circulation. 1989;80:1652–1659.
60. Harris, RL, Musher, DM, Bloom, K, et al. Manifestations of sepsis. Arch Intern Med. 1987;147:1895–1906.
61. Wilkinson, IB, Cockcroft, JR, Webb, DJ. Pulse wave analysis and arterial stiffness. J Cardiovasc Pharmacol. 1998;32(suppl 3):S33–S37.
62. Tabata, BK, Kirsch, JR, Rogers, MC. Diagnostic tests and technology for pediatric intensive care. In: Roger MC, ed. Textbook of Pediatric Intensive Care. Baltimore: Williams & Wilkins; 1987:1041.
63. Kirkendall, WM, Feinleib, M, Freis, ED, et al. Recommendations for human blood pressure determination by sphygmomanometers. Subcommittee of the AHA Postgraduate Education Committee. Circulation. 1980;62:1146A–1155A.
64. Silverman, MA, Walker, AR, Nicolaou, DD, et al. The frequency of blood pressure measurements in children in four EDs. Am J Emerg Med. 2000;18:784–788.
65. Thompson, T, Stanford, K, Dick, R, et al. Triage assessment in pediatric emergency departments: a national survey. Pediatr Emerg Care. 2010;26:544–548.
66. Grunau, CF. Doppler ultrasound monitoring of systemic blood flow during CPR. JACEP. 1978;7:180–185.
67. O’Keefe, KM, Bookman, L. The portable Doppler: practical applications in EMS care. JACEP. 1976;5:987–991.
68. Paradis, NA, Martin, GB, Goetting, MG, et al. Aortic pressure during human cardiac arrest. Identification of pseudo-electromechanical dissociation. Chest. 1992;101:123–128.
69. Hirschl, MM, Binder, M, Herkner, H, et al. Accuracy and reliability of noninvasive continuous finger blood pressure measurement in critically ill patients. Crit Care Med. 1996;24:1684–1689.
70. Nowak, RM, Sen, A, Garcia, AJ, et al. Noninvasive continuous or intermittent blood pressure and heart rate patient monitoring in the ED. Am J Emerg Med. 2011;29:782–789.
71. Recommendations for routine blood pressure measurement by indirect cuff sphygmomanometry. American Society of Hypertension. Am J Hypertens. 1992;5:207–209.
72. Hemingway, T, Abdelnur, D, Guss, DA. The impact of arm position on blood pressure measurement [abstract]. Acad Emerg Med. 2002;9:377.
73. Nelson, WP, Egbert, AM. How to measure blood pressure accurately. Prim Cardiol. 1984;10:14.
74. Petrie, JC, O’Brien, ET, Littler, WA, et al. Recommendations on blood pressure measurement. Br Med J Clin Res Ed. 1986;293:611–615.
75. Marks, LA, Groch, A. Optimizing cuff width for noninvasive measurement of blood pressure. Blood Press Monit. 2000;5:153–158.
76. Bur, A, Herkner, H, Vlcek, M, et al. Factors influencing the accuracy of oscillometric blood pressure measurement in critically ill patients. Crit Care Med. 2003;31:793–799.
77. Veiga, EV, Arcuri, EA, Cloutier, L, et al. Blood pressure measurement: arm circumference and cuff size availability. Rev Lat Am Enfermagem. 2009;17:455–461.
78. Amoore, JN, Guehenec, M, Scordecchia, R, et al. Auditing the technology used to measure blood pressure. J Med Eng Technol. 2010;34:209–216.
79. Bur, A, Hirschl, MM, Herkner, H, et al. Accuracy of oscillometric blood pressure measurement according to the relation between cuff size and upper-arm circumference in critically ill patients. Crit Care Med. 2000;28:371–376.
80. Perlman, LV, Chiang, BN, Keller, J, et al. Accuracy of sphygmomanometers in hospital practice. Arch Intern Med. 1970;125:1000–1003.
81. Katona, Z, Bolvary, G. Automatic sphygmomanometer. Adv Cardiovasc Phys. 1983;5:119.
82. Murphy, MF, Krauss, B. Monitoring the emergency patient. In: Marx J, Hockberger R, Walls R, et al, eds. Rosen’s Emergency Medicine. 7th ed. Philadelphia, PA: Elsevier; 2009:29–30.
83. Yelderman, M, Ream, AK. Indirect measurement of mean blood pressure in the anesthetized patient. Anesthesiology. 1979;50:253–256.
84. Park, MK, Menard, SM. Accuracy of blood pressure measurement by the Dinamap monitor in infants and children. Pediatrics. 1987;79:907–914.
85. Sabharwal, A, Strickland, T, Yentis, SM. Ability of radial arterial palpation and observation of the pulse oximetry trace to estimate non-invasive systolic pressure in healthy volunteers and in women undergoing spinal anaesthesia for elective caesarean section. Anaesthesia. 2011;66:20–24.
86. Nwankwo, MU, Lorenz, JM, Gardiner, JC. A standard protocol for blood pressure measurement in the newborn. Pediatrics. 1997;99(6):E10.
87. Khoshdel, AR, Carney, S, Gillies, A. The impact of arm position and pulse pressure on the validation of a wrist-cuff blood pressure measurement device in a high risk population. Int J Gen Med. 2010;8(3):119–125.
88. Gavish, B, Gavish, L. Blood pressure variation in response to changing arm cuff height cannot be explained solely by the hydrostatic effect. J Hypertens. 2011;29:2099–2104.
89. van der Hoeven, NV, van den Born, BJ, van Montfrans, GA. Reliability of palpation of the radial artery compared with auscultation of the brachial artery in measuring SBP. J Hypertens. 2011;29:51–55.
90. Pickering, TG. Principles and techniques of blood pressure measurement. Cardiol Clin. 2002;20:207–223.
91. Prineas, RJ, Jacobs, D. Quality of Korotkoff sounds: bell vs diaphragm, cubital fossa vs brachial artery. Prev Med. 1983;12:715–719.
92. Pavlik, VN, Hyman, DJ, Toronjo, C. Comparison of automated and mercury column blood pressure measurements in health care settings. J Clin Hypertens (Greenwich). 2000;2:81–86.
93. Lehmann, KG, Gelman, JA, Weber, MA, et al. Comparative accuracy of three automated techniques in the noninvasive estimation of central blood pressure in men. Am J Cardiol. 1998;81:1004–1012.
94. Singer, AJ, Kahn, SR, Thode, HC, Jr., et al. Comparison of forearm and upper arm blood pressures. Prehosp Emerg Care. 1999;3:123–126.
95. Hirschl, MM, Binder, M, Herkner, H, et al. Accuracy and reliability of noninvasive continuous finger blood pressure measurement in critically ill patients. Crit Care Med. 1996;24:1684–1689.
96. Hager, H, Mandadi, G, Pulley, D, et al. A comparison of noninvasive blood pressure measurement on the wrist with invasive arterial blood pressure monitoring in patients undergoing bariatric surgery. Obes Surg. 2009;19:717–724.
97. Enselberg, CD. Measurement of diastolic blood pressure by palpation. N Engl J Med. 1961;265:272–274.
98. Goldring, D, Wohltmann, H. Flush method for blood pressure determinations in newborn infants. J Pediatr. 1952;40:285–289.
99. Park, MK, Menard, SM. Normative oscillometric blood pressure values in the first 5 years in an office setting. Am J Dis Child. 1989;143:860–864.
100. Reder, RF, Dimich, I, Cohen, ML, et al. Evaluating indirect blood pressure measurement techniques: a comparison of three systems in infants and children. Pediatrics. 1978;62:326–330.
101. Cohn, JN. Blood pressure measurement in shock. Mechanism of inaccuracy in ausculatory and palpatory methods. JAMA. 1967;199(13):118–122.
102. Elseed, AM, Shinebourne, EA, Joseph, MC. Assessment of techniques for measurement of blood pressure in infants and children. Arch Dis Child. 1973;48:932–936.
103. Millar-Craig, MW, Bishop, CN, Raftery, EB. Circadian variation of blood-pressure. Lancet. 1978;1:795–797.
104. Recognition of respiratory failure and shock: anticipating cardiopulmonary arrest. In: Chameides L, Hazinski MF, eds. Textbook of Pediatric Advanced Life Support. Dallas: American Heart Association; 1988:1.
105. Schwaitzberg, SD, Bergman, KS, Harris, BH. A pediatric trauma model of continuous hemorrhage. J Pediatr Surg. 1988;23:605–609.
106. Abou-Khalil, B, Scalea, TM, Trooskin, SZ, et al. Hemodynamic responses to shock in young trauma patients: need for invasive monitoring. Crit Care Med. 1994;22:633–639.
107. Wo, CC, Shoemaker, WC, Appel, PL, et al. Unreliability of blood pressure and heart rate to evaluate cardiac output in emergency resuscitation and critical illness. Crit Care Med. 1993;21:218–223.
108. Reeves, RA. The rational clinical examination. Does this patient have hypertension? How to measure blood pressure. JAMA. 1995;273:1211–1218.
109. Ostchega, Y, Dillon, CF, Hughes, JP, et al. Trends in hypertension prevalence, awareness, treatment, and control in older U.S. adults: data from the National Health and Nutrition Examination Survey 1988 to 2004. J Am Geriatr Soc. 2007;55:1056–1065.
110. Lewington, S, Clarke, R, Qizilbash, N, et al. Age-specific relevance of usual blood pressure to vascular mortality: a meta-analysis of individual data for one million adults in 61 prospective studies. Lancet. 2002;360:1903–1913.
111. Chernow, SM, Iserson, KV, Criss, E. Use of the emergency department for hypertension screening: a prospective study. Ann Emerg Med. 1987;16:180–182.
112. Chrysant, SG. Treatment of white coat hypertension. Curr Hypertens Rep. 2000;2:412–417.
113. Khan, TV, Khan, SS, Akhondi, A, et al. Whitecoat hypertension: relevance to clinical and emergency medical services personnel. MedGenMed. 2007;9:52.
114. Bailey, RH, Bauer, JH. A review of common errors in the indirect measurement of blood pressure. Sphygmomanometry. Arch Intern Med. 1993;153:2741–2748.
115. Baker, RH, Ende, J. Confounders of auscultatory blood pressure measurement. J Gen Intern Med. 1995;10:223–231.
116. Maxwell, MH, Waks, AU, Schroth, PC, et al. Error in blood-pressure measurement due to incorrect cuff size in obese patients. Lancet. 1982;2:33–36.
117. Pickering, TG, Hall, JE, Appel, LJ, et al. Recommendations for blood pressure measurement in humans: an AHA scientific statement from the Council on High Blood Pressure Research Professional and Public Education Subcommittee. J Clin Hypertens (Greenwich). 2005;7:102–109.
118. Linfors, EW, Feussner, JR, Blessing, CL, et al. Spurious hypertension in the obese patient. Effect of sphygmomanometer cuff size on prevalence of hypertension. Arch Intern Med. 1984;144:1482–1485.
119. Fonseca-Reyes, S, Fajardo-Flores, I, Montes-Casillas, M, et al. Differences and effects of medium and large adult cuffs on blood pressure readings in individuals with muscular arms. Blood Press Monit. 2009;14:166–171.
120. Poppers, PJ, Epstein, RM, Donham, RT. Automatic ultrasound monitoring of blood pressure during induced hypotension. Anesthesiology. 1971;35:431–435.
121. Holt, TR, Withington, DE, Mitchell, E. Which pressure to believe? A comparison of direct arterial with indirect blood pressure measurement techniques in the pediatric intensive care unit. Pediatr Crit Care Med. 2011;12:e391–e394.
122. Dewar, R, Sykes, D, Mulkerrin, E, et al. The effect of hemiplegia on blood pressure measurement in the elderly. Postgrad Med J. 1992;68:888–891.
123. Nurses’ knowledge of error in blood pressure measurement technique. Int J Nurs Pract. 2002;8:118–126.
124. Nussmeier, NA, Hauser, MC, Sarwar, MF, et al. Anesthesia for cardiac surgical procedures. In: Miller R, Eriksson L, Fleisher L, et al, eds. Miller’s Anesthesia. 7th ed. Philadelphia, PA: Elsevier; 2009:1941–1943.
125. Myers, TJ, Bolmers, M, Gregoric, ID, et al. Assessment of arterial blood pressure during support with an axial flow left ventricular assist device. J Heart Lung Transplant. 2009;28:423–427.
126. Singer, AJ, Hollander, JE. Blood pressure. Assessment of interarm differences. Arch Intern Med. 1996;156:2005–2008.
127. Clark, CE, Campbell, JL, Evans, PH, et al. Prevalence and clinical implications of the inter-arm blood pressure difference: a systematic review. J Hum Hypertens. 2006;20:923–931.
128. Teece, S, Hogg, K. Peripheral pulses to exclude thoracic aortic dissection. Emerg Med J. 2004;21:589.
129. Verberk, WJ, Kessels, AG, Thien, T. Blood pressure measurement method and inter-arm differences: a meta-analysis. Am J Hypertens. 2011;24:1201–1208.
130. Siniorakis, E, Arvanitakis, S, Hardavella, G, et al. Searching for pulsus paradoxus and correlates in cardiac tamponade. Int J Cardiol. 2010;145:127–128.
131. Clark, JA, Lieh-Lai, M, Thomas, R, et al. Comparison of traditional and plethysmographic methods for measuring pulsus paradoxus. Arch Pediatr Adolesc Med. 2004;158:48–51.
132. Spodick, DH. Acute cardiac tamponade. Pathologic physiology, diagnosis and management. Prog Cardiovasc Dis. 1967;10:64–96.
133. Curtiss, EI, Reddy, PS, Uretsky, BF, et al. Pulsus paradoxus: definition and relation to the severity of cardiac tamponade. Am Heart J. 1988;115:391–398.
134. McGregor, M. Current concepts: pulsus paradoxus. N Engl J Med. 1979;301:480–482.
135. Singh, S, Wann, LS, Klopfenstein, HS, et al. Usefulness of right ventricular diastolic collapse in diagnosing cardiac tamponade and comparison to pulsus paradoxus. Am J Cardiol. 1986;57:652–656.
136. Frey, B, Freezer, N. Diagnostic value and pathophysiologic basis of pulsus paradoxus in infants and children with respiratory disease. Pediatr Pulmonol. 2001;31:138–143.
137. Wright, RO, Steele, DW, Santucci, KA, et al. Continuous, noninvasive measurement of pulsus paradoxus in patients with acute asthma. Arch Pediatr Adolesc Med. 1996;150:914–918.
138. Jay, GD, Onuma, K, Davis, R, et al. Analysis of physician ability in the measurement of pulsus paradoxus by sphygmomanometry. Chest. 2000;118:348–352.
139. Ardagh, MW, Hodgson, T, Shaw, L, et al. Pulse rate over pressure evaluation (ROPE) is useful in the assessment of compensated haemorrhagic shock. Emerg Med (Fremantle). 2001;13:43–46.
140. King, RW, Plewa, MC, Buderer, NM, et al. Shock index as a marker for significant injury in trauma patients. Acad Emerg Med. 1996;3:1041–1045.
141. Rady, MY, Nightingale, P, Little, RA, et al. Shock index: a re-evaluation in acute circulatory failure. Resuscitation. 1992;23:227–234.
142. Rady, MY, Smithline, HA, Blake, H, et al. A comparison of the shock index and conventional vital signs to identify acute, critical illness in the emergency department. Ann Emerg Med. 1994;24:685–690.
143. Musonda, P, Sankaran, P, Subramanian, DN, et al. Prediction of mortality in community-acquired pneumonia in hospitalized patients. Am J Med Sci. 2011;342:489–493.
144. Birkhahn, RH, Gaeta, TJ, Bei, R, et al. Shock index in the first trimester of pregnancy and its relationship to ruptured ectopic pregnancy. Acad Emerg Med. 2002;9:115–119.
145. Bernstein, EF, Fronek, A. Current status of noninvasive tests in the diagnosis of peripheral arterial disease. Surg Clin North Am. 1982;62:473–487.
146. MacDougall, AM, Tandon, V, Wilson, MP, et al. Oscillometric measurement of ankle-brachial index. Can J Cardiol. 2008;24:49–51.
147. Ebert, RV, Stead, EA, Bigson, JG. Response of normal subjects to acute blood loss. Arch Intern Med. 1941;68:578.
148. Newman, AB, Sutton-Tyrrell, K, Vogt, MT, et al. Morbidity and mortality in hypertensive adults with a low ankle/arm blood pressure index. JAMA. 1993;270:487–489.
149. Nassoura, ZE, Ivatury, RR, Simon, RJ, et al. A reassessment of Doppler pressure indices in the detection of arterial lesions in proximity penetrating injuries of extremities: a prospective study. Am J Emerg Med. 1996;14:151–156.
150. Lennihan, R, Jr., Mackereth, M. Ankle blood pressures in vascular insufficiency involving the legs. J Clin Ultrasound. 1973;1:120–124.
151. Burri, C, Henkemeyer, H, Passler, HH, et al. Evaluation of acute blood loss by means of simple hemodynamic parameters. Prog Surg. 1973;11:108–131.
152. Shenkin, HA, Cheny, RH, Govons, SR. On the diagnosis of hemorrhage in man: a study of volunteers bled large amounts. Am J Med Sci. 1944;208:421.
153. Guyton, AC, Hall, JE. Textbook of Medical Physiology, 10th ed. Philadelphia: Saunders; 2000.
154. Chen-Scarabelli, C, Scarabelli, TM. Neurocardiogenic syncope. British Medical Journal. 2004;329:336.
155. Schriger, DL, Baraff, LJ. Capillary refill—is it a useful predictor of hypovolemic states? Ann Emerg Med. 1991;20:601–605.
156. Knopp, R, Claypool, R, Leonardi, D. Use of the tilt test in measuring acute blood loss. Ann Emerg Med. 1980;9:72–75.
157. Mohrman, DE, Heller, LJ. Cardiovascular function in pathological situation. In Weitz M, Naglieri C, eds.: Cardiovascular Physiology, 7th ed, New York: McGraw-Hill, 2010.
158. Thomas, JE, Schirger, A, Fealey, RD, et al. Orthostatic hypotension. Mayo Clin Proc. 1981;56:117–125.
159. Kaufann, H. Consensus statement on the definition of orthostatic hypotension, pure autonomic failure and multiple system atrophy. Clin Auton Res. 1996;6:125.
160. Currens, JH. A comparison of the blood pressure in the lying and standing position: a study of 500 men and 500 women. Am Heart J. 1948;35:646.
161. Kosowsky, JM, Han, JH, Collins, SP, et al. Assessment of stroke index using impedance cardiography: comparison with traditional vital signs for detection of moderate acute blood loss in healthy volunteers. Acad Emerg Med. 2002;9:775–780.
162. McGee, S, Abernethy, WB, 3rd., Simel, DL. The rational clinical examination. Is this patient hypovolemic? JAMA. 1999;281:1022–1029.
163. Stevens, PM. Cardiovascular dynamics during orthostasis and the influence of intravascular instrumentation. Am J Cardiol. 1966;17:211–218.
164. Caird, FI, Andrews, GR, Kennedy, RD. Effect of posture on blood pressure in the elderly. Br Heart J. 1973;35:527–530.
165. Carlson, JE. Assessment of orthostatic blood pressure: measurement technique and clinical applications. South Med J. 1999;92:167–173.
166. Sarasin, FP, Louis-Simonet, M, Carballo, D, et al. Prevalence of orthostatic hypotension among patients presenting with syncope in the ED. Am J Emerg Med. 2002;20:497–501.
167. Raiha, I, Luutonen, S, Piha, J, et al. Prevalence, predisposing factors, and prognostic importance of postural hypotension. Arch Intern Med. 1995;155:930–935.
168. Naschitz, JE, Sabo, E, Gaitini, L, et al. The Haemodynamic Instability Score (HIS) for assessment of cardiovascular reactivity in hypertensive and normotensive patients. J Hum Hypertens. 2001;15:177–184.
169. Duke, M, Abelmann, WH. The hemodynamic response to chronic anemia. Circulation. 1969;39:503–515.
170. Tomaszewski, C, Cline, DM, Whitley, TW, et al. Effect of acute ethanol ingestion on orthostatic vital signs. Ann Emerg Med. 1995;25:636–641.
171. Horam, WJ, Roscelli, JD. Establishing standards of orthostatic measurements in normovolemic adolescents. Am J Dis Child. 1992;146:848–851.
172. Fuchs, SM, Jaffe, DM. Evaluation of the “tilt test” in children. Ann Emerg Med. 1987;16:386–390.
173. Johnson, DR, Douglas, D, Hauswald, M, et al. Dehydration and orthostatic vital signs in women with hyperemesis gravidarum. Acad Emerg Med. 1995;2:692–697.
174. Witting, MD, Gallagher, K. Unique cutpoints for sitting-to-standing orthostatic vital signs. Am J Emerg Med. 2003;21:45–47.
175. Lance, R, Link, ME, Padua, M, et al. Comparison of different methods of obtaining orthostatic vital signs. Clin Nurs Res. 2000;9:479–491.
176. Guss, DA, Abdelnur, D, Hemingway, TJ. The impact of arm position on the measurement of orthostatic blood pressure. J Emerg Med. 2008;34:377–382.
177. Baraff, LJ, Schriger, DL. Orthostatic vital signs: variation with age, specificity, and sensitivity in detecting a 450-mL blood loss. Am J Emerg Med. 1992;10:99–103.
178. Witting, MD, Smithline, HA. Orthostatic change in shock index: comparison with traditional tilt test definitions. Acad Emerg Med. 1996;3:926–931.
179. Koziol-McLain, J, Lowenstein, SR, Fuller, B. Orthostatic vital signs in emergency department patients. Ann Emerg Med. 1991;20:606–610.
180. Levitt, MA, Lopez, B, Lieberman, ME, et al. Evaluation of the tilt test in an adult emergency medicine population. Ann Emerg Med. 1992;21:713–718.
181. Saavedra, JM, Harris, GD, Li, S, et al. Capillary refilling (skin turgor) in the assessment of dehydration. Am J Dis Child. 1991;145:296–298.
182. Anderson, B, Kelly, A, Kerr, D, et al. Capillary refill time in adults has poor inter-rater agreement. Acad Emerg Med. 2007;14(suppl 1):183.
183. Otieno, H, Were, E, Ahmed, I, et al. Are bedside features of shock reproducible between different observers? Arch Dis Child. 2004;89:977–979.
184. Anderson, B, Kelly, A, Kerr, D, et al. Impact of patient and environmental factors on capillary refill time in adults. Am J Emerg Med. 2008;26:62–65.
185. Gorelick, MH, Shaw, KN, Murphy, KO, et al. Effect of fever on capillary refill time. Pediatr Emerg Care. 1997;13:305–307.
186. Raimer, PL, Han, YY, Weber, MS, et al. A normal capillary refill time of ≤ 2 seconds is associated with superior vena cava oxygen saturations of ≥ 70%. J Pediatr. 2011;158:968–972.
187. Gallagher, EJ, Gennis, P, Brooks, F. Clinical use of the erythrocyte sedimentation rate in the evaluation of febrile intravenous drug users. Ann Emerg Med. 1993;22:776–780.
188. Scopes, JW, Ahmed, I. Range of critical temperatures in sick and premature newborn babies. Arch Dis Child. 1966;41:417.
189. Steiner, MJ, DeWalt, DA, Byerley, JS. Is this child dehydrated? JAMA. 2004;291:2746–2754.
190. Poirier, M, Collins, EP, McGuire, E. Fever phobia: a survey of caregivers of children seen in a pediatric emergency department. Clin Pediatr (Phila). 2010;49:530.
191. Dinarello, C. Thermoregulation and the pathogenesis of fever. Infect Dis Clin North Am. 1996;10:433.
192. Marantz, PR, Linzer, M, Feiner, CJ, et al. Inability to predict diagnosis in febrile intravenous drug abusers. Ann Intern Med. 1987;106:823–828.
193. Lima, A, Jansen, TC, van Bommel, J, et al. The prognostic value of the subjective assessment of peripheral perfusion in critically ill patients. Crit Care Med. 2009;37:934–938.
194. Porter, RS, Wenger, FG. Diagnosis and treatment of pediatric fever by caretakers. J Emerg Med. 2000;19:1–4.
195. Caviness, AC, Demmler, GJ, Almendarez, Y, et al. The prevalence of neonatal herpes simplex virus infection compared with serious bacterial illness in hospitalized neonates. J Pediatr. 2008;153:164–169.
196. Yarden-Bilavsky, H, Bilavsky, E, Amir, J, et al. Serious bacterial infections in neonates with fever by history only versus documented fever. Scand J Infect Dis. 2010;42:812–816.
197. Robinson, JL, Jou, H, Spady, DW. Accuracy of parents in measuring body temperature with a tympanic thermometer. BMC Fam Pract. 2005;6:3.
198. Smith, JJ, Bland, SA, Mullett, S. Temperature—the forgotten vital sign. Accid Emerg Nurs. 2005;13:247–250.
199. Benzinger, M. Tympanic thermometry in surgery and anesthesia. JAMA. 1969;209:1207–1211.
200. Dinarello, CA, Porat, R. Fever and hyperthermia. In Longo D, Fauci A, Kasper D, et al, eds.: Harrison’s Principles of Internal Medicine, 18th ed, New York: McGraw-Hill, 2011.
201. Durham, ML, Swanson, B, Paulford, N. Effect of tachypnea on oral temperature estimation: a replication. Nurs Res. 1986;35:211–214.
202. Newman, BH, Martin, CA. The effect of hot beverages, cold beverages, and chewing gum on oral temperature. Transfusion. 2001;41:1241–1243.
203. Dart, RC, Lee, SC, Joyce, SM, et al. Liquid crystal thermometry for continuous temperature measurement in emergency department patients. Ann Emerg Med. 1985;14:1188–1190.
204. Brinnel, H, Cabanac, M. Tympanic temperature is a core temperature in humans. J Therm Biol. 1989;14:47.
205. Shiraki, K, Konda, N, Sagawa, S. Esophageal and tympanic temperature responses to core blood temperature changes during hyperthermia. J Appl Physiol. 1986;61:98–102.
206. Nicholson, RW, Iserson, KV. Core temperature measurement in hypovolemic resuscitation. Ann Emerg Med. 1991;20:62–65.
207. Earp, JK, Finlayson, DC. Relationship between urinary bladder and pulmonary artery temperatures: a preliminary study. Heart Lung. 1991;20:265–270.
208. Nierman, DM. Core temperature measurement in the intensive care unit. Crit Care Med. 1991;19:818–823.
209. Dressler, DK, Smejkal, C, Ruffolo, ML. A comparison of oral and rectal temperature measurement on patients receiving oxygen by mask. Nurs Res. 1983;32:373–375.
210. Romano, MJ, Fortenberry, JD, Autrey, E, et al. Infrared tympanic thermometry in the pediatric intensive care unit. Crit Care Med. 1993;21:1181–1185.
211. Terndrup, TE. An appraisal of temperature assessment by infrared emission detection tympanic thermometry. Ann Emerg Med. 1992;21:1483–1492.
212. El-Radhi, AS, Patel, S. An evaluation of tympanic thermometry in a paediatric emergency department. Emerg Med J. 2006;23:40–41.
213. Lanham, DM, Walker, B, Klocke, E, et al. Accuracy of tympanic temperature readings in children under 6 years of age. Pediatr Nurs. 1999;25:39–42.
214. Sganga, A, Wallace, R, Kiehl, E, et al. A comparison of four methods of normal newborn temperature measurement. MCN Am J Matern Child Nurs. 2000;25(2):76–79.
215. Dodd, SR, Lancaster, GA, Craig, JV, et al. In a systematic review, infrared ear thermometry for fever diagnosis in children finds poor sensitivity. J Clin Epidemiol. 2006;59:354–357.
216. Paes, BF, Vermeulen, K, Brohet, RM, et al. Accuracy of tympanic and infrared skin thermometers in children. Arch Dis Child. 2010;95:974–978.
217. Hooper, VD, Andrews, JO. Accuracy of noninvasive core temperature measurement in acutely ill adults: the state of the science. Biol Res Nurs. 2006;8:24–34.
218. Jefferies, S, Weatherall, M, Young, P, et al. A systematic review of the accuracy of peripheral thermometry in estimating core temperatures among febrile critically ill patients. Crit Care Resusc. 2011;13:194–199.
219. Greenes, DS, Fleisher, GR. Accuracy of a noninvasive temporal artery thermometer for use in infants. Arch Pediatr Adolesc Med. 2001;155:376–381.
220. Schuh, S, Komar, L, Stephens, D, et al. Comparison of the temporal artery and rectal thermometry in children in the emergency department. Pediatr Emerg Care. 2004;20:736–741.
221. Robb, PJ, Shahab, R. Infrared transtympanic temperature measurement and otitis media with effusion. Int J Pediatr Otorhinolaryngol. 2001;59:195–200.
222. O’Brien, DL, Rogers, IR, Holden, W, et al. The accuracy of oral predictive and infrared emission detection tympanic thermometers in an emergency department setting. Acad Emerg Med. 2000;7:1061–1064.
223. Roth, RN, Verdile, VP, Grollman, LJ, et al. Agreement between rectal and tympanic membrane temperatures in marathon runners. Ann Emerg Med. 1996;28:414–417.
224. Bergeson, PS, Stienfeld, HJ. How dependable is palpation as a screening method for fever? Can touch substitute for thermometer readings? Clin Pediatr (Phila). 1974;13:350–351.
225. Kresch, MJ. Axillary temperature as a screening test for fever in children. J Pediatr. 1984;104:596–599.
226. Masters, JE. Comparison of axillary, oral, and forehead temperature. Arch Dis Child. 1980;55:896–898.
227. Van den Bruel, A, Aertgeets, B, De Boeck, C, et al. Measuring the body temperature: how accurate is the Tempa Dot? Technol Health Care. 2005;13:97–106.
228. Hooker, EA, Smith, SW, Miles, T, et al. Subjective assessment of fever by parents: comparison with measurement by noncontact tympanic thermometer and calibrated rectal glass mercury thermometer. Ann Emerg Med. 1996;28:313–317.
229. Hung, OL, Kwon, NS, Cole, AE, et al. Evaluation of the physician’s ability to recognize the presence or absence of anemia, fever, and jaundice. Acad Emerg Med. 2000;7:146–156.
230. Blainey, CG. Site selection in taking body temperature. Am J Nurs. 1974;74:1859–1861.
231. Erickson, R. Thermometer placement for oral temperature measurement in febrile adults. Int J Nurs Stud. 1976;13:199–208.
232. Molnar, GW, Read, RC. Studies during open-heart surgery on the special characteristics of rectal temperature. J Appl Physiol. 1974;36:333–336.
233. Mellors, JW, Horwitz, RI, Harvey, MR, et al. A simple index to identify occult bacterial infection in adults with acute unexplained fever. Arch Intern Med. 1987;147:666–671.
234. Rajee, M, Sultana, RV. NexTemp thermometer can be used interchangeably with tympanic or mercury thermometers for emergency department use. Emerg Med Australas. 2006;18:245–251.
235. Mackowiak, PA, Wasserman, SS, Levine, MM. A critical appraisal of 98.6 degrees F, the upper limit of the normal body temperature, and other legacies of Carl Reinhold August Wunderlich. JAMA. 1992;268:1578–1580.
236. Erickson, RS, Woo, TM. Accuracy of infrared ear thermometry and traditional temperature methods in young children. Heart Lung. 1994;23:181–195.
237. Buck, SH, Zaritsky, AL. Occult core hyperthermia complicating cardiogenic shock. Pediatrics. 1989;83:782–784.
238. Murray, HW, Tuazon, CU, Guerrero, IC, et al. Urinary temperature: a clue to early diagnosis of factitious fever. N Engl J Med. 1977;296:23–24.
239. Knapik, P, Rychlik, W, Duda, D, et al. Relationship between blood, nasopharyngeal and urinary bladder temperature during intravascular cooling for therapeutic hypothermia after cardiac arrest. Resuscitation. 2012;83:208–212.
240. Press, S, Quinn, BJ. The pacifier thermometer. Comparison of supralingual with rectal temperatures in infants and young children. Arch Pediatr Adolesc Med. 1997;151:551–554.
241. Chamberlain, JM, Terndrup, TE, Alexander, DT, et al. Determination of normal ear temperature with an infrared emission detection thermometer. Ann Emerg Med. 1995;25:15–20.
242. Anagnostakis, D, Matsaniotis, N, Grafakos, S, et al. Rectal-axillary temperature difference in febrile and afebrile infants and children. Clin Pediatr (Phila). 1993;32:268–272.
243. Herzog, LW, Coyne, LJ. What is fever? Normal temperature in infants less than 3 months old. Clin Pediatr (Phila). 1993;32:142–146.
244. Miller, JW, Danzl, DF, Thomas, DM. Urban accidental hypothermia: 135 cases. Ann Emerg Med. 1980;9:456–461.
245. Tandberg, D, Sklar, D. Effect of tachypnea on the estimation of body temperature by an oral thermometer. N Engl J Med. 1983;308:945–946.
246. Nichols, GA, Kucha, DH. Taking adult temperatures: oral measurements. Am J Nurs. 1972;72:1090–1093.
247. Ogren, JM. The inaccuracy of axillary temperatures measured with an electronic thermometer. Am J Dis Child. 1990;144:109–111.
248. Zehner, WJ, Terndrup, TE. Ear temperatures during rewarming from hypothermia [letter]. Ann Emerg Med. 1994;23:901.
249. Doezema, D, Lunt, M, Tandberg, D. Cerumen occlusion lowers infrared tympanic membrane temperature measurement. Acad Emerg Med. 1995;2:17–19.
250. Hooker, EA. Use of tympanic thermometers to screen for fever in patients in a pediatric emergency department. South Med J. 1993;86:855–858.
251. Berthier, F, Potel, G, Leconte, P, et al. Comparative study of methods of measuring acute pain intensity in an ED. Am J Emerg Med. 1998;16:132–136.
252. Tanabe, P, Buschmann, M. A prospective study of ED pain management practices and the patient’s perspective. J Emerg Nurs. 1999;25:171–177.
253. Todd, KH, Ducharme, J, Choiniere, M, et al. Pain in the emergency department: results of the Pain and Emergency Medicine Initiative (PEMI) multicenter study. J Pain. 2007;8:460–466.
254. Bijur, PE, Esses, D, Chang, AK, et al. Dosing and titration of intravenous opioid analgesics administered to ED patients in acute severe pain. Am J Emerg Med. 2012;30(7):1241–1244.
255. Vazirani, J, Knott, JC. Mandatory pain scoring at triage reduces time to analgesia. Ann Emerg Med. 2012;59:134–138.e2.
256. Berry, PH, Dahl, JL. The new JCAHO pain standards: implications for pain management nurses. Pain Manag Nurs. 2000;1:3–12.
257. Marco, CA, Plewa, MC, Buderer, N, et al. Self-reported pain scores in the emergency department: lack of association with vital signs. Acad Emerg Med. 2006;13:974–979.
258. Bird, J. Selection of pain measurement tools. Nurs Stand. 2003;18(13):33–39.
259. McCaffery, M, Ferrell, BR. Nurses’ knowledge of pain assessment and management: how much progress have we made? J Pain Symptom Manage. 1997;14:175–188.
260. Belville, RG, Seupaul, RA. Pain measurement in pediatric emergency care: a review of the faces pain scale-revised. Pediatr Emerg Care. 2005;21:90–93.
261. Franck, LS, Greenberg, CS, Stevens, B. Pain assessment in infants and children. Pediatr Clin North Am. 2000;47:487–512.
262. Todd, KH. Pain assessment instruments for use in the emergency department. Emerg Med Clin North Am. 2005;23:285–295.
263. Tomlinson, D, von Baeyer, CL, Stinson, JN, et al. A systematic review of faces scales for the self-report of pain intensity in children. Pediatrics. 2010;126:e1168–e1198.
264. Jastrzab, G, Kerr, S, Fairbrother, G. Misinterpretation of the Faces Pain Scale-Revised in adult clinical practice. Acute Pain. 2009;11(2):51–55.
265. Lee, JS. Pain measurement: understanding existing tools and their application in the emergency department. Emerg Med (Fremantle). 2001;13:279–287.
266. Jennings, PA, Cameron, P, Bernard, S. Measuring acute pain in the prehospital setting. Emerg Med J. 2009;26:552–555.
267. Probst, BD, Lyons, E, Leonard, D, et al. Factors affecting emergency department assessment and management of pain in children. Pediatr Emerg Care. 2005;21:298–305.
268. Paice, JA, Cohen, FL. Validity of a verbally administered numeric rating scale to measure cancer pain intensity. Cancer Nurs. 1997;20(2):88–93.
269. Stahmer, SA, Shofer, FS, Marino, A, et al. Do quantitative changes in pain intensity correlate with pain relief and satisfaction? Acad Emerg Med. 1998;5:851–857.
270. Baehren, DF, Marco, CA, Droz, DE, et al. A statewide prescription monitoring program affects emergency department prescribing behaviors. Ann Emerg Med. 2010;56:19–23.
271. Knox, HT. Pain and prescription monitoring programs in the emergency department. Ann Emerg Med. 2010;56:24–26.
[/level-membership-for-emergency-medicine-category][not-level-membership-for-emergency-medicine-category]Chapter 1
Vital Signs Measurement
Measuring the temperature, pulse, respiratory rate (RR), blood pressure, and pulse oximetry is generally recommended for all emergency department (ED) patients, in addition to assessment of pain in the appropriate patient population. For very minor problems or for some fast-track patients (e.g., suture removal), a full set of vital signs may not be required, but this is best decided on a case-by-case basis rather than by strict protocol. Vital signs may not only indicate the severity of illness but also dictate the urgency of intervention. Although a single set of abnormal values suggests pathology, findings on triage or the initial vital signs may be spurious and simply be related to stress, anxiety, pain, or fear. It would be incorrect and not standard of care to attribute initial triage blood pressure, RR, or pulse rate to specific pathology or to retrospectively assume that diagnostic or treatment interventions should have been initiated based solely on these readings. The greatest utility of vital signs, therefore, is their observation and trends over time. Deteriorating vital signs are an important indicator of a compromised physiologic condition, and improving values provide reassurance that the patient is responding to therapy. When a patient undergoes treatment over an extended period, it is essential that the vital signs be repeated as appropriate to the clinical scenario, particularly those that were previously abnormal. In some clinical circumstances it is advisable to monitor the vital signs continuously.1
Vital signs should be measured and recorded at intervals as dictated by clinical judgment or the patient’s clinical state or after any significant change in these parameters. Adhering to protocols or disease categories may not be useful or productive. An abnormal vital sign may constitute the patient’s entire complaint, as in a febrile infant, or it may be the only indication of the potential for serious illness, as in a patient with resting tachycardia.2
Emergency medical service (EMS) personnel begin assessment of the patient’s status and vital signs in the prehospital setting. Surges of epinephrine and norepinephrine commonly occur during transport by the EMS, and these hormones are known to alter vital signs and lead to increases in the heart rate of greater than 10%.3 Vagal influences may also influence EMS-derived vital signs. Prehospital vital signs should always be interpreted with the entire clinical scenario in perspective.
Background
Early recognition of vital signs dates back to the fourth century bc, when Herophilus first described sphygmology, or palpation of the pulse in terms of size, frequency, force, and rhythm. Chinese clinicians (second century bc) timed the pulse by the RR of the examiner in the belief that four pulsations per respiration was normal for adults. The study of pulses was greatly influenced by Galen, who expanded the subject into a rather complex and obscure art form and wrote 18 books on the subject.4
Blood pressure was first measured directly in 1733 by Hales, who recorded arterial pressure in a mare by cannulation with a brass pipe and a blood-filled glass column.5 Frank used large-bore catheters connected to a rubber membrane in a 1903 manometer.6 Invention of inflatable cuff manometers (Riva-Rocci, 1896) and discovery of the arterial phase sounds (Korotkoff, 1905) allowed the development of indirect measurement of blood pressure.5,6
Clinical thermometry was introduced by Sanctorius in 1625, with early thermometers being filled with alcohol. Mercury column thermometers were introduced by Fahrenheit in 1714. Although their routine use was supported by Boerhaave, thermometry was not established as routine clinical practice until the 1870s.7
Normal Values
Published vital sign norms for children are not as well accepted as those for adult patients. Table 1-1 and Table 1-2 report normal vital signs for children by age group as means and standard deviations. In Table 1-1, the values for pulse and blood pressure for 0- to 2-month-olds are adapted from studies of newborn populations (i.e., <7 days).8–10 During the newborn period, normal arterial blood pressure rises rapidly. Values for pulse and respiration in children older than 3 years reflect an average of male and female values for 0- to 1-, 3-, 9-, and 16-year-old populations. The values for blood pressure reflect an average of male and female values for the 1- to 6-month-old and the 3-, 9-, and 16-year-old populations.11 Newer studies have reassessed the reference values for RR in children.12–14 Table 1-2 reflects age-related changes and the effect of the state of wakefulness on RR in children up to 3 years of age.14 A study evaluating resting RRs in pediatric ED patients up to the age of 18, however, indicated considerable patient variability and somewhat higher RRs than those shown in Table 1-2.12
TABLE 1-1
Normal Values for Vital Signs in Infants and Children (Means ± SD)
BP, blood pressure; SD, standard deviation.
*For data on children 0 to 36 moths, see Table 1-2.
†As an estimate, for children 1 to 10 years of age, (2 × age [yr]) + 90 mm Hg = 50th percentile for systolic BP.
TABLE 1-2
Normal Respiratory Rates (Breaths/min) in Children Up to 3 Years of Age (Means ± SD)
Adapted from Rusconi F, Castagneto M, Gagliardi L, et al. Reference values for respiratory rate in the first 3 years of life. Pediatrics. 1994;94:351.
For the adult population, normal blood pressure values have been established. Although systolic blood pressure increases with age, normotensive or normal systolic blood pressure is defined as 90 to 140 mm Hg, and normotensive or normal diastolic blood pressure is defined as 60 to 90 mm Hg. The recent literature suggests defining an “optimal” blood pressure as 115/75 because values at or below this level have been associated with minimal vascular mortality.15 It has been suggested that the definition of hypertension be further expanded to integrate a global cardiovascular risk assessment.16,17 Although most patients have similar blood pressure in both arms, Pesola and coworkers found that 18% of their hypertensive population18 and 15% of their normotensive population had a difference of greater than 10 mm Hg in systolic blood pressure between arms.19
Within the adult population, optimal definitions for normal systolic blood pressure probably vary by age, and particular differentiation should be made in regard to geriatric patients in the emergency setting. The recent literature suggests redefining values representative of hypotension in the elderly, especially in the setting of trauma. Systolic blood pressure readings ranging from approximately 90 to 120 mm Hg have been associated with occult hypoperfusion and increased mortality in geriatric trauma patients.20–22
In 1928 the New York Heart Association, by consensus, established the normal limits for the resting heart rate as 60 beats/min and 100 beats/min. More recent data indicate that 45 beats/min and 95 beats/min may better define the heart rate limits of normal sinus rhythm in adults of all ages. Spodick recommended that the operational definition for the limits of the resting heart rate in adults be 50 beats/min and 90 beats/min.23,24 This view is widely supported among cardiologists,25,26 but these ranges have not been validated in the ED setting. There is currently no consensus on what constitutes a normal adult RR; however, an RR range of 12 to 24 breaths/min is generally accepted in the existing literature as the norm for adults.27,28
Pregnancy results in alterations in the normal adult values for pulse and blood pressure. The RR is unchanged, although the physiologic hyperventilation of pregnancy is well recognized and results from increased tidal volume and decreased residual and expiratory reserve volume.29 The resting pulse rate increases throughout pregnancy to 10% to 15% over baseline values. The norms for systolic and diastolic blood pressure are dependent on patient positioning. When a pregnant patient is sitting or standing, systolic pressure is essentially unchanged. Diastolic pressure declines until approximately 28 weeks’ gestation, at which time it begins to rise to nonpregnant levels. When a pregnant patient is in the lateral decubitus position, both systolic and diastolic pressure declines until the 28th week and then begins to rise to nonpregnant levels (Table 1-3).30
TABLE 1-3
Vital Signs during Pregnancy in the Lateral Decubitus Position (Means ± SD)
BP, blood pressure; SD, standard deviation.
Adapted from Katz R, Karliner JS, Resnik R. Effects of a natural volume overload state (pregnancy) on left ventricular performance in normal human subjects. Circulation. 1978;58:434. By permission of the American Heart Association.
Respiration
Breathing is initiated and primarily controlled in the medullary respiratory center of the brainstem. The respiratory center is modulated by the pneumotaxic center, which limits the length of the inspiratory signal and greatly influences the RR and apneustic center in the pons.31 Respiratory frequency reveals only a glimpse of the entire clinical picture. The pattern, effort, and volume of respiration may be more indicative of altered respiratory physiology. An abnormality in respiration may be a primary complaint or a manifestation of other systemic diseases. Increased RRs may be seen in patients with a variety of pulmonary or cardiac diseases, but acidosis, anemia, temperature, stress, and drugs (such as stimulants and salicylates) can significantly alter the RR in the absence of cardiopulmonary dysfunction.
Indications and Contraindications
The respiratory status of both adults and children plays a crucial role in determining the overall assessment of illness. Although it is a sensitive yet nonspecific indicator of respiratory dysfunction, the RR can also predict nonpulmonary morbidity. Several prehospital and hospital-based illness or injury severity scores feature the RR as a cardinal value. A prehospital RR of less than 10 or greater than 29 breaths/min is associated with major injury in 73% of children.32 Using tachypnea alone as a predictor of pulmonary pathology, infants with an RR higher than 60 are found to be hypoxic 80% of the time.33 Pediatric studies have linked abnormal RRs to in-hospital mortality and the level of care required in the ED.34,35 In a retrospective study exploring predictors of critical care admission for adult ED patients who were initially triaged as having low to moderate acuity, an abnormal RR at the first nursing assessment increased the odds of critical care admission by a factor of 1.66.36 An RR higher than 25 breaths/min in prehospital trauma patients was associated with increased mortality.37 Pre-arrest respiratory insufficiency (RR >36 breaths/min or pulse oximetry <90%) was an independent predictor of mortality (odds ratio [OR], 4.2) in patients with EMS-witnessed cardiac arrest.38 Although some studies have associated abnormal RRs in adult ED patients with increased mortality,39,40 a recent large prospective cohort study of adult patients found that an initial abnormal RR on triage in the ED was not an independent predictor of hospital mortality.41
Procedure
To measure RR (inspirations per minute), count the respirations when the patient is unaware that his or her breathing is being observed. Count for a full minute to most accurately determine the RR. The frequency of breathing is less regular than the pulse, and inaccurate measurement is more likely to occur if the count is taken for a shorter interval. An infant’s RR can easily be determined by observing or palpating the excursion of the chest or the abdominal wall.42 Infants should be observed for grunting respirations, which are produced by expiration against a partly closed glottis (an attempt to maintain positive airway pressure).
Interpretation
The reproducibility of RR measurements may be limited by significant interobserver variability.43,44 Clinicians should recognize this inherent variability and interpret the RR with caution. Rates obtained by nurses versus medical students varied significantly, as did those obtained by medical students versus residents and attending clinicians.45 Interobserver variability may account for a difference of up to 6 breaths/min, and variability in the same observer may account for up to 5 breaths/min.45 A study comparing RRs obtained by triage nurses with an electronic monitor found that neither provided an accurate measurement of the RR in the ED, thus suggesting that new clinical strategies for obtaining this vital sign may be necessary.46
Current texts vary considerably in their definition of a normal RR and cite published values that range from 8 to 24 breaths/min. In a study that specifically investigated normal RRs in an ED (afebrile ambulatory patients without respiratory complaints), females had a mean RR of 20.9 breaths/min and males had a mean RR of 19.4 breaths/min. The researchers concluded that a normal RR in the adult patient population was 16 to 24 breaths/min.45 Other studies have provided additional information on normal resting and sleep-state RRs in children younger than 7 years.9–14 RRs obtained with a stethoscope were higher than those obtained by observation (mean difference, 2.6 breaths/min in awake and 1.8 breaths/min in asleep children). Smoothed percentile curves demonstrated a larger dispersion at birth (5th percentile, 34 breaths/min; 95th percentile, 68 breaths/min), whereas dispersion was less at 36 months of age (5th percentile, 18 breaths/min; 95th percentile, 30 breaths/min).
The RR will generally increase in the presence of fever. It is often difficult to determine whether tachypnea is a primary finding or is simply associated with hyperpyrexia. A study of children younger than 2 years in whom pneumonia was subsequently diagnosed found that age-appropriate limits for resting tachypnea in the presence of fever could be defined. A sensitivity of 74% and specificity of 77% for pneumonia were found when children 6 months of age had an RR higher than 59 breaths/min, when those aged 6 to 11 months had an RR higher than 52 breaths/min, and when those 1 to 2 years old had an RR higher than 42 breaths/min.47 Even in the face of physiologic compensation for fever, interpretation of the RR alone can help predict the presence of pulmonary disease.
Respiratory Pattern and Amplitude
Hyperventilation and hypoventilation can result from an extensive variety of disorders and may be related to pulmonary or extrapulmonary pathology. Abnormal respiratory patterns can be characteristic of metabolic or central nervous system pathologic conditions (Fig. 1-1) and may aid in the differential diagnosis. Kussmaul respirations describe the hyperventilation pattern seen in diabetics with ketoacidosis. Hyperpnea, or a normal RR but clinically significant hyperventilation secondary to increased tidal volume, may be seen with salicylate poisoning.48
Figure 1-1 Abnormal respiratory patterns. CVA, cerebrovascular accident; RR, respiratory rate. (Adapted from Breathing Patterns. © 2011—D’Urbano J—Breath Sounds. Available at http://www.BreathSounds.org.)
Observe the respiratory patterns carefully in children. In infants it is essential to distinguish normal periodic breathing from apnea. By definition, periodic breathing consists of three or more respiratory pauses longer than 3 seconds in duration with less than 20 seconds between pauses. There is no associated bradycardia or cyanosis. This contrasts with apnea, which is a particular problem in preterm infants. Apnea is defined as a respiratory pause longer than 20 seconds. It may be associated with bradycardia and hypoxia.42 Periodic breathing and apnea are believed to be disorders on a continuum, both stemming from abnormal physiologic control of respiration. Periodic breathing is considered a benign disorder, but infants with symptomatic apneic episodes that result in apparent life-threatening events are thought to be at increased risk for sudden infant death syndrome.49
Pulse
Indications and Contraindications
Assessment of blood flow by palpation of the pulse can be used to gauge the presence of cardiac contractility and not just the electrical rhythm. Caution should be taken to not over-generalize the presence or strength of a pulse in predicting blood pressure. The necessity for repeated pulse evaluations is dictated by the clinical complaint and the status of the patient. Continuous monitoring is not routine but may be helpful when the clinical situation may predict significant variability in heart rate, as in the setting of sepsis.50 An association between absence of a radial pulse or absence of both radial and femoral pulses and hypotension has been demonstrated in hypovolemic trauma patients. The variability in individual response prohibits the use of this parameter as an absolute gauge of blood pressure.51
Procedure
Depending on the clinical scenario, pulses are palpable at numerous sites, although for convenience the radial pulse at the wrist is routinely used. Use the tips of the first and second fingers to palpate the pulse. The two advantages of this technique are that (1) the fingertips are quite sensitive, thereby enabling the pulse to be located easily and counted, and (2) the examiner’s own pulse may be erroneously counted if the thumb is used instead of the first and second fingers. Pulses are also easily palpated at the carotid, brachial, femoral, posterior tibial, and dorsalis pedis arteries. Palpate the pulse at the brachial artery to appreciate its contour and amplitude. Locate the pulse at the medial aspect of the elbow and note that it is more easily palpated when the elbow is held slightly flexed.52 Determine the pulse rate by counting for 1 minute, particularly if any abnormality is present. Common convention in the acute care setting is to count a regular pulse for 15 seconds and multiply the resulting number by 4 to determine the beats per minute.
In newborns, use direct heart auscultation and umbilical palpation as the methods of choice to determine the heart rate. Instantaneous changes in newborn heart rates are best indicated to the resuscitation team by the clinician tapping out each heartbeat.53 In unstable children, palpate the central arteries, particularly the femoral and brachial pulses, instead of the more peripheral arteries. In a comparison of four methods of determining the heart rate in infants, listening at the apex of the heart was found to be more accurate than palpation of the brachial, carotid, or femoral pulses.54 Of the sites for palpation of the heart rate, the femoral artery has proved most valuable, especially in hypotensive infants.55
Interpretation
Consider the individual’s physiology when interpreting the pulse. In infants and children, interpret the pulse rate with reference to age (See Table 1-1). Pulse varies with respiration: it increases with inspiration and slows with expiration. This is known as sinus dysrhythmia and is physiologic.
Although bradycardia is defined as a heart rate lower than 60 beats/min in adults, a well-conditioned athlete may have a normal resting heart rate of 30 to 40 beats/min.56,57 As discussed earlier, a redefinition of bradycardia to less than 45 beats/min and tachycardia to greater than 95 beats/min has been proposed based on a normal healthy population.24,58 Such definitions include 95% of the population and do not address any given individual’s normal baseline rate.
Heart Rhythm
In addition to determining the pulse rate, obtain information about the regularity of the pulse by palpation. An irregular pulse suggests atrial fibrillation or flutter with variable block, and accurate assessment of the pulse should be done by auscultation of the apical cardiac sounds. The apical pulse is frequently greater than the peripheral pulse because of inadequate filling time and stroke volume, with resultant nontransmitted beats. A greater pulse deficit generally reflects more severe disease.59
Pulse Amplitude and Contour
Accurate examination and description of pulse amplitude and contour can provide additional clinical information and aid in decision making. Superimposition of one pathophysiologic state on another may modify the pulse. For example, sepsis may result in variable pulse amplitudes, depending on the stage in the development of the disease at initial evaluation of the patient. Early in sepsis, cardiac output increases and vascular resistance decreases, which causes bounding pulses. In advanced sepsis or septic shock, falling cardiac output and increased vascular resistance are seen, and pulses are diminished.60 Definable age-related changes in pulse amplitude and contour can be identified. Such changes are due to an increase in arterial stiffness, which results in increased pulse wave velocity and progressively earlier wave reflection. This leads to increased pulse amplitude in the elderly at all commonly measured sites (carotid, femoral, and radial).60 In addition to these age-related changes, pulse wave analysis may be useful in determining arterial stiffness and the likelihood of atherosclerotic disease in a vascular laboratory setting.61 Weak pulses can be a significant finding in patients with hypotension if present globally or an indication of limb ischemia if isolated to one extremity. Bounding pulses can be seen with a widened pulse pressure, which is discussed later in the section on blood pressure. Routine measurement of pulse amplitude is not reproducible by simple palpation and requires instrumentation not available in EDs.
Pulses during Cardiopulmonary Resuscitation
Palpated “femoral pulses” during chest compression may represent either forward arterial blood flow or “to-and-fro” movement of blood from the right side of the heart to the venous system. A carotid pulse is preferred when assessing the adequacy of chest compressions during cardiopulmonary resuscitation (see Chapter 17).
Arterial Blood Pressure
Changes in arterial blood pressure over time may indicate success of treatment or worsening of the patient’s overall condition. An abrupt reduction in a patient’s arterial blood pressure usually indicates the need for immediate intervention or reconsideration of therapy. The current section discusses indirect blood pressure monitoring, and intraarterial techniques are considered elsewhere. Discussion of the specific use of the Doppler device for measurement of pulse and blood pressure and for measurement of orthostatic blood pressure and changes in pulse follow this section. Despite an association between the absence of hypotension and a radial pulse or between hypotension and the absence of both radial and femoral pulses, in the setting of trauma, the variability in individual response prohibits the use of this parameter as an absolute gauge of blood pressure.52
Physiology
Arterial blood pressure indicates the overall state of hemodynamic interaction between cardiac output and peripheral vascular resistance. Arterial blood pressure is the lateral pressure or force exerted by blood on the vessel wall. It indirectly measures perfusion, and blood flow equals the change in pressure divided by resistance. Because peripheral vascular resistance varies, a normal blood pressure does not confirm adequate perfusion.62 Mean arterial blood pressure (MAP) can be estimated by adding one third of the pulse pressure (i.e., the difference between systolic and diastolic blood pressure) to diastolic pressure or by using the following measure.63
Indications and Contraindications
Patients with minor ambulatory complaints unrelated to the cardiovascular system may not necessarily need their blood pressure measured in the ED, but those with hemodynamic instability need frequent monitoring of blood pressure. In children there is a significant amount of variability regarding standard situations that require measurement of blood pressure. In general, the younger the patient, the less likely blood pressure will be measured.64,65 In newborns, infants, and even toddlers, capillary refill is sometimes substituted for standard blood pressure measurement, although viewing these tests as equivalent can lead to significant errors.
In low-flow states, Doppler measurement of blood pressure may be obtained rapidly. Repeated measurements will provide an evaluation of the adequacy of resuscitation in patients whose blood pressure cannot be auscultated by standard techniques and in those in whom intraarterial blood pressure measurements are either contraindicated or technically unobtainable.66,67 Placing a catheter for direct intraarterial measurement of blood pressure has a higher risk for complications, but it may be performed safely in the ED. In particular, direct measurement of arterial pressure during pulseless electrical rhythms may help discriminate between severe shock and otherwise nonresuscitatable status.68 Alternative noninvasive devices for continuous blood pressure measurement (CBPM) have been introduced clinically, with varying success. One common method of CBPM uses finger cuffs equipped with infrared (IR) photoplethysmography and sophisticated technology for quantification of finger blood pressure levels. Finapres (Ohmeda, Madison, WI) was the first commercial product using this technique, and several newer products are on the market today. A number of commercial systems use an alternative method of arterial applanation tonometry to measure CBPM. Further study is needed for solid validation of devices using these techniques.69,70
Equipment
Cuff Type
The equipment required for indirect blood pressure measurement includes a sphygmomanometer (cuff with an inflatable bladder, inflating bulb, controlled exhaust for deflation, and manometer) and a stethoscope, Doppler device (for auscultation), or oscillometric device.71–74 A common practice in the prehospital and interhospital transport setting is to forego auscultatory blood pressure measurements with a stethoscope and instead obtain systolic values only by palpation of the first Korotkoff sound. This practice, though sometimes the only feasible method of obtaining any value in a noisy environment, poses a significant potential for error. In a study of critically ill patients transferred between hospitals, palpated systolic blood pressure values underestimated manometric values by nearly 30%.
According to the American Heart Association guidelines, the sphygmomanometer cuff should be an appropriate size for the patient to ensure an accurate reading. The width of the bladder should be at least 40% of the distance of the limb’s midpoint (i.e., from the acromion process to the lateral epicondyle). This published figure of the ideal width, when studied in a validation review, may be higher, up to approximately 50%.75 The length of the bladder should be 80% of the midarm circumference or twice the recommended width.66 Discrepancies in matching upper arm size with cuff size have been demonstrated to produce significant errors in critically ill populations when compared with invasive intraarterial blood pressure measurements.76 The availability of appropriately sized cuffs appears to be a pervasive problem, especially since about 80% of patients do not fit the standard 12-cm large cuffs.77 In one study, 90% of aneroid devices had only one size of cuff available.78 A second study phase from this group showed no marked improvement in agreement of oscillatory and invasive measurements despite correct cuff size.79
Manometers require annual servicing. Mercury columns may require the addition of mercury to bring the edge of the meniscus to the zero mark. The air vent or filter at the top of the mercury column should also be checked for clogging. An aneroid manometer should be calibrated against a mercury column at least yearly. If the aneroid indicator is not at zero at rest, the device should not be used.80 Digital manometers may not be validated for all patient groups and could give inaccurate readings.
Automatic sphygmomanometers may improve physiologic monitoring with their alarm and self-cycling capabilities. They offer indirect arterial blood pressure measurement with little pain and without the risks associated with invasive arterial lines.81 Accuracy of measurements does not suffer during rapid cycling, but the potential for vascular injury from nearly continuous arterial compression dictates that most automated blood pressure units will revert back to less frequent (i.e., every 15 to 20 minute) cycling as a safety precaution. Oscillometric blood pressure monitors detect motion of the blood pressure cuff transmitted from the underlying artery. A sudden increase in the amplitude of arterial oscillations occurs with systolic pressure and MAP, and an abrupt decrease occurs with diastolic pressure.82
In adult patients, numerous studies have focused on the reliability of auscultatory versus automated blood pressure measurements. Mercury column versus Dinamap readings showed increased disparity with systolic blood pressure greater than 140 mm Hg, the range at which accuracy should be most rigorously sought to correctly identify hypertension. In general, automated blood pressure devices yield higher systolic and lower diastolic blood pressure.83 The range of error in automated devices was, on average, 4.0 to 8.6 mm Hg.84,85 Unfortunately, these studies represent populations without critical illness and do not reflect the accuracy of readings at the extremes of hypertension and hypotension, thus making generalization to an ED population difficult.85,86
Procedure
Obtain indirect blood pressure measurements at the patient’s bedside by palpation, auscultation, Doppler, or oscillometric methods. The technique is straightforward and accurate when the equipment is well maintained, calibrated, and used by clinicians who follow accepted standards. The patient may be lying or sitting, as long as the site of measurement is at the level of the right atrium and the arm is supported.66,74 Unless the arm is kept perpendicular to the body with the elbow resting on a desk, measurements will be 9 to 14 mm Hg higher, regardless of body position.75,87 Allowing the arm to be parallel to the body when supine but supporting the arm perpendicular to the body when measuring blood pressure may create a pseudo-drop in blood pressure. These changes are thought to be dependent on the mechanical properties of the arteries themselves and not associated with hydrostatic pressure alone.88
To palpate arterial blood pressure, inflate the cuff to 30 mm Hg above the level at which the palpable pulse disappears. Once properly inflated, palpate directly over the artery and deflate the cuff at a rate of 2 to 3 mm Hg/sec. Report the initial appearance of arterial pulsations as the palpable blood pressure. This practice, known as the Riva-Rocci palpatory technique, has shown mixed results in yielding accurate estimations of blood pressure. One study determined that the average underestimation of systolic blood pressure was 6 mm Hg.89 Another operative study looking at the combination of palpated systolic blood pressure and observed visual return of continuous pulse oximetry reported an underestimation of 10 to 20 mm Hg.85 The same technique is used with the Doppler device, but the palpated pulse is replaced with the Doppler auditory signal. Measurement of arterial pressure by palpation and Doppler yields only estimates of systolic blood pressure. The Doppler method is preferred when determining blood pressure in infants.86
When auscultating blood pressure at the brachial artery, apply the blood pressure cuff about 2.5 cm above the antecubital fossa with the center of the bladder over the artery.74 Apply the bell of the stethoscope directly over the brachial artery with as little pressure as possible.90 Systolic arterial blood pressure is defined as the first appearance of faint, clear, tapping sounds that gradually increase in intensity (Korotkoff phase I). Diastolic blood pressure is defined as the point at which the sounds disappear (Korotkoff phase V).74–91 In children, phase IV defines diastolic blood pressure (Fig. 1-2).7 Phase IV is marked by a distinct, abrupt muffling of sound when a soft, blowing quality is heard.
It is best to measure by auscultation over the brachial artery because of accepted standardization of the measured values. Alternative sites include the radial, popliteal, posterior tibial, or dorsalis pedis arteries, although any fully compressible extremity artery may be used. Studies evaluating direct and indirect blood pressure measurements have demonstrated good correlation between these methods.92,93
It may not be feasible to obtain upper extremity blood pressure measurements because of patient access issues, particularly those encountered in the prehospital setting. Forearm measurements may be obtained more easily and show fair correlation to standard upper extremity values (within 20 mm Hg in 86% of systolic measurements and 94% of diastolic measurements).94 Alternatively, noninvasive finger blood pressure measurements have shown promise when compared with standard upper extremity readings. The overall discrepancy in an ED study was 0.1 mm Hg with a standard deviation of ±5.02 mm Hg when comparing finger blood pressure and invasive MAP via radial artery cannulation.95
Novel noninvasive continuous finger cuff technology offers the benefit of uninterrupted monitoring and has the advantage over invasive techniques of being safer and immediately available. Noninvasive finger cuff measurements have shown reasonable correlation, even in critically ill populations in the ED.70 Wrist blood pressure has shown to have good average accuracy in the surgical environment when compared with oscillometric devices. Patient comfort is reported to be greater with these devices. The typically stated contraindications to the acquisition of upper arm blood pressure (limitation after mastectomy, etc.) may not apply.96
The accuracy of the palpatory, Doppler, and oscillometric methods has also been investigated.97–99 When phase I and V Korotkoff sounds are used, indirect methods typically underestimate systolic and diastolic pressure by several millimeters of mercury.97–100 During shock, the palpatory and auscultatory methods underestimate simultaneous direct arterial pressure measurements.101 The flush method, in which return of color after deflation of the cuff is used to estimate blood pressure in infants, may underestimate systolic blood pressure by up to 40 mm Hg.102 This method is unreliable and not recommended.
Complications
Complications of indirect blood pressure measurements are minimal when the proper procedure is followed. Inadvertent prolonged application of an inflated blood pressure cuff may result in falsely elevated diastolic pressure and ischemia distal to the site of application.76 Invasive blood pressure monitoring is associated with a number of potential problems (see Chapter 20).
Interpretation
Normal blood pressure increases with decreasing distance from the heart and aorta. Blood pressure tends to increase with age and is generally higher in males. Individual factors that influence blood pressure include body posture, emotional or painful stimuli, environmental influences, vasoactive foods or medications, and the state of muscular and cerebral activity. Exercise and sustained isometric muscular contraction increase blood pressure in proportion to the strength of the contraction. A normal diurnal pattern of blood pressure consists of an increase throughout the day with a significant, rapid decline during early, deep sleep.103
Normal lower limits of systolic blood pressure in infants and children can be estimated by adding 2 times the age (in years) to 70 mm Hg. The 50th percentile for a child’s systolic arterial blood pressure from 1 to 10 years of age can be estimated by adding 2 times the age (in years) to 90 mm Hg. Children older than 2 years are considered hypotensive when systolic blood pressure is less than 80 mm Hg.104 Children are able to maintain MAP until very late during shock.105 The finding of a normal blood pressure in a child with signs of poor perfusion should not dissuade the clinician from appropriate treatment. Most adults are considered hypotensive if systolic blood pressure is lower than 90 mm Hg, but some individuals normally exhibit a systolic pressure in that range. In the elderly, the presence of normotension within defined or published limits may not be reassuring. When considering systolic blood pressure cutoffs for trauma patients, 85 mm Hg for patients aged 18 to 35, 96 mm Hg for patients aged 36 to 64, and 117 mm Hg for those older than 65 have been proposed as new standards for hypotension.20 When accompanied by signs of shock, immediate treatment is indicated. In patients with shock, blood flow cannot be reliably inferred from heart rate and blood pressure values.106,107
Hypertension
Adults are hypertensive if either systolic or diastolic pressure consistently exceeds 140 or 90 mm Hg, respectively.108,109 A meta-analysis showed strong correlation of blood pressure to vascular and overall mortality down to at least 115/75.110 Some authors have suggested altering the blood pressure definitions to include an “optimal” blood pressure of 115/75.15 Other authors have suggested incorporating blood pressure into a global cardiovascular risk assessment that includes other associated risk factors.16,17 The applicability of population norms for hypertension in a stressful emergency situation is controversial. One should not make diagnostic or therapeutic decisions based solely on an abnormal initial measurement. Patients with hypertension require repeated measurements to assess whether therapy is required in the ED. Because sustained hypertension may be seen in more than a third of initially hypertensive ED patients, careful evaluation and follow-up are required.111 The phenomenon of white coat hypertension (WCH) is defined as a persistent elevation in blood pressure in the clinical setting only. The prevalence of WCH is between 20% and 94%, depending on the frequency of reassessment of the clinical setting.112 It is unclear whether patients who have isolated hypertension in the clinical setting (WCH) are at increased risk for the development of hypertension and subsequent end-organ damage.113
Measurement Errors
Erroneous blood pressure measurements may result from several factors.114 Falsely low blood pressure may be caused by using an overly wide cuff, by placing excessive pressure on the head of the stethoscope, or by rapid cuff deflation.115,116 Falsely high blood pressure may be caused by the use of an overly narrow cuff, anxiety, pain, tobacco use, exertion, an unsupported arm, or slow inflation of the cuff.117 There appears to be a statistically significant difference in the error rate associated with patients weighing more than 95 kg, whether from obesity or as a result of muscular upper arms from body building.118,119
Of note, 41% of adults observed at the University of Pittsburgh required non–standard-sized cuffs, and the use of small cuffs was associated with a mean error of 8.5 and 4.6 mm Hg in systolic and diastolic pressure, respectively.116 Other studies have confirmed relatively high rates of inappropriately diagnosed hypertension in obese patients based on erroneous cuff size.118 Other specific study populations in this area have been critically ill patients, in whom disparate cuff size can lead to significant inaccuracies based on arm circumference.82
Hypotensive patients have unreliable Korotkoff sounds, but Doppler measurements are well correlated with direct arterial systolic pressure measurements in hypotensive patients.120 An auscultatory gap can be appreciated in hypertensive patients and may mislead the clinician. It is heard during the latter part of phase I and should not be confused with diastolic readings. Auscultation until the manometer reading approaches zero should prevent misinterpretation. In patients with aortic insufficiency or hyperthyroidism, in those who have just finished exercising, and in children younger than 5 years, measurement of diastolic blood pressure should occur at Korotkoff phase IV. Extremes of blood pressure, both hypotension and hypertension, have been found to be factors contributing to measurement errors in critically ill pediatric patients. Predictably falsely high readings for noninvasive versus invasive measurements have been obtained in hypotensive patients and falsely low values in hypertensive states.121
Hemiplegic patients may exhibit different blood pressure in the affected and unaffected arms.122 A flaccid extremity tends to yield lower systolic and diastolic pressure, whereas a spastic extremity tends to yield higher values than the extremity with normal motor tone. Although these differences are generally small, it is preferable to monitor blood pressure in the unaffected limb.
Numerous errors may occur in the accurate measurement of blood pressure. The only way to combat them is to first be cognizant of practices contributing to them. Unfortunately, few nurses can identify causes of potentially erroneous readings. In a study examining nurses’ ability to obtain accurate readings, proper technique in determining systolic blood pressure could be identified 61% of the time; diastolic blood pressure, 71% of the time; and an auscultatory gap, 54% of the time. Nurses were able to correctly identify faulty equipment 58% of the time, assess cuff size 57% of the time, determine appropriate inflation pressure 29% of the time, note the appropriate deflation rate 62% of the time, and determine correct arm positioning 14% of the time.123
With the increasing number of patients with heart failure, those receiving bridging measures to transplantation, or those treated with long-term circulatory augmentation devices in the form of left ventricular assist devices (LVADs), it useful to understand the difficulty in interpreting blood pressure measurements in these patients. All types of VADs fit into two categories: (1) pulsatile and (2) nonpulsatile. Pulse and blood pressure readings in patients with pulsatile VADs (Thoratec, HeartMate IP and VE, Novacor) are comparable to values in the general non-VAD population. Nonpulsatile VADs (Levitronix Centri Mag, Tandem Heart, Impella, DeBakey LVAD, HeartMateII) function by either centrifugal or axial blood flow, and this has a significant impact on the ability to detect pulses.124 Typically, these patients appear to be perfusing well with adequate skin warmth and capillary refill even though pulses may be absent. Blood pressure readings can be obtained with these nonpulsatile flow devices, but diastolic blood pressure, pulse pressure values, and MAP vary significantly depending on the speed of the pump.125
Differential Brachial Artery Pressure
The presence of a systolic blood pressure differences of 10 to 20 mm Hg between the arms suggests a normal condition. If greater, it may indicate advanced focal atherosclerosis, coarctation of the aorta proximal to the left subclavian artery, type A aortic dissection, aortic arch syndromes, or other vascular processes preferentially affecting one extremity. The utility of upper extremity bilateral blood pressure measurements has recently come into question. One study found a 10-mm Hg systolic or diastolic difference in 53% of patients in the emergency setting and a 20-mm Hg or higher difference in 19% of patients.126 Although these numbers have not generally been found to be of this magnitude in metaanalysis,127 the unique setting of the study in the ED makes correlation particularly salient for the emergency physician. The reliability of peripheral pulse deficits in diagnosing or excluding type A aortic dissection is a frequently cited reason for evaluating blood pressure in both arms. In a metaanalysis, Teece and Hogg noted that the absence of a clinical pulse deficit to exclude thoracic dissection in patients with chest pain was just 31%, and the authors concluded that peripheral pulse deficits are far too insensitive to warrant their use as a means of excluding thoracic aortic dissection in patients with chest pain.128 Given that many in the general population have significant differences in blood pressure in each arm, the diagnostic value of this frequently cited indication for obtaining bilateral brachial blood pressure is unproven. Essentially, most patients with a type A aortic dissection will not have a measurable blood pressure discrepancy between the arms, and most of those who do have such a finding will not have dissection.
Brachial pressure differences did not appear to be linked to age, gender, race, MAP, cardiovascular risk, or final discharge diagnosis. Smaller interarm differences have been reported in the ED setting (18% in hypertensive patients and 15% in normotensive patients when a cutoff greater than 10 mm Hg was used).18,19 Though not tested, a method proposed to minimize these differences in the ED is to take simultaneous blood pressure readings from both the left and right extremities with two calibrated automated blood pressure units.129
Pulsus Paradoxus
Normal respiration briefly decreases systolic blood pressure by approximately 10 mm Hg during inspiration. Pulsus paradoxus occurs when there is greater a than 12–mm Hg decrease in systolic blood pressure during inspiration. Pulsus paradoxus may occur in patients with chronic obstructive pulmonary disease, pneumothorax, severe asthma, or pericardial tamponade.101
To measure a paradoxical pulse, have the patient lie comfortably in the supine position at a 30- to 45-degree angle and breathing normally in an unlabored fashion (which are unusual conditions in a patient suspected of having cardiac tamponade, severe asthma, chronic obstructive pulmonary disease, or pneumothorax).130 Inflate the blood pressure cuff well above systolic pressure and slowly deflate it until the systolic sounds that are synchronous with expiration are first heard (Fig. 1-3). Initially, the arterial pulse will be heard only during expiration and will disappear during inspiration. Deflate the cuff further until arterial sounds are heard throughout the respiratory cycle. Palpation at the radial or femoral arteries may yield complete disappearance during inspiration. When present, this technique is a quick bedside confirmation of the possibility of severe tamponade.
An alternative method for determination of pulsus paradoxus is by visually observing loss of the pulse oximetry waveform and then its reappearance.131 The plethysmographic method has been validated in intensive care unit settings.
If the difference between inspiratory and expiratory pressure is greater than 12 mm Hg, the paradoxical pulse is abnormally wide.130,131 Most patients with proven tamponade have a difference of 20 to 30 mm Hg or greater during the respiratory cycle.130–132 This may not be true of patients with very narrow pulse pressures (typical of advanced tamponade), who have a “deceptively small” paradoxical pulse of 5 to 15 mm Hg.132–134
Pulsus paradoxus has been correlated with the amount of impairment of cardiac output by tamponade. In an uninjured patient with pericardial effusion, a pulsus paradoxus greater than 25 mm Hg (in the absence of relative hypotension) is both sensitive and specific for moderate or severe versus mild tamponade.130,135 An echocardiographic study found that an abnormal pulsus paradoxus had a sensitivity of 79%, a specificity of 40%, a positive predictive value of 81%, and a negative predictive value of 40% for right ventricular diastolic collapse.135–137 The absence of a paradoxical pulse does not rule out tamponade.
In the pediatric population, pulsus paradoxus has been studied to determine the severity of obstructive and restrictive pulmonary disease,136 most commonly asthma. A value of 15 mm Hg or greater correlates well with the clinical score, peak expiratory value, flow rate, oxygen saturation, and subsequent need for admission.137
Despite the disease entities that a widened pulsus paradoxus may suggest, it is a difficult test to perform adequately with only a sphygmomanometer. Because it is a useful clinical tool, new aids should be developed and used to reliably predict this important vital sign.138
Shock Index
The ratio of pulse rate to systolic blood pressure has been suggested as a measure of clinical shock. The shock index (SI) has a normal range of 0.5 to 0.7. Although calculating the SI is not standard of care in the ED, a number of clinical scenarios have been studied in which the SI can be used as a predictor of severe illness or injury. An SI above 0.85 to 0.90 suggests acute illness in medical patients and a marked increase in the potential for gross hemodynamic instability in trauma patients.139–142 The SI has been studied for use in a variety of clinical scenarios from severe pneumonia to first-trimester risk for ectopic pregnancy to sepsis. It has been found to be a valid gauge of the severity of illness.143–145 Some studies, however, have found that the initial pulse rate alone had nearly the same predictive power as the SI for the severity of illness. Although the SI appears to correlate with the left ventricular stroke work index, it has little correlation with systemic oxygen transport in patients with hemorrhagic and septic shock.146
Doppler Ultrasound for Evaluation of Pulse and Blood Pressure
Indications and Contraindications
Doppler ultrasound is commonly used in the ED for the measurement of blood pressure in low-flow states, evaluation of lower extremity peripheral perfusion, and assessment of fetal heart sounds after the first trimester of pregnancy. Doppler’s sensitivity allows detection of systolic blood pressure down to 30 mm Hg in the evaluation of a patient in shock. In a patient with peripheral vascular disease in whom there is concern about the adequacy of peripheral perfusion, the ankle-brachial index provides a rapid, reproducible, and standardized assessment.145
[/not-level-membership-for-emergency-medicine-category]
