The Mechanisms of Insulin Action
Insulin, Insulin-Like Growth Factors, and Their Receptors
Genetic Validation of the IRS-Based Insulin Signaling Cascade
Modulation of Insulin Signaling by Protein and Lipid Phosphatases
Regulation of Protein Synthesis by Insulin
Insulin-Regulated Glucose Transport
Heterologous Regulation of the IRS Proteins
Physiology of Insulin Resistance
Insulin-like signaling integrates the storage and release of nutrients with somatic growth during development and in adult life. It is a feature of all metazoans, revealing a common mechanism used by animals to integrate metabolism and growth with environmental signals.1,2 Lower animals have a wide array of insulin-like peptides—seven in fruit flies and 38 in Caenorhabditis elegans—that apparently bind to a single insulin-like receptor tyrosine kinase to control metabolism, growth, reproduction, and longevity3: In honey bees, insulin-like signaling coordinates division of labor.4 The human genome also encodes a superfamily of structurally related insulin-like peptides. Insulin, insulin-like growth factor 1 (IGF-1), and insulin-like growth factor 2 (IGF-2) activate a family of receptor tyrosine kinases; however, seven structurally similar relaxin-like peptides are functionally distinct and activate G protein–coupled receptors.5,6
Mammalian insulin is released from pancreatic islet β cells in response to circulating glucose concentrations. Endocrine IGF-1 is largely secreted from hepatocytes stimulated by nutrients and growth hormone; IGF-1 and IGF-2 are also produced locally in many tissues and cells, including the central nervous system.7 Although insulin has a major role in metabolic regulation, IGF-1 and IGF-2 can work coordinately with insulin to regulate nutrient homeostasis, insulin sensitivity, and pancreatic β-cell function.7,8 Nevertheless, owing to their primarily mitogenic role, dysregulation of IGF-1 and IGF-2 signaling contributes to cancer, whereas dysregulated insulin signaling leads to diabetes.
Diabetes is a complex disorder that arises from various causes, including impaired glucose sensing or insulin secretion (maturity-onset diabetes of the young [MODY]), autoimmune-mediated β-cell destruction (type 1 diabetes), or insufficient β-cell insulin secretory capacity to compensate for peripheral insulin resistance (type 2 diabetes).9 MODY is caused by mutations in genes necessary for β-cell function, including hepatocyte nuclear factor 4α (HNF4A; MODY1), glucokinase (MODY2), hepatocyte nuclear factor 1α (HNF1A; MODY3), pancreatic and duodenal homeobox 1 (Pdx1; MODY4), hepatocyte nuclear factor 1β (HNF1B; MODY 5), or neurogenic differentiation 1 (NEUROD1; MODY6).10–12 By comparison, the autoimmunity of type 1 diabetes is genetically complex and marked by circulating autoantibodies against a variety of islet antigens. Insulin is thought to be one of the principal autoantigens in the pathogenesis of type 1 diabetes, but other antigens deserve attention.13,14 Since new β-cell formation occurs slowly while type 1 diabetes progresses, it might be possible to treat the disease by accelerating the rate of β-cell regeneration while attenuating the autoimmune response.15
Type 2 diabetes is the most prevalent form of diabetes. Although it typically manifests at middle age, type 2 diabetes in the developed world is becoming more common in children and adolescents.16 Physiologic stress—the response to trauma, inflammation, or excess nutrients—promotes type 2 diabetes by activating pathways that impair the postreceptor response to insulin in various tissues.17,18 Genetic variation also modifies the response to environmental and nutritional factors that promote type 2 diabetes. In a few informative cases, mutations in the insulin receptor or AKT2 explain severe forms of insulin resistance.19 Generally, however, type 2 diabetes depends on multiple gene variants with modest effects upon insulin action: peroxisome proliferator–activated receptor gamma (PPARG), peroxisome proliferative–activated receptor gamma, coactivator 1 alpha (PPARGC1A), inward rectifying K+ channel Kir6.2 (KCNJ11), calpain 10 (CAPN10), transcription factor 7-like 2 (TCF7L2), adiponectin (ADIPOQ), adiponectin receptor 2 (ADIPOR2), hepatocyte nuclear factor 4 α (HNF4A), uncoupling protein 2, (UCP2), sterol regulatory element binding transcription factor 1 (SREBF1), or high-plasma interleukin (IL)-6 concentrations.20 Although the effect of each gene is small, these discoveries provide important clues to the pathogenesis of type 2 diabetes.21
Regardless of the underlying etiology, dysregulated insulin signaling, exacerbated by chronic hyperglycemia and compensatory hyperinsulinemia, promotes a cohort of acute and chronic sequelae.22,23 Untreated diabetes progresses to ketoacidosis (most frequent in type 1 diabetes) or hyperglycemic osmotic stress (most frequent in type 2 diabetes), which are immediate causes of morbidity and mortality.24 In the long term, diabetes is associated with chronic life-threatening complications, including reduced cardiovascular function and systemic oxidative stress that damages capillary endothelial cells in the retina, mesangial cells of the renal glomerulus, and the peripheral nerves.25,26 Diabetes is also associated with age-related degeneration in the central nervous system.27 Humans beyond 85 to 90 years of age display less insulin resistance than expected—and centenarians are surprisingly insulin sensitive.28 Most centenarians escape age-related diseases associated with insulin resistance (e.g., cardiac disease, stroke, and diabetes).29,30 The best means to coordinate nutrient homeostasis and insulin signaling with strategies that consistently promote longevity across all metazoans remains to be established.31
Insulin, Insulin-Like Growth Factors, and Their Receptors
Insulin is synthesized as a single polypeptide called proinsulin that is processed into the disulfide-linked A and B chains of mature insulin and the excised C-peptide. Insulin possesses two asymmetric receptor binding surfaces designated S1 and S2 (Fig. 8-1A). Referred to as the “classical site,” S2 is defined by residues from the A and B chain, including AsnA21, GlyB23, PheB24, PheB25, and TyrB26 (see Fig. 8-1A).32 Systematic analysis by site-directed mutagenesis reveals a distinct binding surface (S1) that is necessary for high-affinity receptor binding. S1 includes amino acid residues outside the classical site, especially LeuA13 and LeuB17 (see Fig. 8-1A). Insulin binding kinetics suggest that S1 binds to the receptor before S2.32 Human IGF-1 and IGF-2 display high sequence similarity to both the A and B chains of insulin but retain the homologous connecting peptide; IGFs also have an extension at the C-terminus known as the D-domain.33
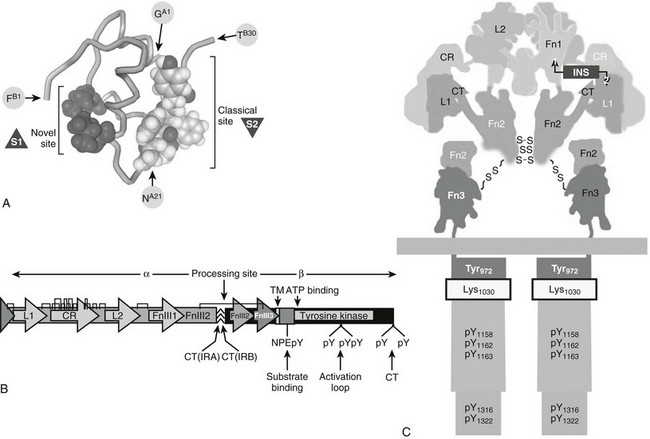
FIGURE 8-1 Insulin and insulin receptor structure. A, Insulin structure showing the position of critical amino acids that compose the two binding surfaces (S1ins and S2ins) that interact with the L1 and L2 regions of the insulin receptor. B, A linear diagram of the insulin receptor (IR) precursor protein showing the position of important modules in the α and β subunits, which are generated by cleavage at the processing site: insulin contact points (L1 and L2), cysteine-rich region (CR), disulfide bonds,  the IRA/IRB splice site (CT-IRA/-IRB), transmembrane region (TM), juxtamembrane insulin receptor substrate binding motif (NPXpY), site of receptor auto-tris-phosphorylation (activation loop), and carboxyl-terminal tyrosines (CT). C, Diagram of the mature insulin receptor composed of two extracellular α subunits and two largely intracellular β subunits. Contiguous modules of the two α subunits are indicated by black or white letters. The holoreceptor is stabilized extracellularly by disulfide bonds between cysteine residues (S-S) in the α and β subunits as well as by noncovalent interactions. Regions within the α subunit that contribute to insulin binding include the L1 and L2 regions and the extra 12 amino acids encoded by exon 11, found only in the B form of the insulin receptor. The β subunit contains the tyrosine kinase catalytic domain with an ATP binding site (Lys1030) and a number of tyrosine phosphorylation sites, including those in the juxtamembrane region (pY972), activation loop (pY1158, 1162, 1163), and carboxyl-terminal regions.
The mammalian receptors for insulin (IR) or insulin-like growth factors (IGF1R) are composed of an extracellular ligand-binding domain that regulates the activity of an intracellular tyrosine kinase.34–36 Most receptor tyrosine kinases are activated by ligand-induced dimerization that promotes tyrosine phosphorylation of the kinase-activation loop (A-loop) and other sites that recruit cellular substrates.37 However, the homologous IR and IGF1R reside in the plasma membrane as inactive covalent dimers. High-affinity insulin or IGF binding adds a transient cross-link to stabilize the active conformation, which promotes autophosphorylation and exposes the catalytic domain to other cellular proteins.38–40
The IR is encoded by a 150-kb gene on human chromosome 19p13.3-p13.2 that contains 22 exons. Exon 11 is alternatively spiced, depending upon the tissue and developmental stage, to produce two IR isoforms: IRA lacks the residues encoded by exon 11, and IRB includes the 12-amino-acid residues encoded by exon 11.41,42 By comparison, the IGF1R gene is assembled without alternative splicing from its 19-exon gene located on human chromosome 15. A third gene encodes the homologous insulin-related receptor (IRR), which can promote male sexual development in mice; however, its high-affinity ligand is unknown, and how it interacts with the IR and IGF1R needs to be investigated.43
The IR and IGF1R proreceptors are synthesized with a classic signal sequence followed by well-defined modules that include two leucine-rich motifs (L1 and L2) flanking a cysteine-rich (CR) region followed by three fibronectin-III motifs (FnIII1, FnIII2, and FnIII3) (see Fig. 8-1B). FnIII2 is interrupted by a 120-amino-acid insert domain containing a cleavage site that generates the α and β subunits of the mature receptor (see Fig. 8-1B). During translation, the proreceptors for insulin and IGF-1 assemble as homodimers to produce the IR or the IGF1R, or as heterodimers to produce receptor hybrids (IR::IGF1R). Since the insulin receptor occurs in two isoforms, a total of five receptors types can be produced from two genes.44 All of the proreceptor dimers are linked by disulfide bonds and cleaved into covalently stabilized tetramers composed of two α and two β subunits (see Fig. 8-1C; Fig. 8-2).The α subunits are entirely extracellular and create the ligand-binding site. Each β subunit contains a transmembrane-spanning segment that separates the extracellular FnIII2 and FnIII3 regions from the intracellular tyrosine kinase (see Fig. 8-1C).34,35 Under nonreducing conditions, the holoreceptor (α2β2) has an approximate molecular mass of 350,000—larger than expected, owing to glycosylation of the α and β subunits.45,46 In denaturing polyacrylamide gel electrophoresis, the α and β subunits migrate near 135 kD and 95 kD, respectively.47,48
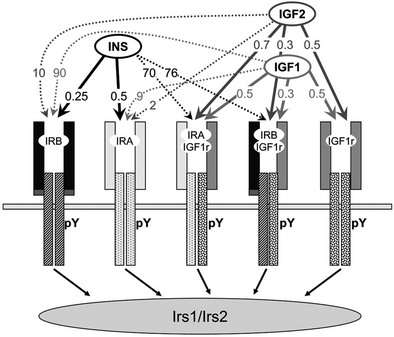
FIGURE 8-2 The insulin and insulin-like growth factor family. The insulin/IGF family consists of three peptide hormones: insulin, insulin-like growth factor 1 (IGF-1), and insulin-like growth factor 2 (IGF-2). These bind as indicated in the figure to five distinct homo- or heterodimeric receptor isoforms that generate cytoplasmic signals: two insulin receptor isoforms, IRA and IRB; the insulin-like growth factor receptor, IGF1R; and two hybrid receptors, IRA::IGF1R and IRB::IGF1R. The insulin receptor is the primary target for insulin throughout development and life. The IGF-1 receptor is the primary target for IGF-1. IGF-2 binds to IRA during embryonic development, and to the IGF1R throughout life; binding of IGF-2 to the mannose 6-phosphate receptor (M6Pr) results in its cellular uptake and destruction. The activated IR or IGF1R tyrosine kinases phosphorylate the cytoplasmic insulin receptor substrate proteins, IRS1 and IRS2, which mediate somatic growth and metabolism. The approximate binding affinities (Kd, nM) are shown on the figure.
Receptor/Ligand Binding
Insulin binds with high affinity (Kd < 0.5 nM) to the homodimeric IRB, which predominates in the classic insulin target tissues—adult liver, muscle and adipose tissues (see Fig. 8-2). IRB is selective for insulin because its Kd for IGF-1 and IGF-2 is at least 50- to 100-fold higher. Adult liver and adipose are purely insulin-responsive tissues, expressing IRB but lacking IGF1R.7 By comparison, IRA predominates in fetal tissues, the adult central nervous system, and hematopoietic cells.49–52 IRA binds insulin almost as well as IRB but also binds IGF-2 with moderate affinity (see Fig. 8-2). IGF-1 and IGF-2 bind with high affinity (Kd < 1 nM) to the homodimeric IGF1R and to the hybrid receptors (IGF1R::IRA and IGF1R::IRB), whereas insulin barely binds to these proteins (see Fig. 8-2).53,54 Thus, under ordinary conditions, insulin never activates the IGF1R tyrosine kinase, whereas IGF-1 and IGF-2 can activate the IR tyrosine kinase, especially when it forms a hybrid with the IGF1R.
Site-directed mutagenesis reveals the location of two insulin-binding sites in the α subunit of the insulin receptor.55,56 Chimeric receptors between the α subunits of the insulin and IGF-1 receptors confirm that one of the sites is located within the first leucine-rich (L1) region of the insulin receptor.57 Photo-affinity labeling of mutant insulin receptors reveals the second insulin binding site in the FnIII1 region.58 High-affinity insulin binding depends upon α subunit dimerization in the IR tetramer, insofar as monomeric α subunits bind insulin with low affinity. Insulin bound to the IR tetramer at high affinity dissociates slowly unless the concentration of soluble insulin increases, explaining how the binding of a second insulin molecule to a low-affinity site can reduce the affinity of the first.59,60
Insulin binding apparently begins through interactions between the S1 site on insulin and the FnIII1 region in the α subunit.32 Sixteen amino acid residues at the COOH-terminus (CT) of FnIII2 interacts with the L1::CR-region to create a composite insulin binding site—L1::CR::CT—that interacts with the classical receptor binding surface on insulin (S2) (see Fig. 8-1C). Although the α subunits are arranged symmetrically in the dimer, there is a sharp bend between the L2 and FnIII1 regions that juxtaposes the L1::CR::CT domain antiparallel to FnIII1 (see Fig. 8-1C).61–63 Owing to this arrangement of α subunits, insulin binds to the L1::CR::CT domain of one α subunit and to FnIII1 of the adjacent α subunit, creating the cross-link that activates the kinase. Space constraints allow only one insulin molecule to bind with high affinity.40,61,63 Inclusion of exon 11 in IRB lengthens the CT-region by 12 amino acids, which modifies the L1::CR::CT domain to exclude IGF-2 binding and increase the insulin-binding affinity.
Insulin Receptor Tyrosine Kinase
The tyrosine kinase activity of the insulin receptor was originally found by biochemical experiments using [32P]-labeled hepatoma cells or partially purified insulin receptors incubated with insulin and [γ32P]ATP.64–66 However, until the insulin receptor cDNA was isolated and sequenced,34,35 many other mechanisms for signal transduction continued to be investigated.67,68 The discovery that rare cases of severe insulin resistance in humans are associated with insulin receptor mutations that inactivate the tyrosine kinase—without altering insulin binding—supported the central role of tyrosyl phosphorylation in the mechanism of insulin action.69
The intracellular portion of the insulin receptor β-subunit is composed of three distinct regions that contain tyrosyl phosphorylation sites: Y965 and Y972 in the juxtamembrane region (IRB) between the transmembrane helix and the cytoplasmic tyrosine kinase domain; Y1158, Y1162, and Y1163 in the activation loop (A-loop) of the core catalytic domain (IRB); and Y1328 and Y1334 in the COOH-terminus (IRB).41,70,71 The unphosphorylated Tyr1162 folds into the catalytic site to restrict ATP binding, which explains the high apparent Km for ATP before insulin stimulation.72,73 However, the closed A-loop is in equilibrium with an alternate conformation that allows occasional access by ATP to mediate basal autophosphorylation.74 Infrequent oscillation from the inactive to the active conformation might be coupled to complementary changes in the α subunits, which are definitively stabilized upon insulin binding to accelerate ATP entry and autophosphorylation of Tyr1162 (Fig. 8-3A). Once initiated, the autophosphorylation cascade progresses rapidly to Tyr1158, resulting in a bis-phosphorylated and active kinase.70 Although autophosphorylation of Tyr1163 is relatively slow, the resulting tris-phosphorylated A-loop stabilizes the open conformation to allow unrestricted access by Mg-ATP and protein substrates (see Fig. 8-3A). Autophosphorylation probably occurs through the interaction between adjacent β subunits, since the reaction progresses through first-order kinetics.66 This model of kinase regulation is validated by activation of the kinase via substitution of Asp1161 in the middle of the A-loop with Ala1161—which shifts the steady-state conformation of the unphosphorylated A-loop toward the open configuration.74 Substitution of Tyr1162 with phenylalanine also increases basal autophosphorylation, consistent with its role in stabilizing the closed conformation.75
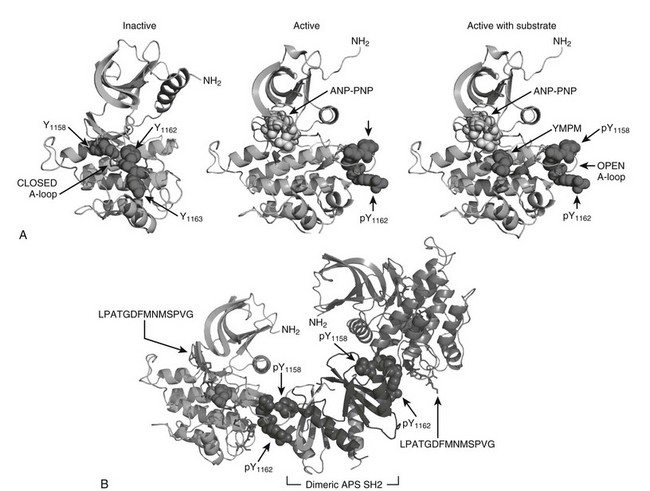
FIGURE 8-3 The role of insulin receptor autophosphorylation. A, The structure of the insulin receptor activation loop is shown as a series of ribbon diagrams of the insulin receptor kinase domain. The activation loop (A-loop) is darkly shaded; the three activation loop tyrosine residues (Y1158, Y1162, and Y1163) are shown with their side chains. In the inactive, unphosphorylated state (left panel), the activation loop blocks access by potential substrates. Following phosphorylation, however (right panels), the activation loop moves, allowing substrates such as YMXM peptides of the IRS proteins to access the active site. B, A structural representation of the binding of dimeric APS SH2 domains to the phosphorylated A-loop of the insulin receptor. These structures were based upon published coordinates.73,77,101
Regulation of the insulin receptor kinase is modulated by heterologous protein interactions with the phosphorylated A-loop. At least two phosphotyrosine residues in the A-loop are completely solvent-exposed, creating sites that bind to various src-homology-2 (SH2)-domain-containing proteins, including APS and Grb10/14.76 Structural analysis reveals how the dimerized Src homology-2 (SH2) domains of APS can bind to the A-loop of adjacent β subunits to stabilize the active conformation (see Fig. 8-3B).77 By contrast, binding of the dimeric SH2-domains of Grb10 or Grb14 to adjacent A-loops orients a 40-amino-acid motif into in the catalytic site, which inhibits the IR kinase.78 These structural predictions are consistent with gene deletion studies that confirm tissue-specific negative regulation of the insulin receptor by Grb14.79 Variable expression of these or other regulatory proteins—due to genetic variation or physiologic or environmental challenge—should be expected to modulate insulin signaling and glucose tolerance.76
The Insulin Signaling Cascade
Following discovery of the insulin receptor tyrosine kinase, many groups searched for insulin receptor substrates that might mediate downstream signals.80,81 The “substrate” hypothesis was difficult to prove for any receptor tyrosine kinase, because the only known substrates were abundant proteins of unknown physiologic importance. The first evidence for a cellular substrate of a receptor tyrosine kinase came from antiphosphotyrosine antibody immunoprecipitates, which revealed a 185-kD phosphoprotein (pp 185) in insulin-stimulated hepatoma cells.82 This substrate seemed to be biologically important because it was phosphorylated immediately after insulin stimulation but not phosphorylated by catalytically and biologically inactive insulin receptors. Importantly, a few catalytically active but biologically inactive insulin receptor mutants fail to phosphorylate pp185.83 Together, these data provided the first clue that substrate phosphorylation following receptor autophosphorylation are the initial steps in signal transduction.
Purification and molecular cloning of pp185 revealed one of the first signaling scaffolds and the first insulin receptor substrate, called IRS1.84 Four IRS-protein genes exist in rodents, but only three (IRS1, IRS2, and IRS4) are expressed in humans.85 IRS1 and IRS2 are broadly expressed in mammalian tissues, whereas IRS4 is largely restricted to the hypothalamus.86 The IRS proteins are adapter molecules that link the IR and IGF1R to common downstream signaling cascades and heterologous regulatory mechanisms (Fig. 8-4A). IRS proteins are targeted to the activated receptors through an NH2-terminal pleckstrin homology (PH) domain and a phosphotyrosine-binding (PTB) domain (see Fig. 8-4A). During insulin and IGF-1 stimulation, tyrosines in the COOH-terminal portion of the IRS proteins are phosphorylated and bind to the SH2 domains in various signaling proteins (see Fig. 8-4A).87 The interaction between IRS1 and the 85-kD regulatory subunit (p85) of the class 1A phosphatidylinositol 3-kinase (PI3K) was the first insulin signaling cascade to be reconstituted successfully in cells and test tubes.88 In addition to the IRS proteins, the insulin receptor phosphorylates other proteins in various contexts, including Shc, APS, SH2B, Gab1/2, Dock1/2, and Cbl.89–96 Quantitative mass spectrometry–based analysis of proteins extracted from insulin-stimulated 3T3-L1 adipocytes reveals 122 tyrosine phosphorylation sites on 89 proteins, including IRS1 and IRS2 (see Fig 8-4A).97 A wide variety of proteins are revealed by this approach, including components of the trafficking machinery for the insulin-responsive glucose transporter, GLUT4.97 Although the role of each of these substrates merits attention, work with transgenic mice reveals that many insulin responses, especially those associated with somatic growth and carbohydrate and lipid metabolism, are initiated through IRS1 and IRS2.36
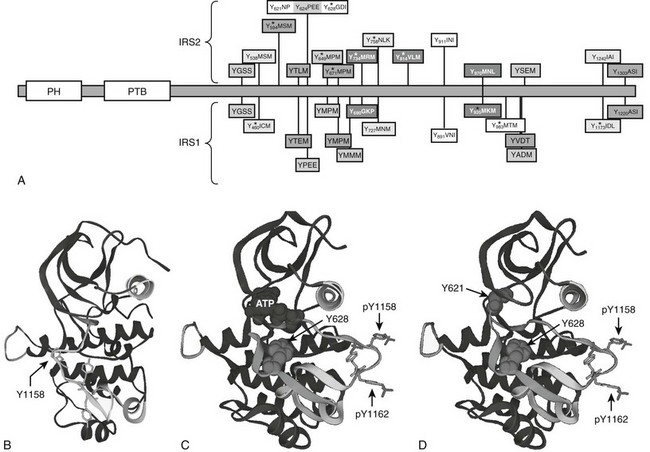
FIGURE 8-4 Insulin receptor substrate proteins IRS1 and IRS2, with structure of the IRS2 kinase regulatory loop binding (KRLB) domain. A, Comparison of IRS1 and IRS2 protein sequences, including amino-terminal pleckstrin homology (PH) and phosphotyrosine binding (PTB) domains and numerous known or potential tyrosine phosphorylation sites. The amino acid sequences surrounding tyrosine sites are shown. Phosphorylation sites revealed by tandem mass spectrometry (MS/MS) are indicated. The kinase regulatory loop binding (KRLB) domain in IRS2 is centered about Y624 and is not conserved in IRS1. B, The backbone of the insulin receptor catalytic domain, including the location of the regulatory loop in the inactive kinase, with Tyr1158 indicated for orientation. C, The backbone of the insulin receptor catalytic domain, including the location of the phosphorylated Tyr1158 and Tyr1162 residues within the regulatory loop, oriented away from the catalytic pocket of the active kinase. The interaction of the IRS2 peptide surrounding Tyr628—but lacking Tyr621—is shown. D, The same diagram as C, but Tyr621 is included to show its interaction with the ATP binding pocket of the insulin receptor.
Insulin Receptor Substrate Recruitment and Phosphorylation Site Selection
The structure of the activated insulin receptor β subunit reveals a mechanism by which the activated IR kinase phosphorylates tyrosine residues within specific amino acid motifs, including the YMXM, YVNI, and YIDL motifs.98–101 These motifs are targeted as antiparallel β strands to the COOH-terminal end of the open A-loop, allowing hydrophobic residues in the Y+1 and Y+3 positions to occupy two small hydrophobic pockets on the activated kinase (see Fig. 8-3A). Tyrosine residues lying within amino acid motifs that contain charged or bulky side chains at the Y+1 and Y+3 positions fit poorly into this site, excluding them from phosphorylation.101
In addition to the phosphorylation of specific tyrosine-containing motifs, selective and regulated recruitment of cellular proteins to the activated IR and IGF1R establishes signaling specificity. In this regard, the phosphorylated NPEY972 motif in the juxtamembrane region of the insulin receptor (IRB-numbering) is essential.83,102 The juxtamembrane region is about 35 residues long and connects the transmembrane helix of the IR β subunit to the kinase domain (see Figs. 8-1B and C). Tyr984 in the juxtamembrane region plays an important structural role to maintain the kinase in the basal state.78 However, unlike other receptor tyrosine kinases, the insulin receptor kinase is not regulated by autophosphorylation in the juxtamembrane region.103,104 Phosphorylation of Tyr972 creates a docking site for the phosphotyrosine-binding (PTB) domains in the IRS proteins and SHC.83 In intact cells, phosphorylation of the NPXY972 motif is among the first sites of insulin-stimulated autophosphorylation.83,105 The juxtamembrane region appears to compete with the A-loop for access to the catalytic site, supporting a model in which the juxtamembrane region is phosphorylated before tris-phosphorylation of the A-loop.72 In this mechanism, substrate recruitment can be initiated before the catalytic domain is maximally activated. The NPXY motif in the IR juxtamembrane region fills an L-shaped cleft on the PTB domain, while the N-terminal residues of the bound peptide form an additional strand in the β sandwich.102 These interactions can explain why the IR and IGF1R—and a few cytokine receptors, including the IL-4 receptor—select IRS1 for tyrosine phosphorylation.
The IRS proteins also contain a pleckstrin homology (PH) domain that is structurally similar but functionally distinct from the PTB domain.106 Although the PH domain promotes the interaction between IRS proteins and the IR, it does not bind phosphotyrosine, and its mechanism remains poorly understood. PH domains are generally thought to bind phospholipids, but the PH domains in IRS1 and IRS2 are poor examples of this specificity.107,108 Regardless, the PH domain in the IRS protein plays an important and specific role because it can be interchanged among the IRS proteins without noticeable loss of bioactivity. However, heterologous PH domains inhibit IRS1 function when substituted for the IRS1 PH domain, confirming a specific functional role.109
IRS2 utilizes an additional motif located between amino acid residues 591 and 786—especially Tyr624 and Tyr628—to interact with the activated insulin receptor.110,111 This binding region in IRS2 was originally called the kinase regulatory loop binding (KRLB) domain because tris-phosphorylation of the IR A-loop was required to observe its interaction.110 Autophosphorylation moves the A-loop out of the catalytic site so the functional part of the KRLB domain—residues 620 to 634 in murine IRS2—can fit into the catalytic site (see Fig. 8-4B-D).112 This interaction aligns Tyr628 of IRS2 for phosphorylation; however, it also inserts Tyr621 into the ATP-binding pocket, which might attenuate signaling by blocking ATP access to the catalytic site. By contrast, this interaction might promote signaling by opening the catalytic site before tris-autophosphorylation. Interestingly, the KRLB motif does not bind to the IGF1R, which might explain signaling differences between IR and IGF1R, as well as the receptor hybrids.112
The IRS→PI3K→AKT Cascade
One of the best studied and most important signaling cascades activated by insulin involves the production of phosphatidylinositol lipids by the class 1A phosphatidylinositide 3-kinase (PI3K) (Fig. 8-5). The PI3K plays a role in many signaling cascades. It is composed of a regulatory subunit that contains two src-homology-2 (SH2) domains and a catalytic subunit that phosphorylates the D3 position of the inositol ring.113 The catalytic subunit is unstable and only detected in association with the regulatory subunit. The PI3K is inactive until both SH2 domains in the regulatory subunit are occupied by phosphorylated YXXM motifs, especially those in the IRS proteins.88 Inhibition of the PI3K by chemical or genetic means blocks almost all metabolic responses stimulated by insulin—including glucose influx, glycogen and lipid synthesis, and adipocyte differentiation—confirming that the PI3K is a critical node coordinating insulin action.114–116
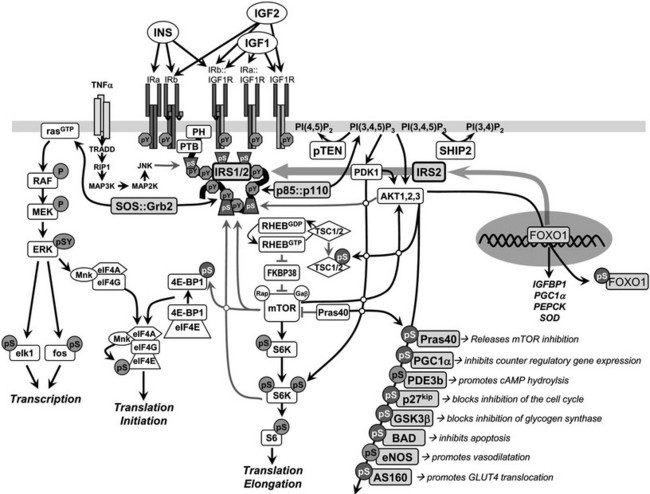
FIGURE 8-5 Insulin and insulin-like signaling cascade. A, Two main branches propagate signals generated via the IRS proteins: the phosphatidylinositide 3-kinase (PI3K)→3-phosphoinositide-dependent protein kinase-1(PDK1)→Akt and Grb2/Sos→ras kinase cascades. Activation of the receptors for insulin and IGF-1 results in tyrosine phosphorylation of the IRS proteins, which bind PI3K and Grb2/SOS. The Grb2/SOS complex promotes GDP/GTP exchange on p21ras, which activates the ras→raf→MEK→ERK1/2 cascade. Activated ERK stimulates transcriptional activity by direct phosphorylation of elk1 and by indirect phosphorylation of fos through p90rsk. The activation of PI3K by IRS-protein recruitment produces PI 3,4P2 and PI 3,4,5P3 (antagonized by the action of PTEN or SHIP2), which recruit PDK1 and AKT to the plasma membrane. AKT is activated via phosphorylation at T308 by PDK1 and at S473 by mTOR in complex with rictor. The mTOR kinase is activated by RhebGTP, which accumulates upon inhibition of the GAP activity of the TSC1::TSC2 complex following PKB-mediated phosphorylation of TSC2. The S6K is primed for mTOR-mediated activation through phosphorylation by PDK1. AKT phosphorylates many cellular proteins, inactivating PGC1α, p21kip, GSK3β, BAD, and AS160 and activating PDE3b and eNOS. AKT-mediated phosphorylation of forkhead proteins, including FOXO1, results in their sequestration in the cytoplasm, which inhibits their influence upon transcriptional activity. Insulin stimulates protein synthesis by altering the intrinsic activity or binding properties of key translation initiation and elongation factors (eIFs and eEFs, respectively) as well as critical ribosomal proteins. Components of the translational machinery that are targets of insulin regulation include eIF2B, eIF4E, eEF1, eEF2, and the S6 ribosomal protein.158 TNF-α activates JNK, which can phosphorylate IRS1 and inhibit its interaction with the insulin receptor and subsequent tyrosine phosphorylation. IRS2 expression is promoted by nuclear FOXO, which increases IRS2 concentration in the fasted liver.
PI-3,4,5-P3 produced by the activated PI3K recruits several Ser/Thr-kinases to the plasma membrane, including the 3-phosphoinositide-dependent protein kinase-1 (PDK1) and v-akt murine thymoma viral oncogene (AKT, also known as PKB), where AKT is activated by PDK1-mediated phosphorylation of Thr308 in its activation loop. AKT has a central role in cell biology, phosphorylating many proteins that control cell survival, growth, proliferation, angiogenesis, metabolism, and migration (see Fig. 8-5).117 Phosphorylation of several AKT substrates is especially relevant to insulin-like signaling: GSK3α/β (blocks inhibition of glycogen synthesis), AS160 (promotes GLUT4 translocation), the BAD•BCL2 heterodimer (inhibits apoptosis), the FOXO transcription factors (regulates gene expression in liver, β cells and the hypothalamus), p21CIP1 and p27KIP1 (blocks cell cycle inhibition), eNOS (stimulates NO synthesis and vasodilatation), and PDE3b (hydrolyzes cyclic adenosine monophosphate [cAMP]) (see Fig. 8-5).
AKT directly stimulates cell growth through the activation of mTORC1 complex—composed of the mammalian target of rapamycin (mTOR), mLST8, and raptor—which phosphorylates the S6-kinase and eIF4E-BP1 (also known as PHAS-1) to stimulate protein synthesis (see Fig. 8-5).117–119 The regulatory mechanism involves several steps, beginning with AKT-mediated phosphorylation of at least five sites (Ser939, Ser981, Ser1130, Ser1132, and Thr1462) on TSC2 (tuberin), which in complex with TSC1 (hamartin) functions as a GTPase activating protein for the small G protein, RHEB (Ras homolog enriched in brain). RHEB accumulates in its GTP-bound form when TCS1/2 is inhibited by AKT-mediated phosphorylation, which activates mTORC1 (see Fig. 8-5). In one possible regulatory mechanism, FKBP38 (FK506 binding protein 8) binds to mTORC1 and inhibits mTOR until RHEB-GTP binds to FKBP38 to disinhibit the kinase.120–122 This complex regulatory cascade is augmented by other pathways, including the direct inhibition of the mTOR catalytic site by PRAS40 (the proline-rich AKT substrate of 40 kD) until AKT-mediated phosphorylation of PRAS40 reverses the inhibition.117 The mTORC2 complex is also composed of mTOR and mLST8, but instead of raptor, this rapamycin-insensitive complex contains rictor and mSIN1 and is mainly regulated by nutrients. Regardless of this complexity, the insulin-mediated control of mTORC1 is directly linked to the IRS→PI3K→AKT cascade and plays an important role in cell growth and feedback regulation.
Downstream effectors of mTORC1—p70S6K and 4E-BP1—control protein synthesis and cell growth. The p70S6K occurs as two isoforms, p70S6K1 and p70S6K2. Disruption of the S6k1 gene in mice causes glucose intolerance due to reduced size of pancreatic islet β cells; however, peripheral insulin action is enhanced, suggesting that p70S6K1 contributes to feedback inhibition of insulin signaling.123 Activation of p70S6K1 is accomplished by multisite phosphorylation events from various kinase activities in response to insulin and other mitogens when amino acids are available.124,125 Nutrient sensitivity might arise when mTORC1 mediates the phosphorylation of a hydrophobic motif needed for interaction of p70s6k with PDK1.
Genetic Validation of the IRS-Based Insulin Signaling Cascade
Systemic Inactivation of Insulin or IGF-1 Receptors
Even though the insulin and IGF-1 receptors have some overlapping functions during development and adult life, complete deletion of the IR or the IGF1R has serious physiologic consequences that cause death shortly after birth.21 The IGF-1/2→IGF1R signaling is the principle growth regulatory pathway in fetal mice, which is not influenced by growth hormone or augmented by the insulin receptor until after birth.126 IGF1R-deficient mice are born 50% smaller than normal littermates and die after a few days, owing to developmental defects.127 By contrast, mice lacking the insulin receptor are nearly normal size at birth, except for a reduced adipose tissue mass. Regardless, insulin receptor–deficient mice also die within a few days of birth, owing to severe hyperglycemia.126 Mice retaining at least 20% of normal insulin-receptor expression throughout the body can survive, with severe postnatal growth retardation and hyperglycemia that resembles human leprechaunism.21 This growth defect might arise, at least in part, from elevated hepatic IGFBP1 that reduces IGF-1 bioavailability. Thus, small mice with severely reduced insulin or IGF-1 signaling have short lifespans due to developmental and metabolic defects. These mouse models reflect many but not all the features of humans with inactivating human insulin-receptor mutations.19
Insulin Receptor Substrate–Protein Signaling
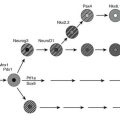
Irs1 and Irs2 couple the receptors for insulin and IGF-1 to the PI3K→Akt cascade in mice and humans. Deletion of Irs1 produces small, insulin-resistant mice with nearly normal glucose homeostasis, owing to β-cell expansion and compensatory hyperinsulinemia.128 Irs1 appears to mediate most of the Igf1 signal for somatic growth. Mice lacking Irs2 display nearly normal growth but develop life-threatening diabetes between 8 and 15 weeks of age as a result of reduced β-cell mass and insufficient compensatory insulin secretion.129 Whereas the complete deletion of Irs1 and Irs2 is lethal, littermates retaining one allele of Irs1 (Irs1+/−::Irs2−/−) or one allele of Irs2 (Irs1−/−::Irs2+/−) can be born alive.130 Irs1+/−::Irs2−/− mice develop severe fasting hyperglycemia and die by 4 weeks of age because Irs2 is required for pancreatic β-cell survival and growth (Fig. 8-6). By contrast, Irs1−/−::Irs2+/− mice reach only 30% of normal size, but they display nearly normal glucose tolerance and circulating insulin concentrations at 6 months of age130 (see Fig. 8-6). Regardless, the small Irs1−/−::Irs2+/− mice are very fragile and require extraordinary care to live beyond this age. Thus, healthy glucose tolerance and small size are not definitive determinants of lifespan.
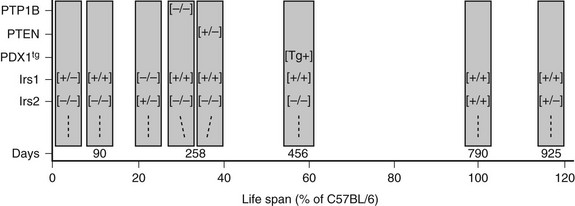
FIGURE 8-6 The lifespan of genetically modified mice, indicated in days or as a percentage of the lifespan of C57BL/6 mice. The targeted genes or PDX1 transgene (PDX1tg) are indicated on the left. Except where indicated, mice are wild-type and transgene-negative. Genotypes: [+/+] = wild-type; [−/−] = homozygous knockout; [+/−] = heterozygous for knockout allele; [Tg+] = transgene-positive.
The central role of IRS proteins in the PI3K→AKT signaling cascade is validated by a wide array of cell-based and mouse-based experiments. Although IRS1 was originally purified and cloned from rat hepatocytes, the principle role of Irs1 and Irs2 during insulin signaling in hepatocytes in vivo was verified only recently.131–134 The simplest experiments employ an intraperitoneal injection of insulin into ordinary mice or mice lacking hepatic Irs1, Irs2, or both. In ordinary mice, insulin rapidly stimulates Akt phosphorylation and the phosphorylation of its downstream substrates, Foxo1 and Gsk3α/β. However, both Irs1 and Irs2 must be deleted before insulin receptors are uncoupled from the PI3K→AKT cascade.135 These results confirm the shared but absolute requirement for IRS1 or IRS2 for the hepatic insulin response.
Downstream Insulin Signaling Components
Except for PDK1, the IRS→PI3K→AKT cascade is robust as a result of the expression of multiple isoforms of the proximal components. The type 1A PI3K is a dimer composed of a catalytic subunit—either p110α, p110β, or p110δ—and one of five regulatory subunit isoforms encoded by three different genes—Pik3r1, Pik3r2, and Pik3r3.117 In most cells, including the liver, products of Pik3r1—p85α, p55α, and p50α—and Pik3r2 (p85β) stabilize and inhibit the catalytic subunits.136,137 Partial loss of the regulatory subunits increases insulin sensitivity, which appears to be related to diminished negative feedback to the IRS proteins.138 By contrast, the complete disruption of hepatic Pik3r1 and Pik3r2 markedly reduces insulin-stimulated PI3K activity and PIP3 accumulation—at least in part by destabilizing the catalytic subunits—which dysregulates glucose and lipid homeostasis, hepatic size, and function.116 Thus, PI3K activity is responsible for nearly all of insulin’s actions in the liver in vivo.
The PI3K catalytic subunits, p110α and p110β, are ubiquitously expressed, but p110δ is predominantly expressed in leukocytes. Whereas deletion of either p110α or p110β causes embryonic lethality,139,140 deletion of p110δ causes immune-system defects.141 Mice heterozygous for deletion of either p110α or p110β show no phenotypic abnormalities, but combined heterozygosity for p110α and p110β causes mild glucose intolerance and fasting hyperinsulinemia.142 Mutation of Asp933 of p110α to alanine abolishes its lipid kinase activity, and knock-in mice homozygous for this mutation (D933A) die during embryogenesis.143 By contrast, heterozygous D933A mice are viable and fertile but develop severe insulin resistance, glucose intolerance, hyperphagia, and adiposity, indicating a function of p110α not shared by p110β. This unique function derives from the highly selective recruitment of p110α to IRS signaling complexes following insulin stimulation.143
The mammalian genome contains three genes that separately encode the AKT isoforms, AKT1, AKT2, and AKT3. The analysis of knockout mice confirms that AKT can regulate important biological functions, including cell proliferation, growth, survival, and differentiation and glucose metabolism in vivo; however, the AKT isoforms are not redundant components of the insulin-like signaling cascade.144 AKT1 has a major role in embryonic development, growth, and survival but minor effects upon metabolism.145 By comparison, AKT2-deficient mice display metabolic defects, and AKT3-deficient mice display neural defects.117 AKT2 rather than AKT1 is primarily responsible for insulin-stimulated GLUT4 translocation.146 Targeted disruption of AKT impairs insulin-stimulated glucose uptake in muscle and adipocytes and prevents the suppression of hepatic glucose output by insulin, which causes glucose intolerance and insulin resistance that progresses to diabetes and β-cell failure.147 Two human subjects with a dominant-negative mutation in AKT2 display many features of type 2 diabetes—hyperglycemia, increased lipogenesis, elevated liver fat content, TG-enriched VLDL, hypertriglyceridemia, and low HDL cholesterol levels.19,148
Although PDK1 is a master upstream kinase controlling the activation of numerous kinases including AKT, it occurs as a single isoform encoded by one gene. Unlike most kinases, PDK1 is constitutively active, so phosphorylation of its substrates is regulated by mechanisms that control the interaction of substrates with PDK1.149 PDK1 is required for normal development, inasmuch as mouse embryos lacking PDK1 die at day E9.5; however, PDK1 hypomorphic mice with 90% reduction of PDK1 expression in all tissues are viable, fertile, and small.150 Surprisingly, activation of AKT1 and S6K1 by insulin is largely normal in PDK1 hypomorphic mice. Moreover, liver-specific PDK1−/− mice display normal blood glucose and insulin concentrations under ordinary fasting and postprandial conditions; however, they are markedly glucose intolerant and paradoxically fail to normalize their blood glucose after injection of insulin.151 Mistargeted PDK1 due to mutation in the pleckstrin homology domain causes insulin resistance.152 Thus, PDK1 might not be a rate-limiting step in the insulin signaling cascade; however, excess capacity might be important during acute metabolic challenge when definitive activation of AKT is required for tight metabolic control.
Modulation of Insulin Signaling by Protein and Lipid Phosphatases
Many phosphatases can oppose the action of insulin by dephosphorylating key proteins in the signaling cascade. The protein tyrosine phosphatase, nonreceptor type 1 (PTP1b) and the phosphatase and tensin homolog (PTEN) are two phosphatases that attenuate insulin signals at early points in the pathway. PTP1B reduces insulin sensitivity because it dephosphorylates the insulin receptor and the IRS proteins. PTP1B−/− mice display increased insulin sensitivity, lower circulating insulin concentrations, and decreased pancreatic β-cell mass.153 Complete deletion of PTP1B also increases peripheral insulin sensitivity of compound Irs2−/−::PTP1B−/− mice, due at least in part to a reduced rate of β-cell death that sustains insulin secretion in these mice.154 However, Irs2−/−::PTP1B−/− mice eventually lose sufficient β-cell mass between 8 and 9 months of age, and life-threatening hyperglycemia develops (see Fig. 8-6). Thus, inhibition of PTP1B can be effective only when some signaling capacity remains available.
PTEN is a potent negative regulator of insulin action and cellular proliferation and one of the most frequently mutated genes in many forms of human cancer.155,156 PTEN attenuates downstream insulin-like signaling by dephosphorylating PI(3,4)P2 and PI(3,4,5)P3 at the 3-position, which reduces the recruitment to the plasma membrane and activation of PDK1 and AKT.156 Pten+/− mice are glucose tolerant, even as β-cell mass and circulating insulin levels decrease.157 PTEN heterozygosity also increases peripheral insulin sensitivity in Irs2−/−::PTEN+/− mice and normalizes glucose tolerance, because the small islets in these mice produce sufficient insulin until death from lymphoproliferative disease between 10 and 12 months age (see Fig. 8-6). These experiments highlight the complex relation between nutrient homeostasis, insulin sensitivity and secretion, and cancer that emerges in rodents and humans. Despite this complexity, mild inhibition of PTEN, especially if it can be accomplished in a tissue-specific way, might have therapeutic value.
Regulation of Protein Synthesis by Insulin
Insulin stimulates protein synthesis by altering the intrinsic activity or binding properties of key translation initiation and elongation factors (eIFs and eEFs, respectively) as well as critical ribosomal proteins. Components of the translational machinery that are targets of insulin regulation include eIF2B, eIF4E, eEF1, eEF2, and the S6 ribosomal protein.158 The eIF2B multi-subunit guanine nucleotide exchange factor for eIF2 is kept inactive via phosphorylation of the eIF2Bε subunit at Ser535 by glycogen synthase kinase-3 (GSK3).159 Inhibition of GSK3 by insulin-stimulated AKT kinase activity results in dephosphorylation eIF2Bε, promoting the formation of eIF2GTP that recruits the initiator methionyl-tRNA to the ribosome.159–161 The insulin-stimulated activation of eIF2B leads to an overall increase in translation initiation.162
The eIF4F complex—including eIF4A/4G/4E and other proteins—is required for cap-dependent translation initiation. The mRNA cap-binding protein, eIF4E, is inactive during association with 4E-BP1 (see Fig. 8-5). Insulin activates eIF4E by stimulating mTORC1-mediated phosphorylation of 4E-BP1. Phosphorylated 4E-BP1 dissociates to facilitate the interaction between eIF4E and eIF4G, the scaffold protein for the eIF4F complex.163 Mnk, an insulin-stimulated kinase activated through the Ras/ERK cascade, also resides in the eIF4F complex where it phosphorylates eIF4E at Ser209 (see Fig. 8-5).164,165 Phosphorylation of eIF4E increases the binding affinity for mRNA caps, enhancing translation initiation. The phosphorylation of 4E-BP1 has an important systemic role in insulin action, insofar as deletion of the 4E-BP1 gene dramatically decreases white adipose tissue depots while increasing insulin sensitivity.166
The effect of insulin-stimulated phosphorylation of eEF1 on translation elongation remains incompletely clear.158 An elongation factor critical for ribosomal translocation along the mRNA, eEF2, is inactive when phosphorylated at Thr56 by the eEF2 kinase (eEF2K).167,168 Insulin stimulates the dephosphorylation of eEF2 via a rapamycin-sensitive route potentially involving the phosphorylation and inactivation of eEF2K by p70S6K.167 In vitro, p70S6K phosphorylates eEF2K at Ser366, a modification that greatly reduces the activity of the kinase.167 Insulin-stimulated phosphorylation of the ribosomal S6 protein by p70S6K may promote elongation of specific mRNAs corresponding to components of the translational machinery.169 The atypical protein kinase C isoforms, PKCζ and PKCλ, also promote insulin-stimulated protein synthesis, although their downstream effectors remain undetermined.170 The IRS1→PI3K appears to represent a bifurcation in the insulin signaling pathway to protein synthesis: one branch leads through PKCλ/ζ to general protein synthesis and the other through Akt and the target of rapamycin (mTOR) to growth-regulated protein synthesis and cell-cycle progression. Convergence between insulin and nutritional signaling occurs at the level of mTORC1 and mTORC2 regulation.169,171,172
Insulin-Regulated Glucose Transport
Glucose transport is the prototype insulin response. Insulin stimulates glucose influx into adipose and cardiac muscle and into skeletal muscle, where it is the major mechanism for disposal of exogenous glucose. However, the molecular mechanisms linking the insulin signal to increased glucose influx have been challenging to resolve.173 Cells express one or more members of the glucose transporter family, including 12 isoforms organized into three classes. Class I includes the well-characterized GLUT1, GLUT2, GLUT3, and GLUT4 transporters; class II includes GLUT5, GLUT7, GLUT9, and GLUT11; and class III includes GLUT6, GLUT8, GLUT10, and GLUT12 (reviewed in Ref. 174).
GLUT1 is expressed in most cells and tissues and resides permanently on the plasma membrane, where it constitutively transports glucose from the extracellular space into the cell. Although insulin does not stimulate translocation of GLUT1, chronic insulin treatment can increase the expression of cellular GLUT1 via the p21ras→Erk kinase pathway (see Fig. 8-5).175,176 GLUT2 is mainly expressed in liver and pancreatic β cells, where its relatively low affinity and high transport capacity provides a constant flux of glucose into these organs at physiologic plasma glucose concentrations. In the β cell, the uptake of glucose through GLUT2 is the first step in the detection of circulating glucose concentrations needed to stimulate insulin secretion. GLUT3 has a relatively high affinity for glucose and is most abundant in the central nervous system, where glucose concentrations are lower than in the bloodstream. GLUT8 might be insulin sensitive, since it contains GLUT4-like intracellular targeting motifs and is widely expressed in many insulin-responsive (as well as insulin-independent) tissues177,178; GLUT12 is expressed in prostate, small intestine, placenta, skeletal muscle, and adipocytes and might also be insulin responsive.179,180
GLUT4 is the principle insulin-responsive glucose transporter. GLUT4 is glycosylated in its first exofacial loop and contains a phosphorylation site (Ser488) and a di-leucine motif in its COOH-terminus that plays a role in endocytosis.181 Upon synthesis, GLUT4 is unavailable to transport glucose across the plasma membrane because it enters a continuously recycling pathway that concentrates it in intracellular membranes of unstimulated cells.173 During insulin stimulation, GLUT4-containing vesicles move from their intracellular sequestration compartment to the cell surface through targeted exocytosis (Fig. 8-7). Simultaneously, GLUT4 endocytosis is repressed, leading to an overall increase in glucose uptake.182 It is not clear whether the effect of insulin to stimulate glucose uptake in muscle and fat can be accounted for in its entirety by translocation; other factors that increase transporter activity could be involved.
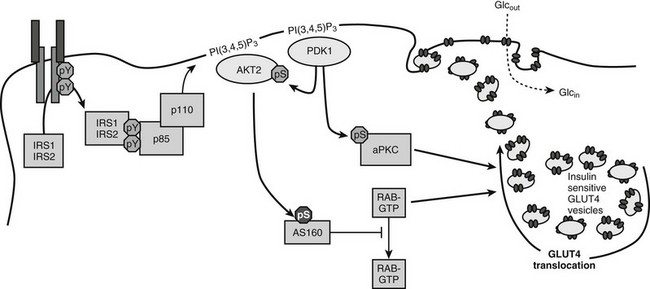
FIGURE 8-7 A mechanism of insulin-stimulated glucose transport. The phosphatidylinositide 3-kinase (PI3K)→3-phosphoinositide-dependent protein kinase-1 (PDK1)→AKT branch of the insulin signaling pathway is shown, including atypical protein kinase C isoforms (aPKC) phosphorylated by PDK1, the AKT substrate AS160, and generic Rab proteins that might link the presence of the insulin signal to exocytosis of vesicles containing the glucose transporter GLUT4. Activation of these pathways by insulin promotes the accumulation of GLUT4-containing vesicles in the plasma membrane.
The PI3K→AKT cascade plays a key role in insulin-stimulated GLUT4 translocation to the plasma membrane.183–185 How AKT promotes GLUT4 redistribution to the plasma membrane is an important area of investigation. Important progress came from the identification of a 160-kD AKT substrate (AS160).186 AS160 and the related TBC1D1 are RabGAPs (Rab GTPase-activating proteins) implicated in regulating the trafficking of GLUT4 storage vesicles to the cell surface (reviewed in Ref. 187). Since Rab proteins regulate many steps in vesicle transport, AS160 might link the insulin signaling cascade to the redistribution and fusion of GLUT4-containing vesicles to the plasma membrane. AS160 contains six AKT phosphorylation sites which can regulate the activity of the Rab GTPase-activating (GAP) domain. AKT-mediated phosphorylation might alter the subcellular location of AS160 or inactivate the Rab-GAP domain, which is needed to keep GLUT4 in the intracellular compartment.188 Mutation of four AKT phosphorylation sites converts AS160 into a dominant negative protein that uncouples GLUT4 translocation from insulin signaling in 3T3L1-adipocytes, L6 muscle cells, and even in mouse skeletal muscle ex vivo.187 However, the partial nature of this uncoupling suggests that the homologous TBC1D1 protein or another mechanism might have a complementary role in regulating vesicle trafficking in response to insulin.
The exact target Rabs of AS160 are poorly established, but several possibilities have been proposed.189 Muscle and adipose express Rabs 4, 5, and 11, which are implicated in GLUT4 translocation. Under basal conditions, the GAP activity of AS160 might maintain these or other Rabs in the inactive GDP-bound state. Insulin-stimulated AS160 phosphorylation inhibits the GAP, which leads to the accumulation of active GTP-bound Rabs that reduce the sequestration of GLUT4 vesicles in the intracellular compartment. This basic mechanism might be modulated through other AKT substrates, including PIKfyve and Synip. PIKfyve is a phosphoinositide 5-kinase that is implicated in insulin-stimulated F-actin rearrangements.190 Synip is a SNARE-associated protein that might provide a mechanism for insulin to regulate the docking or fusion of GLUT4 vesicles with the cell surface.191
The atypical protein kinase C isoforms—PKCζ and PKCλ—are also implicated in the regulation of GLUT4 translocation in adipose tissue and muscle.192–194 PKCζ and PKCλ are downstream of the PI3K→PDK1 cascade but independent of AKT. Several experimental approaches support an important role for the atypical PKC insulin action. Constitutively active PKCλ or PKCζ promotes Glut4 translocation and glucose uptake in adipocytes and muscles in the absence of insulin.192,194–196 Overexpression of inactive PKCλ inhibits insulin-stimulated activation of endogenous PKCλ, which inhibits Glut4 translocation and glucose influx.192 Microinjection of PKCλ antibodies inhibits insulin-induced Glut4 translocation, and recombinant PKCζ promotes insulin-stimulated glucose uptake.197 Impaired PKCζ activity is associated with obesity-induced insulin resistance in monkeys, and insulin-stimulated activation of PKCζ is reduced in obese patients with insulin resistance.195,198,199
Heterologous Regulation of the IRS Proteins
Transcriptional Control
Transcription of the IRS1 gene is generally stable, but details of its regulation are unclear. By contrast, experiments conducted in various murine tissues suggest that production of IRS2 is regulated by multiple nutrient-sensitive transcription factors, including cAMP response element binding protein (CREB) and its binding partner CRTC2, forkhead box O 1 (FOXO1), transcription factor E3 (TFE3), and the sterol regulatory element binding protein SREBP1.200,201 Interestingly, the CREB/CRTC2 transcriptional complex—which binds to cAMP response elements (CRE)—has opposite effects upon IRS2 expression in β cells and liver. After a meal, the production of ATP from glucose oxidation depolarizes β cells, which promotes both Ca2+ influx and cAMP production that has many important effects, including the activation of CREB/CRTC2.200,202 Thus glucose is coupled directly to IRS2 expression in β cells, which stimulates β-cell growth and compensatory insulin secretion. By contrast, CREB/CRTC2 promotes IRS2 expression in the fasting liver, which can inhibit the gluconeogenic program by augmenting the basal insulin response.201 In this regard, the KRLB motif in IRS2 might play an important role to engage the transiently activated insulin receptor catalytic domain, leading to an especially strong basal insulin response to attenuate the action of counterregulatory hormones.
In addition to CRE sequences responsive to cAMP, the promoter region of the IRS2 gene includes insulin response elements that bind FOXO family members, an E-box that binds TFE3, and a sterol response element (SRE) recognized by SREBP-1c.203–205 FOXO1 links the PI3K→AKT cascade to the expression of genes important in cell growth, survival, and metabolism (see Fig. 8-5). In liver, IRS1 and IRS2 promote FOXO1 phosphorylation, which causes its export from the nucleus and degradation in the cytosol. Deletion of hepatic FOXO1 attenuates CREB/CRTC2-mediated gene expression—including that of the IRS2 gene—and inhibits gluconeogenesis while promoting glycogen synthesis.206 TFE3 is a basic helix-loop-helix protein that binds to E-box consensus cis-elements in many genes, including some related to glycolysis, lipogenesis, and insulin signaling.204 Because the E-box within the IRS2 gene overlaps with an IRE that binds FOXO1/3, TFE3 converges with FOXO to promote IRS2 expression. However, these elements also overlap with an SRE that binds the SREBP-1c. SREBP-1c is an important transcriptional regulator of lipid synthesis.207 SREBP-1c concentrations increase during nutrient excess and chronic insulin stimulation.205,208 The increase in hepatic SREBP-1c expression is associated with a decrease in IRS2 mRNA, which might be explained by competition between overlapping binding sites for SREBPs (SRE) and FOXO1 (IRE).205 Up-regulation of IRS2 expression by TFE3/FOXO and down-regulation by SREBP-1c parallels the switch from glycogenolysis and gluconeogenesis during fasting to lipogenesis following feeding. An imbalance in this reciprocal regulation may ultimately contribute to pathophysiologic effects of overnutrition, leading to the development of the metabolic syndrome and diabetes. More work is needed to establish the relevance of this regulatory mechanism.
Multisite Ser/Thr Phosphorylation of IRS Proteins
Heterologous signaling cascades initiated by proinflammatory cytokines or metabolic excess—including tumor necrosis factor α (TNF-α), endothelin-1, angiotensin II, excess nutrients (free fatty acids, amino acids, and glucose) or endoplasmic reticulum stress—can promote Ser/Thr-phosphorylation of Irs1 and cause insulin resistance.209,210 Many biochemical and genetic experiments show that individual Ser/Thr-phosphorylation sites throughout the structure of Irs1 can reduce its insulin-stimulated tyrosine phosphorylation by up to 50%.211 This level of inhibition is sufficient to cause glucose intolerance that progresses to diabetes, especially if pancreatic β cells fail to provide adequate compensatory hyperinsulinemia.212 Moreover, hyperinsulinemia itself can exacerbate Ser/Thr-phosphorylation of Irs1 through the PI3K→Akt or the mTORC1→p70s6k cascades.
One of the best-studied regulatory phosphorylation sites in Irs1 is Ser307 (S307) in the rodent protein (S312 in human IRS1).213–218 Phosphorylation of S307 might be a common mechanism of insulin resistance (Fig. 8-8). S307 phosphorylation inhibits tyrosine phosphorylation of Irs1 and inhibits the activation of the PI3K/Akt pathway in response to insulin.219,220 Insulin itself promotes S307 phosphorylation through activation of the PI3K, revealing feedback regulation that can be mediated by many kinases—PKCζ, IKKβ, JNK, mTOR, and S6K1.211 JNK can bind directly to Irs1, which appears to facilitate S307 phosphorylation during stimulation of cells with proinflammatory cytokines. S307 is poorly phosphorylated in ob/ob (obese) mice that lack Jnk1, suggesting that this mechanism of inhibition has physiologic significance.221 Free fatty acids that contribute to insulin resistance promote S307 phosphorylation, possibly through PKCθ.215 Hyperactivated mTOR also promotes S307 phosphorylation, which is diminished in mice lacking S6K.120,222,223 IKKβ inhibitors (aspirin and salicylates) block S307 phosphorylation,214 which improves insulin sensitivity in obese rodents and in type 2 diabetes patients.224–226 Phosphorylation of S307—located near the PTB domain—inhibits insulin-stimulated IRS1 tyrosine phosphorylation by disrupting the association between the insulin receptor and IRS1,220,227 although this disruption might depend upon the phosphorylation of additional sites.228

FIGURE 8-8 Schematic diagram of heterologous and feedback inhibition of insulin signaling mediated by serine phosphorylation of IRS1. Various kinases in the insulin signaling cascade are implicated in this feedback mechanism, including PKB, mTOR, S6K, ERK, AKT, and atypical PKC isoforms. Other kinases activated by heterologous signals are also involved.
The use of siRNA to suppress the expression of more than 600 kinases in HepG2 cells revealed many kinases that can regulate IRS1 signaling—including Pim2, PDHK, PKC isoforms, CaMKI-like, DAPK2, DCAMKL1, STK10, S-T kinase 25, MKK4, 6, or 7, LIMK2, SIK, CGPK1, et al.229 PKCδ phosphorylates several serine residues that inhibit Irs1 tyrosine phosphorylation: S307, S323, and S574.230 The Akt cascade can mediate negative-feedback inhibition of insulin signaling through S522 phosphorylation231 (see Fig. 8-8). Irs1 contains 6 canonical AKT kinase phosphorylation motifs (RXRXXS). Four of these RXRXXS motifs occur in or near the Irs1 PTB domain (S265, S302, S325, and S358), whereas S522 and S1100 reside among the tyrosine phosphorylation sites in the tail of Irs1. S1100 is phosphorylated by PKCθ, whereas the sites near the PTB domain are phosphorylated by Akt and possibly other kinases.232,233 Atypical protein kinase C isoforms—including PKCθ or PKCζ—are activated by the PI3K cascade and could promote S522 phosphorylation (see Fig. 8-8); rapamycin or glucose starvation does not inhibit insulin-stimulated S522 phosphorylation, excluding the mTORC1→p70s6k cascade.
Some Ser/Thr phosphorylation sites on IRS1 appear to promote insulin-stimulated tyrosine phosphorylation. AMP kinase, which is activated by increased AMP levels during energy depletion, associates with Irs1 and phosphorylates S789, increasing insulin-stimulated tyrosine phosphorylation.234 Under certain experimental conditions, S302 appears to promote Irs1 tyrosine phosphorylation.235 S302 phosphorylation is strongly inhibited by amino acid or glucose starvation, which also attenuates insulin-stimulated tyrosine phosphorylation in cell-based assays. Moreover, S302→A302 substitution inhibits insulin-stimulated tyrosine phosphorylation in cell-based assays. Rapamycin inhibits S302 phosphorylation, but the phosphorylation of other inhibitory sites is also reduced, which generally increases tyrosine phosphorylation.235 More work is needed to understand how multi-site Ser/Thr phosphorylation mediated by various kinases is integrated to regulate tyrosine phosphorylation and glucose tolerance in an intact animal.
Degradation of IRS1
Significant regulation of IRS1 and occasionally IRS2 is thought to occur by ubiquitin-mediated degradation.236,237 Degradation of IRS proteins is stimulated in cultured cells by tumor necrosis factor α (TNF-α), interferon γ, insulin and IGF-1, platelet-derived growth factor (PDFGF), free fatty acids (FFA), 12-myristate 13-acetate (PMA), inhibitors of Ser/Thr phosphatases, and inhibitors of calcineurin.238 Activation of mTORC1 is at least partially responsible for mediating IRS1 degradation, especially during extreme conditions of mTORC1 activation.222,236,239,240 Hyperactivation of the mTORC1 complex in cells lacking TSC1 or TSC2 results in increased serine phosphorylation of IRS proteins222,240; however, there is some evidence that IRS-protein degradation in these cells may be due to coincident activation of endoplasmic reticulum (ER) stress-signaling pathways and is partially separable from the effects of IRS serine phosphorylation.241 Thus Ser/Thr phosphorylation of IRS1 does not appear to be an absolute requirement. Although the mechanism of mTORC1-mediated IRS1 degradation is not completely clear, the E3 ubiquitin-ligase CUL7/Fbw8 might play an important role.242 However, CUL7/Fbw8 does not target IRS2, so other mechanisms must also be involved.243 More work is needed to determine the relevance of IRS protein degradation in various experimental systems to the development of insulin resistance in humans.
SOCS proteins also participate in cross-talk with insulin-like signaling and contribute to insulin resistance (Fig. 8-9). SOCS1 and SOCS3 can bind to distinct domains of the insulin receptor, which influences IR-mediated phosphorylation of IRS1 and IRS2.244 Overexpression of SOCS1 in the liver preferentially inhibits IRS2 tyrosine phosphorylation, whereas SOCS3 overexpression decreases tyrosine phosphorylation of both IRS1 and IRS2.244,245 Resistin can increase SOCS3 in H4IIE hepatocytes, which might explain the inhibitory effect of resistin upon insulin action.245,246 SOCS1 and SOCS3 also targets IRS1—and possibly IRS2—for ubiquitinylation by the elongin BC-containing E3 ubiquitin-ligase complex.247 Overexpression of SOCS1/3 in the liver causes insulin resistance and up-regulation of key regulators involved in fatty acid synthesis and SREBP-1c, whereas inhibition of SOCS1/3 by anti-sense oligonucleotides in obese and diabetic mice improves insulin sensitivity and normalizes SREBP-1c expression.248 In this manner, SOCS1 and SOCS3 can link infection, inflammation, or metabolic stress to insulin resistance and glucose intolerance. Interestingly, the core protein of hepatitis C virus up-regulates SOCS3, which may help explain why infected patients have increased fasting insulin levels compared to patients with other chronic liver disease.249
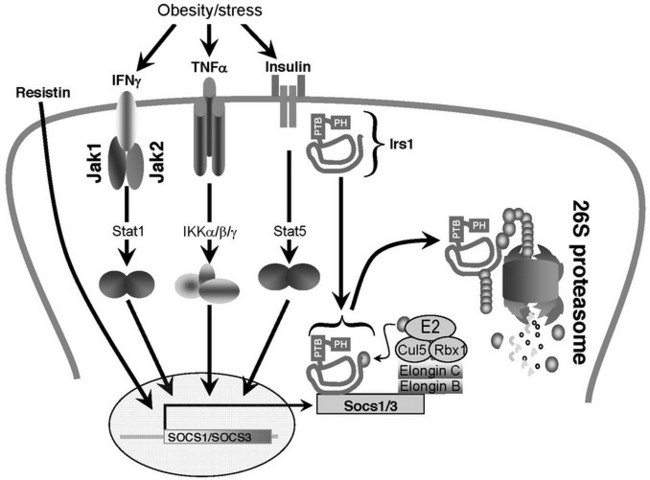
FIGURE 8-9 A potential mechanism of cytokine-induced insulin resistance based on the induced expression of SOCS1/3. Most proinflammatory cytokines that cause insulin resistance also induce the expression of SOCS family members.337,338 SOCS family members contain an NH2-terminal SH2 domain and a COOH-terminal SOCS box.337,338 SOCS proteins might target proteins for ubiquitination and degradation, because the conserved SOCS-box associates with elongin BC-containing ubiquitin ligase E3.339–341 Ubiquitination is expected to promote degradation of IRS protein through the 26S proteasome.
Other Posttranslational Modifications
Acetylation and O-linked beta-N-acetylglucosamine (O-GlcNAc) also regulate insulin signaling. O-GlcNAc was first identified in the 1980s in rat liver subcellular organelles,250 and increased O-GlcNAc of IRS1 and AKT2 in primary rat adipocytes is accompanied by a partial reduction in insulin-stimulated phosphorylation of IRS1 and AKT2.251 At the same time, the NAD+-dependent deacetylase, SirT1, the mammalian homolog of Sir2, may positively regulate insulin-induced IRS2 but not IRS1 tyrosine phosphorylation.252 Sir2 regulates lifespan in C. elegans, Drosophila, and Saccharomyces cerevisiae (where it was first discovered), but the role of SirT1 in lifespan regulation is less clear. SirT1 is involved in glucose homeostasis,253 insulin secretion,254,255 and lipid mobilization.256 These observations illustrate how various metabolic processes such as aging and diabetes could be linked.
Physiology of Insulin Resistance
Type 2 diabetes is the result of insulin resistance that is uncompensated by increased insulin secretory capacity.257 Clinical staging of type 2 diabetes suggests that early insulin resistance in skeletal muscle, which is the primary site of glucose disposal in humans is important in disease initiation.258,259 Compatible with this hypothesis, healthy human subjects that display skeletal muscle insulin resistance exhibit decreased incorporation of glucose into muscle glycogen that is paralleled by increased liver triglyceride synthesis.18 However, animal models of pure skeletal muscle insulin resistance, including mice that lack the insulin receptor in muscle,260 show surprisingly mild phenotypes. Regardless, many features of type 2 diabetes and the associated metabolic syndrome are recapitulated by deletion of the insulin receptor—or the combined deletion of IRS1 and IRS2—in hepatocytes.261–263 These and other experiments, including those delineating the liver transcriptional control network (Fig. 8-10), support the importance of “selective” insulin resistance in diabetes etiology.264 Although adipose tissue is not the primary site of glucose disposal, insulin resistance in visceral adipocytes in particular gives rise to increasing circulating free fatty acids that further contribute to insulin resistance.265
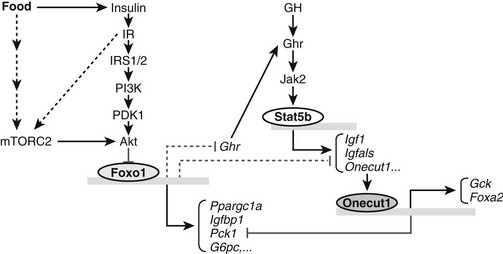
FIGURE 8-10 The role of Foxo1 in insulin and growth hormone (GH) signaling pathways. Insulin can inhibit Foxo1 transcriptional activity through IRS1/2-mediated Akt activation and phosphorylation of Foxo1. As a transcription factor, Foxo1 can activate one set of gluconeogenic and growth inhibitory genes, including Ppargc1a, Pck1, G6pc, and Igfbp1 and directly or indirectly suppress another set of growth promoting genes, including Ghr, Igf1, and Onecut1. Down-regulation of growth hormone receptor (Ghr) gene expression by Foxo1 further influences expression of GH-activated transcription of Igf1, Igfals, and Onecut1. In response to insulin and growth hormone signals, Onecut1 activates Foxa2 and Gck gene expression and suppresses expression of Pck1. Fonts in italic indicate mRNA molecules. Arrows indicate activation and blunted lines represent inhibition. Solid lines or arrows indicate reported links in the literature and dotted lines or arrows indicate implicated links.
Nutrient Excess and Insulin Resistance
Excess metabolites promote the development of type 2 diabetes by both direct and indirect means. The progressive rise in compensatory insulin concentrations during development of type 2 diabetes activates negative feedback of insulin signaling by homologous pathways (e.g., PI3K→AKT→p70S6K; see Fig. 8-5). By contrast with hyperinsulinemia, the accumulation of excess triglycerides within insulin-sensitive tissues inhibits insulin signaling through heterologous down-regulation of IRS1 and IRS2 via pathways involving atypical protein kinase C and JNK kinases (see Fig. 8-8). Increased adipose tissue mass resulting from increased triglyceride storage is also associated with macrophage infiltration into white adipose tissue depots and production of inflammatory cytokines, which may contribute to insulin resistance in other tissues. Serum branched-chain amino acids in conjunction with obesity promote insulin resistance in humans and rodents, owing at least in part to increased muscle mTORC1 activity.266 Increased activation of the mTOR pathway due to nutrient excess contributes to endoplasmic reticulum (ER) stress-mediated insulin resistance (see Fig. 8-8).
The ER is a luminal network where protein synthesis, maturation, folding, and transport occur. The ER is also an important site for lipid and cholesterol biosynthesis.267,268 Perturbation of ER function by various means (e.g., glucose and energy deprivation, viral infection, increased protein trafficking, accumulation of unfolded proteins, cholesterol accumulation, exposure to chemical agents such as tunicamycin and thapsigargin) causes ER stress. Hyperactivation of mTOR due to nutrient excess and hyperinsulinemia seems likely to cause ER stress through increased flux of newly synthesized proteins through the ER lumen. ER stress activates a set of signaling pathways collectively known as the unfolded protein response (UPR).267,268 Distinct branches of the UPR are initiated by the two type-I transmembrane kinases, PERK (PKR-like endoplasmic reticulum kinase) and IRE1 (inositol requiring enzyme-1); and by ATF6 (activating transcription factor-6), a type-II transmembrane protein.267,268
ER stress likely causes heterologous down-regulation of IRS-protein signaling through activation of the IRE1→JNK branch of the UPR (see Fig. 8-8). Activation of IRE1→JNK signaling in the liver and adipose tissues creates insulin resistance concomitant with an increase in serine phosphorylation of IRS1.269 UPR activation owing to mTORC1 hyperactivation also appears to be largely responsible for the resulting ubiquitin/proteasome-dependent degradation of IRS1.241 Recent observations further indicate that PERK-mediated phosphorylation of eIF2 contributes to accumulation of lipids in the liver, which may indirectly inhibit IRS-protein function.270
Genetically engineered mouse models susceptible to development of ER stress gain more weight and develop more severe insulin resistance than controls. For example, mice lacking one allele of X-box binding protein 1 (XBP1), a transcription factor that regulates ER folding capacity, develop higher levels of ER stress, obesity, and insulin resistance.269 Furthermore, when ER stress is attenuated in the obese and diabetic mice through the use of chemical chaperones—agents that have ability to increase ER folding capacity—insulin resistance is abolished, glucose tolerance is greatly enhanced, and blood glucose concentration returns to normal.271 The presence of ER stress in the liver and fat tissues of obese patients strengthens the conclusion that this system plays a significant role in development of insulin resistance.272 Future studies are needed to investigate whether chemical chaperones will have antidiabetic effects in humans.
Inflammation and Insulin Resistance
Adipose tissue functions not only as a passive depot for energy storage but as an active secretory organ that modifies insulin sensitivity through production of several adipocyte-derived cytokines, or adipokines.273 Important adipokines that contribute to normal physiology include leptin, which regulates energy balance through hypothalamic control of satiety and energy expenditure, and adiponectin, the circulating concentration of which is positively correlated with insulin sensitivity in humans. By contrast with these molecules, factors secreted by adipose tissue during obesity can promote insulin resistance by generation of persistent low-grade inflammation.17,274
Increased triglyceride storage during obesity gives rise to an expanded white adipose tissue compartment characterized by the presence of hypoxia and infiltrating macrophages.257 Hypoxia likely contributes to the generation of a microenvironment conducive to macrophage infiltration,275 which results in increased local and circulating concentrations of proinflammatory cytokines, including monocyte chemoattractant protein (MCP1), IL-6, and TNF-α, each one of which is up-regulated transcriptionally by the immunomodulatory transcription factor nuclear factor (NF)-κB.274 MCP1 expression causes increased recruitment of macrophages to adipose tissue. In agreement with a general role of adipose tissue inflammation in causing insulin resistance, mice lacking MCP1 show increased insulin sensitivity.276 Although serum IL-6 concentration is positively correlated with human obesity, mice lacking the IL-6 gene are obese and insulin resistant277; thus, the role of this cytokine in modification of insulin sensitivity is still debated.
TNF-α activates signaling cascades in insulin-sensitive tissues that result in activation of Jun N-terminal kinase 1 (JNK1) and the inhibitor of kappa light polypeptide gene enhancer in β cells, kinase beta (IKKβ).274 In addition to cytokines, JNK1 and IKKβ can be stimulated by FFAs or by pattern-recognition receptors of the innate immune system, such as toll-like receptor 4 (TLR4).278 JNK1-deficient mice are protected from obesity and insulin resistance caused by high-fat-diet feeding, indicating an important role of this kinase in development of insulin resistance.221 Compatible with phosphorylation and inhibition of IRS proteins by JNK kinases, mice lacking JNK1 also show decreased phosphorylation of IRS1 at Ser307. Inhibition of JNK activity using JNK inhibitors in obese mice increases insulin sensitivity and improves glucose homeostasis.279 Paradoxically, however, increased circulating TG concentration and hepatic TG accumulation are observed in this model, reflecting the complex role of JNK in mediation of insulin resistance due to fatty acids and inflammation.280
TNF-α signaling also interacts with excess fatty acids to stimulate the production of ceramide. Accumulation of ceramide in insulin-responsive tissues also causes insulin resistance, likely through a mechanism involving serine phosphorylation of IRS proteins; however, the relevant kinases have not been determined.281 Further demonstrating the connection between lipids and inflammation, in rodents, the inhibitory effects of lipid or free fatty acid infusion are reduced by agents that prevent accumulation of ceramide.282
Although increased circulating TNF-α concentration is generally accepted to cause insulin resistance, there is substantial disagreement about how common this might be in human insulin resistance.274 Moreover, the improved insulin sensitivity reported for mice lacking TNF-α is not, in at least one report, shared by mice that lack the two TNF-α receptors.283 Similarly, the administration to insulin resistant humans of a highly effective TNF-α inhibitor for 3 months does not improve glucose homeostasis, despite reduction in some parameters of systemic inflammation.284 Thus, despite some very strong experimental evidence, the physiologic relevance of TNF-α as a cause of insulin resistance in humans remains unclear.
Excess triglycerides not stored in adipose tissues accumulate within the muscle, liver, and other tissues, impairing insulin signaling by heterologous pathways involving IRS1 (and possibly IRS2) Ser/Thr phosphorylation or by other inflammatory signaling pathways.257,274,285 A variety of clinical and experimental data support the hypothesis that intramyocellular triglyceride (IMTG) causes skeletal muscle insulin resistance in humans and rodents.285 Infusion of triglyceride/heparin solutions into humans or rodents—which transiently increases circulating free fatty acid concentration—inhibits insulin-stimulated glucose disposal into muscle by a mechanism involving decreased Irs1-associated PI3K activity.215,286,287 In mice and rats, this resistance is associated with increased muscle Ser307 phosphorylation,215 which (based on studies of knockout mice) occurs via PKCθ- and IKKβ-dependent pathways.224,288 In liver, PKCε functions similarly to PKCθ in muscle285 and may contribute to the loss of inhibition of hepatic gluconeogenesis by insulin caused by FFA in human studies.289,290 For both PKCθ and PKCε, the relevant activating ligands are diacylglycerols (DAG) present in increased concentration intracellularly as a result of decreased fatty acid oxidation or increased TG synthesis.285
In the liver, Kupffer cells are the equivalent of adipose tissue macrophages and are of equal or greater influence in the regulation of insulin sensitivity.274 Importantly, both of these types of myeloid-derived tissue-resident macrophages can undergo either classical (M1) activation by inflammatory cytokines, such as IL-1, or alternative (M2a) activation in response to IL-4 or IL-13, resulting in the production either more (M1) or less (M2a) inflammatory cytokines; moreover, it is clear that the cytokines released by adipose tissue macrophages during high-fat feeding or obesity result from M1 macrophage infiltration, whereas adipose tissue macrophages in lean animals are M2a macrophages.291 Recent data indicate that the presence of tissue resident macrophages with the M2a profile is not merely neutral with respect to insulin sensitivity. Rather, the blockade of alternative macrophage activation—for example, by deletion of peroxisome proliferation activator delta (PPARδ) in myeloid cells292,293—results in impaired insulin sensitivity in mice challenged with high-fat feeding. Further experiments are necessary to establish whether activation of alternative macrophage activation by manipulation of PPARδ or other means might be an effective adjunct to current therapies for treatment of insulin resistance.
IRS-Based Regulation of Nutrient Homeostasis and Lifespan
The IR→IRS Signaling Cascade in Liver
Hyperglycemia and dyslipidemia due to hepatic insulin resistance are key pathologic features of type 2 diabetes.294,295 In mice, near-total hepatic insulin resistance can be introduced via the systemic or liver-specific knockout of key insulin signaling genes.132,147,151,261,296 Among these approaches, the compound suppression or deletion of the insulin receptor substrates, Irs1 and Irs2, are the least complicated by defective insulin clearance or liver failure.131,132
Hepatic deficiency of Irs1 and Irs2 leads to a significant growth retardation in both prediabetic and diabetic mice. Consistent with this phenotype, the expression of several hepatic genes that promote organismic growth (Igf1, Igfals, and Ghr) are significantly reduced in mice lacking Irs1 and Irs2.297 Moreover, the expression of Igfbp1 increases significantly in Irs1/2-deficient liver, which leads to increased circulating concentrations of Igfpb1 that inactivate Igf1.7 The deletion of hepatic Foxo1 restores normal expression of these genes in the Irs1 and Irs2-deficient liver, restoring growth of the mice to a normal size. Stat5b is well known to regulate Igf1 and Igfals expression, but whether Foxo1 directly modulates their expression requires additional work (see Fig. 8-10).298 Regardless, the postprandial inactivation of Foxo1 by the IR→IRS→PI3K→AKT cascade appears to be essential for the control of body growth by growth hormone and endocrine Igf1.
The program of gene expression directed by Foxo1 and its cofactors ordinarily protects cells, as well as whole organisms, from the life-threatening consequences of nutrient deprivation and oxidative and genotoxic stresses.299 This effect is especially important during prolonged starvation, because hepatic Foxo1 ensures the production of sufficient glucose to prevent life-threatening hypoglycemia.206 In healthy animals, the decreased insulin concentration during fasting promotes the nuclear localization of Foxo1, where it interacts with Ppargc1a and Creb/Crtc2 to increase the expression of the key gluconeogenic enzymes G6pc and Pck1300–305 (see Fig. 8-10). In conjunction with Creb/Crtc2, Foxo1 also increases the expression of Irs2 and reduces the expression of the Akt inhibitor Trib3, which together can enhance fasting insulin sensitivity and augment the insulin response upon eventual feeding.201,306 Although Foxo1 can be regulated by many mechanisms, its inactivation in postprandial liver appears to be under the exclusive control of the IRS1/2→Akt cascade (see Fig. 8-10).
In addition to the inactivation of Foxo1, inhibition of hepatic gluconeogenesis also involves the inactivation of a glucagon-stimulated nuclear transcription complex assembled from CREB (cAMP response element binding protein), CBP (CREB-binding protein) and CRTC2 (CREB-regulated transcription coactivator 2) (Fig. 8-11). During starvation, glucagon promotes the assembly of the transcriptionally active CREB-CBP-CRTC2 complex, which increases the expression of PPARGC1A, Pck1 (phosphoenolpyruvate carboxykinase), and G6pase (glucose 6-phosphatase).307 Inactivation of the CREB-CBP-CRTC2 complex involves two branches of the insulin signaling cascade. Atypical PKC-mediated phosphorylation of CBP appears to be one of the first steps to disassemble the active complex.308 Insulin appears to activate atypical PKC exclusively through the IRS2 branch of the signaling cascade.309 How this signaling specificity arises is unknown, but it is probably very important, because IRS2 expression is ordinarily augmented during starvation by CREB-CBP-CRTC2 itself. The second step is mediated by the PI3K→AKT cascade that stimulates SIK2 (salt inducible kinase 2), which inactivates the CREB-CBP-CRTC2 complex by phosphorylating CRTC2 at Ser171 and targeting it for degradation in the cytosol (see Fig. 8-11).300
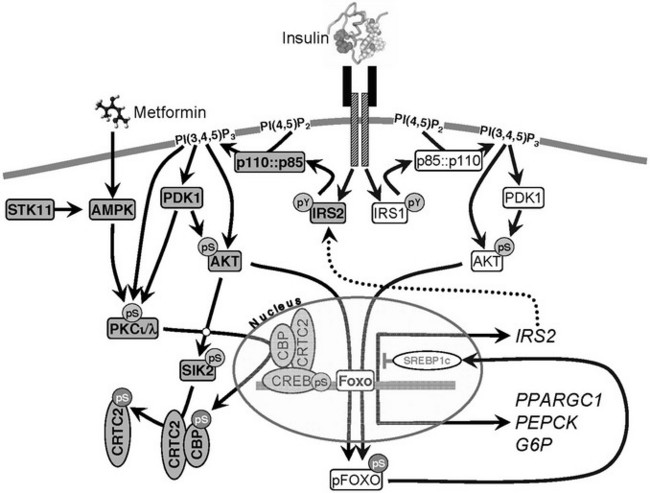
FIGURE 8-11 Insulin and metformin signaling to aPKC in liver. Elements of the IRS2 branch of the insulin signaling cascade are shaded grey, whereas elements of the IRS1 branch of the cascade are not shaded. IRS1 and IRS2 play a common role in the activation of the phosphatidylinositol 3-kinase (PI3K)→[PDK1→AKT]→FOXO cascade that results in exclusion of FOXO1 from the nucleus. The IRS2→PI3K→[PDK1→aPKCι/λ]→CBP cascade specifically inactivates the CREB : CBP : CRTC2 transcription complex. Metformin activates aPKCι/λ through a different mechanism that circumvents hepatic insulin resistance to phosphorylate CBP and inactivate the CREB : CBP : CRTC2 transcription complex, especially during hepatic insulin resistance associated with obesity and type 2 diabetes. Phosphorylation events shown (pS or pY) are activating, except for inhibitory phosphorylation of FOXO1 and the CREB : CBP : CRTC2 complex.
Metformin, a first-line treatment for type 2 diabetes, also activates atypical PKC in liver to phosphorylate CBP and disassemble the CBP:CRTC2 dimer from CREB (see Fig. 8-11). Since nutrient excess and compensatory hyperinsulinemia preferentially suppresses hepatic IRS2, metformin can circumvent the block imposed by hepatic insulin resistance and activate a common signaling intermediate that reduces the expression of gluconeogenic enzymes under conditions of obesity, insulin resistance, and hyperglycemia.
IRS-Protein Signaling in Pancreatic β Cells
Mice lacking the Irs1 or Irs2 genes are insulin resistant, with impaired peripheral glucose utilization.129,310,311 Both types of knockout mice display metabolic dysregulation, but only Irs2−/− mice develop diabetes between 10 and 15 weeks of age, owing to a near-complete loss of pancreatic β cells.129 These results position the insulin-like signaling cascade through IRS2 at the center of β-cell function (Fig. 8-12). Among 4-week-old mice, β-cell mass is nearly normal in Irs2−/− mice, whereas it is reduced by 50% in Igf1r+/−::Irs2+/− mice and nearly undetectable in Igf1r+/−::Irs2−/− mice.312 However, the targeted deletion of the Igf1r in β cells has insignificant effects upon β-cell growth and survival, suggesting that Igf1→Irs2 signaling might not be β-cell autonomous.313,314 The β-cell-specific deletion of both IR and IGF1R in β cells causes loss of β-cell mass by 2 weeks of age, suggesting that both receptor kinases—and possibly receptor hybrids—promote the IRS2 signaling needed for β-cell growth and survival.315
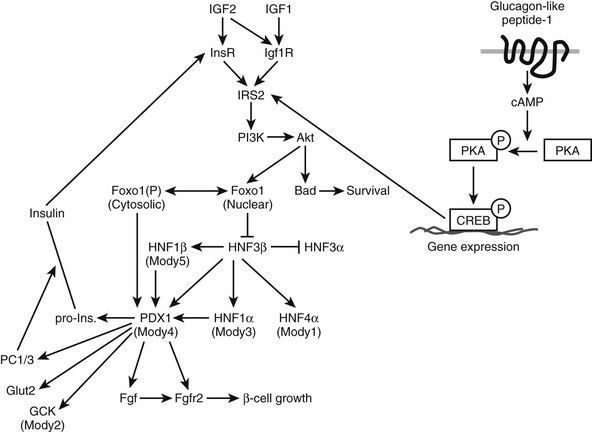
FIGURE 8-12 Pathways linking IRS2 to the maintenance of pancreatic β-cell function. The diagram shows the relation between the MODY genes, especially PDX1, and the IRS2 branch of the insulin signaling pathway.318 Drugs that promote IRS2 signaling are expected to promote PDK1 function in β cells, including the phosphorylation of AKT, BAD, and FOXO1, which promotes β-cell growth, function, and survival. Induction of PDX1 promotes the expression of gene products that enhance glucose sensing and insulin secretion. Activation of cAMP→CREB signaling induces IRS2 expression in β cells, revealing a mechanism that promotes β-cell growth, function, and survival.
Many factors are required for proper β-cell function, including the homeodomain transcription factor, Pdx1. Pdx1 regulates downstream genes needed for β-cell growth and function, and mutations in PDX1 cause autosomal forms of early-onset diabetes in people (MODY)316,317 (see Fig. 8-12). Pdx1 is reduced in Irs2−/− islets, and Pdx1 haploinsufficiency further diminishes the function of β cells lacking Irs2. By comparison, transgenic Pdx1 expressed in Irs2−/− mice restores β-cell function and normalizes glucose tolerance, linking the insulin-like signaling cascade to the network of β-cell transcription factors.318,319 Transgenic expression of Irs2 or suppression of Foxo1 increases Pdx1 concentrations in Irs2−/− mice, supporting the hypothesis that Pdx1 is modulated by the Irs2→Foxo1 cascade in β cells319,320 (see Fig. 8-12). Haploinsufficiency for PTEN also prevents β-cell failure in Irs2−/− mice, due at least in part to the stimulation of the PI3K→PKB/AKT cascade that inhibits Foxo1 (see Fig. 8-5).
Glucose and glucagon-like peptide-1 (GLP1) have strong effects upon β-cell growth, which depend upon the Irs2 signaling cascade. Irs2 is strongly up-regulated by these cAMP and Ca2+ agonists, which activate cAMP responsive element binding protein (CREB) and the CREB-regulated transcription coactivator 2 (CRTC2).321 While many cAMP-mediated pathways oppose the action of insulin, the upregulation of Irs2 by glucose and GLP1 reveals an unexpected intersection of these important signals (see Fig. 8-5). Thus, hyperglycemia resulting from the daily consumption of high-caloric food promotes β-cell growth by increasing IRS2 expression.322 Mice expressing low concentrations of glucokinase in β cells display impaired intracellular calcium responses to glucose, which suppresses the phosphorylation of CREB that induces Irs2 expression. Similarly, GLP1 couples into this mechanism by directly increasing the concentration of cAMP in β cells.321 Glucose and GLP1 have no effect upon β-cell growth in Irs2−/− mice.323 Thus, the Irs2-branch of the insulin-like signaling cascade—rather than Irs1 or the upstream receptor kinases—is an important “gatekeeper” for β-cell plasticity and function (see Fig. 8-10).
ATF3, a stress-inducible proapoptotic gene, can inhibit IRS2 expression in β cells, revealing a direct inverse link between the stress response and β-cell survival.202 ATF3 is a member of the ATF/CREB family of transcription factors but has an opposite effect from CREB. Thus, the CRE/ATF-like site on the IRS2 promoter acts as an integration point for survival signals (such as GLP-1) and stress signals (such as proinflammatory cytokines) to exert their opposite effects on IRS2 transcription. Because ATF3 is induced by a variety of stress signals, it can function as a mechanism to suppress β-cell expansion when it is physiologically important to suppress the production of excess insulin that could oppose the release of glucose and other nutrients needed for longer-term repair.
Central Control of Nutrient Homeostasis and Lifespan
Work with lower metazoans—mainly C. elegans and Drosophila—has drawn attention to the idea that less insulin-like signaling extends healthy lifespan.3 Female fruit flies live up to 80% longer when the activity of the Drosophila insulin-like receptor is reduced by 80%.324 Moreover, ablation of neurosecretory cells in adult Drosophila that produce three of the seven insulin-like peptides also extends lifespan. Although the long-lived flies show resistance to oxidative stress, they also accumulate excess lipids and carbohydrate.325 Thus, reduced insulin-like signaling can extend lifespan in lower metazoans but cause paradoxically physiologic alterations that are associated with life-threatening diseases in rodents and humans.
Recent results point to the brain as the site where reduced insulin-like signaling might have a consistent effect to extend mammalian lifespan—as it does in C. elegans and D. melanogaster.3,326 Irs1 and Irs2 are expressed in neurons throughout the brain, and Irs4 is expressed in the hypothalamus. However, Irs2 appears to play a major role for brain growth, fertility,327,328 and nutrient homeostasis.329–331 Proper regulation of Irs2 signaling in the brain might also play a role in mouse lifespan.332 At 22 months of age, brain Irs2 knockout mice are slightly hyperphagic, overweight, hyperinsulinemic, and glucose intolerant; however, compared to control mice, brain Irs2 knockout mice display stable superoxide dismutase-2 (SOD) concentration in the hypothalamus during meals. Reduced Irs2 signaling in the brain increases by nearly 6 months the lifespan of mice maintained on a high-energy diet.332
As mammals age, compensatory hyperinsulinemia usually develops to maintain glucose homeostasis and prevent the progression toward life-threatening type 2 diabetes.36 While this response is important at middle age, the chronic elevation of circulating insulin might have negative effects upon the brain that can reduce lifespan.28,333,334 By directly attenuating brain Irs2 signaling, an aging brain can be shielded from the negative effects of overweight and hyperinsulinemia that ordinarily develop with advancing age. This hypothesis helps explain why lifespan correlates with reduced insulin signaling in C. elegans and Drosophila but correlates with peripheral insulin sensitivity in rodents—and probably in humans. Caloric restriction and exercise are the usual ways to increase peripheral insulin sensitivity and reduce the amount of circulating insulin needed to regulate circulating glucose throughout life. Moreover, these strategies might increase lifespan by reducing the activation of brain IRS2. Other genetic strategies that improve peripheral insulin sensitivity, including reduced growth hormone or adipocyte insulin signaling, can be explained by a similar mechanism.335,336 Consistent with this hypothesis, human centenarians display increased peripheral insulin sensitivity and reduced circulating insulin levels.28 Hence, less insulin-like signaling in the brain increases mammalian lifespan, just as reduced insulin-like signaling extends the lifespan of C. elegans and Drosophila.
References
1. Conlon, JM. Evolution of the insulin molecule: insights into structure-activity and phylogenetic relationships. Peptides. 2001 Jul;22:1183–1193.
2. Geminard, C, Arquier, N, Layalle, S, et al. Control of metabolism and growth through insulin-like peptides in Drosophila. Diabetes. 2006 Dec 1;55(Supplement2):S5–S8.
3. Kenyon, C. The plasticity of aging: insights from long-lived mutants. Cell. 2005 Feb 25;120:449–460.
4. Ament, SA, Corona, M, Pollock, HS, et al. Insulin signaling is involved in the regulation of worker division of labor in honey bee colonies. Proc Natl Acad Sci U S A. 2008 Mar 18;105:4226–4231.
5. Sherwood, OD. Relaxin’s physiological roles and other diverse actions. Endocr Rev. 2004 Apr;25:205–234.
6. Wilkinson, TN, Speed, TP, Tregear, GW, et al. Evolution of the relaxin-like peptide family. BMC Evol Biol. 2005 Feb 12;5:14.
7. Clemmons, DR. Involvement of insulin-like growth factor-I in the control of glucose homeostasis. Curr Opin Pharmacol. 2006 Dec;6:620–625.
8. Dunger, DB, Ong, KK, Sandhu, MS. Serum insulin-like growth factor-I levels and potential risk of type 2 diabetes. Horm Res. 2003;60(Suppl 3):131–135.
9. Stumvoll, M, Goldstein, BJ, van Haeften, TW. Type 2 diabetes: principles of pathogenesis and therapy. Lancet. 2005 Apr 9;365:1333–1346.
10. Fajans, SS, Bell, GI, Polonsky, KS. Molecular mechanisms and clinical pathophysiology of maturity-onset diabetes of the young. N Engl J Med. 2001 Sep 27;345:971–980.
11. Frayling, TM, Evans, JC, Bulman, MP, et al. Beta-cell genes and diabetes: molecular and clinical characterization of mutations in transcription factors. Diabetes. 2001 Feb;50(Suppl 1):S94–100.
12. Froguel, P, Velho, G. Molecular genetics of maturity-onset diabetes of the young. Trends Endocrinol Metab. 1999 May;10:142–146.
13. Nakayama, M, Abiru, N, Moriyama, H, et al. Prime role for an insulin epitope in the development of type 1 diabetes in NOD mice. Nature. 2005 May 12;435:220–223.
14. Zhang, L, Nakayama, M, Eisenbarth, GS. Insulin as an autoantigen in NOD/human diabetes. Curr Opin Immunol. 2008 Feb;20:111–118.
15. Meier, JJ, Bhushan, A, Butler, AE, et al. Sustained beta cell apoptosis in patients with long-standing type 1 diabetes: indirect evidence for islet regeneration? Diabetologia. 2005 Nov;48:2221–2228.
16. Monzavi, R, Dreimane, D, Geffner, ME, et al. Improvement in risk factors for metabolic syndrome and insulin resistance in overweight youth who are treated with lifestyle intervention. Pediatrics. 2006 Jun;117:e1111–e1118.
17. Hotamisligil, GS. Inflammation and metabolic disorders. Nature. 2006 Dec;14(444):860–867.
18. Petersen, KF, Dufour, S, Savage, DB, et al. The role of skeletal muscle insulin resistance in the pathogenesis of the metabolic syndrome. Proc Natl Acad Sci U S A. 2007 Jul 31;104:12587–12594.
19. Semple, RK, Sleigh, A, Murgatroyd, PR, et al. Postreceptor insulin resistance contributes to human dyslipidemia and hepatic steatosis. J Clin Invest. 2009 Feb;119:315–322.
20. Vaxillaire, M, Veslot, J, Dina, C, et al. Impact of common type 2 diabetes risk polymorphisms in the DESIR prospective study. Diabetes. 2008 Jan;57:244–254.
21. Nandi, A, Kitamura, T, Kahn, CR, et al. Mouse models of insulin resistance. Physiol Rev. 2004 Apr;84:623–647.
22. DeFronzo, RA. Pathogenesis of type 2 diabetes mellitus. Med Clin North Am. 2004 Jul;88:787–835. [ix].
23. Reaven, GM. Pathophysiology of insulin resistance in human disease. Physiol Rev. 1995 Jul;75:473–486.
24. Kitabchi, AE, Nyenwe, EA. Hyperglycemic crises in diabetes mellitus: diabetic ketoacidosis and hyperglycemic hyperosmolar state. Endocrinol Metab Clin North Am. 2006 Dec;35:725–751. [viii].
25. Brownlee, M. The pathobiology of diabetic complications: a unifying mechanism. Diabetes. 2005 Jun;54:1615–1625.
26. Stentz, FB, Umpierrez, GE, Cuervo, R, et al. Proinflammatory cytokines, markers of cardiovascular risks, oxidative stress, and lipid peroxidation in patients with hyperglycemic crises. Diabetes. 2004 Aug;53:2079–2086.
27. Cole, GM, Frautschy, SA. The role of insulin and neurotrophic factor signaling in brain aging and Alzheimer’s Disease. Exp Gerontol. 2007 Jan;42:10–21.
28. Barbieri, M, Rizzo, MR, Manzella, D, et al. Glucose regulation and oxidative stress in healthy centenarians. Exp Gerontol. 2003 Jan;38:137–143.
29. Andersen, SL, Terry, DF, Wilcox, MA, et al. Cancer in the oldest old. Mech Ageing Dev. 2005 Feb;126:263–267.
30. Terry, DF, Wilcox, MA, McCormick, MA, et al. Lower all-cause, cardiovascular, and cancer mortality in centenarians’ offspring. J Am Geriatr Soc. 2004 Dec;52:2074–2076.
31. Perls, TT. The different paths to 100. Am J Clin Nutr. 2006 Feb;83:484S–487S.
32. De Meyts, P. Insulin and its receptor: structure, function and evolution. Bioessays. 2004 Dec;26:1351–1362.
33. Brzozowski, AM, Dodson, EJ, Dodson, GG, et al. Structural origins of the functional divergence of human insulin-like growth factor-I and insulin. Biochemistry. 2002 Jul 30;41:9389–9397.
34. Ullrich, A, Bell, JR, Chen, EY, et al. Human insulin receptor and its relationship to the tyrosine kinase family of oncogenes. Nature. 1985;313:756–761.
35. Ebina, Y, Ellis, L, Jarnagin, K, et al. The human insulin receptor cDNA: the structural basis for hormone activated transmembrane signalling. Cell. 1985;40:747–758.
36. White, MF. Insulin signaling in health and disease. Science. 2003 Dec 5;302:1710–1711.
37. Schlessinger, J. Cell signaling by receptor tyrosine kinases. Cell. 2000 Oct 13;103:211–225.
38. Myers, MG, Jr., White, MF. The new elements in insulin signaling. Insulin receptor substrate-1 and proteins with SH2 domains. Diabetes. 1993;42:643–650.
39. White, MF, Kahn, CR. The insulin signaling system. J Biol Chem. 1994;269:1–4.
40. Kiselyov, VV, Versteyhe, S, Gauguin, L, et al. Harmonic oscillator model of the insulin and IGF1 receptors’ allosteric binding and activation. Mol Syst Biol. 2009;5:243.
41. Yang Feng, TL, Francke, U, Ullrich, A. Gene for human insulin receptor: localization to site on chromosome 19 involved in pre-B-cell leukemia. Science. 1985;228:728–731.
42. Seino, S, Seino, M, Nishi, S, et al. Structure of the human insulin receptor gene and characterization of its promoter. Proc Natl Acad Sci U S A. 1989;86:114–118.
43. Nef, S, Verma-Kurvari, S, Merenmies, J, et al. Testis determination requires insulin receptor family function in mice. Nature. 2003 Nov 20;426:291–295.
44. Blanquart, C, Achi, J, Issad, T. Characterization of IRA/IRB hybrid receptors using bioluminescence resonance energy transfer. Biochem Pharmacol. 2008 Jul 31.
45. Sparrow, LG, Lawrence, MC, Gorman, JJ, et al. N-linked glycans of the human insulin receptor and their distribution over the crystal structure. Proteins. 2008 Apr;71:426–439.
46. Sparrow, LG, Gorman, JJ, Strike, PM, et al. The location and characterisation of the O-linked glycans of the human insulin receptor. Proteins. 2007 Feb 1;66:261–265.
47. Kasuga, M, Hedo, JA, Yamada, KM, et al. The structure of the insulin receptor and its subunits: evidence for multiple non-reduced forms and a 210K possible proreceptor. J Biol Chem. 1982;257:10392–10399.
48. Hedo, JA, Kahn, CR, Hayoshi, M, et al. Biosynthesis and glycosylation of the insulin receptor. Evidence for a single polypeptide precursor of the two major subunits. J Biol Chem. 1983;258:10020–10026.
49. Mosthaf, L, Grako, K, Dull, TJ, et al. Functionally distinct insulin receptors generated by tissue-specific alternative splicing. EMBO J. 1990 Aug;9:2409–2413.
50. Moller, DE, Yokota, A, Caro, JF, et al. Tissue-specific expression of two alternatively spliced insulin receptor mRNAs in man. Mol Endocrinol. 1989;3:1263–1269.
51. Goldstein, BJ, Kahn, CR. Analysis of mRNA heterogeneity by ribonuclease H mapping: application to the insulin receptor. Biochem Biophys Res Commun. 1989;159:664–669.
52. Seino, S, Bell, GI. Alternative splicing of human insulin receptor messenger RNA. Biochem Biophys Res Commun. 1989;159:312–316.
53. Barzilai, N, Wang, J, Massilon, D, et al. Leptin selectively decreases visceral adiposity and enhances insulin action. J Clin Invest. 1997;100:3105–3110.
54. Benyoucef, S, Surinya, KH, Hadaschik, D, et al. Characterization of insulin/IGF hybrid receptors: contributions of the insulin receptor L2 and Fn1 domains and the alternatively spliced exon 11 sequence to ligand binding and receptor activation. Biochem J. 2007;403:603–613.
55. Whittaker, J, Sorensen, H, Gadsboll, VL, et al. Comparison of the functional insulin binding epitopes of the A and B isoforms of the insulin receptor. J Biol Chem. 2002 Dec 6;277:47380–47384.
56. Williams, PF, Mynarcik, DC, Yu, GQ, et al. Mapping of an NH2-terminal ligand binding site of the insulin receptor by alanine scanning mutagenesis. J Biol Chem. 1995;270:3012–3016.
57. Schumacher, R, Soos, MA, Schlessinger, J, et al. Signaling-competent receptor chimeras allow mapping of major insulin receptor binding domain determinants. J Biol Chem. 1993;268:1087–1094.
58. De Meyts, P, Whittaker, J. Structural biology of insulin and IGF1 receptors: implications for drug design. Nat Rev Drug Discov. 2002 Oct;1:769–783.
59. De Meyts, P, Bianco, AR, Roth, J. Site-site interaction among insulin receptors: characterization of the negative cooperativity. J Biol Chem. 1976;251:1877–1888.
60. De Meyts, P. The insulin receptor: a prototype for dimeric, allosteric membrane receptors? Trends Biochem Sci. 2008 Aug;33:376–384.
61. Lawrence, MC, McKern, NM, Ward, CW. Insulin receptor structure and its implications for the IGF-1 receptor. Curr Opin Struct Biol. 2007 Dec;17:699–705.
62. Ward, CW, Lawrence, MC, Streltsov, VA, et al. The insulin and EGF receptor structures: new insights into ligand-induced receptor activation. Trends Biochem Sci. 2007 Mar;32:129–137.
63. McKern, NM, Lawrence, MC, Streltsov, VA, et al. Structure of the insulin receptor ectodomain reveals a folded-over conformation. Nature. 2006 Sep 14;443:218–221.
64. Kasuga, M, Zick, Y, Blithe, DL, et al. Insulin stimulation of phosphorylation of the β-subunit of the insulin receptor: formation of both phosphoserine and phosphotyrosine. J Biol Chem. 1982;257:9891–9894.
65. Rosen, OM, Herrera, R, Olowe, Y, et al. Phosphorylation activates the insulin receptor tyrosine protein kinase. Proc Natl Acad Sci U S A. 1983;80:3237–3240.
66. White, MF, Haring, HU, Kasuga, M, et al. Kinetic properties and sites of autophosphorylation of the partially purified insulin receptor from hepatoma cells. J Biol Chem. 1984;259:255–264.
67. Czech, MP. Molecular basis of insulin action. Annu Rev Biochem. 1977;46:359–384.
68. Saltiel, AR, Fox, JA, Sherline, P, et al. Insulin-stimulated hydrolysis of a novel glycolipid generates modulators of cAMP phosphodiesterase. Science. 1986;233:967–972.
69. Taylor, SI. Deconstructing type 2 diabetes. Cell. 1999 Apr 2;97:9–12.
70. White, MF, Shoelson, SE, Keutmann, H, et al. A cascade of tyrosine autophosphorylation in the beta-subunit activates the phosphotransferase of the insulin receptor. J Biol Chem. 1988 Feb 25;263:2969–2980.
71. Rajagopalan, M, Neidigh, JL, McClain, DA. Amino acid sequences Gly-Pro-Leu-Tyr and Asn-Pro-Glu-Tyr in the submembranous domain of the insulin receptor are required for normal endocytosis. J Biol Chem. 1991;266:23068–23073.
72. Cann, AD, Kohanski, RA. Cis-autophosphorylation of juxtamembrane tyrosines in the insulin receptor kinase domain. Biochemistry. 1997;36:7681–7689.
73. Hubbard, SR, Wei, L, Ellis, L, et al. Crystal structure of the tyrosine kinase domain of the human insulin receptor. Nature. 1994;372:746–754.
74. Till, JH, Ablooglu, AJ, Frankel, M, et al. Crystallographic and solution studies of an activation loop mutant of the insulin receptor tyrosine kinase: insights into kinase mechanism. J Biol Chem. 2001 Mar 30;276:10049–10055.
75. Wilden, PA, Kahn, CR, Siddle, K, et al. Insulin receptor kinase domain autophosphorylation regulates receptor enzymatic function. J Biol Chem. 1992;267:16660–16668.
76. Hubbard, SR, Miller, WT. Receptor tyrosine kinases: mechanisms of activation and signaling. Curr Opin Cell Biol. 2007 Apr;19:117–123.
77. Hu, J, Liu, J, Ghirlando, R, et al. Structural basis for recruitment of the adaptor protein APS to the activated insulin receptor. Mol Cell. 2003 Dec;12:1379–1389.
78. Stein, EG, Gustafson, TA, Hubbard, SR. The BPS domain of Grb10 inhibits the catalytic activity of the insulin and IGF1 receptors. Growth Regul. 2001 Mar 30;493:106–111.
79. Cooney, GJ, Lyons, RJ, Crew, AJ, et al. Improved glucose homeostasis and enhanced insulin signalling in Grb14-deficient mice. EMBO J. 2004 Feb 11;23:582–593.
80. Kasuga, M, Karlsson, FA, Kahn, CR. Insulin stimulates the phosphorylation of the 95,000-dalton subunit of its own receptor. Science. 1982;215:185–187.
81. Kasuga, M, Zick, Y, Blithe, DL, et al. Insulin stimulates tyrosine phosphorylation of the insulin receptor in a cell-free system. Nature. 1982;298:667–669.
82. White, MF, Maron, R, Kahn, CR. Insulin rapidly stimulates tyrosine phosphorylation of a Mr 185,000 protein in intact cells. Nature. 1985;318:183–186.
83. White, MF, Livingston, JN, Backer, JM, et al. Mutation of the insulin receptor at tyrosine 960 inhibits signal transmission but does not affect its tyrosine kinase activity. Cell. 1988;54:641–649.
84. Sun, XJ, Rothenberg, PL, Kahn, CR, et al. The structure of the insulin receptor substrate IRS-1 defines a unique signal transduction protein. Nature. 1991;352:73–77.
85. Bjornholm, M, He, AR, Attersand, A, et al. Absence of functional insulin receptor substrate-3 ( IRS-3) gene in humans. Diabetologia. 2002 Dec;45:1697–1702.
86. Numan, S, Russell, DS. Discrete expression of insulin receptor substrate-4 mRNA in adult rat brain. Brain Res Mol Brain Res. 1999 Sep 8;72:97–102.
87. White, MF, Myers, MG. The molecular basis of insulin action. In: DeGroot LJ, Jameson JL, eds. Endocrinology. ed 4. Philadelphia: Saunders; 2001:712–727.
88. Backer, JM, Myers, MG, Jr., Shoelson, SE, et al. Phosphatidylinositol 3′-kinase is activated by association with IRS-1 during insulin stimulation. EMBO J. 1992;11:3469–3479.
89. Nelms, K, O’Neill, TJ, Li, S, et al. Alternative splicing, gene localization, and binding of SH2-B to the insulin receptor kinase domain. Mamm Genome. 1999 Dec;10:1160–1167.
90. Yenush, L, White, MF. The IRS-signaling system during insulin and cytokine action. Bioessays. 1997;19:491–500.
91. Pawson, T, Scott, JD. Signaling through scaffold, anchoring, and adaptor proteins. Science. 1997 Dec 19;278:2075–2080.
92. Kotani, K, Wilden, P, Pillay, TS. SH2-Balpha is an insulin-receptor adapter protein and substrate that interacts with the activation loop of the insulin-receptor kinase. Biochem J. 1998 Oct 1;335(Pt 1):103–109.
93. Lock, P, Casagranda, F, Dunn, AR. Independent SH2-binding sites mediate interaction of Dok-related protein with RasGTPase-activating protein and Nck. J Biol Chem. 1999 Aug 6;274:22775–22784.
94. Noguchi, T, Matozaki, T, Inagaki, K, et al. Tyrosine phosphorylation of p62(Dok) induced by cell adhesion and insulin: possible role in cell migration. EMBO J. 1999 Apr 1;18:1748–1760.
95. Chiang, SH, Baumann, CA, Kanzaki, M, et al. Insulin-stimulated GLUT4 translocation requires the CAP-dependent activation of TC10. Nature. 2001 Apr 19;410:944–948.
96. Baumann, CA, Ribon, V, Kanzaki, M, et al. CAP defines a second signalling pathway required for insulin-stimulated glucose transport. Nature. 2000 Sep 14;407:202–207.
97. Schmelzle, K, Kane, S, Gridley, S, et al. Temporal dynamics of tyrosine phosphorylation in insulin signaling. Diabetes. 2006 Aug;55:2171–2179.
98. Songyang, Z, Carraway, KL, III., Eck, MJ, et al. Catalytic specificity of protein-tyrosine kinases is critical for selective signalling. Nature. 1995;373:536–539.
99. Songyang, Z, Cantley, LC. Recognition and specificity in protein tyrosine kinase-mediated signaling. Trends Biochem Sci. 1995;20:470–475.
100. Shoelson, SE, Chatterjee, S, Chaudhuri, M, et al. YMXM motifs of IRS-1 define the substrate specificity of the insulin receptor kinase. Proc Natl Acad Sci U S A. 1992;89:2027–2031.
101. Hubbard, SR. Crystal structure of the activated insulin receptor tyrosine kinase in complex with peptide substrate and ATP analog. EMBO J. 1997;16:5572–5581.
102. Eck, MJ, Dhe-Paganon, S, Trub, T, et al. Structure of the IRS-1 PTB domain bound to the juxtamembrane region of the insulin receptor. Cell. 1996 May 31;85:695–705.
103. Backer, JM, Kahn, CR, Cahill, DA, et al. Receptor-mediated internalization of insulin requires a 12-amino acid sequence in the juxtamembrane region of the insulin receptor β-subunit. J Biol Chem. 1990;265:16450–16454.
104. Hubbard, SR. Juxtamembrane autoinhibition in receptor tyrosine kinases. Nat Rev Mol Cell Biol. 2004 Jun;5:464–471.
105. Feener, EP, Backer, JM, King, GL, et al. Insulin stimulates serine and tyrosine phosphorylation in the juxtamembrane region of the insulin receptor. J Biol Chem. 1993;268:11256–11264.
106. Dhe-Paganon, S, Ottinger, EA, Nolte, RT, et al. Crystal structure of the pleckstrin homology-phosphotyrosine binding (PH-PTB) targeting region of insulin receptor substrate 1. Proc Natl Acad Sci U S A. 1999 Jul 20;96:8378–8383.
107. Lemmon, MA, Ferguson, KM, Schlessinger, J. PH domains: Diverse sequences with a common fold recruit signaling molecules to the cell surface. Cell. 1996;85:621–624.
108. Lemmon, MA, Ferguson, KM, Abrams, CS. Pleckstrin homology domains and the cytoskeleton. Growth Regul. 2002 Feb 20;513:71–76.
109. Burks, DJ, Wang, J, Towery, H, et al. IRS pleckstrin homology domains bind to acidic motifs in proteins. J Biol Chem. 1998 Nov 20;273:31061–31067.
110. Sawka-Verhelle, D, Tartare-Deckert, S, White, MF, et al. Insulin receptor substrate-2 binds to the insulin receptor through its phopshotyrosine-binding domain and through a newly identified domain comprising amino acids 591–786. J Biol Chem. 1996;271:5980–5983.
111. Sawka-Verhelle, D, Baron, V, Mothe, I, et al. Tyr624 and Tyr628 in insulin receptor substrate-2 mediate its association with the insulin receptor. J Biol Chem. 1997;272:16414–16420.
112. Wu, J, Tseng, YD, Xu, CF, et al. Structural and biochemical characterization of the KRLB region in insulin receptor substrate-2. Nat Struct Mol Biol. 2008 Feb 17.
113. Cantley, LC. The phosphoinositide 3-kinase pathway. Science. 2002 May 31;296:1655–1657.
114. Farese, RV, Sajan, MP, Yang, H, et al. Muscle-specific knockout of PKC-lambda impairs glucose transport and induces metabolic and diabetic syndromes. J Clin Invest. 2007 Aug;117:2289–2301.
115. Taniguchi, CM, Tran, TT, Kondo, T, et al. Phosphoinositide 3-kinase regulatory subunit p85alpha suppresses insulin action via positive regulation of PTEN. Proc Natl Acad Sci U S A. 2006 Aug;8(103):12093–12097.
116. Taniguchi, CM, Kondo, T, Sajan, M, et al. Divergent regulation of hepatic glucose and lipid metabolism by phosphoinositide 3-kinase via Akt and PKClambda/zeta. Cell Metab. 2006 May;3:343–353.
117. Manning, BD, Cantley, LC. AKT/PKB signaling: navigating downstream. Cell. 2007 Jun 29;129:1261–1274.
118. Astrinidis, A, Henske, EP. Tuberous sclerosis complex: linking growth and energy signaling pathways with human disease. Oncogene. 2005 Nov 14;24:7475–7481.
119. Hu, C, Pang, S, Kong, X, et al. Molecular cloning and tissue distribution of PHAS-I, an intracellular target for insulin and growth factors. Proc Natl Acad Sci U S A. 1994;91:3730–3734.
120. Jaeschke, A, Hartkamp, J, Saitoh, M, et al. Tuberous sclerosis complex tumor suppressor-mediated S6 kinase inhibition by phosphatidylinositide-3-OH kinase is mTOR independent. J Cell Biol. 2002 Oct 28;159:217–224.
121. Tee, AR, Fingar, DC, Manning, BD, et al. Tuberous sclerosis complex-1 and -2 gene products function together to inhibit mammalian target of rapamycin (mTOR)-mediated downstream signaling. Proc Natl Acad Sci U S A. 2002 Oct 15;99:13571–13576.
122. Proud, CG. Cell signaling: mTOR, unleashed. Science. 2007 Nov 9;318:926–927.
123. Pende, M, Kozma, SC, Jaquet, M, et al. Hypoinsulinaemia, glucose intolerance and diminished beta-cell size in S6K1-deficient mice. Nature. 2000 Dec 21;408:994–997.
124. Isotani, S, Hara, K, Tokunaga, C, et al. Immunopurified mammalian target of rapamycin phosphorylates and activates p70 S6 kinase alpha in vitro. J Biol Chem. 1999 Nov 26;274:34493–34498.
125. Jacinto, E, Lorberg, A. TOR regulation of AGC kinases in yeast and mammals. Biochem J. 2008 Feb 15;410:19–37.
126. Accili, D, Drago, J, Lee, EJ, et al. Early neonatal death in mice homozygous for a null allele of the insulin receptor gene. Nat Genet. 1996;12:106–109.
127. Sell, C, Dumenil, G, Deveaud, C, et al. Effect of a null mutation of the insulin-like growth factor I receptor gene on growth and transformation of mouse embryo fibroblasts. Mol Cell Biol. 1994;14:3604–3612.
128. Araki, E, Lipes, MA, Patti, ME, et al. Alternative pathway of insulin signalling in mice with targeted disruption of the IRS-1 gene. Nature. 1994 Nov 10;372:186–190.
129. Withers, DJ, Gutierrez, JS, Towery, H, et al. Disruption of IRS-2 causes type 2 diabetes in mice. Nature. 1998;391:900–904.
130. Withers, DJ, White, MF. Insulin action and type 2 diabetes: lessons from knockout mice. Curr Opin Endocrinol Diabetes Obes. 1999;6:141–145.
131. Taniguchi, CM, Ueki, K, Kahn, CR. Complementary roles of IRS-1 and IRS-2 in the hepatic regulation of metabolism. J Clin Invest. 2005 Mar;115:718–727.
132. Dong, X, Park, S, Lin, X, et al. Irs1 and Irs2 signaling is essential for hepatic glucose homeostasis and systemic growth. J Clin Invest. 2006 Jan;116:101–114.
133. Dong, XC, Copps, KD, Guo, S, et al. Inactivation of hepatic foxo1 by insulin signaling is required for adaptive nutrient homeostasis and endocrine growth regulation. Cell Metab. 2008 Jul;8:65–76.
134. Kubota, N, Kubota, T, Itoh, S, et al. Dynamic functional relay between insulin receptor substrate 1 and 2 in hepatic insulin signaling during fasting and feeding. Cell Metab. 2008 Jul;8:49–64.
135. Dong, XC, Copps, KD, Guo, S, et al. Inactivation of hepatic foxo1 by insulin signaling is required for adaptive nutrient homeostasis and endocrine growth regulation. Cell Metab. 2008 Jul;8:65–76.
136. Ueki, K, Fruman, DA, Yballe, CM, et al. Positive and negative roles of p85 alpha and p85 beta regulatory subunits of phosphoinositide 3-kinase in insulin signaling. J Biol Chem. 2003 Nov 28;278:48453–48466.
137. Ueki, K, Algenstaedt, P, Mauvais-Jarvis, F, et al. Positive and negative regulation of phosphoinositide 3-kinase-dependent signaling pathways by three different gene products of the p85alpha regulatory subunit. Mol Cell Biol. 2000 Nov;20:8035–8046.
138. Geering, B, Cutillas, PR, Vanhaesebroeck, B. Regulation of class IA PI3Ks: is there a role for monomeric PI3K subunits? Biochem Soc Trans. 2007 Apr;35(Pt 2):199–203.
139. Bi, L, Okabe, I, Bernard, DJ, et al. Proliferative defect and embryonic lethality in mice homozygous for a deletion in the p110alpha subunit of phosphoinositide 3-kinase. J Biol Chem. 1999 Apr 16;274:10963–10968.
140. Bi, L, Okabe, I, Bernard, DJ, et al. Early embryonic lethality in mice deficient in the p110beta catalytic subunit of PI 3-kinase. Mamm Genome. 2002 Mar;13:169–172.
141. Vanhaesebroeck, B, Ali, K, Bilancio, A, et al. Signalling by PI3K isoforms: insights from gene-targeted mice. Trends Biochem Sci. 2005 Apr;30:194–204.
142. Brachmann, SM, Ueki, K, Engelman, JA, et al. Phosphoinositide 3-kinase catalytic subunit deletion and regulatory subunit deletion have opposite effects on insulin sensitivity in mice. Mol Cell Biol. 2005 Mar;25:1596–1607.
143. Foukas, LC, Claret, M, Pearce, W, et al. Critical role for the p110alpha phosphoinositide-3-OH kinase in growth and metabolic regulation. Nature. 2006 May 18;441:366–370.
144. Dummler, B, Hemmings, BA. Physiological roles of PKB/Akt isoforms in development and disease. Biochem Soc Trans. 2007 Apr;35(Pt 2):231–235.
145. Cho, H, Thorvaldsen, JL, Chu, Q, et al. Akt1/PKBalpha is required for normal growth but dispensable for maintenance of glucose homeostasis in mice. J Biol Chem. 2001 Oct 19;276:38349–38352.
146. Bae, SS, Cho, H, Mu, J, et al. Isoform-specific regulation of insulin-dependent glucose uptake by Akt/protein kinase B. J Biol Chem. 2003 Dec 5;278:49530–49536.
147. Cho, H, Mu, J, Kim, JK, et al. Insulin resistance and a diabetes mellitus-like syndrome in mice lacking the protein kinase Akt2 (PKB beta). Science. 2001 Jun 1;292:1728–1731.
148. George, S, Rochford, JJ, Wolfrum, C, et al. A family with severe insulin resistance and diabetes due to a mutation in AKT2. Science. 2004 May 28;304:1325–1328.
149. Mora, A, Komander, D, van Aalten, DM, et al. PDK1, the master regulator of AGC kinase signal transduction. Semin Cell Dev Biol. 2004 Apr;15:161–170.
150. Lawlor, MA, Mora, A, Ashby, PR, et al. Essential role of PDK1 in regulating cell size and development in micel. EMBO J. 2002 Jul 15;21:3728–3738.
151. Mora, A, Lipina, C, Tronche, F, et al. Deficiency of PDK1 in liver results in glucose intolerance, impairment of insulin-regulated gene expression and liver failure. Biochem J. 2005 Feb 1;385(Pt 3):639–648.
152. Bayascas, JR, Wullschleger, S, Sakamoto, K, et al. Mutation of the PDK1 PH domain inhibits protein kinase B/Akt, leading to small size and insulin resistance. Mol Cell Biol. 2008 May;28:3258–3272.
153. Elchebly, M, Payette, P, Michaliszyn, E, et al. Increased insulin sensitivity and obesity resistance in mice lacking the protein tyrosine phosphatase-1B gene [commentary]. Science. 1999 Mar 5;283:1544–1548.
154. Kushner, JA, Haj, FG, Klaman, LD, et al. Islet-sparing effects of protein tyrosine phosphatase-1b deficiency delays onset of diabetes in IRS2 knockout mice. Diabetes. 2004 Jan;53:61–66.
155. Li, J, Yen, C, Liaw, D, et al. PTEN, a putative protein tyrosine phosphatase gene mutated in human brain, breast, and prostate cancer. Science. 1997 Mar 28;275:1943–1947.
156. Parsons, R. Human cancer, PTEN and the PI-3 kinase pathway. Semin Cell Dev Biol. 2004 Apr;15:171–176.
157. Kushner, JA, Simpson, L, Wartschow, LM, et al. Phosphatase and tensin homolog regulation of islet growth and glucose homeostasis. J Biol Chem. 2005 Nov 25;280:39388–39393.
158. Proud, CG. Signalling to translation: how signal transduction pathways control the protein synthetic machinery. Biochem J. 2007;403:217–234.
159. Hartley, D, Cooper, GM. Role of mTOR in the degradation of IRS-1: regulation of PP2A activity. J Cell Biochem. 2002;85:304–314.
160. Plas, DR, Thompson, CB. Akt activation promotes degradation of tuberin and FOXO3a via the proteasome. J Biol Chem. 2003 Apr 4;278:12361–12366.
161. Kim, JK, Fillmore, JJ, Chen, Y, et al. Tissue-specific overexpression of lipoprotein lipase causes tissue-specific insulin resistance. Proc Natl Acad Sci U S A. 2001 Jun 19;98:7522–7527.
162. Proud, CG, Denton, RM. Molecular mechanisms for the control of translation by insulin. Biochem J. 1997 Dec 1;328(Pt 2):329–341.
163. Brunn, GJ, Hudson, CC, Sekulic, A, et al. Phosphorylation of the translational repressor PHAS-I by the mammalian target of rapamycin. Science. 1997;277:99–101.
164. Waskiewicz, AJ, Johnson, JC, Penn, B, et al. Phosphorylation of the cap-binding protein eukaryotic translation initiation factor 4E by protein kinase Mnk1 in vivo. Mol Cell Biol. 1999 Mar;19:1871–1880.
165. Minich, WB, Balasta, ML, Goss, DJ, et al. Chromatographic resolution of in vivo phosphorylated and nonphosphorylated eukaryotic translation initiation factor eIF-4E: increased cap affinity of the phosphorylated form. Proc Natl Acad Sci U S A. 1994;91:7668–7672.
166. Tsukiyama-Kohara, K, Poulin, F, Kohara, M, et al. Adipose tissue reduction in mice lacking the translational inhibitor 4E-BP1. Nat Med. 2001 Oct;7:1128–1132.
167. Proud, CG, Wang, X, Patel, JV, et al. Interplay between insulin and nutrients in the regulation of translation factors. Biochem Soc Trans. 2001 Aug;29(Pt 4):541–547.
168. Redpath, NT, Price, NT, Severinov, KV, et al. Regulation of elongation factor-2 by multisite phosphorylation. Eur J Biochem. 1993 Apr 15;213:689–699.
169. Begum, N, Sandu, OA, Ito, M, et al. Active Rho kinase (ROK-alpha) associates with insulin receptor substrate-1 and inhibits insulin signaling in vascular smooth muscle cells. J Biol Chem. 2002 Feb 22;277:6214–6222.
170. Mendez, R, Kollmorgen, G, White, MF, et al. Requirement of protein kinase C zeta for stimulation of protein synthesis by insulin. Mol Cell Biol. 1997;17:5184–5192.
171. Lu, Z, Hu, X, Li, Y, et al. Human papillomavirus 16 E6 oncoprotein interferences with insulin signaling pathway by binding to tuberin. J Biol Chem. 2004 Aug 20;279:35664–35670.
172. Stefan, N, Stumvoll, M, Machicao, F, et al. C825T polymorphism of the G protein beta3 subunit is associated with obesity but not with insulin sensitivity. Obes Res. 2004 Apr;12:679–683.
173. Huang, S, Czech, MP. The GLUT4 glucose transporter. Cell Metab. 2007 Apr;5:237–252.
174. Joost, HG, Thorens, B. The extended GLUT-family of sugar/polyol transport facilitators: nomenclature, sequence characteristics, and potential function of its novel members (review). Mol Membr Biol. 2001 Oct;18:247–256.
175. Fingar, DC, Birnbaum, MJ. A role for raf-1 in the divergent signaling pathways mediating insulin-stimulated glucose transport. J Biol Chem. 1994;269:10127–10132.
176. Haney, PM, Levy, MA, Strube, MS, et al. Insulin-sensitive targeting of the GLUT4 glucose transporter in L6 myoblasts is conferred by its COOH-terminal cytoplasmic tail. J Cell Biol. 1995;129:641–658.
177. Carayannopoulos, MO, Chi, MM, Cui, Y, et al. GLUT8 is a glucose transporter responsible for insulin-stimulated glucose uptake in the blastocyst. Proc Natl Acad Sci U S A. 2000 Jun 20;97:7313–7318.
178. Wood, IS, Trayhurn, P. Glucose transporters (GLUT and SGLT): expanded families of sugar transport proteins. Br J Nutr. 2003 Jan;89:3–9.
179. Rogers, S, Macheda, ML, Docherty, SE, et al. Identification of a novel glucose transporter-like protein-GLUT-12. Am J Physiol Endocrinol Metab. 2002 Mar;282:E733–E738.
180. Gude, NM, Stevenson, JL, Rogers, S, et al. GLUT12 expression in human placenta in first trimester and term. Placenta. 2003 May;24:566–570.
181. Czech, MP. Molecular actions of insulin on glucose transport. Annu Rev Nutr. 1995;15:441–471.
182. Pessin, JE, Thurmond, DC, Elmendorf, JS, et al. Molecular basis of insulin-stimulated GLUT4 vesicle trafficking. Location! Location! Location!. J Biol Chem. 1999 Jan 29;274:2593–2596.
183. Khan, AH, Pessin, JE. Insulin regulation of glucose uptake: a complex interplay of intracellular signalling pathways. Diabetologia. 2002 Nov;45:1475–1483.
184. Farese, RV. Function and dysfunction of aPKC isoforms for glucose transport in insulin-sensitive and insulin-resistant states. Am J Physiol Endocrinol Metab. 2002 Jul;283:E1–E11.
185. Bandyopadhyay, G, Standaert, ML, Sajan, MP, et al. Protein kinase C-lambda knockout in embryonic stem cells and adipocytes impairs insulin-stimulated glucose transport. Mol Endocrinol. 2004 Feb;18:373–383.
186. Kane, S, Sano, H, Liu, SC, et al. A method to identify serine kinase substrates. Akt phosphorylates a novel adipocyte protein with a Rab GTPase-activating protein (GAP) domain. J Biol Chem. 2002 Jun 21;277:22115–22118.
187. Sakamoto, K, Holman, GD. Emerging role for AS160/TBC1D4 and TBC1D1 in the regulation of GLUT4 traffic. Am J Physiol Endocrinol Metab. 2008 Jul;295:E29–E37.
188. Sano, H, Kane, S, Sano, E, et al. Insulin-stimulated phosphorylation of a Rab GTPase-activating protein regulates GLUT4 translocation. J Biol Chem. 2003 Apr 25;278:14599–14602.
189. Miinea, CP, Sano, H, Kane, S, et al. AS160, the Akt substrate regulating GLUT4 translocation, has a functional Rab GTPase-activating protein domain. Biochem J. 2005 Oct 1;391(Pt 1):87–93.
190. Sbrissa, D, Ikonomov, OC, Strakova, J, et al. Role for a novel signaling intermediate, phosphatidylinositol 5-phosphate, in insulin-regulated F-actin stress fiber breakdown and GLUT4 translocation. Endocrinology. 2004 Nov;145:4853–4865.
191. Yamada, E, Okada, S, Saito, T, et al. Akt2 phosphorylates Synip to regulate docking and fusion of GLUT4-containing vesicles. J Cell Biol. 2005 Mar 14;168:921–928.
192. Kotani, K, Ogawa, W, Matsumoto, M, et al. Requirement of atypical protein kinase-C{lambda} for insulin stimulation of glucose uptake but not for akt activation in 3T3-L1 adipocytes. Mol Cell Biol. 1998 Dec;18:6971–6982.
193. Hill, MM, Clark, SF, Tucker, DF, et al. A role for protein kinase-Bβ/Akt2 in insulin-stimulated GLUT4 translocation in adipocytes. Mol Cell Biol. 1999 Nov;19:7771–7781.
194. Bandyopadhyay, G, Kanoh, Y, Sajan, MP, et al. Effects of adenoviral gene transfer of wild-type, constitutively active, and kinase-defective protein kinase-Cλ on insulin-stimulated glucose transport in L6 myotubes. Endocrinology. 2000 Nov;141:4120–4127.
195. Bandyopadhyay, G, Sajan, MP, Kanoh, Y, et al. PKC-zeta mediates insulin effects on glucose transport in cultured preadipocyte-derived human adipocytes. J Clin Endocrinol Metab. 2002 Feb;87:716–723.
196. Etgen, GJ, Valasek, KM, Broderick, CL, et al. In vivo adenoviral delivery of recombinant human protein kinase C-zeta stimulates glucose transport activity in rat skeletal muscle. J Biol Chem. 1999 Aug 6;274:22139–22142.
197. Imamura, T, Vollenweider, P, Egawa, K, et al. G alpha-q/11 protein plays a key role in insulin-induced glucose transport in 3T3-L1 adipocytes. Mol Cell Biol. 1999 Oct;19:6765–6774.
198. Standaert, ML, Ortmeyer, HK, Sajan, MP, et al. Skeletal muscle insulin resistance in obesity-associated type 2 diabetes in monkeys is linked to a defect in insulin activation of protein kinase Cζ/γ/ι. Diabetes. 2002 Oct;51:2936–2943.
199. Vollenweider, P, Menard, B, Nicod, P. Insulin resistance, defective insulin receptor substrate 2-associated phosphatidylinositol-3′ kinase activation, and impaired atypical protein kinase C{zeta/lambda} activation in myotubes from obese patients with impaired glucose tolerance. Diabetes. 2002 Apr;51:1052–1059.
200. Jhala, US, Canettieri, G, Screaton, RA, et al. cAMP promotes pancreatic beta-cell survival via CREB-mediated induction of IRS2. Genes Dev. 2003 Jul 1;17:1575–1580.
201. Canettieri, G, Koo, SH, Berdeaux, R, et al. Dual role of the coactivator TORC2 in modulating hepatic glucose output and insulin signaling. Cell Metab. 2005 Nov;2:331–338.
202. Li, D, Yin, X, Zmuda, EJ, et al. The repression of IRS2 gene by ATF3, a stress-inducible gene, contributes to pancreatic beta-cell apoptosis. Diabetes. 2008 Mar;57:635–644.
203. Shimano, H. SREBP-1c and TFE3, energy transcription factors that regulate hepatic insulin signaling. J Mol Med. 2007 May;85:437–444.
204. Nakagawa, Y, Shimano, H, Yoshikawa, T, et al. TFE3 transcriptionally activates hepatic IRS-2, participates in insulin signaling and ameliorates diabetes. Nat Med. 2006 Jan;12:107–113.
205. Ide, T, Shimano, H, Yahagi, N, et al. SREBPs suppress IRS-2-mediated insulin signalling in the liver. Nat Cell Biol. 2004 Apr;6:351–357.
206. Matsumoto, M, Pocai, A, Rossetti, L, et al. Impaired regulation of hepatic glucose production in mice lacking the forkhead transcription factor foxo1 in liver. Cell Metab. 2007 Sep;6:208–216.
207. Foretz, M, Guichard, C, Ferre, P, et al. Sterol regulatory element binding protein-1c is a major mediator of insulin action on the hepatic expression of glucokinase and lipogenesis-related genes. Proc Natl Acad Sci U S A. 1999 Oct 26;96:12737–12742.
208. Shimomura, I, Matsuda, M, Hammer, RE, et al. Decreased IRS-2 and increased SREBP-1c lead to mixed insulin resistance and sensitivity in livers of lipodystrophic and ob/ob mice. Mol Cell. 2000 Jul;6:77–86.
209. Zick, Y. Role of Ser/Thr kinases in the uncoupling of insulin signaling. Int J Obes Relat Metab Disord. 2003 Dec;27(Suppl 3):S56–S60.
210. Gual, P, Le Marchand-Brustel, Y, Tanti, JF. Positive and negative regulation of insulin signaling through IRS-1 phosphorylation. Biochimie. 2005 Jan;87:99–109.
211. Zick, Y. Ser/Thr phosphorylation of IRS proteins: a molecular basis for insulin resistance. Sci STKE. 2005 Jan 25;2005:e4.
212. Kido, Y, Burks, DJ, Withers, D, et al. Tissue-specific insulin resistance in mice with mutations in the insulin receptor, IRS-1, and IRS-2. J Clin Invest. 2000 Jan;105:199–205.
213. Greene, MW, Garofalo, RS. Positive and negative regulatory role of insulin receptor substrate 1 and 2 (IRS-1 and IRS-2) serine/threonine phosphorylation. Biochemistry. 2002 Jun 4;41:7082–7091.
214. Jiang, G, Dallas-Yang, Q, Liu, F, et al. Salicylic acid reverses phorbol 12-myristate-13-acetate (PMA)- and tumor necrosis factor alpha (TNFalpha)-induced insulin receptor substrate 1 (IRS1) serine 307 phosphorylation and insulin resistance in human embryonic kidney 293 (HEK293) cells. J Biol Chem. 2003 Jan 3;278:180–186.
215. Yu, C, Chen, Y, Cline, GW, et al. Mechanism by which fatty acids inhibit insulin activation of insulin receptor substrate-1 (IRS-1)-associated phosphatidylinositol 3-kinase activity in muscle. J Biol Chem. 2002 Dec 27;277:50230–50236.
216. Gao, Z, Hwang, D, Bataille, F, et al. Serine phosphorylation of insulin receptor substrate 1 by inhibitor kappa B kinase complex. J Biol Chem. 2002 Dec 13;277:48115–48121.
217. Gao, Z, Zuberi, A, Quon, MJ, et al. Aspirin inhibits serine phosphorylation of insulin receptor substrate 1 in tumor necrosis factor-treated cells through targeting multiple serine kinases. J Biol Chem. 2003;278:24944–24950.
218. Gual, P, Gremeaux, T, Gonzalez, T, et al. MAP kinases and mTOR mediate insulin-induced phosphorylation of insulin receptor substrate-1 on serine residues 307, 612 and 632. Diabetologia. 2003 Nov;46:1532–1542.
219. Aguirre, V, Uchida, T, Yenush, L, et al. The c-Jun NH2-terminal kinase promotes insulin resistance during association with insulin receptor substrate-1 and phosphorylation of Ser307. J Biol Chem. 2000 Mar 24;275:9047–9054.
220. Rui, L, Aguirre, V, Kim, JK, et al. Insulin/IGF-1 and TNF-alpha stimulate phosphorylation of IRS-1 at inhibitory Ser307 via distinct pathways. J Clin Invest. 2001 Jan;107:181–189.
221. Hirosumi, J, Tuncman, G, Chang, L, et al. A central role for JNK in obesity and insulin resistance. Nature. 2002 Nov 21;420:333–336.
222. Shah, OJ, Wang, Z, Hunter, T. Inappropriate activation of the TSC/Rheb/mTOR/S6K cassette induces IRS1/2 depletion, insulin resistance, and cell survival deficiencies. Curr Biol. 2004 Sep 21;14:1650–1656.
223. Um, SH, Frigerio, F, Watanabe, M, et al. Absence of S6K1 protects against age- and diet-induced obesity while enhancing insulin sensitivity. Nature. 2004 Sep 9;431:200–205.
224. Kim, JK, Kim, YJ, Fillmore, JJ, et al. Prevention of fat-induced insulin resistance by salicylate. J Clin Invest. 2001 Aug;108:437–446.
225. Yuan, M, Konstantopoulos, N, Lee, J, et al. Reversal of obesity- and diet-induced insulin resistance with salicylates or targeted disruption of Ikk-beta. Science. 2001 Aug 31;293:1673–1677.
226. Hundal, RS, Petersen, KF, Mayerson, AB, et al. Mechanism by which high-dose aspirin improves glucose metabolism in type 2 diabetes. J Clin Invest. 2002 May;109:1321–1326.
227. Aguirre, V, Werner, ED, Giraud, J, et al. Phosphorylation of Ser307 in insulin receptor substrate-1 blocks interactions with the insulin receptor and inhibits insulin action. J Biol Chem. 2002 Jan 11;277:1531–1537.
228. Werner, ED, Lee, J, Hansen, L, et al. Insulin resistance due to phosphorylation of IRS-1 at serine 302. J Biol Chem. 2004 Jun 14;279:35298–352305.
229. Rondinone CM, Reilly RM, Clampit JE, et al: Inventors: methods of identifying kinases and uses thereof, U.S. Patent Application 20050037987. 2005 Feb 17.
230. Greene, MW, Morrice, N, Garofalo, RS, et al. Modulation of human insulin receptor substrate-1 tyrosine phosphorylation by protein kinase Cδ. Biochem J. 2004 Feb 15;378(Pt 1):105–116.
231. Giraud, J, Haas, M, Feener, EP, et al. Phosphorylation of Irs1 at SER-522 inhibits insulin signaling. Mol Endocrinol. 2007 Sep;21:2294–2302.
232. Paz, K, Liu, YF, Shorer, H, et al. Phosphorylation of insulin receptor substrate-1 (IRS-1) by protein kinase B positively regulates IRS-1 function. J Biol Chem. 1999 Oct 1;274:28816–28822.
233. Li, Y, Soos, TJ, Li, X, et al. Protein kinase Cθ inhibits insulin signaling by phosphorylating IRS1 at Ser1101. J Biol Chem. 2004 Oct 29;279:45304–45307.
234. Jakobsen, SN, Hardie, DG, Morrice, N, et al. 5′-AMP-activated protein kinase phosphorylates IRS-1 on Ser-789 in mouse C2C12 myotubes in response to 5-aminoimidazole-4-carboxamide riboside. J Biol Chem. 2001 Dec 14;276:46912–46916.
235. Giraud, J, Leshan, R, Lee, YH, et al. Nutrient-dependent and insulin-stimulated phosphorylation of insulin receptor substrate-1 on serine 302 correlates with increased insulin signaling. J Biol Chem. 2004 Jan 30;279:3447–3454.
236. Haruta, T, Uno, T, Kawahara, J, et al. A rapamycin-sensitive pathway down-regulates insulin signaling via phosphorylation and proteasomal degradation of insulin receptor substrate-1. Mol Endocrinol. 2000 Jun;14:783–794.
237. Rui, L, Fisher, TL, Thomas, J, et al. Regulation of insulin/insulin-like growth factor-1 signaling by proteasome-mediated degradation of insulin receptor substrate-2. J Biol Chem. 2001 Oct 26;276:40362–40367.
238. Satoh, S, Yanagita, T, Maruta, T, et al. Proteasomal degradation of IRS-2, but not IRS-1 by calcineurin inhibition: attenuation of insulin-like growth factor-I-induced GSK-3beta and ERK pathways in adrenal chromaffin cells. Neuropharmacology. 2008 Jul;55:71–79.
239. Takano, A, Usui, I, Haruta, T, et al. Mammalian target of rapamycin pathway regulates insulin signaling via subcellular redistribution of insulin receptor substrate 1 and integrates nutritional signals and metabolic signals of insulin. Mol Cell Biol. 2001 Aug;21:5050–5062.
240. Harrington, LS, Findlay, GM, Gray, A, et al. The TSC1-2 tumor suppressor controls insulin-PI3K signaling via regulation of IRS proteins. J Cell Biol. 2004 Jul 19;166:213–223.
241. Ozcan, U, Ozcan, L, Yilmaz, E, et al. Loss of the tuberous sclerosis complex tumor suppressors triggers the unfolded protein response to regulate insulin signaling and apoptosis. Mol Cell. 2008 Mar 14;29:541–551.
242. Xu, X, Sarikas, A, as-Santagata, DC, et al. The CUL7 E3 ubiquitin ligase targets insulin receptor substrate 1 for ubiquitin-dependent degradation. Mol Cell. 2008 May 23;30:403–414.
243. Mieulet, V, Lamb, RF. Shooting the messenger: CULLIN insulin signaling with Fbw8. Dev Cell. 2008 Jun;14:816–817.
244. Ueki, K, Kondo, T, Kahn, CR. Suppressor of cytokine signaling 1 (SOCS-1) and SOCS-3 cause insulin resistance through inhibition of tyrosine phosphorylation of insulin receptor substrate proteins by discrete mechanisms. Mol Cell Biol. 2004 Jun;24:5434–5446.
245. Liu, F, Yang, T, Wang, B, et al. Resistin induces insulin resistance but does not affect glucose output in rat-derived hepatocytes. Acta Pharmacol Sin. 2008 Jan;29:98–104.
246. Palanivel, R, Maida, A, Liu, Y, et al. Regulation of insulin signalling, glucose uptake and metabolism in rat skeletal muscle cells upon prolonged exposure to resistin. Diabetologia. 2006 Jan;49:183–190.
247. Rui, L, Yuan, M, Frantz, D, et al. SOCS-1 and SOCS-3 block insulin signaling by ubiquitin-mediated degradation of IRS1 and IRS2. J Biol Chem. 2002 Nov 1;277:42394–42398.
248. Ueki, K, Kondo, T, Tseng, YH, et al. Central role of suppressors of cytokine signaling proteins in hepatic steatosis, insulin resistance, and the metabolic syndrome in the mouse. Proc Natl Acad Sci U S A. 2004 Jul 13;101:10422–10427.
249. Kawaguchi, T, Yoshida, T, Harada, M, et al. Hepatitis C virus down-regulates insulin receptor substrates 1 and 2 through up-regulation of suppressor of cytokine signaling 3. Am J Pathol. 2004 Nov;165:1499–1508.
250. Holt, GD, Hart, GW. The subcellular distribution of terminal N-acetylglucosamine moieties. Localization of a novel protein-saccharide linkage, O-linked GlcNAc. J Biol Chem. 1986 Jun 15;261:8049–8057.
251. Park, SY, Ryu, J, Lee, W. O-GlcNAc modification on IRS-1 and Akt2 by PUGNAc inhibits their phosphorylation and induces insulin resistance in rat primary adipocytes. Exp Mol Med. 2005 Jun 30;37:220–229.
252. Zhang, J. The direct involvement of SirT1 in insulin-induced insulin receptor substrate-2 tyrosine phosphorylation. J Biol Chem. 2007 Nov 23;282:34356–34364.
253. Rodgers, JT, Lerin, C, Haas, W, et al. Nutrient control of glucose homeostasis through a complex of PGC-1alpha and SIRT1. Nature. 2005 Mar 3;434:113–118.
254. Bordone, L, Motta, MC, Picard, F, et al. Sirt1 regulates insulin secretion by repressing UCP2 in pancreatic beta cells. PLoS Biol. 2006 Feb;4:e31.
255. Moynihan, KA, Grimm, AA, Plueger, MM, et al. Increased dosage of mammalian Sir2 in pancreatic beta cells enhances glucose-stimulated insulin secretion in mice. Cell Metab. 2005 Aug;2:105–117.
256. Picard, F, Kurtev, M, Chung, N, et al. Sirt1 promotes fat mobilization in white adipocytes by repressing PPAR-gamma. Nature. 2004 Jun 17;429:771–776.
257. Schenk, S, Saberi, M, Olefsky, JM. Insulin sensitivity: modulation by nutrients and inflammation. J Clin Invest. 2008 Sep;118:2992–3002.
258. Martin, BC, Warram, JH, Krolewski, AS, et al. Role of glucose and insulin resistance in development of Type II diabetes mellitus: results of a 25-year follow-up study. Lancet. 1992;340:925–929.
259. Zierath, JR, Wallberg-Henriksson, H. From receptor to effector: insulin signal transduction in skeletal muscle from type II diabetic patients. Ann N Y Acad Sci. 2002 Jun;967:120–134.
260. Bruning, JC, Michael, MD, Winnay, JN, et al. A muscle-specific insulin receptor knockout exhibits features of the metabolic syndrome of NIDDM without altering glucose tolerance. Mol Cell. 1998 Nov;2:559–569.
261. Michael, MD, Kulkarni, RN, Postic, C, et al. Loss of insulin signaling in hepatocytes leads to severe insulin resistance and progressive hepatic dysfunction. Mol Cell. 2000 Jul;6:87–97.
262. Biddinger, SB, Hernandez-Ono, A, Rask-Madsen, C, et al. Hepatic insulin resistance is sufficient to produce dyslipidemia and susceptibility to atherosclerosis. Cell Metab. 2008 Feb;7:125–134.
263. Dong, XC, Copps, KD, Guo, S, et al. Inactivation of hepatic foxo1 by insulin signaling is required for adaptive nutrient homeostasis and endocrine growth regulation. Cell Metab. 2008 Jul;8:65–76.
265. Tamura, S, Shimomura, I. Contribution of adipose tissue and de novo lipogenesis to nonalcoholic fatty liver disease. J Clin Invest. 2005 May;115:1139–1142.
266. Newgard, CB, An, J, Bain, JR, et al. A branched-chain amino acid-related metabolic signature that differentiates obese and lean humans and contributes to insulin resistance. Cell Metab. 2009 Apr;9:311–326.
267. Marciniak, SJ, Ron, D. Endoplasmic reticulum stress signaling in disease. Physiol Rev. 2006 Oct;86:1133–1149.
268. Schroder, M, Kaufman, RJ. The mammalian unfolded protein response. Annu Rev Biochem. 2005;74:739–789.
269. Ozcan, U, Cao, Q, Yilmaz, E, et al. Endoplasmic reticulum stress links obesity, insulin action, and type 2 diabetes. Science. 2004 Oct 15;306:457–461.
270. Oyadomari, S, Harding, HP, Zhang, Y, et al. Dephosphorylation of translation initiation factor 2alpha enhances glucose tolerance and attenuates hepatosteatosis in mice. Cell Metab. 2008 Jun;7:520–532.
271. Ozcan, U, Yilmaz, E, Ozcan, L, et al. Chemical chaperones reduce ER stress and restore glucose homeostasis in a mouse model of type 2 diabetes. Science. 2006 Aug 25;313:1137–1140.
272. Sharma, NK, Das, SK, Mondal, AK, et al. Endoplasmic reticulum stress markers are associated with obesity in nondiabetic subjects. J Clin Endocrinol Metab. 2008 Nov;93:4532–4541.
273. Kahn, BB, Flier, JS. Obesity and insulin resistance. J Clin Invest. 2000 Aug;106:473–481.
274. Shoelson, SE, Herrero, L, Naaz, A. Obesity, inflammation, and insulin resistance. Gastroenterology. 2007 May;132:2169–2180.
275. Trayhurn, P, Wang, B, Wood, IS. Hypoxia in adipose tissue: a basis for the dysregulation of tissue function in obesity? Br J Nutr. 2008 Aug;100:227–235.
276. Weisberg, SP, Hunter, D, Huber, R, et al. CCR2 modulates inflammatory and metabolic effects of high-fat feeding. J Clin Invest. 2006 Jan;116:115–124.
277. Wallenius, V, Wallenius, K, Ahren, B, et al. Interleukin-6-deficient mice develop mature-onset obesity. Nat Med. 2002 Jan;8:75–79.
278. Weston, CR, Davis, RJ. The JNK signal transduction pathway. Curr Opin Cell Biol. 2007 Apr;19:142–149.
279. Kaneto, H, Nakatani, Y, Miyatsuka, T, et al. Possible novel therapy for diabetes with cell-permeable JNK-inhibitory peptide. Nat Med. 2004 Oct;10:1128–1132.
280. Yang, R, Wilcox, DM, Haasch, DL, et al. Liver-specific knockdown of JNK1 up-regulates proliferator-activated receptor gamma coactivator 1 beta and increases plasma triglyceride despite reduced glucose and insulin levels in diet-induced obese mice. J Biol Chem. 2007 Aug 3;282:22765–22774.
281. Summers, SA. Ceramides in insulin resistance and lipotoxicity. Prog Lipid Res. 2006 Jan;45:42–72.
282. Holland, WL, Summers, SA. Sphingolipids, insulin resistance, and metabolic disease: new insights from in vivo manipulation of sphingolipid metabolism. Endocr Rev. 2008 Jun;29:381–402.
283. Schreyer, SA, Chua, JrSC, LeBoeuf, RC. Obesity and diabetes in TNF-α receptor-deficient mice. J Clin Invest. 1998;102:402–411.
284. Lo, J, Bernstein, LE, Canavan, B, et al. Effects of TNF-alpha neutralization on adipocytokines and skeletal muscle adiposity in the metabolic syndrome. Am J Physiol Endocrinol Metab. 2007 Jul;293:E102–E109.
285. Savage, DB, Petersen, KF, Shulman, GI. Disordered lipid metabolism and the pathogenesis of insulin resistance. Physiol Rev. 2007 Apr;87:507–520.
286. Dresner, A, Laurent, D, Marcucci, M, et al. Effects of free fatty acids on glucose transport and IRS-1-assoiated phosphatidylinositol 3-kinase activity. J Clin Invest. 1999;103:253–259.
287. Kruszynska, YT, Worrall, DS, Ofrecio, J, et al. Fatty acid-induced insulin resistance: decreased muscle PI3K activation but unchanged Akt phosphorylation. J Clin Endocrinol Metab. 2002 Jan;87:226–234.
288. Kim, JK, Fillmore, JJ, Sunshine, MJ, et al. PKC-theta knockout mice are protected from fat-induced insulin resistance. J Clin Invest. 2004 Sep;114:823–827.
289. Kelley, DE, Mandarino, LJ. Metabolic pathways of glucose in skeletal muscle of lean NIDDM patients. Diabetes Care. 1993;16:1158–1166.
290. Roden, M, Price, TB, Perseghin, G, et al. Mechanism of free fatty acid-induced insulin resistance in humans. J Clin Invest. 1996 Jun 15;97:2859–2865.
291. Lumeng, CN, Bodzin, JL, Saltiel, AR. Obesity induces a phenotypic switch in adipose tissue macrophage polarization. J Clin Invest. 2007 Jan;117:175–184.
292. Odegaard, JI, Ricardo-Gonzalez, RR, Red, EA, et al. Alternative M2 activation of Kupffer cells by PPARdelta ameliorates obesity-induced insulin resistance. Cell Metab. 2008 Jun;7:496–507.
293. Kang, K, Reilly, SM, Karabacak, V, et al. Adipocyte-derived Th2 cytokines and myeloid PPARdelta regulate macrophage polarization and insulin sensitivity. Cell Metab. 2008 Jun;7:485–495.
294. Brown, MS, Goldstein, JL. Selective versus total insulin resistance: a pathogenic paradox. Cell Metab. 2008 Feb;7:95–96.
295. Zimmet, P, Alberti, KG, Shaw, J. Global and societal implications of the diabetes epidemic. Nature. 2001 Dec 13;414:782–787.
296. Okamoto, Y, Ogawa, W, Nishizawa, A, et al. Restoration of glucokinase expression in the liver normalizes postprandial glucose disposal in mice with hepatic deficiency of PDK1. Diabetes. 2007 Apr;56:1000–1009.
297. Dong, XC, Copps, KD, Guo, S, et al. Inactivation of hepatic foxo1 by insulin signaling is required for adaptive nutrient homeostasis and endocrine growth regulation. Cell Metab. 2008 Jul;8:65–76.
298. Le, RD, Bondy, C, Yakar, S, et al. The somatomedin hypothesis: 2001. Endocr Rev. 2001 Feb;22:53–74.
299. van der Horst, A, Burgering, BM. Stressing the role of FoxO proteins in lifespan and disease. Nat Rev Mol Cell Biol. 2007 Jun;8:440–450.
300. Dentin, R, Liu, Y, Koo, SH, et al. Insulin modulates gluconeogenesis by inhibition of the coactivator TORC2. Nature. 2007 Sep 20;449:366–369.
301. Koo, SH, Flechner, L, Qi, L, et al. The CREB coactivator TORC2 is a key regulator of fasting glucose metabolism. Nature. 2005 Oct 20;437:1109–1111.
302. Puigserver, P, Rhee, J, Donovan, J, et al. Insulin-regulated hepatic gluconeogenesis through FOXO1-PGC-1alpha interaction. Nature. 2003 May 18.
303. Schilling, MM, Oeser, JK, Boustead, JN, et al. Gluconeogenesis: re-evaluating the FOXO1-PGC-1alpha connection. Nature. 2006 Oct 5;443:E10–E11.
304. Barthel, A, Schmoll, D, Unterman, TG. FoxO proteins in insulin action and metabolism. Trends Endocrinol Metab. 2005 May;16:183–189.
305. Mounier, C, Posner, BI. Transcriptional regulation by insulin: from the receptor to the gene. Can J Physiol Pharmacol. 2006 Jul;84:713–724.
306. Matsumoto, M, Han, S, Kitamura, T, et al. Dual role of transcription factor FoxO1 in controlling hepatic insulin sensitivity and lipid metabolism. J Clin Invest. 2006 Sep;116:2464–2472.
307. Ravnskjaer, K, Kester, H, Liu, Y, et al. Cooperative interactions between CBP and TORC2 confer selectivity to CREB target gene expression. EMBO J. 2007 Jun 20;26:2880–2889.
308. He, L, Sabet, A, Djedjos, S, et al. Metformin and insulin suppress hepatic gluconeogenesis by inhibiting cAMP signaling through phosphorylation of CREB binding protein (CBP). Cell. 2009. [In press].
309. Farese, RV, Sajan, MP, Standaert, ML. Atypical protein kinase C in insulin action and insulin resistance. Biochem Soc Trans. 2005 Apr;33(Pt 2):350–353.
310. Kubota, N, Tobe, K, Terauchi, Y, et al. Disruption of insulin receptor substrate 2 causes type 2 diabetes because of liver insulin resistance and lack of compensatory beta-cell hyperplasia. Diabetes. 2000 Nov;49:1880–1889.
311. Previs, SF, Withers, DJ, Ren, JM, et al. Contrasting effects of IRS-1 vs IRS-2 gene disruption on carbohydrate and lipid metabolism in vivo. J Biol Chem. 2000 Sep 19;275:38990–38994.
312. Withers, DJ, Burks, DJ, Towery, HH, et al. Irs-2 coordinates Igf-1 receptor-mediated beta-cell development and peripheral insulin signaling. Nat Genet. 1999 Sep;23:32–40.
313. Xuan, S, Kitamura, T, Nakae, J, et al. Defective insulin secretion in pancreatic beta cells lacking type 1 IGF receptor. J Clin Invest. 2002 Oct;110:1011–1019.
314. Kulkarni, RN, Holzenberger, M, Shih, DQ, et al. beta-cell-specific deletion of the Igf1 receptor leads to hyperinsulinemia and glucose intolerance but does not alter beta-cell mass. Nat Genet. 2002 May;31:111–115.
315. Ueki, K, Okada, T, Hu, J, et al. Total insulin and IGF-I resistance in pancreatic beta cells causes overt diabetes. Nat Genet. 2006 May;38:583–588.
316. Jonsson, J, Carlsson, L, Edlund, T, et al. Insulin-promoter-factor 1 is required for pancreas development in mice. Nature. 1994;371:606–609.
317. Stoffers, DA, Zinkin, NT, Stanojevic, V, et al. Pancreatic agenesis attributable to a single nucleotide deletion in the human IPF1 gene coding sequence. Nat Genet. 1997;15:106–110.
318. Kushner, JA, Ye, J, Schubert, M, et al. Pdx1 restores beta cell function in Irs2 knockout mice. J Clin Invest. 2002 May;109:1193–1201.
319. Kitamura, T, Nakae, J, Kitamura, Y, et al. The forkhead transcription factor Foxo1 links insulin signaling to Pdx1 regulation of pancreatic beta cell growth. J Clin Invest. 2002 Dec;110:1839–1847.
320. Hennige, AM, Burks, DJ, Ozcan, U, et al. Upregulation of insulin receptor substrate-2 in pancreatic beta cells prevents diabetes. J Clin Invest. 2003 Nov;112:1521–1532.
321. Weir, GC, Bonner-Weir, S. A dominant role for glucose in beta cell compensation of insulin resistance. J Clin Invest. 2007 Jan;117:81–83.
322. Terauchi, Y, Takamoto, I, Kubota, N, et al. Glucokinase and IRS-2 are required for compensatory beta cell hyperplasia in response to high-fat diet-induced insulin resistance. J Clin Invest. 2007 Jan;117:246–257.
323. Park, S, Dong, X, Fisher, TL, et al. Exendin-4 uses irs2 signaling to mediate pancreatic beta cell growth and function. J Biol Chem. 2006 Jan 13;281:1159–1168.
324. Tatar, M, Kopelman, A, Epstein, D, et al. A mutant Drosophila insulin receptor homolog that extends life-span and impairs neuroendocrine function. Science. 2001 Apr 6;292:107–110.
325. Broughton, SJ, Piper, MD, Ikeya, T, et al. Longer lifespan, altered metabolism, and stress resistance in Drosophila from ablation of cells making insulin-like ligands. Proc Natl Acad Sci U S A. 2005 Feb 22;102:3105–3110.
326. Hughes, KA, Reynolds, RM. Evolutionary and mechanistic theories of aging. Annu Rev Entomol. 2005;50:421–445.
327. Schubert, M, Brazil, DP, Burks, DJ, et al. Insulin receptor substrate-2 deficiency impairs brain growth and promotes tau phosphorylation. J Neurosci. 2003 Aug 6;23:7084–7092.
328. Burks, DJ, de Mora, JF, Schubert, M, et al. IRS-2 pathways integrate female reproduction and energy homeostasis. Nature. 2000 Sep 21;407:377–382.
329. Lin, X, Taguchi, A, Park, S, et al. Dysregulation of insulin receptor substrate 2 in beta cells and brain causes obesity and diabetes. J Clin Invest. 2004 Oct;114:908–916.
330. Choudhury, AI, Heffron, H, Smith, MA, et al. The role of insulin receptor substrate 2 in hypothalamic and beta cell function. J Clin Invest. 2005 Apr;115:940–950.
331. Masaki, T, Chiba, S, Noguchi, H, et al. Obesity in insulin receptor substrate-2-deficient mice: disrupted control of arcuate nucleus neuropeptides. Obes Res. 2004 May;12:878–885.
332. Taguchi, A, Wartschow, LM, White, MF. Brain IRS2 signaling coordinates life span and nutrient homeostasis. Science. 2007 Jul;317:369–372.
333. Schriner, SE, Linford, NJ, Martin, GM, et al. Extension of murine life span by overexpression of catalase targeted to mitochondria. Science. 2005 Jun 24;308:1909–1911.
334. Hekimi, S, Guarente, L. Genetics and the specificity of the aging process. Science. 2003 Feb 28;299:1351–1354.
335. Bonkowski, MS, Rocha, JS, Masternak, MM, et al. Targeted disruption of growth hormone receptor interferes with the beneficial actions of calorie restriction. Proc Natl Acad Sci U S A. 2006 May 16;103:7901–7905.
336. Bluher, M, Kahn, BB, Kahn, CR. Extended longevity in mice lacking the insulin receptor in adipose tissue. Science. 2003 Jan 24;299:572–574.
337. Yasukawa, H, Sasaki, A, Yoshimura, A. Negative regulation of cytokine signaling pathways. Annu Rev Immunol. 2000;18:143–164.
338. Krebs, DL, Hilton, DJ. SOCS: physiological suppressors of cytokine signaling. J Cell Sci. 2000 Aug;113(Pt 16):2813–2819.
339. Kamura, T, Sato, S, Haque, D, et al. The Elongin BC complex interacts with the conserved SOCS-box motif present in members of the SOCS, ras, WD-40 repeat, and ankyrin repeat families. Genes Dev. 1998 Dec 15;12:3872–3881.
340. Tyers, M, Willems, AR. One ring to rule a superfamily of E3 ubiquitin ligases [commentary]. Science. 1999 Apr 23;284:601. [603-1, 604].
341. Zhang, JG, Farley, A, Nicholson, SE, et al. The conserved SOCS box motif in suppressors of cytokine signaling binds to elongins B and C and may couple bound proteins to proteasomal degradation. Proc Natl Acad Sci U S A. 1999 Mar 2;96:2071–2076.