Diabetic Eye Disease
Diabetes mellitus (DM) affects virtually all structures of the eye and many aspects of visual function. Diabetic retinopathy (DR) remains an important cause of new-onset blindness in the United States and other industrialized nations.1 Additionally, coexisting morbidities of DM, including hypertension, renal disease, and dyslipidemia, are associated risk factors for the progression of DR. Multicenter clinical trials have demonstrated the efficacy of glycemic and blood pressure control in preventing the onset and progression of retinopathy2–4 and have demonstrated the effectiveness of laser photocoagulation in preserving vision and reducing the risk of vision loss.5,6 Laser photocoagulation, however, is usually reserved for advanced DR, may be associated with side effects and complications, does not prevent loss of visual acuity in all cases, and often does not restore vision. Nevertheless, because laser photocoagulation is the only treatment proven to reduce the risk of visual loss once vision-threatening retinopathy is present, and because a significant number of persons with DM at risk for visual loss from vision-threatening retinopathy do not receive necessary eye care, public health efforts have been directed at earlier detection and timely photocoagulation.7–11 The purpose of this chapter is to provide a better understanding of the natural history, pathogenesis, epidemiology, detection, and management of DR.
Pathogenesis
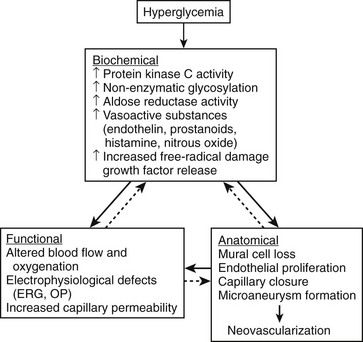
The pathogenesis of DR is not fully understood; however, many mechanisms have been suggested and are summarized in Fig. 26-1.12 The development and progression of DR probably result from a complex interplay of these and other factors, which may vary from person to person. It is likely that the relative contributions of different mechanisms vary in importance at different stages of retinopathy. Glycosylation, protein kinase C and polyol pathways, and changes in retinal blood flow may be particularly important early in the course of the disease, even before the development of microaneurysms or other clinically evident findings. Angiogenesis factors such as vascular endothelial growth factor (VEGF) and insulin-like growth factor 1 are more likely to be important later in the course of the disease, just before and during the development of proliferative retinopathy or diabetic macular edema. In addition, interindividual and intraindividual variations in biochemical or physiologic responses to hyperglycemia (perhaps as a result of differences in genetic susceptibility) may exist among people at different stages of diabetic disease. This variability may explain why a few diabetic patients have minimal retinopathy despite years of severe hyperglycemia, whereas in others severe retinopathy develops in a short period despite relatively good glycemic control. Furthermore, these pathogenetic factors have not often been studied together in a prospective fashion, making it difficult to prove a causal relationship.
Natural History of Diabetic Retinopathy
Nonproliferative Diabetic Retinopathy
The earliest diabetes-induced changes in the retina are biochemical, hemodynamic, and cellular in nature and imperceptible clinically. These include changes in biochemical pathways, enzyme activation, retinal blood flow, and cellular loss, particularly pericytes. The first clinical signs of DR are microaneurysms, which are saccular outpouchings of retinal capillaries.13 These lesions usually appear as round red dots ranging in size from 20 to 200 µm and represent an outpouching of the retinal capillaries. They often appear first in the macular area in areas of capillary closure. It is unusual to detect retinal microaneurysms within 3 years of the diagnosis of type 1 DM; however, they are often present at the time of diagnosis in people with type 2 DM.14 In the United Kingdom Prospective Diabetes Study (UKPDS), where subjects were enrolled at the time of diagnosis of type 2 DM, nearly 40% of the enrollees had some level of DR at entrance into the study.15 Moreover, after 10 years of diabetes, 69% of people with type 1 DM and 55% of people with type 2 DM have microaneurysms present.16,17
Retinal microaneurysms are not pathognomonic of DR, since they also may be associated with essential hypertension, retinal venous stasis caused by atherosclerotic carotid artery disease, AIDS, and other systemic and ocular conditions.18 The appearance of a microaneurysm or two in only one eye of a person with type 2 DM should not be regarded as specific for DR; however, when larger numbers of microaneurysms are present (four or more in an eye or their presence in both eyes), they are more likely due to DM, and the likelihood of progression to more severe nonproliferative DR is greater.19
Microaneurysms have abnormal permeability to fluorescein, red blood cells, and lipoproteins.13 By themselves, microaneurysms are not a threat to vision; however, as the disease progresses, hard exudates and retinal dot or blot hemorrhages appear. Dot hemorrhages are frequently indistinguishable from microaneurysms, and for the purposes of grading the severity of retinopathy, they are frequently grouped with microaneurysm, being referred to as hemorrhages and/or microaneurysms (H/Ma). The blot hemorrhages are round with blurred edges and result from extravasation of blood from retinal capillaries or microaneurysms into the inner nuclear layer of the retina (Fig. 26-2). Retinal blot hemorrhages usually disappear within 3 to 4 months.20 Ruptured microaneurysms, decompensated capillaries, and intraretinal microvascular abnormalities can result in intraretinal hemorrhages. The clinical appearance of these hemorrhages reflects the retinal architecture at the level at which the hemorrhage occurs. Hemorrhages in the nerve-fiber layer assume a more flame-shaped appearance, coinciding with the structure of the nerve-fiber layer that runs parallel to the retinal surface. Hemorrhages deeper in the retina, where the arrangement of cells is more or less perpendicular to the surface of the retina, assume a pinpoint or dot shape.
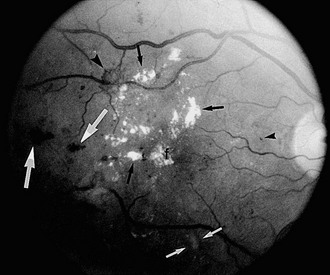
FIGURE 26-2 Fundus photograph of the right eye. A number of retinal microaneurysms (small black arrowhead) appear as small dark spots with sharp margins, and retinal blot hemorrhages (large white arrows) appear as dark spots of varying size with irregular margins and uneven densities. Retinal hard exudates appear as white deposits with sharp margins, either scattered “ringlike” or aggregated in their distributions (small black arrows) in the superior, temporal, and foveal (f) areas. A cotton-wool spot or soft exudate (small white arrows) appears as a grayish white area with ill-defined edges. A retinal new vessel superior and temporal to the fovea (larger black arrowhead) originates from a small retinal venule.
Retinal hard exudates are sharply defined, yellow, and variable in size; they may be aggregated or scattered and partially or fully circinate in their distribution (see Fig. 26-2). A ring of hard exudates generally reflects the border of an area of retinal leakage. Hard exudates result from leakage of lipoprotein material from retinal microaneurysms or capillaries into the outer retinal layer, and they may persist for months to years.20 They are usually found in the posterior layer of the retina, and if they extend into the foveal area, they may reduce visual acuity.
With closure of the retinal capillaries and arterioles, whitish or grayish swellings appear in the nerve-fiber layer of the retina. These changes, termed “cotton-wool spots” or “soft exudates,” are microinfarcts of the nerve-fiber layer (see Fig. 26-2). They may remain only a few weeks to months. After they disappear, the retina may appear normal on ophthalmoscopy, but fluorescein angiography reveals a corresponding area of nonperfusion of the retinal arterioles.
Proliferative Diabetic Retinopathy
Proliferative diabetic retinopathy is characterized by proliferating retinal vessels, the growth of which is variable. They are commonly identified according to their retinal location: at or near the optic disc (neovascularization of the disc [NVD], Fig. 26-3) or elsewhere in the retina (neovascularization elsewhere [NVE], see Fig. 26-2). Retinal neovascularization may be difficult to detect when the vessels first appear as fine tufts of “naked” vessels on the surface of the retina or optic nerve head.21 They are prone to proliferate on the posterior surface of the vitreous and hemorrhage into the vitreous. With time, the new vessels often fibrose, and if this fibrovascular tissue contracts, traction detachment of the retina may result. Once regression of new vessels occurs as a result of photocoagulation or the natural course of the disease, fibrous tissue may remain.
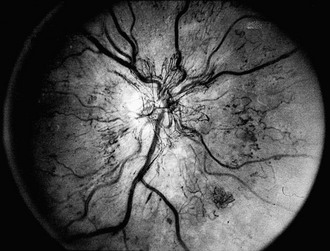
FIGURE 26-3 Fundus photograph demonstrating retinal new vessels on the optic nerve head. The retinal veins are also dilated.
PDR poses a significant risk for vision loss. Patients with high-risk PDR generally require prompt PRP. High-risk PDR is characterized by one or more of the following lesions: (1) NVD that is approximately one quarter to one third the disc area or more in size (i.e., greater than or equal to NVD in standard photograph No. 10A); (2) any amount of NVD if fresh vitreous or preretinal hemorrhage is present; or (3) NVE greater than or equal to one half the disc area in size if fresh vitreous or preretinal hemorrhage is present Therefore, attention must be paid to the presence, location, and severity of new vessels, as well as the presence or absence of preretinal or vitreous hemorrhages.22
Diabetic Macular Edema, Ischemia, and Traction
When macular edema threatens or involves the center of the macula, the edema is considered clinically significant macular edema (CSME). CSME can be present with any level of NPDR or PDR but is more common with more severe DR. The Early Treatment Diabetic Retinopathy Study (ETDRS) found that CSME is associated with a 30% risk of visual loss over a 3- to 5-year period if left untreated with focal photocoagulation. This risk is reduced by 50% or more with appropriate focal laser photocoagulation. CSME is defined as the presence of any of the following: thickening of the retina at or within 500 µm of the center of the macula, hard exudates at or within 500 µm of the center of the macula with thickening of the adjacent retina, or a zone or zones of retinal thickening one disc area or larger in size, any part of which is within one disc diameter of the center of the macula (see Fig. 26-2). The vast majority of vision loss occurs only once macular edema involves the center of the macula.
The underlying cause of macular edema is not known. It may be a result of both increased leakage and impaired removal. Breakdown of the blood-retinal barrier has been postulated as an important cause of fluid accumulation in the macula.13 Reduced osmotic pressure resulting from decreased serum albumin levels, increased intravascular fluid load, increased arterial perfusion pressure, and tissue hypoxia, have been postulated to lead to breakdown of the blood-retinal barrier. The retinal pigment epithelium normally serves to “pump” fluid out of the sensory retina, and this function is postulated to be impaired in patients with hyperglycemia. Recently, key growth factors involved in the progression of DR, such as VEGF, have been shown to be potent permeability factors and probably contribute significantly to this problem. Early clinical trials have shown that compounds which inhibit VEGF appear to rapidly induce regression of retinal neovascularization and may have an ameliorative effect on macular edema.
Clinical Classification of Diabetic Retinopathy Severity
Nonproliferative Diabetic Retinopathy Levels
Mild NPDR is marked by at least one retinal microaneurysm, but hemorrhages and microaneurysms are less than those in ETDRS standard photograph No. 2A, and no other retinal lesion or abnormality associated with DM is present. Those with mild NPDR have a 5% risk of progression to PDR within 1 year and a 15% risk of progression to high-risk PDR within 5 years.23,24 Moderate NPDR is characterized by H/Ma greater than those pictured in ETDRS standard photograph No. 2A. Soft exudates, VB, and IRMA are definitely present to a mild degree. The risk of progression to PDR within 1 year is 12% to 27%, and the risk of progression to high-risk PDR within 5 years is 33%. These risks are based on estimates from a clinical trial done in the 1980s, the ETDRS, and may be lower now based on changes in management of diabetes resulting in generally improved glycemic and blood pressure control.25 Patients with mild or moderate NPDR generally are not candidates for PRP and can be followed safely at 6- to 12-month intervals. The presence of macular edema, even with mild or moderate degrees of NPDR, requires follow-up in a shorter period, and if CSME is present, focal laser treatment is to be considered. Coincident medical problems or pregnancy will reduce the period until reevaluation. Severe NPDR, based on the severity of H/Ma, IRMA, and VB, is characterized by any one of the following lesions: H/Ma > standard photograph No. 2A in four quadrants or venous beading in two or more quadrants or IRMA > standard photograph No. 8A in at least one quadrant. Clinically, severe NPDR is diagnosed by applying the “4-2-1- rule” reflected in the previous definition. Eyes with severe NPDR have a 52% risk of developing PDR within 1 year and a 60% risk of developing high-risk PDR within 5 years. These patients require follow-up evaluation in 2 to 4 months. Treatment of CSME is strongly indicated in these patients because of the high risk of the development of PDR requiring PRP.
Eyes with very severe NPDR have two or more lesions of severe NPDR but no frank neovascularization. There is a 75% risk of developing PDR within 1 year. Patients with very severe NPDR may be candidates for PRP, and macular edema, if present, generally should be treated. Follow-up evaluation at 2- to 3-month intervals is important. For patients with type 2 DM, early PRP may be considered for patients with severe or very severe NPDR.26
Proliferative Diabetic Retinopathy Levels
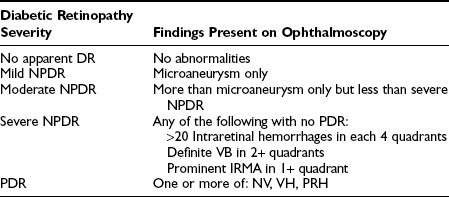
The ETDRS severity scale was based on the modified Airlie House classification of DR and is a recognized standard for grading severity of DR. Its use in everyday clinical practice, however, poses difficulty, both in its complexity and difficulty, since definitions of the levels are detailed, require comparison with standard photographs, and are complex to remember and apply in a clinical setting. A DR severity scale was developed by the Global Diabetic Retinopathy Group at the International Congress of Ophthalmology in Sydney in April 2002.27
This International Classification scale defines five levels of DR. The first level is “no apparent retinopathy” and the second level is “mild NPDR,” corresponding to ETDRS stage 20 (microaneurysms only). The risk of significant progression over several years is very low in both groups. The third level, “moderate NPDR,” includes eyes with ETDRS levels 35 to 47, and the risk of progression increases significantly by level 47. Still, the 4th level, “severe NPDR” (ETDRS stage 53), carries with it the most ominous prognosis for progression to PDR. The fifth level, “PDR,” includes all eyes with definite neovascularization or vitreous/preretinal hemorrhage (Table 26-1). There was no attempt to subdivide this level as a function of ETDRS “high-risk characteristics,” because significant rates of progression are expected to occur in all cases.
Table 26-1
International Clinical Diabetic Retinopathy and Diabetic Macular Edema Disease Severity Scales27
The Diabetic Macular Edema Disease Severity Scale separates eyes with apparent DME from those with no apparent thickening or lipid in the macula. For eyes with apparent DME, three categories classify DME as not threatening the center of the macula (mild), threatening the center of the macula (moderate), or involving the center of the macula (severe) (Table 26-2). The clinical disease severity scale is intended to be a practical and valid method of grading severity of DR and DME.
Table 26-2
International Clinical Diabetic Retinopathy and Diabetic Macular Edema Disease Severity Scales27
| DME Disease Severity | Findings on Ophthalmoscopy |
| DME apparently absent | No apparent retinal thickening or HE in posterior pole |
| DME apparently present | Some apparent retinal thickening or HE in posterior pole |
| Mild DME | Some retinal thickening or HE in posterior pole but distant from center of the macula |
| Moderate DME | Retinal thickening or HE approaching the center of the macula but not involving the center |
| Severe DME | Retinal thickening or HE involving the center of the macular edema |
Epidemiology
One epidemiologic study that has provided data on DR, visual loss, and associated risk factors is the Wisconsin Epidemiologic Study of Diabetic Retinopathy (WESDR). This population-based study has been described in detail.14,16,22,23 Data from other epidemiologic studies are also cited. Standardized examination protocols and questionnaires, photographic documentation, photographic standards for grading the severity of retinal lesions, and standardized retinopathy severity scales have permitted, in some cases, comparisons among studies.28,29
Prevalence and Incidence of Retinopathy
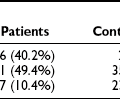
The prevalence of DR and CSME by age, gender, and diabetes group in the WESDR is presented in Table 26-3. The highest frequencies of DR and PDR were found in the younger-onset group using insulin; the lowest frequencies were in the older-onset group not using insulin. CSME was most frequent in the younger-onset group using insulin. The prevalence of DR has been reported in other selected population-based studies.28–49 Pooled data from eight studies, including the WESDR, estimate that among persons 40 years of age and older, the crude prevalence of DR was 40%, and the crude prevalence of severe retinopathy (severe-very severe NPDR and PDR or macular edema) was 8%. Projection of these rates to the diabetic population 40 years of age or older in the United States resulted in an estimate of 4 million persons with DR, of whom 900,000 have signs of vision-threatening retinopathy.1
Table 26-3
Prevalence and Severity of Retinopathy by Sex at the Baseline Examination in the Wisconsin Epidemiologic Study of Diabetic Retinopathy (1980-1982)8
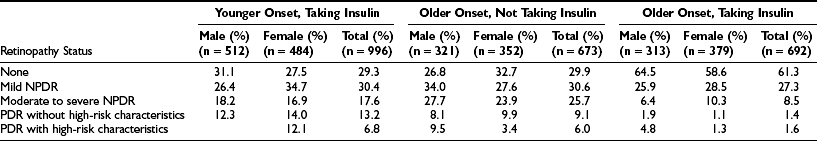
NPDR, Nonproliferative diabetic retinopathy; PDR, proliferative diabetic retinopathy.
In the WESDR, the highest incidence and rate of progression of DR were found in the younger-onset group using insulin; the lowest incidence and rate of progression were found in the older-onset group not using insulin.50,51 Based on the WESDR data, it is estimated that approximately 63,000 new cases of PDR occur annually nationwide, 29,000 of which have proliferative retinopathy with DRS high-risk characteristics. In addition, approximately 50,000 new cases of diabetic macular edema occur each year in the United States. It should be noted that these rates may currently be different owing to the increasing frequency of type 2 diabetes and decreasing incidence of PDR and CSME.52,53
Risk Factors for Diabetic Retinopathy
Gender, Race, Genetics, and Age
Few differences are found in the risk of development and progression of DR in men and women with DM. However, differences among race/ethnic groups have been reported. Results from the study of Pima Indians with type 2 DM suggest that they are at increased risk for PDR in comparison to whites with type 2 DM.48 After controlling for all measured risk factors, diabetic Mexican Americans in San Antonio had a 2.4 times higher frequency of DR than diabetic non-Hispanic whites studied in the WESDR.28 Similarly, Mexican Americans with type 2 DM participating in the National Health and Nutrition Examination Survey III (NHANES III) had an 84% higher frequency of DR than non-Hispanic whites.49 The higher frequency of DR in Mexican Americans than whites remained after controlling for the duration of DM, hemoglobin A1c level, insulin and oral agent use, and hypertension in that study. However, Hamman et al. failed to find a difference in the frequency of DR between Hispanics and non-Hispanic whites examined in the San Luis Valley Study.29 West et al. also reported a similar prevalence of retinopathy in Mexican Americans with type 2 DM living in Arizona, of whom 48% had any retinopathy; 6% had proliferative retinopathy, and 5% had clinically significant macular edema.54 A higher prevalence of proliferative retinopathy and macular edema was found in Mexican Americans living in Los Angeles than in Caucasians living in Beaver Dam.54 It has been suggested that blacks with type 2 DM may have more severe DR and loss of vision than whites with type 2 DM.55 In the NHANES III, the prevalence of DR in people with type 2 DM was 46% higher in non-Hispanic blacks than non-Hispanic whites.49 However, after adjustment for glycosylated hemoglobin, the duration of DM, insulin and oral agent use, and hypertension, the rates for DR were similar between whites and blacks in that study.
Reports of a relationship between genetic factors and the prevalence of DR have been inconsistent.26,56–59 Supporting such a relationship has been the observation that the severity and onset of DR are similar among concordant identical twins, which suggests that the tendency for the development of DR and possibly its progression are influenced by genetic factors.60 In addition, Hanis demonstrated an 8.3-fold increased risk of DR in 46 Mexican American siblings of probands who had DR when compared with the siblings of those who did not.61 A high degree of familial aggregation and concordance in the development of PDR and end-stage renal disease in diabetic patients implies that common genetic factors may be important in susceptibility or resistance to these complications.62 Case-controlled studies have examined various candidate gene single nucleotide polymorphisms (SNP) and suggested that chromosome locus 7q21 is a modifier for the risk of nephropathy in diabetes.63–66 Recent work has identified a specific SNP at the promoter of the erythropoietin gene, located at 7q21, associated with higher rates of development of severe diabetic eye and kidney complications.67
It is uncommon to find clinical evidence of DR in children younger than 10 years, regardless of the duration of type 1 DM; the frequency of any DR or more severe DR increases after age 13.68–71 This age effect has been postulated to result from a protective effect lost after the start of puberty. In the WESDR, menarchal status at the time of the baseline examination was associated with the prevalence of DR.72 After controlling for other factors such as diastolic blood pressure and duration of type 1 DM, those who were postmenarchal in the WESDR were 3.2 times more likely to have DR than those who were premenarchal.
A number of changes occurring at puberty have been thought to explain the higher risk for DR. These changes include increases in insulin-like growth factor 1, growth hormone, sex hormones, and blood pressure and poorer glycemic control. Increased insulin resistance, inadequate insulin dosage, and poorer compliance in attempts to control blood sugar may result in poorer glycemic control in postpubertal teenagers.73–78
Diabetes-Related Risk Factors
Multiple factors have been suggested as risk factors for onset or progression of DR. These factors include duration of DM, control of DM, hypertension, level of cholesterol and other lipids, renal disease, and anemia. The data associated with these risk factors has been extensively reviewed elsewhere79 and is only presented briefly here.
Duration of Diabetes
The prevalence of DR (Fig. 26-4), macular edema, and PDR (Fig. 26-5) is significantly related to the duration of DM in all three diabetic groups studied in the WESDR. This observation is consistent with all previous epidemiologic studies.* The relationship between the duration of DM at the baseline examination and the incidence, progression of nonproliferative DR, or progression to PDR in the WESDR has been presented elsewhere.50,51 DR was less common and PDR or macular edema not present in younger-onset DM, whereas the reverse was true in older-onset DM not taking insulin. These findings are consistent with studies reporting relatively high rates of DR at the time of diagnosis of type 2 DM.82,83
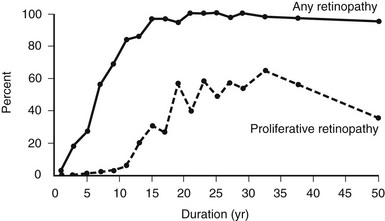
FIGURE 26-4 Frequency of retinopathy or proliferative retinopathy by duration of diabetes (years) in 996 insulin-taking persons in whom diabetes was diagnosed when younger than 30 years and who participated in the Wisconsin Epidemiologic Study of Diabetic Retinopathy (WESDR), 1980-1982. (Data from Klein R, Klein BEK, Moss SE et al: The Wisconsin Epidemiologic Study of Diabetic Retinopathy. II. Prevalence and risk of diabetic retinopathy when age at diagnosis is less than 30 years. Arch Ophthalmol 102:520–526, Copyright 1984, American Medical Association.)
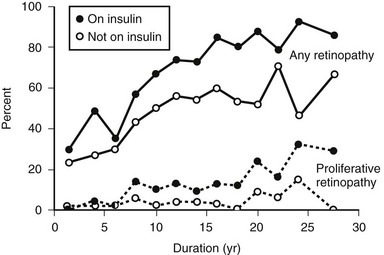
FIGURE 26-5 The frequency of retinopathy or proliferative retinopathy by duration of diabetes (years) in 673 people taking insulin and 697 people not taking insulin in whom diabetes was diagnosed when older than 29 years and who participated in the Wisconsin Epidemiologic Study of Diabetic Retinopathy (WESDR), 1980-1982. (Data from Klein R, Klein BEK, Moss SE et al: The Wisconsin Epidemiologic Study of Diabetic Retinopathy. III. Prevalence and risk of diabetic retinopathy when age at diagnosis is 30 or more years. Arch Ophthalmol 102:527–532, Copyright 1984, American Medical Association.)
These findings have important public health implications. First, they suggest that individuals with younger-onset DM do not need ophthalmologic evaluation for DR before puberty or before 5 years of DM because of lack of vision-threatening retinopathy. For older-onset individuals, because the onset of DM may have been years before its diagnosis, it is important to have a comprehensive ophthalmic examination which includes a dilated retinal examination at diagnosis to detect possible PDR or macular edema. These findings have been used to develop guidelines recommending ophthalmologic care for patients with DM84,85 (Table 26-4).
Table 26-4
Recommendations for Eye Care for Diabetic Patients
Primary-care physician informs the patient at the time of diagnosis of diabetes that:
Ocular complications are associated with diabetes and may threaten sight.
Timely detection and treatment may reduce the risk of decreased vision.
Referral to an eye doctor competent in ophthalmoscopy:
All patients 10-30 years old who have had diabetes for 5 or more years
In patients in whom diabetes was diagnosed when older than 30 years, examination at the time of diagnosis or shortly thereafter
Referral to an ophthalmologist:
All women with insulin-dependent diabetes mellitus planning pregnancy within 12 months, in the first trimester, and thereafter at the discretion of the ophthalmologist
Patients found to have reduced corrected visual acuity, elevated intraocular pressure, and any other vision-threatening ocular abnormalities
From Klein R, Klein BEK, Moss S: The Wisconsin Epidemiologic Study of Diabetic Retinopathy: A review. Diabetes Metab Rev 5:559–570, 1989.
Glycemic Status
A growing body of epidemiologic data have shown that hyperglycemia is related to the incidence and progression of DR.28,31,32,35,37,38,40,43–46,49,80,81 In the WESDR, the glycosylated hemoglobin level at baseline was found to be a significant predictor of the incidence of any DR, progression, incidence of PDR, or incidence of macular edema in all three diabetic groups studied.86,87 WESDR findings and those of others suggest that even in people with longer duration of DM, good glycemic control is more likely to be associated with lower rates of progression of DR than poor glycemic control.43,86–88 In addition, in the WESDR, no threshold level of glycemia, as measured by deciles of glycosylated hemoglobin at baseline, was seen below which DR did not progress (Fig. 26-6).
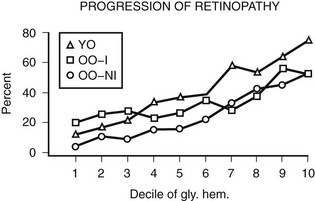
FIGURE 26-6 Relationship of the 4-year progression of diabetic retinopathy to deciles of glycosylated hemoglobin at baseline examination in three diabetic groups participating in the Wisconsin Epidemiologic Study of Diabetic Retinopathy (WESDR). YO refers to younger onset. OO-I refers to older onset on insulin. OO-NI refers to older onset not on insulin.
The Diabetes Control and Complications Trial (DCCT) was a large, randomized, controlled clinical trial of more than 1400 patients with type 1 DM.2 This multicenter trial showed that intensive insulin treatment reduced the risk of the development and progression of DR. In that study, those assigned to intensive glycemic control had a 60% reduction in three-step or greater progression of DR than did the group assigned to conventional treatment. In the secondary intervention arm of the DCCT, those assigned to intensive glycemic control had a 34% reduction in the progression of DR, a 47% reduction in the incidence of severe levels of NPDR or PDR, a 22% reduction in the incidence of macular edema, and a 54% reduction in laser photocoagulation treatment when compared with the group assigned to conventional insulin treatment.
The United Kingdom Prospective Diabetes Study (UKPDS) was a randomized controlled clinical trial involving 3867 patients with newly diagnosed type 2 DM.3 After 3 months of diet treatment, patients with a mean of two fasting plasma glucose concentrations of 6.1 to 15.0 mmol/L were randomly assigned to an intensive glycemic control group with either a sulfonylurea (chlorpropamide, glibenclamide, or glipizide) or insulin or to a conventional glycemic control group with diet. After 10 years of follow-up, hemoglobin A1c was 7.0% in the intensive group and 7.9% in the conventional group, and the data conclusively showed that intensive treatment with either sulfonylureas or insulin significantly reduced the risk of progression of DR in persons with type 2 DM.
The DCCT and UKPDS results demonstrate a causal relationship between glycemic control and the risk of DR, as well as other microvascular complications, and suggest that lowering blood sugar, even modestly, may significantly reduce the incidence of PDR or macular edema or the need for photocoagulation.2,3 However, reducing glycemic control is not without adverse affects. The DCCT found a 60% risk of weight gain and a 330% increased risk of severe hypoglycemic episodes in the intensive glycemic control group versus the conventional group.2
Other Risk Factors
Clinical studies suggest a possible relationship between elevated blood pressure and the presence of DR.74 High blood pressure, through an effect on blood flow, has been postulated to damage capillary endothelial cells, possibly contributing to the development or progression of retinopathy.89 However, recent epidemiologic studies on the relationship of blood pressure to the incidence and progression of DR have been conflicting.28,29,31,32,35,37,40,43,45,46,80,81,90–92 These data have been reviewed previously.79 The UKPDS randomized 1148 patients with hypertension (mean blood pressure, 160/94 mm Hg) to a regimen of tight control with either captopril or atenolol and another 390 patients to less tight control of their blood pressure to evaluate whether tight control of blood pressure with either a β-adrenergic blocker or an angiotensin-converting enzyme inhibitor was beneficial in reducing the macrovascular and microvascular complications associated with type 2 DM.4 Tight blood pressure control resulted in a 35% reduction in retinal photocoagulation when compared with conventional control. After 7.5 years of follow-up, there was a 34% reduction in the rate of progression of DR by two or more steps on the modified ETDRS severity scale and a 47% reduction in a moderate visual loss. The effect was largely due to a reduction in the incidence of diabetic macular edema. Atenolol and captopril were equally effective in reducing the risk of development of these microvascular complications. The effects of blood pressure control were independent of those of glycemic control. These findings strongly support tight blood pressure control in people with type 2 diabetes as a means of preventing visual loss resulting from the progression of DR.
Regardless of whether blood pressure is a causal agent for the development or progression of DR, it is imperative to measure and treat high blood pressure in diabetic patients because of the known association of high blood pressure with a higher risk of heart attack, stroke, and the development of diabetic nephropathy.93–98
Serum Lipids
Epidemiologic data suggest a relationship between higher levels of lipids and the presence of DR or the development of hard exudates.29,40,80,99,100 The WESDR showed a significant trend toward increasing severity of DR and retinal hard exudates with increasing cholesterol in the younger- and older-onset groups using insulin.100 The ETDRS found a positive relationship between serum lipids (triglycerides, low-density lipoprotein cholesterol, and very-low-density lipoprotein cholesterol) and the development of hard exudates.101 Although data from earlier clinical trials suggested a beneficial effect of clofibrate (Atromid-S, a lipid-lowering agent with significant hepatic toxicity) in reducing the presence of hard exudates, it did not lead to an improvement in vision.102,103 The Action to Control Cardiovascular Risk in Diabetes (ACCORD) found that compared with standard hyperglycemic therapy, intensive treatment aimed at lowering the glycosylated hemoglobin level to below 6.0% resulted in a statistically significant 22% increase in mortality in persons with type 2 diabetes.104 Currently, preliminary results of the ACCORD-EYE study have shown that tight glycemic and BP control and management of dyslipidemia in people with type 2 DM will reduce the incidence and progression of DR.105
Proteinuria and Renal Disease
Diabetic nephropathy may lead to lipid, platelet, and rheologic abnormalities, all of which have been hypothesized to be pathogenetic factors for the development of DR.106,107 Therefore, it is not surprising that most epidemiologic studies have found a strong association between the presence and severity of DR and microalbuminuria and gross proteinuria.40,44,80,99 These relationships are independent of blood pressure.108
Cigarette Smoking and Alcohol Consumption
Most data from epidemiologic studies have failed to confirm earlier reports of a positive relationship between cigarette smoking and DR.28,29,37,80,109,110 Regardless of the relationship with DR, diabetic patients should be advised to not smoke because it is an important risk factor for respiratory and cardiovascular disease, as well as for cancer.111,112 Few epidemiologic studies have investigated the relationship of alcohol consumption to DR.113–115 One might anticipate a possible protective effect of alcohol as a result of decreased platelet aggregation and adhesiveness.116 Data from one study suggested a beneficial effect of alcohol, whereas data from another study suggested an increased risk of proliferative retinopathy in people with DM.113,114 In the WESDR, alcohol consumption was associated with a lower frequency of PDR in the younger-onset group.115 However, no relationship was found between alcohol consumption at the 4-year examination and the incidence and progression of DR in either the younger- or older-onset groups at the 10-year follow-up.115
Pregnancy
Epidemiologic studies suggest that pregnancy is a significant predictor of progression of DR.117 In a review of the literature, Rodman et al. reported that 8% of women with type 1 DM who had no or early NPDR at the onset of pregnancy had progression of DR during pregnancy.118 In a case-control study of women with type 1 DM, the frequency of progression to PDR retinopathy was higher in those who were pregnant than those who were not (7.3% versus 3.7%).117 Women in this study were similar in age, duration of DM, and DR status at the baseline examination. Pregnancy remained a significant predictor of the progression of DR after controlling for glycosylated hemoglobin. Severe DR is also an indicator for a higher risk of congenital abnormalities in children born of mothers with type 1 DM.119
Comorbidity
In the WESDR, diabetic people with PDR are at higher risk for the development of diabetic nephropathy, heart attack, stroke, and amputation than are those with minimal or no DR present.108 This observation is consistent with the association of severe DR with cardiovascular disease risk factors such as increased fibrinogen, increased platelet aggregation, hyperglycemia, and hypertension.100,106,107,120,121
Other Ocular Disease Associated With Diabetes
Cataract is an opacification of the normally clear crystalline lens of the eye. Persons with DM tend to develop cataracts at a younger age, and the cataracts develop more rapidly compared to persons without DM.122 In both the Health and Nutrition Examination Survey (HANES) and the Framingham Eye Study, diabetic participants younger than 65 years had a respective 3.0 and 4.0 increased risk of having a cataract when compared with similarly aged nondiabetic participants. People with DM appear to have differences in the frequency and severity of specific lens opacities. In the Beaver Dam Eye Study, after adjusting for age and sex, cortical opacities and posterior subcapsular cataract were significantly more common among people with older-onset DM than in the rest of the Beaver Dam population.123 In the younger-onset group in the WESDR, the prevalence of cataract surgery and cataract was significantly related to older age at examination, longer duration of DM, diuretic usage, higher glycosylated hemoglobin concentration, and more severe DR.124 In the older-onset groups, the prevalence of cataract was associated with older age, diuretic usage, smoking, and more severe retinopathy. In the UKPDS, intensive glycemic control was associated with a significant reduction in cataract extraction when compared with those with conventional control.3
Glaucoma
Glaucoma is usually defined by the presence of characteristic visual field loss associated with damage to the retinal nerve fiber layer as a result of intraocular pressure higher than the eye can tolerate. DM has been suggested as increasing the risk of glaucoma.125 However, neither the Framingham Eye Study nor a study in Dalby, England, found a relationship between DM and glaucoma.126,127 In the WESDR, a history of glaucoma was more frequent in younger and older diabetic people than in the general population studied in the Health Interview Survey or in nondiabetic participants in the WESDR.126–129 In the Beaver Dam Eye Study, after controlling for age and sex, DM was associated with an 84% increase in the risk of glaucoma.126 The Nurses’ Health Study (NHS), which enrolled 76,318 women who were followed from 1980 to 2000, showed that type 2 DM was associated with a 1.23 to 2.7 increased risk of developing primary open angle glaucoma.130
Visual Impairment
In the WESDR, people with DM had a higher age-specific prevalence of visual impairment (best-corrected visual acuity in the better eye of 20/40 or worse) than did the nondiabetic population in the Beaver Dam Eye Study (Fig. 26-7), as well as a higher age-specific prevalence of legal blindness (best-corrected visual acuity in the better eye of 20/200 or worse) than found in the general population in either the Framingham Eye Study or the HANES131 (Fig. 26-8). For the younger-onset group using insulin, DR was responsible for 86% of the visual loss; for the older-onset group, it was responsible for 33% of the visual loss. In the WESDR, the annual incidence of blindness caused by DM was estimated to be 3.3 per 100,000 general population.132 The 4-year incidence of legal blindness was higher in the older-onset groups (3.2% in those using insulin and 2.7% in those not using insulin) than in the younger-onset group (1.5%).
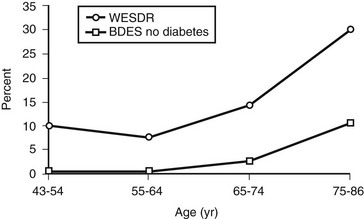
FIGURE 26-7 Visual impairment (best-corrected visual acuity in the better eye of 20/40 or worse) in those with diabetes participating in the Wisconsin Epidemiologic Study of Diabetic Retinopathy, 1980-1982, and in those without diabetes participating in the Beaver Dam Eye Study, 1988-1990.
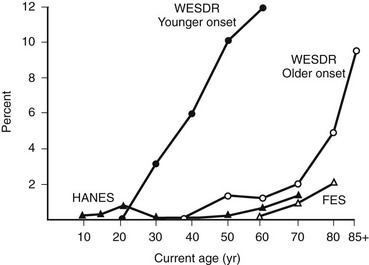
FIGURE 26-8 Percentage of persons with visual acuity of 20/200 or worse in the better eye in the Wisconsin Epidemiologic Study of Diabetic Retinopathy (WESDR), the Health and Nutrition Examination Survey (HANES), and the Framingham Eye Study (FES) by current age. (Data from Klein R, Klein BEK, Moss SE: Visual impairment in diabetes. Ophthalmology 91:1–9, 1984.)
Detection
Detection of DR is best achieved by ophthalmoscopic examination through a dilated pupil by a retinal specialist or an eye doctor expert in diabetes eye care.85 Stereoscopic color fundus photography increases the sensitivity of detection of vision-threatening retinopathy relative to ophthalmoscopy and is especially indicated when monitoring patients with signs of NPDR, PDR, or macular edema.133–135 Fluorescein angiography is generally used by retinal specialists before laser photocoagulation treatment of eyes with clinically significant macular edema to detect areas of retinal ischemia and leaking microaneurysms. Angiograms may occasionally be used to provide further information regarding the amount of ischemia and to demonstrate the cause of unexplained visual loss. However, fluorescein angiography is not routinely necessary at the time of diagnosis of DM or in diabetic patients with no or minimal NPDR.
In the WESDR in 1980 to 1982, 33% of people with either PDR with a high risk of severe visual loss or clinically significant macular edema had not seen an ophthalmologist within 2 years of the examination.136 In addition, 51% of eyes with PDR had not been treated with scatter (panretinal) photocoagulation.137 Based on these data, we estimated that 35,000 Americans with vision-threatening DR who might benefit from photocoagulation treatment had not received such treatment in 1980 to 1982. Little change was found when the group was re-examined,138 and similar findings have also been reported by others.139–141 Many possible reasons have been proposed to explain the high rate of patients with serious DR who do not receive appropriate eye care.11,21,139,142–146 Guidelines for the detection and management of diabetic eye disease have been developed and distributed.85 However, studies have suggested that these referral guidelines for DR are not being sufficiently followed.7,140,141,146 Cost-effectiveness studies using the WESDR and other data suggest that earlier detection of PDR by ophthalmologic or photographic screening is a cost-effective approach for diabetics requiring insulin.147–149 The American Diabetes Association has recognized the value of retinal imaging in assessing diabetic retinopathy and states that examinations can be done with retinal photographs, with or without pupil dilation, read by experienced experts, but in-person exams are still necessary when photos are unacceptable and for follow-up of abnormalities detected.150
Management
As discussed earlier, the DCCT and UKPDS studies have demonstrated that it is important to manage glycemic and hypertension control carefully for optimum care of patients with DM. However, intensive glycemic control is often difficult or impossible to achieve in certain patients. Strict glycemic control is also associated with an increased frequency of severe complications.2 Currently, new interventions (e.g., protein kinase C inhibitors, VEGF inhibitors, intraocular steroids) to prevent the progression of DR and macular edema are under study, as described in the following discussion.
Ophthalmologic
Several nationwide multicenter randomized clinical trials have largely determined the appropriate strategies for clinical management of patients with diabetic retinopathy. The Diabetic Retinopathy Study (DRS) conclusively demonstrated that scatter (panretinal) photocoagulation significantly reduces the risk of severe visual loss (SVL) from PDR, particularly when high-risk PDR was present.5,151,152 The ETDRS provided valuable information concerning the timing of PRP for advancing diabetic retinopathy and conclusively demonstrated that focal photocoagulation for CSME reduces the risk of moderate visual loss by 50% or more.5,23,153 Furthermore, the ETDRS demonstrated that both early PRP and deferral of PRP “until and as soon as high-risk PDR developed are effective in reducing the risk of SVL.” PRP, therefore, should be considered as an eye approaches the high-risk stage and “usually should not be delayed if the eye has reached the high-risk proliferative stage.”23 Detailed analysis of the ETDRS data shows that early PRP is beneficial for patients with type 2 DM.154,155 When therapy is initiated at the first sign of appropriate severity of DR, benefits may include a reduction of more than 90% in severe visual loss.23,155
Rehabilitation
Diabetic patients with severe visual impairment are confronted with difficulties in glucose monitoring, insulin administration, and monitoring of systemic changes in the skin such as foot ulcers. In addition, these patients are often ill with renal disease, cardiovascular disease, or amputations. Many have lost their jobs and health insurance and are without adequate financial support. These problems may lead to anger, anxiety, loss of self-esteem, and difficulties in social adjustment.156 Primary care physicians should be actively involved in a team that includes psychologists, orientation and mobility instructors, rehabilitation teachers, and social workers to deal with the problems faced by visually impaired diabetic patients. Such support facilitates acceptance of visual loss, development of coping strategies, and planning of living arrangements.
Novel Therapies
Despite only anecdotal and short-term uncontrolled studies, the use of intravitreal steroid for the treatment of macular edema came into widespread use to treat an often observed rapid reduction in macular thickness. Periocular steroid use was also advocated. Recent studies on periocular and posterior subtenon injection of triamcinolone acetonide did not show any benefit for the treatment of DME, and further study of the approach has been abandoned.157 A 2-year, multicenter, randomized laser controlled study of intraocular preservative-free triamcinolone acetonide has just recently been completed. Although intravitreal steroid did result in an initial rapid reduction in retinal thickness and improvement in vision, by 1 year the results were no better than laser photocoagulation, and after 2 years, the steroid was inferior to the laser treatment in both these endpoints. In addition, there was an approximately fourfold increase in the rate of intraocular pressure and cataract side effects in the steroid group.158
Recent interest has focused on possible genetic risk factors that may delay or hasten the progression to severe proliferative diabetic retinopathy. There are published reports on two unique cohorts of type 1 patients with more than 50 years of diabetes. The Golden Years cohort has shown a possible genetically determined protective effect against the development of diabetic nephropathy and large vessel disease.159 The 50-Year Medalist cohort has also shown a significantly lower risk of developing proliferative retinopathy and other microvascular complications in patients with type 1 diabetes of extreme duration.160 The data from these two cohorts point to a possible genetic susceptibility for the development of proliferative retinopathy. A recent study has identified a single base pair mutation in the promoter of the erythropoietin gene which results in dramatic increases in expression of this known angiogenic factor in the eye.67 This polymorphism is associated with higher rates of development of severe diabetic eye and kidney complications and represents the first gene mutation specifically associated with diabetic retinopathy.
With the emerging global epidemic of diabetes and the rapid advances in scientific discovery, there has been a dramatic increase in the need to examine novel therapies in the clinical setting. To identify the most promising new therapies and to bring them to evaluation in a rigorous and timely manner, the National Institutes of Health’s National Eye Institute has sponsored a cooperative agreement initiating the Diabetic Retinopathy Clinical Research Network (www.DRCR.net). This nationwide network includes over 150 centers and is dedicated to multicenter clinical research of DR, macular edema, and associated disorders. It has numerous multicenter clinical trial initiatives underway, covering a full spectrum of approaches to this disorder. Multiple DRCR.net studies have already added substantially to and refined our understanding of this disease.157,158,161–167 The results of multiple other ongoing randomized multicenter clinical trials may provide additional new therapeutic options for this devastating condition.
References
1. Kempen, JH, O’Colmain, BJ, Leske, MC, et al. The prevalence of diabetic retinopathy among adults in the United States. Arch Ophthalmol. 2004;122(4):552–563.
2. The Effect of Intensive Treatment of Diabetes on the Development and Progression of Long-Term Complications in Insulin-Dependent Diabetes Mellitus: The diabetes control and complications trial research group. N Engl J Med. 1993;329(14):977–986.
3. Intensive Blood-Glucose Control With Sulfonylureas or Insulin Compared With Conventional Treatment and Risk of Complications in Patients With Type 2 Diabetes (UKPDS 33): UK Prospective Diabetes Study (UKPDS) group. Lancet. 1998;352(9131):837–853.
4. Tight Blood Pressure Control and Risk of Macrovascular and Microvascular Complications in Type 2 Diabetes: UKPDS 38. UK Prospective Diabetes Study Group. BMJ. 1998;317(7160):703–713.
5. Photocoagulation Treatment of Proliferative Diabetic Retinopathy: Clinical application of Diabetic Retinopathy Study (DRS) findings, DRS Report Number 8. The Diabetic Retinopathy Study Research Group. Ophthalmology. 1981;88(7):583–600.
6. Photocoagulation for Diabetic Macular Edema: Early treatment diabetic retinopathy study report number 1. Early Treatment Diabetic Retinopathy Study Research Group. Arch Ophthalmol. 1985;103(12):1796–1806.
7. Witkin, SR, Klein, R. Ophthalmologic care for persons with diabetes. JAMA. 1984;251(19):2534–2537.
8. Klein, R, Moss, SE, Klein, BE. New Management concepts for persons with diabetes. Diabetes Care. 1987;10:633–638.
9. National Eye Institute: National eye health education program, from vision research to eye health: planning the partnership. Box 20/20. Bethesda, MD 20892: NIH, 1990.
10. Smith, RE, Patz, A. Diabetes 2000—closing the gap. Ophthalmology. 1990;97:153–154.
11. Herman, WH, Teutsch, SM, Sepe, SJ, et al. An approach to the prevention of blindness in diabetes. Diabetes Care. 1983;6(6):608–613.
12. Klein, R, Klein, BE. Diabetic eye disease. Lancet. 1997;350:197–204.
13. Bresnick, GH. Diabetic retinopathy. In: Peyman GA, Sanders DR, Goldberg MF, eds. Principles and practice of ophthalmology. Philadelphia: WB Saunders, 1977.
14. Klein, R, Klein, BE, Moss, SE. Prevalence of diabetes in Southern Wisconsin. Am J Epidemiol. 1984;119:54–61.
15. Kohner, EM, Aldington, SJ, Stratton, IM, et al. United Kingdom prospective diabetes study, 30: diabetic retinopathy at diagnosis of non-insulin-dependent diabetes mellitus and associated risk factors. Arch Ophthalmol. 1998;116(3):297–303.
16. Klein, R, Klein, BE, Moss, SE, et al. The Wisconsin epidemiologic study of diabetic retinopathy. II. Prevalence and risk of diabetic retinopathy when age at diagnosis is less than 30 years. Arch Ophthalmol. 1984;102(4):520–526.
17. Klein, R, Klein, BE, Moss, SE, et al. The Wisconsin epidemiologic study of diabetic retinopathy. III. Prevalence and risk of diabetic retinopathy when age at diagnosis is 30 or more years. Arch Ophthalmol. 1984;102(4):527–532.
18. Gass, JDM. Stereoscopic atlas of macular disease, ed 3. St Louis: Mosby; 1987.
19. Klein, R, Meuer, SM, Moss, SE, et al. The relationship of retinal microaneurysm counts to the 4-year progression of diabetic retinopathy. Arch Ophthalmol. 1989;107(12):1780–1785.
20. Dobree, JH. Simple diabetic retinopathy. Evolution of the lesions and therapeutic considerations. Br J Ophthalmol. 1970;54(1):1–10.
21. Sussman, EJ, Tsiaras, WG, Soper, KA. Diagnosis of diabetic eye disease. JAMA. 1982;247(23):3231–3234.
22. Four Risk Factors for Severe Visual Loss in Diabetic Retinopathy: The third report from the diabetic retinopathy study. The diabetic retinopathy study research group. Arch Ophthalmol. 1979;97(4):654–655.
23. Early Photocoagulation for Diabetic Retinopathy: ETDRS Report Number 9: Early treatment diabetic retinopathy study research group. Ophthalmology. 1991;98(5 Suppl):766–785.
24. Grading Diabetic Retinopathy From Stereoscopic Color Fundus Photographs—an Extension of the Modified Airlie House Classification. ETDRS Report Number 10. Early treatment diabetic retinopathy study research group. Ophthalmology. 1991;98(5 Suppl):786–806.
25. Hovind, P, Tarnow, L, Rossing, K, et al. Decreasing incidence of severe diabetic microangiopathy in type 1 diabetes. Diabetes Care. 2003;26(4):1258–1264.
26. Cruickshanks, KJ, Vadheim, CM, Moss, SE, et al. Genetic marker associations with proliferative retinopathy in persons diagnosed with diabetes before 30 yr of age. Diabetes. 1992;41(7):879–885.
27. Wilkinson, CP, Ferris, FL, III., Klein, RE, et al. Proposed international clinical diabetic retinopathy and diabetic macular edema disease severity scales. Ophthalmology. 2003;110(9):1677–1682.
28. Haffner, SM, Fong, D, Stern, MP, et al. Diabetic retinopathy in Mexican Americans and Non-Hispanic Whites. Diabetes. 1988;37(7):878–884.
29. Hamman, RF, Mayer, EJ, Moo-Young, GA, et al. Prevalence and risk factors of diabetic retinopathy in Non-Hispanic Whites and Hispanics with NIDDM. San Luis Valley Diabetes Study. Diabetes. 1989;38(10):1231–1237.
30. Nielsen, NV. Diabetic Retinopathy II. The course of retinopathy in diabetics treated with oral hypoglycaemic agents and diet regime alone. A one-year epidemiological cohort study of diabetes mellitus. The Island of Falster, Denmark. Acta Ophthalmol (Copenh.). 1984;62(2):266–273.
31. Dorf, A, Ballintine, EJ, Bennett, PH, et al. Retinopathy in Pima Indians. Relationships to glucose level, duration of diabetes, age at diagnosis of diabetes, and age at examination in a population with a high prevalence of diabetes mellitus. Diabetes. 1976;25(7):554–560.
32. Bennett, PH, Rushforth, NB, Miller, M, et al. Epidemiologic studies of diabetes in the Pima Indians. Recent Prog Horm Res. 1976;32:333–376.
33. Kahn, HA, Leibowitz, HM, Ganley, JP, et al. The Framingham eye study. I. Outline and major prevalence findings. Am J Epidemiol. 1977;106(1):17–32.
34. West, KM, Erdreich, LJ, Stober, JA. A detailed study of risk factors for retinopathy and nephropathy in diabetes. Diabetes. 1980;29(7):501–508.
35. King, H, Balkau, B, Zimmet, P, et al. Diabetic retinopathy in Nauruans. Am J Epidemiol. 1983;117(6):659–667.
36. Dwyer, MS, Melton, LJ, III., Ballard, DJ, et al. Incidence of diabetic retinopathy and blindness: a population-based study in Rochester, Minnesota. Diabetes Care. 1985;8(4):316–322.
37. Ballard, DJ, Melton, LJ, III., Dwyer, MS, et al. Risk factors for diabetic retinopathy: a population-based study in Rochester, Minnesota. Diabetes Care. 1986;9(4):334–342.
38. Danielsen, R, Jonasson, F, Helgason, T. Prevalence of retinopathy and proteinuria in type 1 diabetics in Iceland. Acta Med Scand. 1982;212(5):277–280.
39. Constable, IJ, Knuiman, MW, Welborn, TA, et al. Assessing the risk of diabetic retinopathy. Am J Ophthalmol. 1984;97(1):53–61.
40. Knuiman, MW, Welborn, TA, McCann, VJ, et al. Prevalence of diabetic complications in relation to risk factors. Diabetes. 1986;35(12):1332–1339.
41. Sjolie, AK. Ocular complications in insulin treated diabetes mellitus. an epidemiological study. Acta Ophthalmol Suppl. 1985;172:1–77.
42. Nielsen, NV. Diabetic Retinopathy I. The course of retinopathy in insulin-treated diabetics. A one year epidemiological cohort study of diabetes mellitus. The Island of Falster, Denmark. Acta Ophthalmol (Copenh.). 1984;62(2):256–265.
43. Teuscher, A, Schnell, H, Wilson, PW. Incidence of diabetic retinopathy and relationship to baseline plasma glucose and blood pressure. Diabetes Care. 1988;11(3):246–251.
44. Jerneld, B. Prevalence of diabetic retinopathy. A population study from the Swedish Island of Gotland. Acta Ophthalmol Suppl. 1988;188:3–32.
45. McLeod, BK, Thompson, JR, Rosenthal, AR. The prevalence of retinopathy in the insulin-requiring diabetic patients of an English country town. Eye. 1988;2(Pt 4):424–430.
46. Kostraba, JN, Klein, R, Dorman, JS, et al. The epidemiology of diabetes complications study. IV. Correlates of diabetic background and proliferative retinopathy. Am J Epidemiol. 1991;133(4):381–391.
47. Fujimoto, W, Fukuda, M. Natural history of diabetic retinopathy and its treatment in Japan. Fukui I. Diabetes mellitus in Asia. Amsterdam: Excerpta Medica; 1976.
48. Nelson, RG, Wolfe, JA, Horton, MB, et al. Proliferative retinopathy in NIDDM. Incidence and risk factors in Pima Indians. Diabetes. 1989;38(4):435–440.
49. Harris, MI, Klein, R, Cowie, CC, et al. Is the risk of diabetic retinopathy greater in Non-Hispanic Blacks and Mexican Americans than in Non-Hispanic Whites with type 2 diabetes? A U.S. population study. Diabetes Care. 1998;21(8):1230–1235.
50. Klein, R, Klein, BE, Moss, SE, et al. The Wisconsin epidemiologic study of diabetic retinopathy. IX. Four-year incidence and progression of diabetic retinopathy when age at diagnosis is less than 30 years. Arch Ophthalmol. 1989;107(2):237–243.
51. Klein, R, Klein, BE, Moss, SE, et al. The Wisconsin epidemiologic study of diabetic retinopathy. X. Four-year incidence and progression of diabetic retinopathy when age at diagnosis is 30 years or more. Arch Ophthalmol. 1989;107(2):244–249.
52. Hovind, P, Klein, R, Knudtson, MD, et al. The Wisconsin epidemiologic study of diabetic retinopathy XXII. The twenty-five-year progression of retinopathy in persons with type 1 diabetes. Ophthalmology. 2008.
53. Klein, R, Knudtson, MD, Lee, KE, et al. The Wisconsin epidemiologic study of diabetic retinopathy. XXIII. The twenty-five-year incidence of macular edema in persons with type 1 diabetes. Ophthalmology. 2008.
54. Varma, R, Torres, M, Pena, F, et al. Prevalence of diabetic retinopathy in adult latinos: the Los Angeles Latino eye study. Ophthalmology. 2004;111(7):1298–1306.
55. Rabb, MF, Gagliano, DA, Sweeney, HE. Diabetic retinopathy in Blacks. Diabetes Care. 1990;13(11):1202–1206.
56. Barbosa, J, Ramsay, RC, Knobloch, WH, et al. Histocompatibility antigen frequencies in diabetic retinopathy. Am J Ophthalmol. 1980;90(2):148–153.
57. Dornan, TL, Ting, A, McPherson, CK, et al. Genetic susceptibility to the development of retinopathy in insulin-dependent diabetics. Diabetes. 1982;31(3):226–231.
58. Rand, LI, Krolewski, AS, Aiello, LM, et al. Multiple factors in the prediction of risk of proliferative diabetic retinopathy. N Engl J Med. 1985;313(23):1433–1438.
59. Jervell, J, Solheim, B. HLA-antigens in longstanding insulin-dependent diabetics with terminal nephropathy and retinopathy with and without loss of vision. Diabetologia. 1979;17(6):391.
60. Leslie, RD, Pyke, DA. Diabetic retinopathy in identical twins. Diabetes. 1982;31(1):19–21.
61. Hanis, CL. Genetics of non-insulin dependent diabetes mellitus among Mexican Americans: approaches and perspectives. In: Berg K, Boulyjenkov V, Christen Y, eds. Genetic approaches to noncommunicable diseases. Berlin: Springer-Verlag; 1996:65–77.
62. Clustering of Long-Term Complications in Families With Diabetes in the Diabetes Control and Complications Trial: The diabetes control and complications trial research group. Diabetes. 1997;46(11):1829–1839.
63. Iyengar, SK, Abboud, HE, Goddard, KA, et al. Genome-wide scans for diabetic nephropathy and albuminuria in multiethnic populations: the Family Investigation of Nephropathy and Diabetes (FIND). Diabetes. 2007;56(6):1577–1585.
64. Imperatore, G, Knowler, WC, Nelson, RG, et al. Genetics of diabetic nephropathy in the Pima Indians. Curr Diab Rep. 2001;1(3):275–281.
65. Kankova, K, Stejskalova, A, Pacal, L, et al. Genetic risk factors for diabetic nephropathy on chromosomes 6p and 7q identified by the set-association approach. Diabetologia. 2007;50(5):990–999.
66. Placha, G, Canani, LH, Warram, JH, et al. Evidence for different susceptibility genes for proteinuria and ESRD in type 2 diabetes. Adv Chronic Kidney Dis. 2005;12(2):155–169.
67. Tong, Z, Yang, Z, Patel, S, et al. Promoter polymorphism of the erythropoietin gene in severe diabetic eye and kidney complications. Proc Natl Acad Sci U S A. 2008;105(19):6998–7003.
68. Frank, RN, Hoffman, WH, Podgor, MJ, et al. Retinopathy in juvenile-onset type I diabetes of short duration. Diabetes. 1982;31(10):874–882.
69. Knowles, HC, Jr., Guest, GM, Lampe, J, et al. The course of juvenile diabetes treated with unmeasured diet. Diabetes. 1965;14:239–273.
70. Palmberg, P, Smith, M, Waltman, S, et al. The natural history of retinopathy in insulin-dependent juvenile-onset diabetes. Ophthalmology. 1981;88(7):613–618.
71. Klein, R, Klein, BE, Moss, SE, et al. Retinopathy in young-onset diabetic patients. Diabetes Care. 1985;8(4):311–315.
72. Klein, BE, Moss, SE, Klein, R. Is menarche associated with diabetic retinopathy? Diabetes Care. 1990;13(10):1034–1038.
73. Pieters, GF, Smals, AG, Kloppenborg, PW. Defective suppression of growth hormone after oral glucose loading in adolescence. J Clin Endocrinol Metab. 1980;51(2):265–270.
74. Klein, R, Klein, BE, Moss, SE, et al. Blood pressure and hypertension in diabetes. Am J Epidemiol. 1985;122(1):75–89.
75. Blethen, SL, Sargeant, DT, Whitlow, MG, et al. Effect of pubertal stage and recent blood glucose control on plasma somatomedin C in children with insulin-dependent diabetes mellitus. Diabetes. 1981;30(10):868–872.
76. Allen, C, Zaccaro, DJ, Palta, M, et al. Glycemic control in early IDDM. The Wisconsin diabetes registry. Diabetes Care. 1992;15(8):980–987.
77. Sizonenko, PC. Endocrinology in preadolescents and adolescents. I. Hormonal changes during normal puberty. Am J Dis Child. 1978;132(7):704–712.
78. Haffner, SM, Klein, R, Dunn, JF, et al. Increased testosterone in type I diabetic subjects with severe retinopathy. Ophthalmology. 1990;97(10):1270–1274.
79. Aiello, LP, Cahill, MT, Wong, JS. Systemic considerations in the management of diabetic retinopathy. Am J Ophthalmol. 2001;132:760–766.
80. West, KM, Erdreich, LJ, Stober, JA. A detailed study of risk factors for retinopathy and nephropathy in diabetes. Diabetes. 1980;29(7):501–508.
81. Sjolie, AK. Ocular complications in insulin treated diabetes mellitus. An epidemiological study. Acta Ophthalmol Suppl. 1985;172:1–77.
82. Klein, R, Klein, BE, Moss, SE, et al. The Beaver Dam eye study. Retinopathy in adults with newly discovered and previously diagnosed diabetes mellitus. Ophthalmology. 1992;99(1):58–62.
83. UK Prospective Diabetes Study 6: Complications in newly diagnosed type 2 diabetic patients and their association with different clinical and biochemical risk factors. Diabetes Res. 1990;13(1):1–11.
84. Guidelines for Eye Care in Patients With Diabetes Mellitus: Results of a symposium. The Kentucky Diabetic Retinopathy Group. Arch Intern Med. 1989;149(4):769–770.
85. Diabetic Retinopathy: American diabetes association. Diabetes Care. 1998;21(1):157–159.
86. Klein, R, Klein, BE, Moss, SE, et al. Glycosylated hemoglobin predicts the incidence and progression of diabetic retinopathy. JAMA. 1988;260(19):2864–2871.
87. Klein, R, Klein, BE, Moss, SE, et al. Relationship of hyperglycemia to the long-term incidence and progression of diabetic retinopathy. Arch Intern Med. 1994;154(19):2169–2178.
88. Chase, HP, Jackson, WE, Hoops, SL, et al. Glucose control and the renal and retinal complications of insulin-dependent diabetes. JAMA. 1989;261(8):1155–1160.
89. Kohner, EM. Diabetic retinopathy. Br Med Bull. 1989;45(1):148–173.
90. Knowler, WC, Bennett, PH, Ballintine, EJ. Increased incidence of retinopathy in diabetics with elevated blood pressure. A six-year follow-up study in Pima Indians. N Engl J Med. 1980;302(12):645–650.
91. Klein, R, Klein, BE, Moss, SE, et al. Is blood pressure a predictor of the incidence or progression of diabetic retinopathy? Arch Intern Med. 1989;149(11):2427–2432.
92. Klein, R, Klein, BE, Moss, SE, et al. The Wisconsin epidemiologic study of diabetic retinopathy: XVII. The 14-year incidence and progression of diabetic retinopathy and associated risk factors in type 1 diabetes. Ophthalmology. 1998;105(10):1801–1815.
93. Fuller, JH, Shipley, MJ, Rose, G, et al. Mortality from coronary heart disease and stroke in relation to degree of glycaemia: the Whitehall Study. Br Med J (Clin Res Ed). 1983;287(6396):867–870.
94. Jarrett, RJ, McCartney, P, Keen, H. The Bedford survey: ten year mortality rates in newly diagnosed diabetics, borderline diabetics and normoglycaemic controls and risk indices for coronary heart disease in borderline diabetics. Diabetologia. 1982;22(2):79–84.
95. Palumbo, PJ, Elveback, LR, Whisnant, JP. Neurologic complications of diabetes mellitus: transient ischemic attack, stroke, and peripheral neuropathy. Adv Neurol. 1978;19:593–601.
96. Asplund, K, Hagg, E, Helmers, C, et al. The natural history of stroke in diabetic patients. Acta Med Scand. 1980;207(5):417–424.
97. Mogensen, CE. Long-term antihypertensive treatment (over six years) inhibiting the progression of diabetic nephropathy. Acta Endocrinol Suppl (Copenh.). 1981;242:31–32.
98. Parving, HH, Andersen, AR, Hommel, E, et al. Effects of long-term antihypertensive treatment on kidney function in diabetic nephropathy. Hypertension. 1985;7(6 Pt 2):II114–II117.
99. Nielsen, NV. Diabetic retinopathy I. The course of retinopathy in insulin-treated diabetics. A one year epidemiological cohort study of diabetes mellitus. The Island of Falster, Denmark. Acta Ophthalmol (Copenh.). 1984;62(2):256–265.
100. Klein, BE, Moss, SE, Klein, R, et al. The Wisconsin epidemiologic study of diabetic retinopathy. XIII. relationship of serum cholesterol to retinopathy and hard exudate. Ophthalmology. 1991;98(8):1261–1265.
101. Chew, EY, Klein, ML, Ferris, FL, III., et al. Association of elevated serum lipid levels with retinal hard exudate in diabetic retinopathy. Early Treatment Diabetic Retinopathy Study (ETDRS) Report 22. Arch Ophthalmol. 1996;114(9):1079–1084.
102. Cullen, JF, Ireland, JT, Oliver, MF. A controlled trial of atromid therapy in exudative diabetic retinopathy. Trans Ophthalmol Soc UK. 1964;84:281–295.
103. Duncan, LJ, Cullen, JF, Ireland, JT, et al. A three-year trial of atromid therapy in exudative diabetic retinopathy. Diabetes. 1968;17(7):458–467.
104. Gerstein, HC, Miller, ME, Byington, RP, et al. Effects of intensive glucose lowering in type 2 diabetes. N Engl J Med. 2008;358(24):2545–2559.
105. Chew, EY, Ambrosius, WT, Howard, LT, et al. Rationale, design, and methods of the Action to Control Cardiovascular Risk in Diabetes Eye Study (ACCORD-EYE). Am J Cardiol. 2007;99(12A):103i–111i.
106. Borch-Johnsen, K, Kreiner, S. Proteinuria: Value as predictor of cardiovascular mortality in insulin dependent diabetes mellitus. Br Med J (Clin Res Ed). 1987;294(6588):1651–1654.
107. Winocour, PH, Durrington, PN, Ishola, M, et al. Influence of proteinuria on vascular disease, blood pressure, and lipoproteins in insulin dependent diabetes mellitus. Br Med J (Clin Res Ed). 1987;294(6588):1648–1651.
108. Klein, R, Klein, BE, Moss, SE. Epidemiology of proliferative diabetic retinopathy. Diabetes Care. 1992;15(12):1875–1891.
109. Klein, R, Klein, BE, Davis, MD. Is cigarette smoking associated with diabetic retinopathy? Am J Epidemiol. 1983;118(2):228–238.
110. Moss, SE, Klein, R, Klein, BE. Association of cigarette smoking with diabetic retinopathy. Diabetes Care. 1991;14(2):119–126.
111. The Health Consequences of Smoking: A report to the surgeon general. Washington, DC: U.S. Department of Health, Education and Welfare; 1971 (DHEW Publication No. [HSM] 71–7513).
112. Doyle, JT. Risk factors in arteriosclerosis and cardiovascular disease with special emphasis on cigarette smoking. Prev Med. 1979;8(3):264–270.
113. Kingsley, LA, Dorman, JS, Doft, BH, et al. An epidemiologic approach to the study of retinopathy: the Pittsburgh diabetic morbidity and retinopathy studies. Diabetes Res Clin Pract. 1988;4(2):99–109.
114. Young, RJ, McCulloch, DK, Prescott, RJ, et al. Alcohol: another risk factor for diabetic retinopathy? Br Med J (Clin Res Ed). 1984;288(6423):1035–1037.
115. Moss, SE, Klein, R, Klein, BE. Alcohol consumption and the prevalence of diabetic retinopathy. Ophthalmology. 1992;99(6):926–932.
116. Jakubowski, JA, Vaillancourt, R, Deykin, D. Interaction of ethanol, prostacyclin, and aspirin in determining human platelet reactivity in vitro. Arteriosclerosis. 1988;8(4):436–441.
117. Klein, BE, Moss, SE, Klein, R. Effect of pregnancy on progression of diabetic retinopathy. Diabetes Care. 1990;13(1):34–40.
118. Rodman, HM, Singerman, LJ, Aiello, LM, et al. Diabetic retinopathy and its relationship to pregnancy. In: Merkatz ER, Adams PAJ, eds. The diabetic pregnancy: a perinatal perspective. New York: Grune and Stratton, 1979.
119. Klein, BE, Klein, R, Meuer, SM, et al. Does the severity of diabetic retinopathy predict pregnancy outcome? J Diabet Complications. 1988;2(4):179–184.
120. Dornan, TL, Carter, RD, Bron, AJ, et al. Low-density lipoprotein cholesterol: an association with the severity of diabetic retinopathy. Diabetologia. 1982;22(3):167–170.
121. Miccoli, R, Odello, G, Giampietro, O, et al. Circulating lipid levels and severity of diabetic retinopathy in type I diabetes mellitus. Ophthalmic Res. 1987;19(1):52–56.
122. Ederer, F, Hiller, R, Taylor, HR. Senile lens changes and diabetes in two population studies. Am J Ophthalmol. 1981;91(3):381–395.
123. Klein, BE, Klein, R, Wang, Q, et al. Older-onset diabetes and lens opacities. The Beaver Dam Eye Study. Ophthalmic Epidemiol. 1995;2(1):49–55.
124. Klein, BE, Klein, R, Moss, SE. Prevalence of cataracts in a population-based study of persons with diabetes mellitus. Ophthalmology. 1985;92(9):1191–1196.
125. Klein, R, Klein, BE. Vision disorders. In: Harris MWH, et al, eds. Diabetes in America. 2nd ed. Bethesda, MD: NIH-NIDDK; 1995:293–338.
126. Kahn, HA, Leibowitz, HM, Ganley, JP, et al. The Framingham eye study. II. Association of ophthalmic pathology with single variables previously measured in the Framingham heart study. Am J Epidemiol. 1977;106(1):33–41.
127. Bengtsson, B. Aspects of the epidemiology of chronic glaucoma. Acta Ophthalmol Suppl. 1981;146:1–48.
128. Klein, BE, Klein, R, Jensen, SC. Open-angle glaucoma and older-onset diabetes. The Beaver Dam Eye Study. Ophthalmology. 1994;101(7):1173–1177.
129. Howie, LJ, Drury, TF. Current estimates from the health interview survey: United States—1977. Vital Health Stat. 1978;10(126):1–98.
130. Pasquale, LR, Kang, JH, Manson, JE, et al. Prospective study of type 2 diabetes mellitus and risk of primary open-angle glaucoma in women. Ophthalmology. 2006;113(7):1081–1086.
131. Klein, R, Klein, BE, Moss, SE. Visual impairment in diabetes. Ophthalmology. 1984;91(1):1–9.
132. Moss, SE, Klein, R, Klein, BE. The incidence of vision loss in a diabetic population. Ophthalmology. 1988;95(10):1340–1348.
133. Pugh, JA, Jacobson, JM, van Heuven, WA, et al. Screening for diabetic retinopathy. The Wide-Angle Retinal Camera. Diabetes Care. 1993;16(6):889–895.
134. Nathan, DM, Fogel, HA, Godine, JE, et al. Role of diabetologist in evaluating diabetic retinopathy. Diabetes Care. 1991;14(1):26–33.
135. Klein, R, Klein, BE, Neider, MW, et al. Diabetic retinopathy as detected using ophthalmoscopy, a nonmydriatic camera and a standard fundus camera. Ophthalmology. 1985;92(4):485–491.
136. Klein, R, Klein, BE, Moss, SE. The Wisconsin epidemiological study of diabetic retinopathy: a review. Diabetes Metab Rev. 1989;5(7):559–570.
137. Klein, R, Klein, BE, Moss, SE, et al. The Wisconsin epidemiologic study of diabetic retinopathy. VI. Retinal photocoagulation. Ophthalmology. 1987;94(7):747–753.
138. Klein, R, Moss, SE, Klein, BE, et al. The Wisconsin epidemiologic study of diabetic retinopathy: VIII. The incidence of retinal photocoagulation. J Diabet Complications. 1988;2(2):79–87.
139. Stross, JK, Harlan, WR. The dissemination of new medical information. JAMA. 1979;241(24):2622–2624.
140. Sprafka, JM, Fritsche, TL, Baker, R, et al. Prevalence of undiagnosed eye disease in high-risk diabetic individuals. Arch Intern Med. 1990;150(4):857–861.
141. Brechner, RJ, Cowie, CC, Howie, LJ, et al. Ophthalmic examination among adults with diagnosed diabetes mellitus. JAMA. 1993;270(14):1714–1718.
142. Payne, TH, Gabella, BA, Michael, SL, et al. Preventive care in diabetes mellitus. current practice in urban health-care system. Diabetes Care. 1989;12(10):745–747.
143. Newcomb, PA, Klein, R. Factors associated with compliance following diabetic eye screening. J Diabet Complications. 1990;4(1):8–14.
144. Moss, SE, Klein, R, Klein, BE. Factors associated with having eye examinations in persons with diabetes. Arch Fam Med. 1995;4(6):529–534.
145. Klein, R, Klein, BE, Moss, SE, et al. The validity of a survey question to study diabetic retinopathy. Am J Epidemiol. 1986;124(1):104–110.
146. Hess, RG, Lengyel, MC, Hess, GE, et al. Diabetes in communities. Ann Arbor: University of Michigan; 1986.
147. Javitt, JC, Aiello, LP. Cost-effectiveness of detecting and treating diabetic retinopathy. Ann Intern Med. 1996;124(1 Pt 2):164–169.
148. Javitt, JC, Canner, JK, Frank, RG, et al. Detecting and treating retinopathy in patients with type I diabetes mellitus. A health policy model. Ophthalmology. 1990;97(4):483–494.
149. Dasbach, EJ, Fryback, DG, Newcomb, PA, et al. Cost-effectiveness of strategies for detecting diabetic retinopathy. Med Care. 1991;29(1):20–39.
150. Fong, DS, Aiello, L, Gardner, TW, et al. Diabetic retinopathy. Diabetes Care. 2003;26(Suppl 1):S99–S102.
151. Preliminary Report on Effects of Photocoagulation Therapy: The diabetic retinopathy study research group. Am J Ophthalmol. 1976;81(4):383–396.
152. Photocoagulation Treatment of Proliferative Diabetic Retinopathy: the second report of diabetic retinopathy study findings. Ophthalmology. 1978;85(1):82–106.
153. Photocoagulation for Diabetic Macular Edema: Early treatment diabetic retinopathy study report No. 4. The early treatment diabetic retinopathy study research group. Int Ophthalmol Clin. 1987;27(4):265–272.
154. Ferris, F. Early photocoagulation in patients with either type I or type II diabetes. Trans Am Ophthalmol Soc. 1996;94:505–537.
155. Ferris, FL, III., Davis, MD, Aiello, LM. Treatment of diabetic retinopathy. N Engl J Med. 1999;341(9):667–678.
156. Sinzato, R, Fukino, O, Tamai, H, et al. Coping behaviors of severe diabetics. Psychother Psychosom. 1985;43(4):219–226.
157. Chew, E, Strauber, S, Beck, R, et al. Randomized trial of peribulbar triamcinolone acetonide with and without focal photocoagulation for mild diabetic macular edema: a pilot study. Ophthalmology. 2007;114(6):1190–1196.
158. Diabetic Retinopathy Clinical Research Network: A randomized trial comparing intravitreal triamcinolone acetonide and focal/grid photocoagulation for diabetic macular edema. Ophthalmology. 2008;115(9):1447–1449.
159. Bain, SC, Gill, GV, Dyer, PH, et al. Characteristics of type 1 diabetes of over 50 years duration (the golden years cohort). Diabet Med. 2003;20(10):808–811.
160. Keenan, HA, Costacou, T, Sun, JK, et al. Clinical factors associated with resistance to microvascular complications in diabetic patients of extreme disease duration: the 50-year medalist study. Diabetes Care. 2007;30(8):1995–1997.
161. Fong, DS, Strauber, SF, Aiello, LP, et al. Comparison of the modified early treatment diabetic retinopathy study and mild macular grid laser photocoagulation strategies for diabetic macular edema. Arch Ophthalmol. 2007;125(4):469–480.
162. Scott, IU, Edwards, AR, Beck, RW, et al. A phase II randomized clinical trial of intravitreal bevacizumab for diabetic macular edema. Ophthalmology. 2007;114(10):1860–1867.
163. Browning, DJ, Glassman, AR, Aiello, LP, et al. Relationship between optical coherence tomography-measured central retinal thickness and visual acuity in diabetic macular edema. Ophthalmology. 2007;114(3):525–536.
164. Krzystolik, MG, Strauber, SF, Aiello, LP, et al. Reproducibility of macular thickness and volume using Zeiss optical coherence tomography in patients with diabetic macular edema. Ophthalmology. 2007;114(8):1520–1525.
165. Danis, RP, Glassman, AR, Aiello, LP, et al. Diurnal variation in retinal thickening measurement by optical coherence tomography in center-involved diabetic macular edema. Arch Ophthalmol. 2006;124(12):1701–1707.
166. Bressler, NM, Edwards, AR, Antoszyk, AN, et al. Retinal thickness on stratus optical coherence tomography in people with diabetes and minimal or no diabetic retinopathy. Am J Ophthalmol. 2008;145(5):894–901.
167. Browning, DJ, Glassman, AR, Aiello, LP, et al. Optical coherence tomography measurements and analysis methods in optical coherence tomography studies of diabetic macular edema. Ophthalmology. 2008;115(8):1366–1371.