Diabetes Control, Long-Term Complications, and Large Vessel Disease
The historical documentation of type 1 diabetes includes at least 5000 years of testimony to its dramatic clinical onset with the apparent “melting of flesh into urine,” followed by starvation, inanition, and certain death.1 However, it wasn’t until the near miraculous cure of diabetes, with the introduction of insulin less than a century ago, that long-term complications began to be observed with any frequency.2 With longer survival of children and adolescents with what is now called type 1 diabetes, we began to see manifestations of diabetes that had never been seen before. Diabetic retinopathy and nephropathy were first described in the 1930s.3,4 Insulin therapy transformed type 1 diabetes from a disease that was generally fatal in the first 6 to 24 months of its appearance, to a chronic degenerative disorder with a host of long-term complications that affected the eye, kidney, nervous system, and heart.
The development of these complications, which ultimately affected most patients afflicted with type 1 diabetes, had a severe toll. By the time insulin had been in use for 50 years, diabetes had become a major cause of blindness, kidney failure, and amputations and a contributor to cardiovascular disease.5 With the epidemic of type 2 diabetes, diabetes had become by 1990 the greatest single cause of these disorders. It is not surprising that some early clinicians/investigators considered the pathogenesis of these complications to be iatrogenic, with insulin, directly or indirectly, causing the complications. Still others thought that the complications were co-inherited but independent from the metabolic perturbations of the disease. Finally, a small but vocal group insisted that the nonphysiologic control of glucose levels was the cause of long-term complications.6–9
Unfortunately, the passionate proponents of these theories had no proof to support or refute the hypotheses, and the theories remained open to often rancorous debate well into the 1970s. Beginning in the mid-1970s, a series of animal studies investigated what became known as the “glucose hypothesis” and demonstrated in animal models that glucose control was linked to the risk for developing diabetic eye and kidney disease.10–15 The subsequent development of a number of critical clinical research tools—including an objective means of measuring long-term glycemia (glycated hemoglobin [HbA1c] assay),16 glucose monitoring, insulin delivery algorithms, devices that could achieve near normal glycemia,17 and objective methods to assess the development and progression of complications—allowed the organization and implementation of clinical trials to examine the glucose hypothesis.18 In 1993, after almost 10 years of study, the most important of these trials, the Diabetes Control and Complications Trial (DCCT), provided definitive answers to the questions that had dominated the diabetes debate for longer than 60 years.19 The DCCT established the primacy of intensive therapy aimed at achieving near-normal glycemia to prevent and delay the specific long-term complications of diabetes mellitus. In doing so, the DCCT19 and other clinical trials in type 1 and type 2 diabetes have helped identify the pathogenesis of the long-term complications of diabetes.20–22 This chapter focuses on our understanding of the risk factors and, in particular, the role of glycemia in the pathogenesis of the long-term complications of diabetes mellitus.
Animal Studies
The animal models of diabetes and its complications are sufficiently different from human models of type 1 and type 2 diabetes and provide only suggestive evidence regarding the pathogenesis of diabetic complications. Nevertheless, they uniformly support the role of therapies that normalize blood glucose levels to prevent and/or delay the progression of retinopathy, nephropathy, and neuropathy. Three major animal models have been studied. In one model, animals with chemically induced (alloxan or streptozotocin) diabetes are treated with insulin with the goal of achieving tight or loose control of blood glucose levels.10,11 In another model, pancreatectomized animals are treated with pancreatic or isolated islet cell replacement.12,13 Finally, animals with genetic diabetes (with models of autoimmune diabetes such as the NOD mouse or BB rat, or with models of type 2 diabetes) and various degrees of glycemia have been studied.14,15 Most studies have demonstrated primary prevention of complications with intensive therapy aimed at maintaining glucose levels close to the physiologic range. Secondary intervention studies, that is, prevention of progress of established complications, have been much less common.
The most convincing animal studies were done by Engerman and colleagues with alloxan-induced diabetes in dogs.10,11 The diabetic dogs developed retinopathy with microaneurysms and pericyte loss similar to those seen in diabetic humans. Therapy with two daily injections of NPH insulin with the goal of aglycosuria (“good control”) was initiated soon after the dogs were made diabetic.10 Good control was shown to be associated with fewer microaneurysms than occurred with one daily injection of NPH insulin (“poor control”) over a 5-year period. A later study demonstrated that if dogs with alloxan-induced diabetes were treated with the poor-control regimen for 2.5 years, followed by the good-control regimen for 2.5 years, they developed an intermediate number of microaneurysms.11 This prescient study suggested that secondary intervention was not as effective as primary prevention, and it forecast the results of human studies that would follow almost 10 years later. Of note, severe hypoglycemia resulted in the deaths of several dogs in “good control.”
Although glomerular lesions in several animal models of diabetes are similar to those seen in diabetic nephropathy in humans, the time course of the development of the lesions is difficult to compare with that seen in human diabetes. In addition, animal models of renal disease have several limitations. First, diabetic rats develop a renal lesion (mesangial expansion) that differs from the early lesion of human nephropathy (glomerular basement membrane expansion) and do not develop end-stage renal failure. Second, other potentially important variables that might predict or influence development of nephropathy in humans (e.g., hypertension) cannot be easily studied in animal models. Third, rats in which transplants of pancreatic islet cells do not succeed in correcting glucose levels also show improvement in renal results.12 As with retinopathy, studies of nephropathy in animal models can lend support to, but cannot prove, the glucose hypothesis.
Studies in animal models appear to demonstrate that nephropathy can be prevented or even reversed when diabetic animals are treated with pancreatic transplantation or with intensive insulin therapy. Rats with streptozotocin-induced diabetes develop mesangial thickening with immunoglobulin deposition within 6 to 9 months of diabetes onset.12 Successful islet transplantation prevented the development of such lesions or led to stabilization and some improvement in established lesions concurrent with normalization of glucose levels.12 Studies in other animal models such as the BB/W spontaneously diabetic rat15 and the uninephrectomized, alloxan-treated dog23 support the role of glucose control in the genesis of nephropathy.
Animal models of diabetic neuropathy are also limited; however, the ability to measure nerve conduction and to perform nerve biopsies may compensate for difficulty in determining specific sensory and motor deficits. Studies of glycemic control and neuropathy have also supported the glucose hypothesis.24
Human Studies
Retinopathy
Human studies conducted before 1964 were hampered by the absence of quantitative methods to evaluate long-term glucose control and complications and by a poor appreciation of clinical trial methods.25 Beginning in the 1970s, nondilated ophthalmoscopy gave way to seven-field stereoscopic fundus photography and fluorescein angiography, and sporadic blood glucose measurements and semiquantitative measures of glycosuria were supplanted by assays for glycated hemoglobin (HbA1 or HbA1c).18
Although lacking in these modern innovations, the longitudinal study of Pirart deserves mention, if only for its magnitude.26 Pirart followed 4398 patients with diabetes for as long as 25 years, although relatively few were followed for longer than 15 years. He noted that retinopathy, nephropathy, and neuropathy were more common in patients with a higher glycemic index, a value derived from intermittent measurements of blood and urine glucose levels and other factors. The high attrition rate over time, the lack of objective measures of complications and glycemia, and the possibility that complications would lead to worsened glucose control, rather than vice versa, detract from this study.
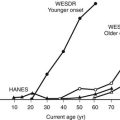
In the modern era, the population-based, observational Wisconsin Epidemiologic Study of Diabetic Retinopathy (WESDR) examined Wisconsin residents with diabetes using glycated hemoglobin measurements and seven-field stereoscopic fundus photography.27–29 Follow-up over 4 years revealed a striking association between the level of glycated hemoglobin at baseline and the incidence of any retinopathy, progression of retinopathy, or progression to proliferative retinopathy,27 macular edema,28 and vision loss.29 The relationship between levels of glycated hemoglobin and retinopathy was continuous; no threshold for glycated hemoglobin with regard to risk for retinopathy was noted. Associations among glycemia and diabetic complications remained after controlling for duration of diabetes, age, and baseline retinopathy. Other observational studies have confirmed the association of glycemia with retinopathy in selected type 1 diabetic populations30–33 and have suggested that higher glycemic levels are a risk factor for the development of proliferative retinopathy.31,33,34
Although WESDR subjects were not strictly categorized as having type 1 or type 2 diabetes, the separation by age at onset (<30 years vs. ≥30 years) effectively provided type 1 and type 2 populations. WESDR35 and other studies36 have demonstrated an association between retinopathy and glycemia in type 2 diabetes, similar to that seen in type 1 diabetes (Fig. 25-1). Other risk factors for diabetic retinopathy, in addition to the level of glycemia, include hypertension,37 pregnancy,38 hyperlipidemia,39 and a family history of diabetic retinopathy,40,41 but not smoking.42 Despite the familial clustering of retinopathy and the severity of retinopathy, candidate gene and genome-wide association–directed studies have not identified any dominant genetic mediators of retinopathy or retinopathy progression.
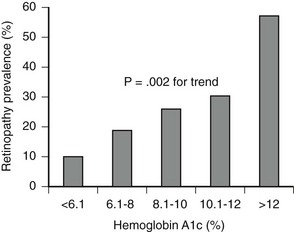
FIGURE 25-1 Association between mean glucose level as measured by level of glycated hemoglobin (HbA1c) and presence of retinopathy in older patients (55 to 75 years) with type 2 diabetes (n = 185). (From Nathan DM, Singer DE, Godine JE, et al: Retinopathy in older Type II diabetics: association with glucose control. Diabetes 35:797–801, 1986.)
Nephropathy
The natural history of diabetic nephropathy, although duration dependent, extends over many more years than retinopathy before clinical expression becomes evident.43,44 A minimum of 12 years, and more often 15 to 18 years, of type 1 diabetes is required before the development of clinical-grade (dipstick positive, i.e., ≥500 mg/24 hours) proteinuria, the first incontrovertible sign of end-stage renal disease. After the development of clinical-grade proteinuria, creatinine clearance declines over 5 to 10 years, terminating in end-stage renal disease.45
The reluctance to perform kidney biopsies early in the course of diabetes for documentation of microscopic changes in the glomerulus and the less than perfect correlation between microscopic changes and clinical course have led to reliance on surrogate markers of evolving nephropathy. “Incipient” nephropathy, as demonstrated by microalbuminuria (generally >20 mg to 30 mg, and <300 mg, of urinary albumin per 24 hours, or >30 µg per mg creatinine in a spot urine test), has been identified as a predictor or marker for the development of end-stage renal disease in retrospective studies of type 146–49 and type 2 diabetes.50 Unfortunately, microalbuminuria can vary considerably in individuals over time, with levels fluctuating from abnormal to normal values. Therefore, abnormal urinary albumin excretion, as defined above, in at least two of three urine collections within a 6-month period has been suggested as a definition of “persistent” microalbuminuria.51 Although the presence of or changes in microalbuminuria have been used as renal end points in many observational studies and clinical trials, a recent study has demonstrated that microalbuminuria may revert to normoalbuminuria more commonly than was previously appreciated, even in the absence of specific interventions.52
For several reasons, investigators have suspected that the association between glucose control and nephropathy may be more complex than that observed with retinopathy. The occurrence of nephropathy in no more than 40% of patients with type 1 diabetes and 25% of patients with type 2 diabetes suggests that variables other than glycemia are operant. Hypertension and family history of hypertension are mediators of nephropathy.53,54 In addition, candidate and genome-wide approaches have identified genetic risk factors for diabetic nephropathy.55,56
The association between levels of glycemia and nephropathy has been more difficult to establish than for retinopathy. Potential reasons for the difficulty in establishing a relationship between glycemia and nephropathy include the following: (1) the development of renal failure may influence glycemic control (e.g., alterations in sensitivity to insulin with development of hypertension and effects of antihypertensive medications on glycemia); (2) uremia, anemia, and transfusions may interfere with, or influence, the accuracy of measurements of glycated hemoglobin; and (3) given the long duration of diabetes before the development of renal failure, infrequent measurements of glycated hemoglobin, representing a relatively brief period of exposure, may not be predictive of the development of nephropathy. Even with these potential problems, studies have demonstrated an association between the derived glycemic index and an increase in creatinine level over time,26 or between mean levels of glycated hemoglobin, measured over 7 years, and risk of microalbuminuria in type 1 diabetes.57
Neuropathy
Quantitative electrophysiologic measures of nerve conduction have been available for more than 40 years and should have contributed to the examination of the association between glycemia and neuropathy. Unfortunately, the complex relationship between neurophysiologic studies and symptomatic clinical diabetic neuropathy has complicated the study of glucose control and neuropathy. For example, the early observation that insulin treatment of new-onset type 1 diabetes reversed slowed motor nerve conduction within 6 weeks in asymptomatic patients supported an acute effect of hyperglycemia on nerve conduction and cast doubt on the role of electrophysiologic testing.58 The absence of histologic data from peripheral nerve biopsies has been a major impediment to our understanding of diabetic neuropathy. A modest association between glycemia and motor and sensory nerve conduction has been documented in type 159 and type 260 diabetes.
Cardiovascular Disease
Cardiovascular disease (CVD), including atherosclerosis-based coronary artery, cerebrovascular, and peripheral artery disease resulting in myocardial infarctions, stroke, and foot ulcers that may require amputations, is a less specific consequence of diabetes than are the microvascular and neuropathic complications already discussed. Nevertheless, the risk for CVD is increased by twofold to fivefold in diabetic versus nondiabetic men, and by even more in diabetic versus nondiabetic women.61,62 The relatively greater impact of diabetes on CVD in women than in men may be due to the relatively greater impact of diabetes on CVD risk factors in women than in men.63,64 Both type 1 and type 2 diabetes are associated with increased risk for CVD, with the former imposing a greater relative risk than the latter. The absolute risk for CVD is far greater in persons with type 2 than type 1 diabetes, owing to their greater age and higher coincidence of other CVD risk factors, including hypertension, dyslipidemia (typically a high level of triglycerides and low high-density lipoprotein [HDL]-cholesterol level), and obesity. Autonomic neuropathy and especially diabetic nephropathy increase the risk for CVD in all persons with diabetes. 65
Interventional-Clinical Trials
At best, observational studies can only indicate associations between glycemic control (and other confounders) and complications. The implementation of randomized, controlled clinical trials has facilitated our understanding of cause and effect in the pathogenesis of diabetic complications. Treatments designed to achieve near-normal glucose control (“intensive therapy”) were compared with conventional therapies, and their differential effects on the development and progression of complications were studied. In type 1 diabetes, intensive treatment regimens took advantage of the introduction and refinement of methods for self-monitoring of blood glucose levels and of improved methods of physiologic replacement of insulin, such as continuous subcutaneous insulin infusion (CSII) with pumps and multiple daily injection (MDI) regimens.17 Four well-designed randomized studies,21,66–68 set the stage for the larger and more comprehensive DCCT.19,69 All of these preliminary trials were secondary intervention studies that included only subjects with retinal lesions at baseline and a relatively long mean duration of diabetes. The duration of these trials ranged from 8 to 60 months, and included 30 to 100 subjects. (By contrast, the DCCT studied 1441 subjects with a mean follow-up of 6.5 years.) The total number of patient-years of study was less than 800 in the four previous secondary intervention trials combined. (The total number of patient-years for the secondary intervention component of the DCCT was almost 5000 at study end in 1993.) Except for the Oslo study,68 which included two intensive treatment groups, the studies compared type 1 diabetic patients randomly assigned to conventional treatment versus patients randomly assigned to CSII66,67 or MDI.21 The results of the Kroc,66 Steno,67,70 and Oslo,68,71 studies were similar with regard to retinopathy. In the first 6 to 12 months, a transient worsening of retinopathy occurred among patients receiving intensive treatment. Of the early trials, only the Stockholm Diabetes Study demonstrated a beneficial effect of intensive therapy over time.21
Diabetes Control and Complications Trial: In 1993, the DCCT ended the 60-year debate regarding the relationship between metabolic control and long-term complications. DCCT investigators reported consistent, unequivocal salutary effects of intensive diabetes management on the development and progression of the microvascular and neurologic complications of type 1 diabetes mellitus.19
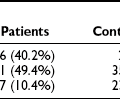
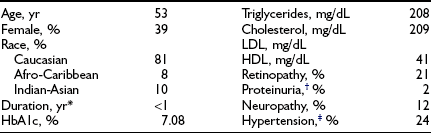
Design.: The DCCT, initiated in 1983, was designed to answer definitively whether intensive diabetes management would affect the development and/or progression of long-term complications in type 1 diabetes, and at what cost.69 The DCCT addressed primary prevention and secondary intervention of chronic complications by including two parallel studies. The primary prevention study determined whether intensive therapy aimed at achieving glycemic levels as close to the nondiabetic range as possible would prevent the development or slow the progression of complications in type 1 diabetic patients aged 13 to 39 with 1 to 5 years of diabetes duration and no evidence of retinopathy or nephropathy. The secondary intervention study determined whether intensive therapy would prevent the progression of complications in type 1 diabetic patients with 1 to 15 years of diabetes duration and at least one microaneurysm but no more than moderate nonproliferative retinopathy. They could have as much as 200 mg of albumin excretion per 24 hours (although only a small fraction had this level of albuminuria at baseline). The baseline characteristics of the two study cohorts are shown in Table 25-1. Study patients also were selected based on an assessment that they would accept random assignment of therapy, and that they were likely to continue to participate in a long-term study. On average, these patients were probably more motivated than the usual patient with type 1 diabetes. The DCCT also examined the costs, both financial and adverse events, associated with intensive compared with conventional therapy.
Table 25-1
Baseline Characteristics of DCCT Cohort
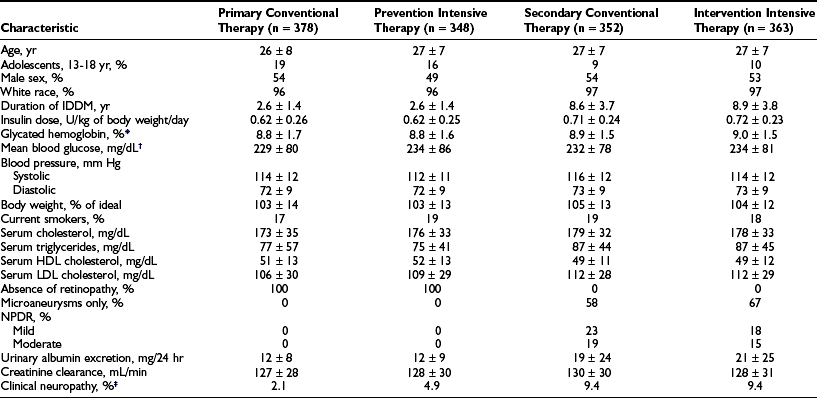
*HbA1c: nondiabetic range, 4% to 6.05%.
†Based on seven time-point capillary blood samples, before and 2 hours after each meal and before bed.
‡The presence of “confirmed” clinical neuropathy was based on a history or physical examination consistent with somatosensory distal neuropathy plus either abnormal electrophysiologic testing (nerve condition studies) or abnormal autonomic testing results.
From DCCT Research Group. The effect of intensive treatment of diabetes on the development and progression of long-term complications in insulin-dependent diabetes mellitus. N Engl J Med 329:977–986, 1993.
Intensive Treatment and Metabolic Goals.: Primary Prevention and Secondary Intervention cohorts were randomly assigned to conventional therapy (designed to mimic the usual diabetes therapy at that time with one or two daily injections of insulin and daily glucose monitoring) or to intensive therapy (designed to normalize blood glucose control). Conventional therapy had the clinical goals of avoiding any symptoms of hyperglycemia or hypoglycemia, but no specific numeric blood glucose targets. Intensive therapy had the goal of achieving blood glucose control as close to the nondiabetic range as possible, including pre-meal blood glucose levels between 70 and 120 mg/dL (3.9 to 6.7 mMol/L), peak postprandial levels less than 180 mg/dL (10 mMol/L), and hemoglobin HbA1c levels in the nondiabetic range (<6.05%). In order to reach these goals, patients assigned to intensive therapy used three or more insulin injections per day or insulin pump therapy, guided by frequent self-monitoring of blood glucose levels and adjusted based on meal size, composition, and exercise. (See Table 25-2 for a description of the intensive regimen.)
Table 25-2
Diabetes Control and Complications Trial Intensive Therapy
Self-Monitoring of Blood Glucose
Glycated Hemoglobin
HbA1c every 3 months measured centrally with HPLC assay (nondiabetic range, 4% to 6.05%)
Insulin
3 or more injections per day or CSII with external pump
Doses adjusted based on ambient glucose (SMBG), meal size and content, and anticipated exercise
Supervision
Results.: Detailed results of intensive compared with conventional therapy in the DCCT have been reported extensively.19,72–90 The initial report19 summarized the major results, whereas subsequent reports presented expanded analyses of the effects of intensive therapy on long-term complications, including retinopathy,72–74 nephropathy,75 neuropathy,76–78 and macrovascular disease and its risk factors79; the effects of intensive therapy on quality of life,80 neurobehavioral outcome,81 and residual insulin secretion82; the implementation83 and adverse effects of intensive therapy84,85; the cost-benefit analysis of intensive therapy compared with conventional therapy86; the results of intensive therapy on pregnancy87; and the association among glycemia, long-term complications, and other risk factors.88–90 A long-term follow-up study of the DCCT cohort, the Epidemiology of Diabetes Interventions and Complications (EDIC) study, is in its 15th year, as of 2008, and is providing further insight into the long-term consequences of intensive therapy.91–98
Adherence and Metabolic Results.: Over the 6.5-year mean follow-up time of the DCCT (range, 3 to 9 years), compliance was excellent, with more than 99% of the cohort completing the trial.19 In addition, virtually no crossover between assigned treatments was noted. Subjects adhered to their assigned treatment for more than 97% of study time. Intensive therapy decreased HbA1c to a nadir of approximately 6.9% by 6 months and maintained mean HbA1c levels during the remainder of the trial that were approximately 2% lower than with conventional treatment (7% vs. 9%) (Fig. 25-2). Of note, intensive therapy did not consistently normalize HbA1c, achieving levels that were, on average, four standard deviations above the nondiabetic mean. Lower glycemia achieved with intensive therapy was accompanied by a threefold increase in hypoglycemia.85
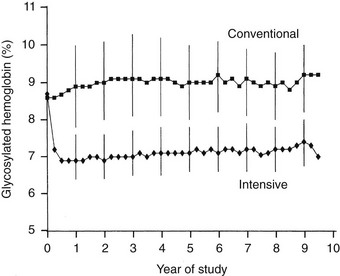
FIGURE 25-2 Hemoglobin A1c results during the Diabetes Control and Complications Trial (DCCT). Medians of all quarterly measurements with the 25th and 75th percentiles of the yearly values (vertical lines) are shown. The differences between treatment groups became significant by 3 months and remained significantly different over the course of the study (P < .001). (From DCCT Research Group: The effect of intensive treatment of diabetes on the development and progression of long-term complications in insulin-dependent diabetes mellitus. N Engl J Med 329:977–986, 1993.)
Retinopathy
Retinopathy was evaluated every 6 months by seven-field stereoscopic fundus photography, which was graded in a central reading unit. The principal outcome in the primary prevention study was the development of a sustained (seen on two consecutive exams) three-step or greater progression on a retinopathy severity scale adopted from the Early Treatment of Diabetic Retinopathy Study (ETDRS).99 Similarly, the principal outcome in the secondary intervention study was a sustained progression of three or more steps from the baseline level. Intensive therapy reduced the development of these end points by 76% in the Primary Prevention study and by 54% in the Secondary Intervention study compared with conventional therapy (Fig. 25-3). Other retinopathy outcomes and the effects of intensive therapy are shown in Table 25-3.
Table 25-3
Diabetes Control and Complications Trial (DCCT) and Epidemiology of Diabetes Interventions and Complications (EDIC) Results
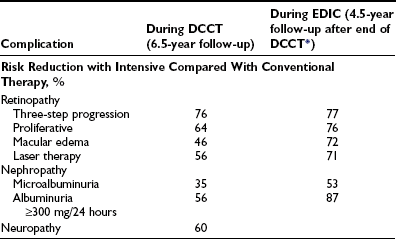
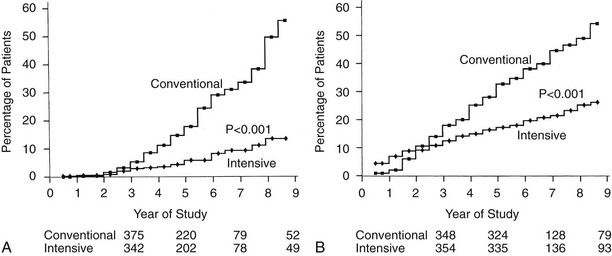
FIGURE 25-3 Cumulative incidence of Diabetes Control and Complications Trial primary retinopathy outcomes (three-step change in retinopathy from baseline value, sustained for at least 6 months) measured by fundus photography, comparing intensive and conventional therapy groups. A, Primary prevention cohort: intensive therapy reduced the cumulative incidence by 76% (P < .001). B, Secondary intervention cohort: intensive therapy reduced the cumulative incidence by 54% (P < .001). (From DCCT Research Group: The effect of intensive treatment of diabetes on the development and progression of long-term complications in insulin-dependent diabetes mellitus. N Engl J Med 329:977–986, 1993.)
The overall effect of intensive therapy was to decrease all stages of retinopathy included in the DCCT. The benefits were similar in almost all subgroups of patients defined by age, gender, and other baseline characteristics. However, intensive therapy was relatively more effective when initiated early in the course of diabetes (shorter vs. longer duration) and when retinopathy was less severe at baseline.19,72,73 Although intensive therapy reduced the risk somewhat less for more advanced stages of retinopathy than for earlier stages, patients with more advanced retinopathy still benefited from intensive therapy. The beneficial effects of intensive therapy were not seen for the first 3 years of therapy, presumably because of the natural “momentum” of diabetic complications. In addition, intensive therapy was associated with a transient worsening of retinopathy during the first 1 to 2 years of therapy.74 Both of these factors delayed the beneficial effects of intensive therapy in the Secondary Intervention cohort.
The EDIC follow-up has shown further improvement in retinal status in the previous intensive treatment group compared with the previous conventional treatment group (see Table 25-3). The differences in retinal outcomes between the two treatment groups persisted, and even expanded, 4.5 years after DCCT end, even though the vast majority of the previous conventional treatment cohort had changed to intensive therapy and mean HbA1c levels had drifted closer between the two treatment groups.92 The persistent benefit of 6.5 years of DCCT intensive therapy compared with conventional therapy for as long as 10 years after the end of the DCCT,92–94 during which glycemia had become similar between the original treatment groups, led to the concept of “metabolic memory.” Metabolic memory refers to the durable, imprinting effect of previous glycemic control on diabetic complications. It has been demonstrated for retinopathy, nephropathy, and neuropathy.92–94,97,98 Although the mechanism of this phenomenon remains unknown, long-lived glycated proteins may explain how previous glycemia can continue to have effects on microvascular complications.100
The study of families of DCCT volunteers that included more than one person with diabetes has revealed clustering of retinopathy within families.101 The tendency for some families with diabetes to develop retinopathy, while other families do not, most likely is mediated by genetic factors, although some as yet to be identified shared environmental factor could theoretically also play a role. Intensive therapy decreased the development and progression of retinopathy in DCCT volunteers who were members of “high-risk” families, as well as in DCCT volunteers in “low-risk” families.
Nephropathy
Nephropathy was routinely assessed by standardized measurements of albumin excretion and creatinine clearance, based on an annual 4-hour collection. The primary analytic end points for nephropathy are shown in Table 25-3 and Fig. 25-4. As with retinopathy, the risk for progression of nephropathy was reduced by intensive therapy. This included reduction in the development of microalbuminuria (>40 mg/24 hours) and clinical grade albuminuria (>300 mg/24 hours). The small number of patients who developed clinical nephropathy, defined as a creatinine clearance <70 mL/min/1.732 with albumin excretion >300 mg/24 hours, precluded a statistically valid analysis of any difference between treatment groups. However, the number of conventional treatment patients who developed this level of renal dysfunction (n = 5) was more than twice the number of intensive treatment patients (n = 2). The relatively small number of secondary intervention patients who had microalbuminuria at baseline (n = 70) made it difficult to demonstrate a benefit of intensive therapy with regard to slowing progression to clinical grade albuminuria once microalbuminuria had occurred.75 The long-term EDIC follow-up of the DCCT cohort has reinforced the role of intensive therapy in delaying and perhaps preventing diabetic nephropathy83 (see Table 25-3). “Metabolic memory” applies to nephropathy as it does to retinopathy. The widening difference in renal outcomes between the original intensive and conventional treatment groups, as long as 8 years after the end of the DCCT, has further established the benefits of early intervention in preventing nephropathy.92,93
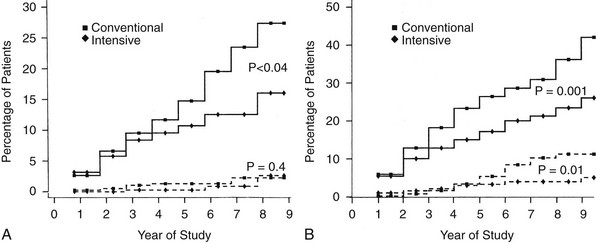
FIGURE 25-4 Cumulative incidence of renal end points in Diabetes Control and Complications Trial, comparing intensive and conventionally treated groups. Albumin excretion rate >40 mg/24 hours is shown with the solid line, and >300 mg/24 hours with the dashed line. A, Primary prevention cohort: intensive therapy reduced the mean risk for developing microalbuminuria (>40 mg/24 hours) by 34% (P < .04). B, Secondary intervention cohort: intensive therapy reduced the mean risk for developing microalbuminuria by 43% (P = .001) and the risk for clinical albuminuria (>300 mg/24 hours) by 56% (P = .01). (From DCCT Research Group: The effect of intensive treatment of diabetes on the development and progression of long-term complications in insulin-dependent diabetes mellitus. N Engl J Med 329:977–986, 1993.)
Neuropathy
Confirmed clinical neuropathy was defined as the presence of signs or symptoms of peripheral neuropathy, plus either abnormal nerve conduction in at least two peripheral nerves or unequivocally abnormal autonomic nerve testing. Intensive therapy reduced the risk for developing clinical neuropathy by 60% in the combined cohorts (see Table 25-3).19,76 In addition to the decreased development of confirmed clinical neuropathy, the most stringent of the neurologic outcomes, intensive therapy reduced the risk for deterioration of nerve function, as measured by electrophysiologic methods, which occurred with conventional therapy.78 The decline in autonomic nerve function, assessed with measures of cardiovascular autonomic function, which occurred with conventional therapy, was significantly reduced with intensive therapy in the Primary Prevention but not in the Secondary Intervention cohort.76,77 No significant differences were noted between treatment groups in clinical events secondary to autonomic neuropathy, but the frequency of events was very low in both groups. Metabolic memory also applies to neuropathy.98
Association of Glycemia and Microvascular Complications.: Frequent measurements of HbA1c with standardized methods during the DCCT provided the opportunity to examine the relationship between glycemia and diabetes-specific complications.89,90 Although these analyses were secondary and were not directly related to the intention-to-treat design of the study, they probably provide the most extensive and convincing data regarding the relationship between control and complications in human diabetes. The mathematical modeling of long-term glycemia and complications revealed a continuous relationship between glycemia and retinopathy and nephropathy, with no apparent threshold or breakpoint in the range of diabetic glycemia (Fig. 25-5). The analyses demonstrate a continuous benefit of lowering HbA1c, even into the near nondiabetic range. Every 10% decrease in HbA1c, for example, from 10% to 9% or 9% to 8.1%, is associated with a 43% reduction in risk for developing retinopathy.89 Although the absolute rate of retinopathy decreases in the lower HbA1c range, the relative risk reduction associated with lower HbA1c persists. A similar continuous risk relationship exists for glycemia and nephropathy.
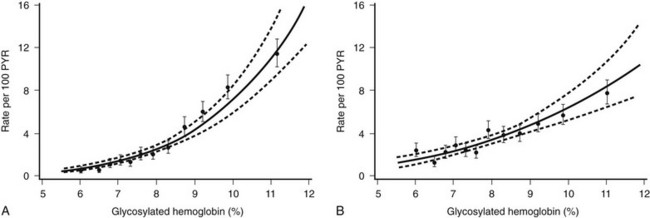
FIGURE 25-5 Relationship between updated mean glycated hemoglobin (HbA1c) levels and complications in the Diabetes Control and Complications Trial, with examination of combined treatment groups with Poisson regression models (95% confidence bands shown with dashed lines). The relationship between mean HbA1c and complications is continuous over the entire range of HbA1c levels, with no inflection or break point at levels of HbA1c above the nondiabetic range. A, Risk for sustained (for at least 6 months) retinopathy progression measured as rate per 100 patient-years. B, Risk for developing microalbuminuria (rate per 100 patient-years). (From DCCT Research Group. The absence of a glycemic threshold for the development of long-term complications: the perspective of the Diabetes Control and Complications Trial. Diabetes 45:1289–1298, 1996.)
Macrovascular.: Although the risk for major macrovascular outcomes (death from cardiovascular disease, myocardial infarction, and major peripheral vascular events) was reduced by 41% with intensive therapy, the numbers and rates of events during the DCCT were very small, and the difference between treatment groups failed to achieve statistical significance (P = .06).79 However, several risk factors for cardiovascular disease, including a 34% reduction in low-density lipoprotein cholesterol (P = .02), were improved with intensive therapy. Further study during EDIC has demonstrated a significant reduction in progression of carotid intima-media thickness (IMT), measured with carotid ultrasonography.95 Moreover, coronary artery calcification, a biomarker for coronary artery plaques, was less in the former intensive than in the former conventional treatment group.102 It is most important to note that after a total follow-up of 18 years, the cumulative incidence of serious cardiovascular outcomes (fatal and nonfatal myocardial infarctions and stroke) was reduced by 57% in the original intensive compared with the conventional treatment group.96 The benefit of intensive therapy was associated with lower HbA1c levels, and although the reduction in cardiovascular disease was in part attributable to the reduction in nephropathy, the majority of the benefit remained, even after adjustments were made for differences in nephropathy between the treatment groups.
Other Outcomes and Adverse Events.: Intensive therapy was accompanied by a threefold increase in severe hypoglycemia, defined as an episode that required assistance to treat.19,85 Although most of these episodes were clinically benign, the incidence of hypoglycemia resulting in coma and seizures or requiring emergency room treatment also increased by approximately two- to threefold. The more severe hypoglycemic reactions, such as those resulting in seizure or coma, were relatively rare (16 vs. 5 episodes per 100 patient-years in the intensive and conventional treatment groups, respectively). Other adverse events that accompanied intensive therapy included an increased risk for weight gain and catheter-related infection in patients using insulin pumps.84 Taken together, none of these adverse events caused significant morbidity or mortality. No patient deaths or macrovascular events were ascribed to hypoglycemia. Moreover, the increased frequency of hypoglycemia had no adverse effects on neurocognitive function as judged by frequent testing in both treatment groups.81 Repeat evaluation of neurocognitive function during EDIC, after a total of 18 years from DCCT baseline, showed no detrimental effects of intensive therapy.97 Finally, despite the demands of intensive therapy, quality of life, measured yearly by self-report, did not differ between the two treatment groups.80
Although the DCCT has the largest and longest duration of experience with multiple daily injection and insulin pump therapy regimens, assignment to those therapies within the intensive treatment group was not random and precluded a scientifically reliable comparison of the methods. (The intensive treatment subjects and their treatment teams could choose the therapy that suited them best and could change between intensive therapy methods during the course of the study.) However, from a purely descriptive point of view, the following was observed: Patients treated with pump therapy achieved slightly lower mean HbA1c levels (≈0.3%), but at a cost of increased frequency of coma and seizure, diabetic ketoacidosis, and catheter complications.83,84
Type 2 Diabetes
The lessons from the DCCT were quickly translated to apply to type 2 diabetes, despite concern regarding the large differences between type 1 and type 2 diabetes in pathogenesis, clinical course, and available therapies with different adverse event profiles.103 At the time that the DCCT results were published, the only clinical trial that had examined the impact of glycemic control on long-term complications in type 2 diabetes was the University Group Diabetes Program (UGDP).104 This 12-center trial compared the effects of five different treatment modalities (diet, diet plus tolbutamide, diet plus phenformin, diet plus standard insulin dose, and diet plus variable-dose insulin) on long-term outcome in patients with newly diagnosed type 2 diabetes. Many of the critical tools that had been incorporated into the DCCT, such as objective, reliable measures of long-term glycemia and of diabetic complications, were not available during the UGDP. Moreover, the study was probably underpowered with regard to its major outcomes.
United Kingdom Prospective Diabetes Study and Kumamoto Study: The United Kingdom Prospective Diabetes Study (UKPDS),20,105 which was planned and initiated in 1977 and ended in 1997, and the much smaller but impressive Kumamoto study22 provided more definitive answers regarding control and complications in type 2 diabetes. These two studies helped to erase some of the confusion left in the wake of the UGDP.
The Kumamoto controlled clinical trial in Japanese type 2 diabetic patients was patterned on the DCCT, with all subjects treated with insulin.22 The groups randomly assigned to intensive therapy (multiple daily insulin injections) and conventional therapy (one or two daily injections of intermediate-acting insulin) achieved mean HbA1c levels comparable with those in the DCCT groups, that is, approximately 7.1% and 9.4%, respectively, during the 6 years of study follow-up. The intensive treatment group had a relative reduction in retinopathy and nephropathy that paralleled the DCCT results. However, the Kumamoto study was not considered to be definitive, owing in part to the clear differences between type 2 diabetes in the Japanese subjects (all relatively thin with small insulin requirements ≈0.2 U/kg) compared with type 2 diabetes in non-Asian societies (generally obese and >0.75 U/kg).
The UKPDS was designed to answer two questions. First, is an “intensive strategy” aimed at achieving fasting glucose levels less than 6 mmol (108 mg/dL) superior to conventional therapy with diet in preventing the complications of diabetes in patients with relatively recent-onset type 2 diabetes? Second, are any therapies particularly advantageous with regard to preventing or delaying diabetic complications? The volunteers were new-onset (within 1 year of diagnosis) type 2 diabetic patients (Table 25-4). The outcomes were aggregated into diabetes-specific complications (combining retinopathy, nephropathy, cataracts, and cardiovascular outcomes), all-cause mortality, and diabetes-related mortality. The study design included stepwise addition of therapies in the conventional and intensive treatment groups if glucose goals were not met. In addition, the intensive therapies were numerous and included three types of sulfonylureas and insulin. The obese subset of patients was randomly assigned to metformin.105
The results of the UKPDS revealed that metabolic control in type 2 diabetes worsened over time, probably owing to waning β cell function and requiring the addition of alternative therapies to the originally assigned therapy (Fig. 25-6). As a result, most of the conventional treatment subjects had one or more of the intensive therapies added, and a substantial fraction (often >20%) of the intensive treatment subjects had the alternative intensive therapies added to or substituted for their originally assigned intensive therapy over the course of the study. This design feature, intended to keep glycemia as low as possible in the intensive treatment group, severely undercut the ability to compare the specific intensive therapy modalities.106 Finally, other randomized interventions (early addition of metformin to sulfonylurea therapy, use of acarbose, and intensive vs. conventional hypertension treatment) made the UKPDS protocol extremely complex and difficult to understand.
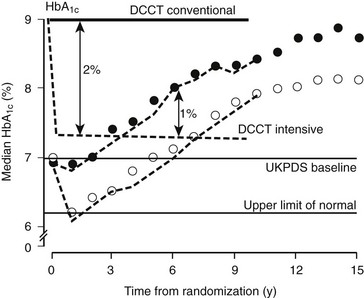
FIGURE 25-6 Glycated hemoglobin (HbA1c) levels achieved in the United Kingdom Prospective Diabetes Study in the Conventional (dietary) policy group (closed circles) and the Intensive policy group (sulfonylureas or insulin) (open circles) in the nonobese cohort, by intention to treat. The separation of HbA1c in the DCCT is shown for Conventional (solid line) and Intensive (dashed line). (From UKPDS Group: Intensive blood-glucose control with sulphonylureas or insulin compared with conventional treatment and risk of complications in patients with Type 2 diabetes [UKPDS 33]. Lancet 352:837–853, 1998.)
United Kingdom Prospective Diabetes Study Results.: Using the stepped intervention strategy resulted in a 1% absolute separation in HbA1c, which was an 11% relative reduction (7.0 vs. 7.9%) (see Fig. 25-6). Although the 1% difference in HbA1c between intensive and control groups was maintained for as long as the 12 years of mean follow-up, the progressive worsening of metabolic control applied across all treatment groups. By the fifth or sixth year of follow-up, mean HbA1c levels generally had risen to their baseline levels and continued to rise thereafter. The glycemic control achieved with all of the intensive therapies was generally similar. In the intensive treatment group, assigned medications generally were adjusted to their maximal doses, except for insulin, which was not increased to the levels that have been shown to be effective in maintaining near-normal glycemia.
The intention-to-treat analyses revealed a benefit of intensive therapy on the aggregate diabetes outcomes, decreasing the risk by 12% (Table 25-5). This benefit was predicated to a great extent on a beneficial effect on retinopathy and cataracts. No significant benefit was noted with regard to cardiovascular disease. The results with metformin were analyzed separately. (The validity of this analysis strategy has been called into question.106) Metformin therapy resulted in less weight gain and hypoglycemia than other intensive therapies. In addition, aggregate diabetes mortality, but not diabetes-related outcomes, was significantly reduced by metformin.105 However, early addition of metformin to sulfonylurea, in a randomized sub-study, resulted in a large and statistically significant increase in cardiovascular disease (CVD) mortality, leaving in question the role of metformin in reducing CVD mortality.
Table 25-5
| Nonobese + Obese | Obese Only |
| Intensive Therapy Reduced*: | Metformin Reduced*: |
| Aggregate diabetes outcomes by 12%, P = .029 | Aggregate diabetes outcomes by 32%, P = .003 |
| Laser therapy by 29%, P = .003 | |
| Cataract extraction by 24%, P = .046 | Diabetes-related death by 42%, P = .02 |
| Sudden death by 46%, P = .047 | All cause death by 36%, P = .011 |
| Intensive Therapy Did Not Reduce: | Metformin Did Not Reduce: Laser therapy −31%, P = .17 |
| Diabetes related deaths −10%, P = .34 | |
| All cause mortality −6%, P = .44 | |
| Fatal MI −6%, P = .63 | |
| Nonfatal MI −21%, P = .057 | |
| Renal failure −27%, P = .45 |
The UKPDS complex design, numerous crossovers, and controversial analytic strategy left many questions.106 However, the fundamental observation, when combined with the results of the Kumamoto study, that intensive diabetes management improves outcome, and specifically microvascular outcomes, in type 2 diabetes is unquestionable. A similar risk relationship between mean HbA1c over time and retinopathy was demonstrated in the UKPDS as in the DCCT.107 In the UKPDS, every 1% decrease (absolute) in mean HbA1c was associated with a 39% decrease in risk for retinopathy (Fig. 25-7). Long-term follow-up of the UKPDS cohort has revealed sustained (“legacy”) effects of the originally assigned therapies on outcomes, much like the EDIC results in type 1 diabetes.108
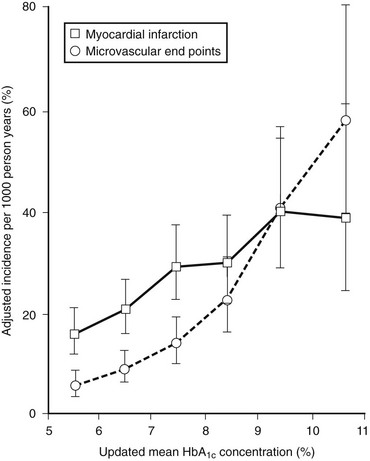
FIGURE 25-7 Relationship between mean glycated hemoglobin (HbA1c) and microvascular and macrovascular complications in the United Kingdom Prospective Diabetes Study. (From Stratton IM, Adler AI, Neil HA, et al: Association of glycaemia with macrovascular and microvascular complications of type 2 diabetes [UKPDS 35]: Prospective observational study. Br Med J 321:405–412, 2000.)
Cardiovascular Disease.: The multifactorial origin of CVD makes it unlikely that the association established between levels of glycemia and complications specific to diabetes, such as retinopathy, will be the same for the nonspecific complication of CVD. Most of the studies undertaken to examine the putative relationship between glycemic control and CVD have included populations with type 2 diabetes or impaired glucose tolerance (IGT). Although the presence of diabetes (or IGT) increases the prevalence of CVD,109–112 an association between the level of glycemia and the occurrence of CVD historically has not been easy to demonstrate.113 However, as with the study of diabetic microvascular complications, the use of more accurate measures of long-term glycemia has estalished a correlation between glycemic levels and prevalence of CVD.114–116 In the Framingham Study, level of HbA1c correlated with prevalence of CVD, but only in women.114 The UKPDS data and a recent meta-analysis support a relationship between glycemia and CVD.107,116 Moreover, glycemia in the subdiabetic range appears to be associated with CVD risk factors and CVD risk.115,117 Considerable interest has been expressed regarding whether postprandial glycemia has a greater detrimental effect than fasting glycemia on CVD and its risk factors. In populations with hyperglycemia in the subdiabetic range, postprandial hyperglycemia appears to have a relatively greater impact on CVD and CVD risk factors than do elevated fasting glucose levels.118,119
Definitive data generated in clinical trials that address the causal role of hyperglycemia with regard to CVD have remained elusive until recently. The long-term follow-up of the UKPDS showed a statistically significant benefit on CVD of intensive therapy with a sulfonylurea or insulin, or with metformin.108 However, several recent, large, controlled clinical trials120,121 have failed to demonstrate a benefit of even lower HbA1c (≈6.5% vs. 7.5%) on cardiovascular outcomes than was achieved in the UKPDS, and one of these studies was stopped early because of excess cardiovascular mortality with intensive therapy.120 Specifically, the ACCORD (Action to Control Cardiovascular Risk in Diabetes)120 and ADVANCE (Action in Diabetes and Vascular Disease: Preterax and Diamicron Modified Release Controlled Evaluation)121 clinical trials, each with more than 10,000 participants followed for 4 to 5 years, were designed specifically to determine whether achieving and maintaining near-normal HbA1c levels (≈6%) would improve CVD outcomes compared with interventions that maintained HbA1c closer to 7.5%. The ACCORD study maintained a difference in HbA1c of ≈1.1% (6.4% vs. 7.5%), and the ADVANCE study a difference of 0.7% (6.4% vs. 7.1%). However, neither study demonstrated a significant difference in CVD events between respective intensive and conventional tretment groups, each of which used different interventional strategies to achieve its HbA1c goals. In the ACCORD study, an increase in mortality (257 vs. 204 deaths) in the intensive treatment group remains unexplained. Thus, at the present time, no data are available to support very intensive efforts to achieve normoglycemia to ameliorate CVD in type 2 diabetes. The HbA1c goal of <7.0%, set by the American Diabetes Association and predicated on demonstrated salutary effects on microvascular disease, seems justified.
Pathogenetic Mechanisms.: Although glycemia has now been established as a central risk factor in the pathogenesis of long-term microvascular and neuropathic complications, and the glucose hypothesis has been established, the underlying mechanisms of the associations and of the effects of intensive therapy in the controlled clinical setting are unknown. A review of the basic science and clinical data related to the major mechanisms that have been proposed is beyond the scope of this chapter. Glycation and abnormalities in the receptor for advanced glycation end (RAGE) products, accumulation of sugar alcohols mediated by aldose-reductase or myoinositol, abnormalities in protein kinase C, and disorders in superoxide production all have been investigated.122–126 Arguably, the most convincing data in humans supporting glycation as a (or the) mechanism of long-term complications have emerged from a substudy of the DCCT in which glycation of collagen was examined in skin biopsies.100 The association of the level of glycation with long-term complications persisted even after statistical adjustment was made for mean HbA1c levels, suggesting that tissue glycation may occur directly in the pathogenetic pathway. The long half-life of glycated collagen also may help to explain the “metabolic memory” that has been observed in long-term follow-up of the DCCT and UKPDS populations.
References
1. Von Engelhardt D, et al, eds. Diabetes: Its medical and cultural history. New York: Springer-Verlag, 1989.
2. Wagener, HP. Retinopathy in diabetes mellitus. Proc Am Diabetes Assoc. 1943;5:201–216.
3. Ballantyne, AJ, Loewenstein, A. The pathology of diabetic retinopathy. Trans Ophthalmol UK. 1943;63:95–115.
4. Kimmelstiel, P, Wilson, C. Intercapillary lesions in the glomeruli of the kidney. Am J Pathol. 1936;12:83–97.
5. Deckert, T, Poulsen, JE, Larsen, M. Prognosis of diabetics with diabetes onset before the age of thirty-one. Diabetologia. 1978;14:363–377.
6. Cahill, GF, Jr., Etzwiler, DD, Freinkel, N. “Control” and diabetes [editorial]. N Engl J Med. 1976;294:1004–1005.
7. Siperstein, MD, Foster, DW, Knowles, HC, Jr., et al. Control of blood glucose and diabetic vascular disease [editorial]. N Engl J Med. 1977;296:1060–1063.
8. Ingelfinger, FJ. Debates on diabetes. N Engl J Med. 1977;296:1228–1230.
9. Boyd, JD, Jackson, RL, Allen, JH. Avoidance of degenerative lesions in diabetes mellitus. JAMA. 1942;118:694–696.
10. Engerman, R, Bloodworth, JMB, Jr., Nelson, S. Relationship of microvascular disease in diabetes to metabolic control. Diabetes. 1977;26:760–769.
11. Engerman, RL, Kern, TS. Progression of incipient diabetic retinopathy during good glycemic control. Diabetes. 1987;36:808–812.
12. Mauer, SM, Steffes, MW, Sutherland, DER, et al. Studies of the rate of regression of the glomerular lesions in diabetic rats treated with pancreatic islet transplantation. Diabetes. 1975;24:280–285.
13. Gray, BN, Watkins, E, Jr. Prevention of vascular complications of diabetes by pancreatic islet transplantation. Arch Surg. 1976;111:254–257.
14. Cohen, AJ, McGill, PD, Rossetti, RG, et al. Glomerulopathy in spontaneously diabetic rat. Diabetes. 1987;36:944–951.
15. Obrosova, IG, Mabley, JG, Zsengeller, Z, et al. Role for nitrosative stress in diabetic neuropathy: evidence from studies with a peroxynitrile decomposition catalyst. FASEB J. 2005;19:401–403.
16. Nathan, DM, Singer, DE, Hurxthal, K, et al. The clinical information value of the glycosylated hemoglobin assay. N Engl J Med. 1984;310:341–346.
17. Nathan, DM. The modern management of insulin-dependent diabetes mellitus. Med Clin North Am. 1988;72:1365–1378.
18. Nathan, DM. The impact of clinical trials on the treatment of diabetes mellitus. J Clin Endocrinol Metab. 2002;7:1929–1935.
19. DCCT Research Group. The effect of intensive treatment of diabetes on the development and progression of long-term complications in insulin-dependent diabetes mellitus. N Engl J Med. 1993;329:977–986.
20. UKPDS Group. Intensive blood-glucose control with sulphonylureas or insulin compared with conventional treatment and risk of complications in patients with type 2 diabetes (UKPDS 33). Lancet. 1998;352:837–853.
21. Reichard, P, Nilsson, B-Y, Rosenqvist, U. The effect of long-term intensified insulin treatment on the development of microvascular complications of diabetes mellitus. N Engl J Med. 1993;329:304.
22. Ohkubo, Y, Kishikawa, H, Araki, E, et al. Intensive insulin therapy prevents the progression of diabetic microvascular complications in Japanese patients with NIDDM: a randomized prospective 6-year study. Diab Res Clin Pract. 1995;28:103–117.
23. Steffes, MW, Buchwald, H, Wigness, BD, et al. Diabetic nephropathy in the uninephrectomized dog: microscopic lesions after one year. Kidney Int. 1982;21:721–724.
24. Julu, PO. The correlation between sensory nerve conduction velocities and three metabolic indices in rats treated with streptozotocin. Diabetologia. 1988;31:247–253.
25. Knowles, HC, Jr. The problem of the relation of the control of diabetes to the development of vascular disease. Trans Am Clin Climatol Assoc. 1964;76:142–147.
26. Pirart, J. Diabetes mellitus and its degenerative complications: a prospective study of 4,400 patients observed between 1947 and 1973. Diabetes Care. 1978;1:168–188.
27. Klein, R, Klein, BEK, Moss, SE, et al. Glycosylated hemoglobin predicts the incidence and progression of diabetic retinopathy. JAMA. 1988;260:2864–2871.
28. Klein, R, Moss, SE, Klein, BEK, et al. The Wisconsin epidemiologic study of diabetic retinopathy. XI. The incidence of macular edema. Ophthalmology. 1989;96:1501–1510.
29. Moss, SE, Klein, R, Klein, BEK. The incidence of vision loss in a diabetic population. Ophthalmology. 1989;95:1340–1348.
30. Doft, BH, Kingsley, LA, Orchard, TJ, et al. The association between long-term diabetic control and early retinopathy. Ophthalmology. 1984;91:763–769.
31. McCance, DR, Atkinson, AB, Hadden, DR, et al. Long-term glycaemic control and diabetic retinopathy. Lancet. 1989;2:824–828.
32. Weber, B, Burger, W, Hartmann, R, et al. Risk factors for the development of retinopathy in children and adolescents with Type I (insulin-dependent) diabetes mellitus. Diabetologia. 1986;29:23–29.
33. Groop, LC, Teir, H, Koskimies, S, et al. Risk factors and markers associated with proliferative retinopathy in patients with insulin-dependent diabetes. Diabetes. 1986;35:1397–1403.
34. Krolewski, AS, Warram, JH, Rand, LI, et al. Risk of proliferative diabetic retinopathy in juvenile- onset Type I diabetes: a 40-year follow-up study. Diabetes Care. 1986;9:443–452.
35. Klein, R, Klein, BEK, Moss, SE, et al. The Wisconsin epidemiologic study of diabetic retinopathy. II. Prevalence and risk of diabetic retinopathy when age at diagnosis is less than 30 years. Arch Ophthalmol. 1984;102:520–526.
36. Nathan, DM, Singer, DE, Godine, JE, et al. Retinopathy in older Type II diabetics: association with glucose control. Diabetes. 1986;35:797–801.
37. Knowler, WC, Bennett, PH, Ballintine, EJ. Increased incidence of retinopathy in diabetics with elevated blood pressure: a six-year follow-up study in Pima Indians. N Engl J Med. 1980;302:645–650.
38. Klein, BEK, Moss, SE, Klein, R. Effect of pregnancy on progression of diabetic retinopathy. Diabetes Care. 1990;13:34–40.
39. Miljanovic, B, Glynn, RJ, Nathan, DM, et al. A prospective study of serum lipids and risk of diabetic macular edema in type 1 diabetes mellitus. Diabetes. 2004;53:2883–2892.
40. Leslie, RDG, Pyke, DA. Diabetic retinopathy in identical twins. Diabetes. 1982;31:19–21.
41. Arar, NH, Freedman, BI, Adker, SG, et al. Heritability of the severity of diabetic retinopathy: the FIND-Eye Study. Invest Ophthalmol Vis Sci. 2008;49:3839–3845.
42. Stratton, IM, Kohner, EM, Aldington, SJ, et al. for the UKPDS Group: UKPDS 50: risk factors for incidence and progression of retinopathy in type II diabetes over 6 years from diagnosis. Diabetologia. 2001;44:145–163.
43. Andersen, AR, Christiansen, JS, Andersen, JK, et al. Diabetic nephropathy in Type I (insulin-dependent) diabetes: an epidemiological study. Diabetologia. 1983;25:496–501.
44. Rosenstock, J, Raskin, P. Early diabetic nephropathy: assessment and potential therapeutic interventions. Diabetes Care. 1986;9:529–554.
45. Kussman, MJ, Goldstein, HH, Gleason, RE. The clinical course of diabetic nephropathy. JAMA. 1976;236:1861–1863.
46. Viberti, GC, Jarrett, RJ, Mahmud, U, et al. Microalbuminuria as a predictor of clinical nephropathy in insulin-dependent diabetes mellitus. Lancet. 1982;1:1430–1432.
47. Parving, H-H, Oxenboll, B, Svendsen, PA, et al. Early detection of patients at risk of developing diabetic nephropathy. a longitudinal study of urinary albumin excretion. Acta Endocrinol. 1982;100:550–555.
48. Mathiesen, ER, Oxenboll, B, Johansen, K, et al. Incipient nephropathy in Type I (insulin- dependent) diabetes. Diabetologia. 1984;26:406–410.
49. Mogensen, CE, Christensen, CK. Predicting diabetic nephropathy in insulin-dependent patients. N Engl J Med. 1984;311:89–93.
50. Mogensen, CE. Microalbuminuria predicts clinical proteinuria and early mortality in maturity-onset diabetes. N Engl J Med. 1984;310:356–360.
51. Feldt-Rasmussen, B, Mathieson, ER. Validity of urinary albumin excretion in incipient diabetic nephropathy. Diabetic Nephrol. 1984;3:101–104.
52. Perkins, BA, Ficociello, LH, Silva, KH, et al. Regression of microalbuminuria in type 1 diabetes. N Engl J Med. 2003;348:2285–2293.
53. Viberti, GC, Keen, H, Wiseman, MJ. Raised arterial pressure in parents of proteinuric insulin-dependent diabetics. Br Med J. 1987;295:515–517.
54. Krolewski, AS, Canessa, M, Warram, JH, et al. Predisposition to hypertension and susceptibility to renal disease in insulin-dependent diabetes mellitus. N Engl J Med. 1988;318:140–145.
55. Al-Kateb, H, Boright, AP, Mirea, L, et al. Multiple superoxide dismutase 1/splicing factor serine alanine 15 variants are associated with the development and progression of diabetic nephropathy: the Diabetes Control and Complications Trial/Epidemiology of Diabetes Interventions and Complications Genetics study. Diabetes. 2008;57:218–228.
56. Freedman, BI, Bostrom, M, Daeihagh, P, et al. Genetic factors in diabetic nephropathy. Clin Am J Soc Nephrol. 2007;2:1306–1316.
57. Chase, HP, Jackson, WE, Hoops, SL, et al. Glucose control and the renal and retinal complications of insulin-dependent diabetes. JAMA. 1989;261:1155–1160.
58. Ward, JD, Fisher, DJ, Barnes, CG, et al. Improvement in nerve conduction following treatment in newly diagnosed diabetics. Lancet. 1971;1:428–430.
59. The DCCT Research Group. Factors in development of diabetic neuropathy. Diabetes. 1988;37:476.
60. Jr Porte, D, Graf, RJ, Halter, JB, et al. Diabetic neuropathy and plasma glucose control. Am J Med. 1981;70:195–200.
61. Kannel, WB, McGee, DL. Diabetes and glucose tolerance as risk factors for cardiovascular disease: the Framingham study. Diabetes Care. 1979;2:120–126.
62. A Joint Editorial Statement by the American Diabetes Association; the National Heart, Lung, and Blood Institute; the Juvenile Diabetes Foundation International; the National Institute of Diabetes and Digestive and Kidney Diseases; and the American Heart Association. Diabetes Mellitus: a major risk factor for cardiovascular disease. Circulation. 1999;100:1121–1133.
63. Barrett-Connor, EL, Cohn, BA, Wingard, DL, et al. Why is diabetes mellitus a stronger risk factor for fatal ischemic heart disease in women than in men? JAMA. 1991;265:627–631.
64. Howard, BV, Cowan, LD, Go, O, et al. Adverse effects of diabetes on multiple cardiovascular risk factors in women. The Strong Heart Study. Diabetes Care. 1998;21:1258–1265.
65. Tuomilehto, J, Borch-Johnsen, K, Molarius, A, et al. Incidence of cardiovascular disease in type 1 diabetic subjects with and without diabetic nephropathy in Finland. Diabetologia. 1998;41:784–790.
66. The Kroc Collaborative Study Group. Blood glucose control and the evolution of diabetic retinopathy and albuminuria: a preliminary multicenter trial. N Engl J Med. 1984;311:365–372.
67. Lauritzen, T, Frost-Larsen, K, Larsen, H-W, et al. The Steno Study Group: two-year experience with continuous subcutaneous insulin infusion in relation to retinopathy and neuropathy. Diabetes. 1985;34(Suppl 3):74–79.
68. Brinchmann-Hansen, O, Dahl-Jorgensen, K, Hanssen, KF, et al. The response of diabetic retinopathy to 41 months of multiple insulin injections, insulin pumps, and conventional insulin therapy. Arch Ophthalmol. 1988;106:1242–1246.
69. DCCT Research Group. The Diabetes Control and Complications Trial (DCCT): design and methodologic considerations for the feasibility phase. Diabetes. 1986;35:530–545.
70. Lauritzen, T, Larsen, H-W, Larsen, K-F, et al. Effect of 1 year of near-normal blood glucose levels on retinopathy in insulin-dependent diabetics. Lancet. 1983;1:200–204.
71. Dahl-Jorgensen, K, Brinchmann-Hansen, O, Hanssen, KF, et al. Rapid tightening of blood glucose control leads to transient deterioration of retinopathy in insulin dependent diabetes mellitus: the Oslo study. Br Med J. 1985;290:811–815.
72. DCCT Research Group. The effect of intensive diabetes treatment on the progression of diabetic retinopathy in insulin-dependent diabetes mellitus: the Diabetes Control and Complications Trial. Arch Ophthalmol. 1995;113:36.
73. DCCT Research Group. Progression of retinopathy with intensive vs conventional therapy in the Diabetes Control and Complications Trial. Ophthalmology. 1995;102:647.
74. DCCT Research Group. Early worsening of diabetic retinopathy in the Diabetes Control and Complications Trial. Arch Ophthalmol. 1998;116:874–886.
75. DCCT Research Group. The effect of intensive therapy on the development and progression of diabetic nephropathy in the Diabetes Control and Complications Trial. Kidney Int. 1995;47:1703.
76. DCCT Research Group. The effect of intensive diabetes therapy on the development and progression of neuropathy. Ann Intern Med. 1995;122:561.
77. DCCT Research Group. The effect of intensive diabetes therapy on measures of autonomic nervous system function in the Diabetes Control and Complications Trial (DCCT). Diabetologia. 1998;41:416–423.
78. DCCT Research Group. The Effect of Intensive Treatment of Diabetes on Nerve Conduction Measures in the Diabetes Control and Complications Trial. Annals of Neurology. 1995;38:869–880.
79. DCCT Research Group. The effect of intensive diabetes therapy on macrovascular disease and its risk factors in the Diabetes Control and Complications Trial. Am J Cardiol. 1995;75:894.
80. DCCT Research Group. The effect of intensive therapy on quality of life outcome in the Diabetes Control and Complications Trial. Diabetes Care. 1996;19:195–203.
81. DCCT Research Group. The effects of intensive diabetes therapy on neuropsychological function in adults in the diabetes complications and control trial. Ann Intern Med. 1996;124:379–388.
82. DCCT Research Group. Effect of intensive therapy on residual beta-cell function in patients with type 1 diabetes in the Diabetes Control and Complications Trial. Ann Intern Med. 1998;128:517–523.
83. DCCT Research Group. Implementation of treatment protocols in the Diabetes Control and Complications Trial. Diabetes Care. 1995;18:361.
84. DCCT Research Group. Treatment related adverse events in the Diabetes Control and Complications Trial. Diabetes Care. 1995;18:1415.
85. DCCT Research Group. Hypoglycemia in the Diabetes Control and Complications Trial. Diabetes. 1997;46:271–286.
86. DCCT Research Group. Lifetime benefits of intensive therapy as practiced in the Diabetes Control and Complications Trial: an economic evaluation. JAMA. 1996;276:1409–1415.
87. DCCT Research Group. Pregnancy outcomes in the Diabetes Control and Complications Trial. Am J Obstet Gynecol. 1996;174:1343–1353.
88. DCCT Research Group. Relationship of glycemic exposure to the risk of developing retinopathy in the Diabetes Control and Complications Trial. Diabetes. 1995;44:968–983.
89. DCCT Research Group. The absence of a glycemic threshold for the development of long-term complications: the perspective of the Diabetes Control and Complications Trial. Diabetes. 1996;45:1289–1298.
90. DCCT/EDIC Research Group. Effect of glycemic exposure on the risk of microvascular complications in the Diabetes Control and Complications Trial. Diabetes. 2008;57:995–2001.
91. EDIC Research Group. Epidemiology of diabetes interventions and complications (EDIC): design and implementation of a long-term follow-up of the Diabetes Control and Complications Trial Cohort. Diabetes Care. 1999;22:99–111.
92. EDIC Research Group. Retinopathy and nephropathy in patients with Type 1 diabetes four years after a trial of intensive therapy. N Engl J Med. 2000;342:381–389.
93. EDIC Research Group. Effect of intensive therapy on the microvascular complications of Type 1 diabetes mellitus. JAMA. 2002;287:2563–2569.
94. White, NH, Sun, W, Cleary, PA, et al. Prolonged effect of intensive therapy on the risk of retinopathy complications in patients with type 1 diabetes mellitus: 10 years after the Diabetes Control and Complications Trial. Arch Ophthalmol. 2008;126:1707–1715.
95. EDIC Research Group. Intensive diabetes therapy and carotid intima-media thickness in Type 1 diabetes mellitus. N Engl J Med. 2003;348:2294–2303.
96. DCCT/EDIC Study Research Group. Intensive diabetes treatment and cardiovascular disease in patients with type 1 diabetes. N Engl J Med. 2005;353:2643–2653.
97. Jacobson, AM, Musen, G, Ryan, CM, et al. Long-term effect of diabetes and its treatment on cognitive function. N Engl J Med. 2007;356:1842–1852.
98. DCCT/EDIC Research Group. Neuropathy among the Diabetes Control and Complications Trial cohort eight years after trial completion. Diabetes Care. 2006;29:340–344.
99. Early treatment Diabetic retinopathy Study Research Group. Fundus photographic risk factors for progression of diabetic retinopathy. Ophthalmology. 1991;98:823–833.
100. Monnier, VM, Bamtista, O, Kenny, D. Skin collagen glycation, glycoxidation, and crosslinking are lower in subjects with long-term intensive versus conventional therapy of Type 1 diabetes: relevance of glycated collagen products versus HbA1c as markers of diabetic complications. Diabetes. 1999;48:870–880.
101. DCCT Research Group. Clustering of long-term complications in families with diabetes in the Diabetes Control and Complications Trial. Diabetes. 1997;46:1829–1839.
102. Cleary, PA, Orchard, TJ, Genuth, S, et al. The effect of intensive glycemic treatment on coronary artery calcification in type 1 diabetic participants of the Diabetes Control and Complications Trial/Epidemiology of Diabetes Interventions and Complications (DCCT/EDIC) study. Diabetes. 2006;55:3556–3565.
103. Nathan, DM. Inferences and implications: do the DCCT results apply in NIDDM? Diabetes Care. 1995;13:5–6.
104. University Group Diabetes Program. A study of the effects of hypoglycemic agents on vascular complications in patients with adult-onset diabetes. VI. Supplementary report on nonfatal events in patients treated with tolbutamide. Diabetes. 1976;25:1129–1153.
105. UKPDS Group. Effect of intensive blood-glucose control with metformin on complications in overweight patients with Type 2 diabetes (UKPDS 34). Lancet. 1998;352:854–865.
106. Nathan, DM. Some answers, more controversy, from UKPDS. Lancet. 1998;352:832–833.
107. Stratton, IM, Adler, AI, Neil, HA, et al. Association of glycaemia with macrovascular and microvascular complications of type 2 diabetes (UKPDS 35): prospective observational study. Br Med J. 2000;321:405–412.
108. Holman, RR, Paul, SK, Bethel, MA, et al. 10-Year follow-up of intensive glucose control in type 2 diabetes. N Engl J Med. 2008;359:1577–1589.
109. Kannel, WB, McGee, DL. Diabetes and cardiovascular disease. The Framingham Study. JAMA. 1979;241:2036–2038.
110. Gordon, T, Castelli, WP, Hjortland, MC, et al. Diabetes, blood lipids, and the role of obesity in coronary heart disease risk for women. The Framingham Study. Ann Intern Med. 1977;87:393–397.
111. Jarrett, RJ, McCartney, P, Keen, H. The Bedford Survey: ten year mortality rates in newly diagnosed diabetics, borderline diabetics and normoglycaemic controls and risk indices for coronary heart disease in borderline diabetics. Diabetologia. 1982;22:79–84.
112. Nathan, DM, Meigs, J, Singer, DE. The epidemiology of cardiovascular disease in type 2 diabetes mellitus: how sweet it is … or is it? Lancet. 1997;350(Suppl 1):S14–S19.
113. The International Collaborative Group. Joint discussion. J Chronic Dis. 1979;32:829–837.
114. Singer, DE, Nathan, DM, Anderson, KM, et al. The association of hemoglobin A1c with prevalent cardiovascular disease in the original cohort of the Framingham Heart Study. Diabetes. 1992;41:202–208.
115. Meigs, JB, Nathan, DM, Wilson, PWF, et al. Metabolic risk factors worsen continuously across the spectrum of nondiabetic glucose tolerance: Framingham Offspring Study. Ann Intern Med. 1998;128:524–533.
116. Coutinho, M, Gerstein, HC, Wang, Y, et al. The relationship between glucose and incident cardiovascular events: a metaregression analysis of published data from 20 studies of 95,783 individuals followed for 12.4 years. Diabetes Care. 1999;22:233–240.
117. Khaw, KT, Wareham, N, Bingham, S, et al. Association of hemoglobin A1c with cardiovascular disease and mortality in adults: the European prospective investigation into cancer in Norfolk. Ann Intern Med. 2004;141:413–420.
118. Meigs, JB, Nathan, DM, D’Agostino, RB, et al. Fasting and postchallenge glycemia and cardiovascular disease risk: the Framingham Offspring Study. Diabetes Care. 2002;25:1845–1850.
119. Blake, DR, Meigs, JB, Muller, DC, et al. Impaired glucose tolerance, but not impaired fasting glucose, is associated with increased levels of coronary heart disease risk factors. Diabetes. 2004;53:2095–2100.
120. The Action to Control Cardiovascular Risk in Diabetes Study Group. Effects of intensive glucose lowering in type 2 diabetes. N Engl J Med. 2008;358:2545–2559.
121. The ADVANCE Collaborative Group. Intensive blood glucose control and vascular outcomes in patients with type 2 diabetes. N Engl J Med. 2008;358:2560–2572.
122. Brownlee, M. Biochemistry and molecular cell biology of diabetic complications. Nature. 2001;414:813–820.
123. Yan, SF, Ramasamy, R, Naka, Y, et al. Glycation, inflammation, and RAGE. Circ Res. 2003;93:1159–1169.
124. Engerman, RL, Kern, TS, Larson, ME. Nerve conduction and aldose reductase inhibition during 5 years of diabetes or galactosaemia in dogs. Diabetologia. 1994;37:141–144.
125. Ishii, H, Jirousek, MR, Koya, D, et al. Ameliroation of vascular dysfunctions in diabetic rats by an oral PKC β inhibitor. Science. 1996;272:728–731.
126. Nishikawa, T, Edelstein, D, Du, X-L, et al. Normalizing mitochondrial superoxide production blocks three pathways of hyperglycaemic damage. Nature. 2000;404:787–790.