Chapter 45 The Epidemiology of Diabetic Retinopathy
Prevalence of diabetic retinopathy
Population-based studies such as the Wisconsin Epidemiologic Study of Diabetic Retinopathy (WESDR)1–3 that use stereoscopic fundus photographs of seven standard photographic fields and objective grading by standard protocols have provided precise estimates of the prevalence and severity of diabetic retinopathy. In 1980–82, the WESDR showed that 71%, 23%, and 11% of those with type 1 diabetes (insulin-dependent diabetes mellitus, IDDM) and 47%, 6%, and 8% of those with type 2 diabetes (noninsulin-dependent diabetes mellitus, NIDDM) had retinopathy, proliferative retinopathy, and macular edema, respectively.3,4 These prevalence estimates, derived from data collected approximately 30 years ago in an 11-county area of southern Wisconsin (99% white), are higher than more recent prevalence data reported in other population-based studies (Table 45.1, Figs 45.1, 45.2).
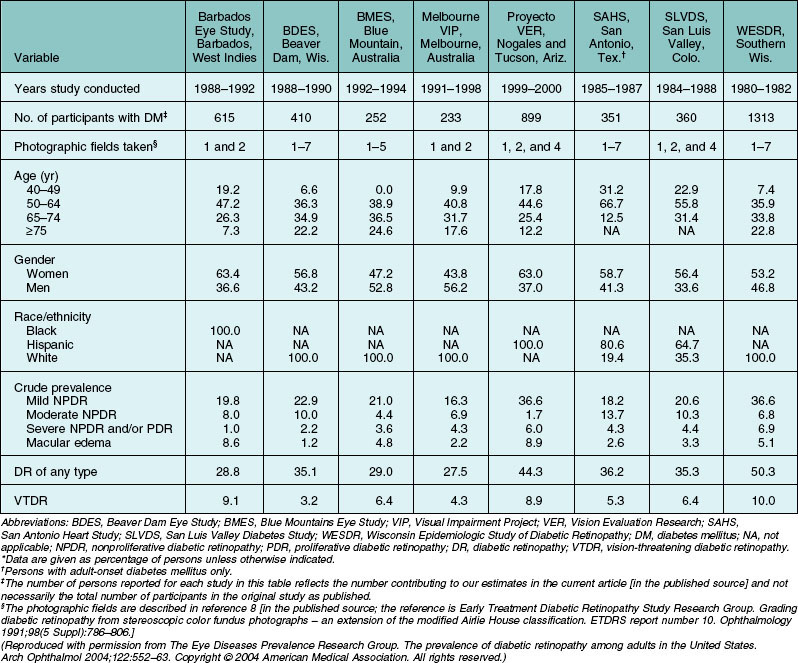
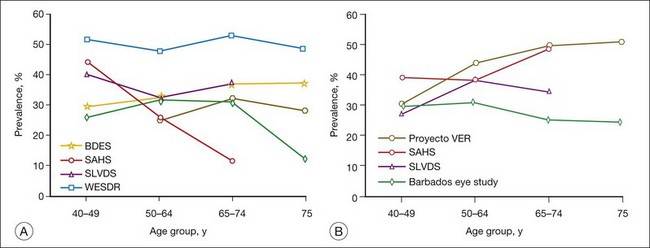
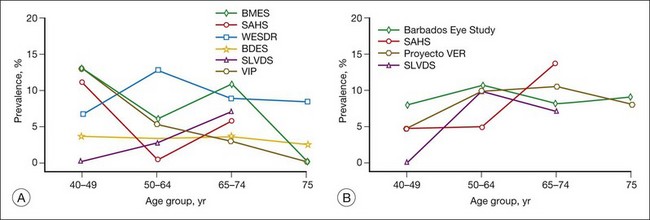
A recent effort to provide more up-to-date estimates of prevalence using pooled data from eight studies including the WESDR5 included 615 individuals who were black and 1415 who were Hispanic. The prevalence estimates were limited to persons 40 years of age and older. The estimates of retinopathy were higher in the WESDR group compared to the seven other studies, all of which were performed at least 10 years after the WESDR (Figs 45.1, 45.2). Based on pooled analyses from these studies, it was estimated that among persons with diabetes, the crude prevalence of diabetic retinopathy was 40% and the crude prevalence of severe vision-threatening retinopathy (pre-proliferative and proliferative retinopathy or macular edema) was 8%. Projection of these rates to the diabetic population 40 years of age or older in the United States resulted in an estimate of 4 million persons with retinopathy, of whom 900 000 have signs of vision-threatening retinopathy. Based on grading of fundus images in the 2005–8 National Health and Nutrition Examination Survey (NHANES), 4.2 million people 40 years of age or older with diabetes were estimated to have diabetic retinopathy, of whom 650 000 had signs of vision-threatening retinopathy. With expectations that diabetes will continue to become more prevalent, without a significant decline in the incidence of diabetic retinopathy, the actual number of persons with vision-threatening retinopathy is likely to continue to increase.
The lower prevalence of diabetic retinopathy in more recent studies is thought to be due, in part, to changes in the management of diabetes.6–46 In persons with type 1 diabetes in the WESDR, there have been dramatic changes in management that include an increase in the use of blood glucose self-monitoring (from 72% in 1984–6 to 91% in 2005–7) and a greater frequency of using three or more injections of insulin per day (from 4% in 1980–2 to 85% in 2005–7). In the WESDR, this was associated with a 25% drop in the mean glycosylated hemoglobin A1c (A1c) from 10.1% to 7.6% and a 29% increase in those achieving American Diabetes Association (ADA) guidelines of A1c of <7% from 4% to 33% over the same period.47
There have also been changes in the management of glycemia in people with type 2 diabetes. In 1988–94, the use of only one oral hypoglycemic agent was the primary treatment to manage hyperglycemia in people with type 2 diabetes. After the findings from the United Kingdom Prospective Diabetes Study (UKPDS), there was an increase in the use of more than one oral hypoglycemic agent over a 5-year period (1999–2004).48,49 This was associated with a decrease in the mean A1c levels from 7.8% to 7.2%, with a 41% increase (from 41% to 58%) in persons achieving A1c levels of <7.0% in the periods 1999–2000 and 2005–6.
Incidence and progression of diabetic retinopathy and incidence of clinically significant macular edema
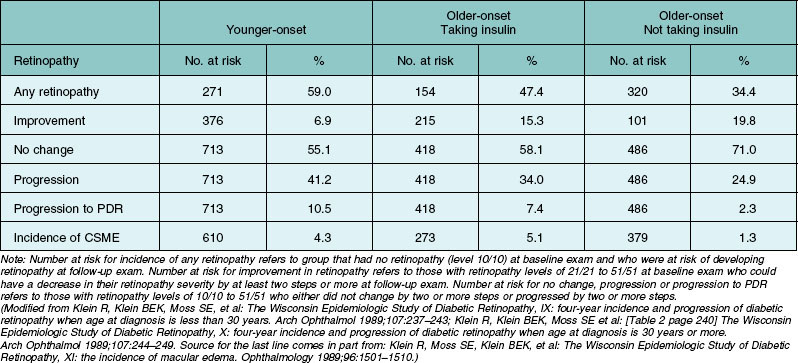
There are fewer reports of incidence of retinopathy in population-based studies.8,21,50–63 The incidence of retinopathy in a 4-year interval in the entire WESDR population was 40.3%.50,51 The 4-year incidence and rates of progression of diabetic retinopathy and macular edema in the WESDR are presented in Table 45.2. Those with type 1 diabetes had a higher incidence of any retinopathy, progression, and progression to proliferative retinopathy than those with type 2 diabetes (Table 45.2).52 The highest 4-year incidence of clinically significant macular edema was in those with type 2 diabetes taking insulin, while the lowest was in those with type 2 diabetes not taking insulin. While the incidence of proliferative retinopathy was higher in those with type 1 diabetes, the estimates of the number of incident cases in the 4-year period were higher in the group with type 2 diabetes than in the group with type 1 diabetes (120 vs 83 persons) due to the higher frequency of people with type 2 diabetes.
Table 45.2 Four-year incidences of any retinopathy, improvement or progression of retinopathy, progression to proliferative diabetic retinopathy (PDR) and incidence of clinically significant macular edema (CSME) in younger-onset type 1 diabetes and older-onset type 2 diabetes in the Wisconsin Epidemiologic Study of Diabetic Retinopathy, 1980–1986
There is also evidence that the prevalence and incidence of diabetic retinopathy may be decreasing in subjects more recently diagnosed with type 1 diabetes. Hovind et al.64 first showed a declining incidence of proliferative diabetic retinopathy and macular edema in a study of 600 patients with type 1 diabetes diagnosed between 1965 and 1984 in Denmark. In that study, the cumulative incidence of proliferative diabetic retinopathy and macular edema after 20 years of diabetes declined from 31% and 19%, respectively, in those diagnosed from 1965 to 1969, to 13% and 7%, respectively, in those diagnosed from 1979 to 1984. There was also significant improvement in visual acuity and lower prevalence of severe visual impairment in those diagnosed with type 1 diabetes more recently than those diagnosed in earlier periods. These changes were attributed by the authors to improved glycemic control, more aggressive treatment of blood pressure sooner after diagnosis of diabetes, and reduced smoking rates in the more recently diagnosed type 1 diabetic group than in previous years. There was also a decline in the cumulative proportion with severe laser-treated diabetic retinopathy after 25 years of type 1 diabetes from 47% in subjects diagnosed in 1961–5 to 24% in subjects diagnosed in 1971–5 in the Swedish Linköping Diabetes Complications Study.65,66 However, the Pittsburgh Epidemiology of Diabetic Complications Study did not show a significant decrease in proliferative diabetic retinopathy in those diagnosed more recently.67 In the WESDR, the annualized estimates for the progression of diabetic retinopathy (4.5 vs 2.5%) and the incidence of proliferative diabetic retinopathy (3.4 vs 1.5%), clinically significant macular edema (1.0 vs 0.4%), and visual impairment (0.7 vs 0.3%) were higher in the first 12 years of the study (1980–92) than in the latest 13 years of the study (1994–2007).68–71 While controlling for duration of diabetes, there was also evidence in the WESDR of lower prevalence of proliferative diabetic retinopathy (4% lower per more recent time period) and visual impairment (9% lower per more recent time period) but not of macular edema in those diagnosed with type 1 diabetes more recently than those diagnosed longer ago. The relationships remained when adjusting for hypertension and A1c levels over time.
The relationship of race/ethnicity to diabetic retinopathy
In contrast to whites, there are fewer epidemiological studies regarding the prevalence and incidence of diabetic retinopathy in other racial/ethnic groups in the United States, especially in persons with type 1 diabetes. Data from the New Jersey 725 study cohort, which used similar methods to detect and classify retinopathy severity as in the WESDR cohort, showed a similar frequency and severity of retinopathy in African Americans with type 1 diabetes as found in whites with type 1 diabetes in the WESDR.45,46 At the 6-year follow-up of the same cohort, 56% showed progression of diabetic retinopathy, 15% showed progression to proliferative diabetic retinopathy, and 16% developed macular edema.62 These findings were similar to those in whites in the WESDR (52).
In four population-based studies, the NHANES 1988–94 and 2005–8,36 the Atherosclerosis Risk in Communities (ARIC) study,72 the Cardiovascular Health Study,73 and the Multi-Ethnic Study of Atherosclerosis (MESA),74 retinopathy was more prevalent in African Americans with type 2 diabetes than in whites. In the NHANES III in 1988–94, compared to whites, African Americans had a higher frequency of people with poor glycemic control (A1c greater than 8.3%, 37% vs 30%), high systolic blood pressure (>142 mmHg, 42% vs 32%), longer duration of diabetes (>14 years, 29% vs 23%), and on insulin therapy (43% vs 24%). There was no difference (odds ratio [OR] 0.94; 95% confidence interval [CI] 0.54–1.66) in the prevalence of retinopathy between African Americans and whites while controlling for these factors (36). In addition, there were no statistically significant interactions of race with diabetes severity variables or systolic blood pressure, suggesting that the effect of risk factors was similar in both racial/ethnic groups. Similarly, the higher prevalence of retinopathy in the ARIC study (28% vs 17%) and in the MESA (37% vs 25%) in blacks as compared to whites was no longer statistically significant after controlling for differences in glycemic and blood pressure control between the races. Higher prevalence of retinopathy in African Americans with type 2 diabetes appears to be partially due to poorer glycemic and blood pressure control. These data suggest that programs designed to better control blood sugar and blood pressure in diabetic African Americans might be beneficial.
In most population-based studies, Mexican Americans have been shown to have higher frequencies and more severe diabetic retinopathy than non-Hispanic whites.5,22,31,36,40,74–76 Haffner et al.22 found that after controlling for all measured risk factors, the frequency of retinopathy in Mexican Americans in San Antonio was 2.4 times as high as the frequency of retinopathy in non-Hispanic whites studied in the WESDR. Similarly, in the NHANES 1988–94 and 2005–8, the MESA, Proyecto VER, and the Los Angeles Latino Eye Study (LALES), retinopathy was more frequent in Mexican Americans compared to non-Hispanic whites 40 years of age or older.31,36,74,76 In the NHANES 1988–94, retinopathy was more prevalent in Mexican Americans (OR 2.15; 95% CI 1.15–4.04) compared to non-Hispanic whites, even while controlling for duration of diabetes, A1c level, blood pressure, and type of antihyperglycemic medication used.5 In the NHANES 2005–8, vision-threatening retinopathy was approximately 3.5 times (95% CI 1.05–12.56) as frequent in Mexican Americans compared to non-Hispanic whites.75 These variations in prevalence among ethnic groups may be a result of differences in how long it takes to diagnose diabetes after its onset, how it was defined, and levels of glycemia and blood pressure. Differences among Hispanic whites may be due to the degree of gene-sharing with Native Americans, a group with a high prevalence of retinopathy (see below).
Among population-based studies, only the LALES has provided data on the incidence and progression of diabetic retinopathy in Mexican Americans with type 2 diabetes.63 The 4-year incidence of diabetic retinopathy and clinically significant macular edema was 34% and 7%, respectively, and progression of retinopathy and progression from nonproliferative diabetic retinopathy to proliferative diabetic retinopathy was 39% and 5%, respectively, over the 4-year period. While these rates are comparable to those found in the WESDR, they are higher than in most other contemporaneous studies of whites with type 2 diabetes.
The prevalence and severity of retinopathy appears to vary among different Native American groups.41,77–80 In studies done in the 1970s, Native Americans were reported to have higher rates of severe retinopathy for a given duration of type 2 diabetes compared to whites.9,10 However, data from more recent studies on the incidence and progression of diabetic retinopathy in Pima Indians show a lower 4-year cumulative incidence and progression of diabetic retinopathy (17% and 18%, respectively) than reported in whites with type 2 diabetes, reflecting possible improvements in glycemic and blood pressure control.81
There are few data on the prevalence of retinopathy in Asian Americans and other racial/ethnic groups.27,37,43,74 The prevalence of retinopathy in second generation (Nisei) Japanese American men, 12%, was significantly lower than that reported in the diabetes clinic at Tokyo University Hospital (49% among patients with onset of diabetes at 20–59 years of age and 47% among those with onset after 59 years of age) and in whites reported in the WESDR (36%).3,27 In the MESA, the prevalence of any retinopathy (26% vs 25%) in Chinese Americans was similar to whites.74 However, clinically significant macular edema and proliferative diabetic retinopathy was higher (13% vs 2%) in Chinese than in whites. More data on the prevalence and incidence of retinopathy in Chinese and other Asian American groups are needed.
Genetic factors
Data from a number of studies that examined familial clustering suggested that genetic factors may be involved more strongly in the susceptibility to diabetic retinopathy than previously thought.82,83 In addition, data showing that the time of appearance of retinopathy and its severity are more likely to be similar among diabetic identical twins than dizygotic twins suggested that the tendency to develop diabetic retinopathy, and possibly its progression, are influenced by genetic factors. However, unlike the strong associations of complement factor H and other single nucleotide polymorphisms (SNPs) that have been found to be related to age-related macular degeneration, the putative genes and genetic variants have not been found to be as strongly or consistently associated with diabetic retinopathy (see Chapter 46, Diabetic retinopathy: Genetics and etiologic mechanisms). This may be a result of the stronger environmental influence of glycemic and blood pressure control than found for age-related macular degeneration. The fact that retinopathy is not specific to diabetes in its earliest stages may also contribute to inability to find and replicate genes associated with diabetic retinopathy.
Study of specific genetic factors associated with the hypothesized pathogenetic factors for retinopathy, such as aldose reductase activity, collagen formation, inflammatory processes, protein kinase activity, glycation, oxidative stress and platelet adhesiveness and aggregation may yield a better understanding of the possible causal relationships between genetic factors and diabetic retinopathy. There are already a number of studies that have reported associations between retinopathy and mitochondrial DNA mutations84 and polymorphisms of the aldose reductase gene,85,86 TNF-beta NcoI gene,87 epsilon4 allele of apolipoprotein E gene,88 paraoxonase (an enzyme that prevents oxidation of low-density lipoprotein cholesterol) gene,89 endothelial nitric oxide synthase gene,90 intercellular adhesion molecule-1 (ICAM-1),91 alpha2beta1 integrin gene (involved with platelet function),92 cytokine vascular endothelial growth factor (VEGF) gene, and many others.93,94 The reader is referred to a more comprehensive, in-depth discussion of the rapidly evolving field of genetic epidemiology of diabetic retinopathy in Chapter 46.
Sex
In the WESDR, higher frequencies of proliferative retinopathy were present in younger-onset men compared to women.2 However, there were no significant differences in the 4-, 10-, or 14-year incidence or progression of diabetic retinopathy between the sexes.50,53,58 There were no significant differences in the prevalence or 10-year incidence of retinopathy or rates of progression to proliferative retinopathy between the sexes in people with type 2 diabetes in the WESDR.3,51,53
Age and puberty
The prevalence and severity of diabetic retinopathy increased with increasing age in persons with type 1 diabetes in the WESDR.2 In persons under 13 years of age, diabetic retinopathy was infrequent, irrespective of the duration of diabetes. The 4-year incidence of retinopathy increased with increasing age, with the sharpest increase occurring in persons who were 10–12 years of age at baseline.50 Four-year rates of progression of retinopathy in younger-onset persons rose steadily with increasing age until 15–19 years of age, after which there was a gradual decline. No child younger than 13 years of age at baseline in the WESDR was found to have proliferative retinopathy at the 4-year follow-up. These findings have formed the rationale for guidelines for not screening for retinopathy in children with type 1 diabetes.95
In the WESDR, menarchal status, a crude marker of puberty, at the time of the baseline examination was related to the prevalence and severity of retinopathy.96 While controlling for other risk factors, those who were postmenarchal were three times as likely to have retinopathy as those who were premenarchal. In a follow-up study of 60 children with type 1 diabetes, Frost-Larsen and Starup97 found the incidence of retinopathy to be higher after puberty than before, independent of duration or metabolic control of diabetes or type of treatment. These findings have been observed in other studies.98,99 Increases in growth hormone, insulin-like growth factor I, sex hormones, and blood pressure as well as poorer glycemic control (due to increased insulin resistance, poorer compliance, and/or inadequate insulin dosage) have been hypothesized to explain the higher risk of developing retinopathy after puberty.
In older-onset persons taking insulin in the WESDR, the 4-year incidence of retinopathy and progression of retinopathy had a tendency to decrease with age.51 The 4-year incidence of improvement tended to increase with age. For those not taking insulin, the 4-year rate of progression to proliferative retinopathy decreased with age. Few persons 75 years of age or older with type 2 diabetes developed proliferative retinopathy over the 10 years of follow-up. These findings are consistent with data from other population-based studies.8,21 In one such study of people with type 2 diabetes in Rochester, Minnesota, Ballard et al.14 reported a lower incidence of retinopathy with increasing age in persons with diabetes older than 60 years of age. These findings might reflect a less severe disease in those with older-onset or selective survival, that is, older persons who develop severe retinopathy are at higher risk of dying and not being seen at follow-up in these studies.
Duration of diabetes
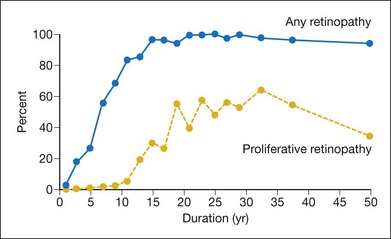
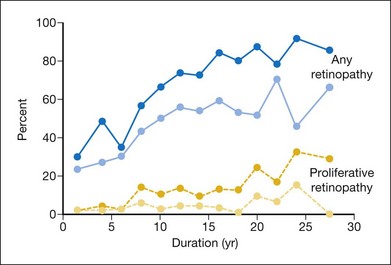
Perhaps the most consistent relationship found in persons with diabetes is the increase in the frequency and severity of diabetic retinopathy and macular edema with increasing duration of diabetes.2 The prevalence of retinopathy 3–4 years after diagnosis of diabetes in the WESDR younger-onset group with type 1 diabetes was 14% in men and 24% in women. However, in persons who had had diabetes for 19–20 years, 50% of men and 33% of women had proliferative retinopathy. Shortly after diagnosis of diabetes, retinopathy was more frequent in persons with type 2 diabetes compared with those with type 1 diabetes (Figs 45.3, 45.4).3 In the first 3 years after diagnosis of diabetes, 23% of the type 2 diabetic group not taking insulin had retinopathy, and 2% had proliferative retinopathy (PDR).
Based on recent follow-up of the WESDR cohort, the prevalence estimates for a given duration likely overestimate the actual prevalence now found in the population.68 For a specific duration of type 1 diabetes, people diagnosed between 1975 and 1980 had a statistically significantly lower prevalence than persons diagnosed in earlier periods (P < 0.001). This difference remained while controlling for A1c, systolic and diastolic blood pressure, and presence of proteinuria. Similarly, for specific duration of type 2 diabetes, those diagnosed more recently had a lower prevalence of diabetic retinopathy than those diagnosed in earlier periods.
Harris et al.,100 using retinopathy prevalence data at different durations of diabetes from persons with type 2 diabetes in the WESDR and from a study in Australia, extrapolated to the time when retinopathy prevalence was estimated to be zero. They estimated that the onset of detectable retinopathy occurred approximately 4–7 years after diagnosis of type 2 diabetes in these populations.
In the WESDR, the 4- and 10-year incidence of diabetic retinopathy increased with increasing duration of diabetes at baseline.50,51,53 The risk of developing retinopathy in the younger-onset group was high (74%) after 10 years of diabetes. The 4-year incidence of proliferative retinopathy varied from 0% during the first 3 years after diagnosis of diabetes to 28% in those with 13–14 years of diabetes. Thereafter, the incidence remained stable.50 A similar trend was found in a cohort of patients with type 1 diabetes followed at the Joslin Clinic.101 In the older-onset WESDR group, 2% of those with less than 5 years and 5% of those with 15 or more years of diabetes who were not taking insulin at baseline developed signs of proliferative retinopathy at the 4-year follow-up.51
Age at diagnosis
Age at diagnosis was not related to incidence or progression of diabetic retinopathy in any of the diabetes groups followed in the WESDR.50,51 In contrast, while controlling for other risk factors, in a cohort with type 2 diabetes in Rochester, Minnesota, the development of retinopathy was significantly associated with younger age at diagnosis.14
Glycemia
In 1978, in his textbook on the epidemiology of diabetes and its complications, Kelly West wrote: “The extent to which hyperglycemia determines the risk of retinopathy is not at all clear. This is the most important issue at hand and deserves high priority in epidemiologic research.”102 Thirty years later, this issue has largely been resolved by epidemiologic studies and clinical trials.
The Diabetes Control and Complications Trial (DCCT) was “designed to compare intensive with conventional diabetes therapy with regard to their effects on the development and progression of the early vascular and neurologic complications of IDDM.”103 Two of the main questions asked in the study were: “Will intensive therapy prevent the development of diabetic retinopathy in patients with no retinopathy (primary prevention)?” and “Will intensive therapy affect the progression of early retinopathy (secondary intervention)?” In addition, the DCCT examined the magnitude of the effect of intensive insulin treatment on progression of retinopathy, the degree to which this effect changes over time, and the relation of the effect to the level of severity of the retinopathy at baseline.104–106
Randomization was used to assign conventional or intensive insulin therapy.103 Conventional therapy consisted of one or two daily injections of insulin per day, daily self-monitoring of urine or blood glucose, and education about exercise and diet. No attempts were made to adjust the insulin dosage on a daily basis. Intensive therapy consisted of administration of insulin three or more times daily by injections or an external pump. In addition, there was adjustment of the insulin dosage under the direction of an expert team, taking into account self-monitoring of blood glucose performed four times per day, dietary intake, and anticipated exercise.104
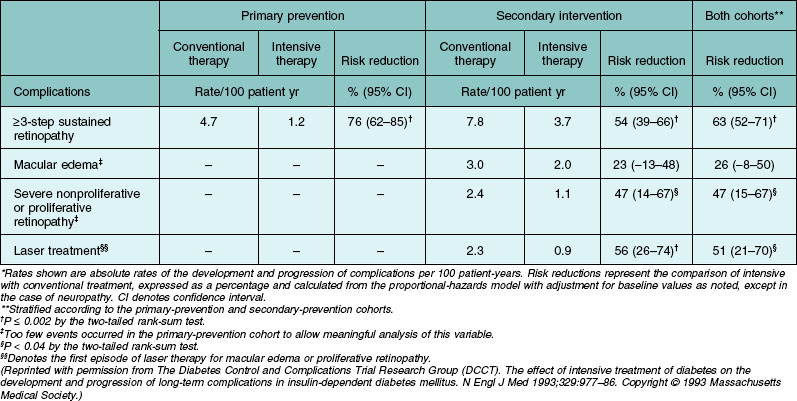
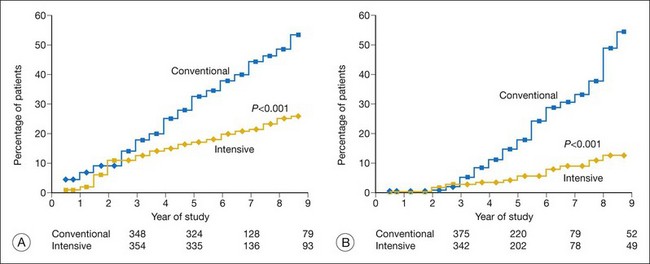
An important finding of the trial was the statistically significant reduction in risk of sustained progression of retinopathy by three or more steps by 76% (Table 45.3, Fig. 45.5). In the secondary-intervention cohort, the intensive therapy group had a reduction of average risk of progression by 54% during the entire study period compared to the patients assigned to the conventional-therapy group. In addition, when both cohorts were combined, the intensive therapy group also had a reduction in risk for development of severe nonproliferative retinopathy or proliferative retinopathy by 47% and of treatment with photocoagulation by 51% (Table 45.3). There was a decrease in the incidence of clinically significant macular edema in the group assigned to intensive therapy compared to those assigned to conventional therapy. However, this difference did not reach statistical significance.
Table 45.3 Development and progression of long-term complications of diabetes in the study cohorts and reduction in risk with intensive as compared with conventional therapy*
Early worsening of retinopathy in the first year of treatment of the intensive therapy group in the secondary-intervention cohort was observed, as had been reported previously.107–109 On average, it took about 3 years to demonstrate the beneficial effect of intensive treatment. After 3 years, the beneficial effect of intensive insulin treatment increased over time.
The DCCT investigators also examined whether there was an association of A1c values <8% versus those of ≥8% for progression of retinopathy. When they combined the two groups (conventional and intensive treatment), they found no evidence to support the concept of a glycemic threshold regarding progression of retinopathy, as had been described by others.110
Intensive insulin treatment reduced but did not prevent the incidence and progression of retinopathy in persons without signs of retinopathy at the baseline examination. The 9-year cumulative incidence of one microaneurysm or more severe retinopathy in eyes with no retinopathy present at baseline was 70% in persons with <2.5 years of type 1 diabetes and 62% in persons with >2.5 years of type 1 diabetes at baseline. Approximately 40% of these individuals developed a three-step progression of their retinopathy.105
The DCCT examined whether intensive therapy was more beneficial when started earlier in the course of type 1 diabetes. They found that the 9-year cumulative incidence of sustained three-step progression in persons without retinopathy with <2.5 years of type 1 diabetes in the intensive therapy group was 7% compared to 20% in those with >2.5 years. The 9-year cumulative incidence of sustained three-step progression in the intensive therapy group was lower in eyes with minimal to early nonproliferative retinopathy at baseline compared to eyes with more severe nonproliferative retinopathy at baseline (11.5–18.2% vs 43.8%). These data suggested a benefit of beginning intensive treatment earlier in the course of diabetes, prior to the onset of diabetic retinopathy.105
From the trial, it was estimated that intensive therapy would result in a “gain of 920,000 years of sight, 691,000 years free from end-stage renal disease, 678,000 years free from lower extremity amputation, and 611,000 years of life at an additional cost of $4.0 billion over the lifetime” of the 120 000 persons with IDDM in the United States who meet DCCT eligibility criteria.111 The incremental cost per year of life gained was $28 661, and when adjusted for quality of life, intensive therapy costs $19 987 per quality-of-life year gained. These findings were similar to cost-effectiveness ratios for other medical interventions in the United States.
Fourteen years of additional follow-up of the DCCT cohort after the study was stopped revealed that despite convergence of A1c levels in the intensive and conventional groups, the protective effect of glycemic control was maintained in the intensive group.112–114 This has been labeled “metabolic memory” and has been found also in persons with type 2 diabetes in the UKPDS (see below).115 The reason for this finding remains speculative. Recent data suggest that biochemical pathways involving advanced glycation endproducts and oxidative stress may affect genes and proteins involved in the pathogenesis of diabetic microvascular and macrovascular complications.114
The UK Prospective Diabetes Study (UKPDS) was a randomized controlled clinical trial involving 3867 patients newly diagnosed with type 2 diabetes.116–118 After 3 months of diet treatment, patients with a mean of two fasting plasma glucose concentrations of 6.1–15.0 mmol/L were randomly assigned to intensive glycemic control with either a sulfonylurea or insulin or conventional glycemic control. The latter group was further divided into those who were overweight or not. Metformin was included as one of the treatment arms for 1704 overweight patients, and analyses included comparison of the effect of metformin against conventional therapy in overweight patients. After 12 years of follow-up, there was a reduction in rate of progression of diabetic retinopathy of 21% and reduction in need for laser photocoagulation of 29% in the intensive versus the conventional treatment group. In addition, there were no differences in reduction in the incidence of the retinopathy endpoints among the three agents used in the intensive treatment group (chlorpropamide, glibenclamide, and insulin) but the chlorpropamide treatment group failed to show a reduced rate of retinopathy requiring photocoagulation. Furthermore, there was no difference in vision outcomes between conventional and intensive treatments. It was concluded that metformin was preferred as the first-line pharmacological therapy in newly diagnosed type 2 diabetic patients who were overweight, based on their finding of a significant (39%) reduction in myocardial infarction compared to the conventional treatment group. When metformin was added to sulfonlyureas (in both obese and nonobese patients), however, it was associated with increased diabetes-related (96%) and all-cause mortality (60%) when compared to conventional therapy. The intensive treatment group suffered significantly more major hypoglycemic episodes and weight gain than patients in the conventional group. Economic analyses of the clinical trial data suggested that intensive glucose control increased treatment costs but substantially reduced complication costs and increased the time free of such complications.118
The development of new treatment modalities for achieving glycemic control has resulted in two recently completed randomized clinical trials that permitted evaluation of near normalization of glycemic level on the incidence of cardiovascular disease and retinopathy. The first trial involved 1791 military veterans with an average age of 60 years and an average duration of 11 years of type 2 diabetes, who had a suboptimal response to therapy for their diabetes. They were randomly assigned to receive either intensive or standard glucose control, with an aim in the intensive therapy group of achieving an absolute reduction of 1.5 percentage points in the A1c level as compared with the standard therapy group. The primary outcome was the time to the first occurrence of a major cardiovascular disease event, and a secondary objective was to evaluate the effect of glycemic control on the incidence and progression of diabetic retinopathy and other microvascular complications.119,120 The subjects were followed for up to 7.5 years (median: 5.6 years). Despite reaching their glycemic goal (median A1c level at 6 months: 8.4% in the group receiving standard therapy and 6.9% in the intensive therapy group), there were no statistically significant differences in any of the retinopathy outcomes between groups receiving intensive and standard therapy (incidence of retinopathy 42% vs 49%, P = 0.27; progression of retinopathy by two or more steps on the Early Treatment Diabetic Retinopathy Study [ETDRS] severity scale 17% vs 22%, P = 0.07; progression to proliferative diabetic retinopathy 4% vs 5%, P = 0.27) or in progression to clinically significant macular edema (3% vs 5%, P = 0.31). While it is possible that a benefit might have been seen if the study was continued, these data lead to the conclusion that decreasing the A1c level from 8.4% to 6.9% in persons with relatively long-standing type 2 diabetes has little benefit in preventing the incidence and progression of retinopathy.
Another recently concluded large randomized controlled clinical trial is Action to Control Cardiovascular Risk in Diabetes (ACCORD), which examined whether intensive treatment with an even lower targeted A1c level (<6.0%) than in the military veteran study versus standard treatment (targeted A1c level 7.0–7.9%) would reduce the risk of morbidity and mortality from cardiovascular disease (primary endpoint) and microvascular events, such as the incidence of photocoagulation treatment for diabetic retinopathy and incidence of microalbuminuria and macroalbuminuria over a 5-year period (secondary endpoints) in persons with a mean age of 60 years with an average duration of 10 years of type 2 diabetes.121,122 They reported findings on the same composite microvascular endpoints measured in the UKPDS. They also reported the incidence and progression of diabetic retinopathy on the basis of the grading of fundus photographs in a sample of 4065 of the 10 251 participants. They did not find a statistically significant difference in their composite microvascular endpoints (one combining a history of advanced kidney and eye disease, and the other adding peripheral neuropathy to that outcome) or for some of the other specified ocular or renal outcomes. In the eye study, using the grading of fundus photographs to assess intensive glycemic control, they reported a 33% reduction in the relative risk of progression from 7.3% with intensive glycemia treatment, versus 10.4% with standard therapy (adjusted OR 0.67; 95% CI 0.51–0.87; P = 0.003) in a relatively short period (4 years). The ACCORD intensive glycemic strategy was prematurely discontinued because of a statistically significant 22% increase in overall mortality in the intensive glycemic group of the study. Median A1c was 6.3% compared with 7.6% in the standard glycemic group. The study closure of the glycemic phase of the trial made it too short and the power too low to observe a protective effect for the severe microvascular endpoints, which usually evolve over a longer period.53
An additional clinical trial that was recently concluded, the Action in Diabetes and Vascular Disease: Preterax and Diamicron Modified Release Controlled Evaluation (ADVANCE) study of patients with type 2 diabetes, showed no statistically significant effect of glycemic control on severe diabetes related to ocular endpoints.123
Based on the results of these studies, it appears that intensive therapy should be the primary public healthcare strategy aimed at reducing the risk of visual loss from diabetic retinopathy in persons with both type 1 and 2 diabetes. The data from the DCCT and UKPDS provided further support for the ADA guidelines of a target goal of A1c level of 7.0% for persons with diabetes, and suggest that this level of control, when achieved earlier after diagnosis of diabetes, may have greater long-term benefit in terms of reducing the incidence and progression of retinopathy.124 However, data from the NHANES III125 and the WESDR126 suggest that few persons with diabetes reach this targeted level of glycemic control. The data from the military veterans study, the ACCORD, and the ADVANCE suggest that further lowering the level of glycemia does not support applying intensive glycemic control with the current technology to achieve such control in patients with long-standing type 2 diabetes who have or who are at risk of cardiovascular disease.127,128
C-peptide status
The relationship of endogenous insulin secretion to diabetic retinopathy independent of glycemic control is uncertain.129–132 In the WESDR, the highest prevalence and most severe retinopathy were found in individuals with undetectable or low plasma C-peptide (<0.3 nM), whereas the lowest frequencies and least severe retinopathy were found in older-onset individuals not using insulin who were overweight.133 Older- and younger-onset individuals who were using insulin and who had no detectable C-peptide had similar frequencies of proliferative retinopathy. While controlling for other risk factors associated with the incidence and progression of diabetic retinopathy, there was no relationship of C-peptide level to incident or progressed retinopathy in persons with type 1 diabetes in the WESDR.134 In the DCCT, however, higher C-peptide levels at entry were associated with reduced incidence of retinopathy and lower incidence of hypoglycemic episodes.135 In the WESDR, while controlling for characteristics associated with retinopathy in older-onset people who were not taking insulin (type 2 diabetes), there was no protection associated with higher levels of C-peptide.133,134 These findings suggest that the level of glycemia, and not the level of endogenous insulin secretion as indicated by C-peptide level, is more important in determining the presence and severity of retinopathy in individuals with type 2 diabetes.
Exogenous insulin
It has been suggested that exogenous insulin may be a possible cause of atherosclerosis and retinopathy in people with type 2 diabetes.136 In the WESDR, there was no association between the amount or type of exogenous insulin used and the presence, severity, incidence or progression of retinopathy in the older-onset group using insulin whose C-peptide was 0.3 nM or greater.133,134 These data suggest that exogenous insulin in itself is unlikely to be causally related to retinopathy in diabetic people with normal C-peptide levels.
Blood pressure
In the WESDR, blood pressure was a significant predictor of the 14-year incidence of diabetic retinopathy in people with type 1 diabetes.58 While controlling for other risk factors such as retinopathy severity, A1c, and duration of diabetes at baseline, the relationships between blood pressure and the incidence or progression of retinopathy remained in the younger-onset group. However, in the WESDR, neither the systolic nor the diastolic blood pressure was found to be related to the 10-year incidence and progression of retinopathy in those with type 2 diabetes.137 The UKPDS did find that the incidence of retinopathy was associated with systolic blood pressure. For each 10 mmHg decrease in mean systolic blood pressure, a 13% reduction was found for microvascular complications. No threshold was found for any retinopathy endpoint.138 In the WESDR, a 10 mmHg rise in diastolic blood pressure was found to be associated with a 330% increased 4-year risk of developing macular edema in those with type 1 diabetes and a 210% increased risk in those with type 2 diabetes.139
The UKPDS sought to determine whether lowering blood pressure was beneficial in reducing macrovascular and microvascular complications associated with type 2 diabetes.140 A series of 1048 patients with hypertension (mean blood pressure 160/94 mmHg) were randomized to a regimen of tight control with either captopril (an angiotensin-converting enzyme [ACE] inhibitor) or atenolol (a beta-blocker) and another 390 patients to less tight control of their blood pressure. The aim in the group randomized to tight control of blood pressure (by the standards at the beginning of the clinical trial) was to achieve blood pressure values <150/<85 mmHg. If these goals were not met with maximal doses of a beta-blocker or ACE inhibitor, additional medications were prescribed, including a loop diuretic, a calcium-channel blocker, and a vasodilator. The aim in the group randomized to less tight control was to achieve blood pressure values <180/<105 mmHg. Tight blood pressure control resulted in a 35% reduction in retinal photocoagulation compared to conventional control, presumably due to a lower incidence of macular edema. After 7.5 years of follow-up, there was a 34% reduction in the rate of progression of retinopathy by two or more steps using the modified ETDRS severity scale and a 47% reduction in the deterioration of visual acuity by 3 lines or more using the ETDRS charts (for example, a reduction in vision from 20/30 to 20/60 or worse on a Snellen chart). Atenolol and captopril were equally effective in reducing the risk of developing these microvascular complications, suggesting that blood pressure reduction itself was more important than the type of medication used to reduce it. The effects of blood pressure control were independent of those of glycemic control. These findings support the recommendations for blood pressure control in patients with type 2 diabetes as a means of preventing visual loss from diabetic retinopathy.
The ACCORD also examined whether in the context of good glycemic control, a “therapeutic strategy that targets a systolic blood pressure of <120 mmHg would reduce cardiovascular disease events compared to a strategy that targets a systolic blood pressure of <140 mmHg in persons with type 2 diabetes.”121 There were 1263 ACCORD-Eye study participants enrolled in the ACCORD blood pressure study. After 1 year, the baseline median systolic blood pressure lowered significantly (from 133 to 117 mmHg) in the intensive blood pressure therapy group compared to the standard blood pressure therapy group and remained stable throughout the remainder of the trial. The rates of progression of diabetic retinopathy were 10% in the group undergoing intensive blood pressure control compared to 9% in the group undergoing standard blood pressure control (adjusted OR 1.23; 95% CI 0.84–1.79; P = 0.29).
The ADVANCE study also found no beneficial effect of intensive blood pressure control on progression of diabetic retinopathy.141 These findings from the ACCORD, ADVANCE, and UKPDS suggest that the benefit in preventing the progression of diabetic retinopathy may be limited to those with type 2 diabetes with uncontrolled high blood pressure.
A number of randomized controlled clinical trials have examined whether specific antihypertensive agents had a protective effect in preventing the progression of retinopathy independent of its effect on blood pressure.142–148 The Epidemiology and Prevention of Diabetes (EURODIAB) Controlled Trial of Lisinopril in Insulin-Dependent Diabetes Mellitus (EUCLID) study sought to examine the role of an ACE inhibitor in reducing the incidence and progression of retinopathy in a group of largely normotensive type 1 diabetic patients, of whom 85% did not have microalbuminuria at baseline.142 This study showed a statistically significant 50% reduction in the progression of retinopathy in those taking lisinopril over a two-year period after adjustment for glycemic control. Progression to proliferative retinopathy was also reduced, although the relation was not statistically significant. There was no significant interaction with blood glucose control. It was postulated that ACE inhibitors might have an effect independent of lowering of blood pressure.143
The Diabetic Retinopathy Candesartan Trials (DIRECT) comprised of three randomized double-masked, parallel, placebo-controlled studies, involving 5231 patients with type 1 or type 2 diabetes. The aim of the trials was to determine the impact of treatment with 32 mg of candesartan, an angiotensin II type 1 receptor blockade, on the incidence and progression of diabetic retinopathy over a 4-year period.144,145,148 The DIRECT-Prevent 1 (n = 1421) involved prevention of incident diabetic retinopathy while the DIRECT-Protect 1 (n = 1905) involved protection against progression of diabetic retinopathy in normoalbuminuric normotensive individuals with type 1 diabetes, respectively, while the DIRECT-Protect 2 (n = 1905) involved protection against progression of diabetic retinopathy in persons with type 2 diabetes who were normoalbuminuric, and either normotensive or only mildly hypertensive.147,148 In the DIRECT-Prevent 1, candesartan had a borderline effect (P = 0.0508) on the primary endpoint, reducing the incidence of retinopathy by two or more steps on the ETDRS severity scale by 18%. In post-hoc analyses, candesartan reduced the incidence of retinopathy by three or more steps by 35% (hazard ratio 0.65; 95% CI 0.48–0.87) in the DIRECT-Prevent 1. In the DIRECT-Protect 1 and 2, candesartan had no statistically significant effect on the progression of retinopathy (defined as three or more steps on the ETDRS severity scale in persons with minimal to moderately severe nonproliferative diabetic retinopathy at baseline). However, in the DIRECT-Protect 2, treatment with candesartan significantly increased a secondary outcome, regression of retinopathy, by 34% (hazard ratio 1.34; 95% CI 1.08–1.68). The effects were limited to those participants with early retinopathy. Thus, the DIRECT, while suggestive of a beneficial effect of candesartan in reducing the incidence of retinopathy, did not achieve the prespecified primary endpoint in any of the three trials.
The ADVANCE study involved more than 11 000 participants and examined whether lowering of blood pressure via a perindopril–indapamide combination provided additional benefit in preventing diabetic macrovascular and microvascular complications.141 Although mean systolic and diastolic blood pressure reduction by 5.6 mmHg and 2.2 mmHg, respectively, was achieved, there was no reduction in the 4-year incidence or progression of diabetic retinopathy (5.2% in both treatment and placebo groups).
The Renin-Angiotensin System Study (RASS) was a multicenter controlled trial involving 285 normotensive patients with type 1 diabetes and normoalbuminuria and who were randomly assigned to receive losartan (100 mg daily), enalapril (20 mg daily), or placebo and followed for 5 years.146 It showed that, as compared with placebo, the odds of retinopathy progression by two or more steps was reduced by 65% with enalapril (OR 0.35; 95% CI 0.14–0.85) and by 70% with losartan (OR 0.30; 95% CI 0.12–0.73), independently of changes in blood pressure.
Proteinuria and diabetic nephropathy
Data from most studies show an association between the prevalence of diabetic nephropathy, as manifest by microalbuminuria or gross proteinuria, and diabetic retinopathy.2,3,17,22,23,26,53,77,149,150 There are anecdotal reports of patients with renal failure having more severe macular edema that improves after dialysis or renal transplantation. Lipid, rheological, and platelet abnormalities associated with nephropathy may be involved in the pathogenesis of retinopathy. In the WESDR, in those with type 1 diabetes, the relative risk of proliferative retinopathy developing over four years in those with gross proteinuria at baseline was 2.32 (95% CI 1.40–3.83) compared with those without gross proteinuria.149 However, after controlling for other relevant risk factors, the relationship was of borderline significance. For the older-onset group with type 2 diabetes in the WESDR taking insulin, the relative risk was 2.02 (95% CI 0.91–4.44), and for those not taking insulin it was 1.13 (95% CI 0.15–8.50).
A greater proportion of those with type 1 diabetes participating in a cohort study in Pittsburgh who had microalbuminuria or overt nephropathy at entry to the study progressed to proliferative disease over a 2-year follow-up.151 However, in the same study nephropathy at baseline was not associated with overall progression of retinopathy. Data from these studies suggest that in those with type 1 diabetes, gross proteinuria is a risk indicator for proliferative retinopathy. These patients may benefit from having regular ophthalmologic evaluation. There have been no clinical trial data to suggest that interventions that prevent or slow diabetic nephropathy will reduce the incidence and progression of retinopathy.
Serum lipids and lipid lowering
Macular edema is an important cause of loss of vision in people with diabetes.152 Hard exudate, a lipoprotein deposit, is often associated with macular edema. Data from early clinical studies showed an association of elevated plasma triglycerides and lipids with hard exudate.153
In the WESDR, higher serum total cholesterol was associated with higher prevalence of retinal hard exudates in both the younger- and the older-onset groups taking insulin but not in those with type 2 diabetes using oral hypoglycemic agents.154 In the ETDRS, higher levels of serum lipids (triglycerides, low-density lipoproteins, and very-low-density lipoproteins) at baseline were associated with increased risk of developing hard exudates in the macula and decreased visual acuity.155 In a study of Mexican patients with type 2 diabetes, Santos et al.88 showed the frequency of severe retinal hard exudates was higher in those with the epsilon4 allele polymorphism of the apolipoprotein E gene.
While small pilot studies suggest possible efficacy of statin therapy in preventing or reducing the severity of macular edema there are few large clinical trials showing the efficacy of statins of other lipid-lowering agents in reducing the progression of retinopathy, the incidence of macular edema or the loss of vision.121,156–158 One is the ACCORD Lipid study, which enrolled a total of 1593 persons with type 2 diabetes and examined whether a “therapeutic strategy of treatment with fenofibrate and statins that raises the serum high-density lipoprotein cholesterol and lowers triglyceride levels in the context of desirable levels of serum LDL cholesterol and good glycemic control reduces the incidence of macular edema and progression of retinopathy compared to a strategy that only achieves desirable levels of LDL cholesterol and glycemic control using statins alone.” Serum triglycerides fell from 162 mg/dL at baseline to 120 mg/dL in the fenofibrate treatment group as compared with a decrease to 147 mg/dL in the placebo group after 1 year (P < 0.001). The rate of progression of diabetic retinopathy at 4 years was 6.5% in the fenofibrate treatment group compared to 10.2% in the placebo group (adjusted OR 0.60; 95% CI 0.42–0.87; P = 0.006). These findings are consistent with the findings from the Fenofibrate Intervention and Event Lowering in Diabetes (FIELD) study, a randomized trial of monotherapy with fenofibrate, which showed a significant reduction in the need for laser therapy for either macular edema or proliferative retinopathy in the fenofibrate treatment group as compared with the placebo group (3.4% vs 4.9%, P < 0.001).159 These findings suggest a beneficial effect of the use of fenofibrate therapy in diabetic patients with elevated triglycerides at risk of progression of diabetic retinopathy and macular edema.
Smoking
Smoking would be expected to be associated with retinopathy because it is known to cause tissue hypoxia by increasing blood carbon monoxide levels, which causes vasoconstriction of the small blood vessels.160 Additionally, smoking may lead to increased platelet aggregation and adhesiveness.161 However, most epidemiologic data show no relationship between cigarette smoking and the incidence or progression of diabetic retinopathy.14,23,26,77,79,162–164 In the WESDR, cigarette smoking was not associated with the 4- or 10-year incidence or progression of diabetic retinopathy nor of macular edema.163,164 Despite this, diabetic patients should be advised not to smoke because of an increased risk of cardiovascular and respiratory disease, to which persons with diabetes are already prone, as well as cancer. In the WESDR, after controlling for other risk factors, younger-onset people who smoked were 2.4 times as likely and older-onset people were 1.6 times as likely to die as those who did not smoke.165
Alcohol
Because moderate alcohol consumption is associated with decreased platelet aggregation and adhesiveness, improved glycemic control, and reduction of inflammation, one might anticipate a possible protective effect in reducing the incidence and progression of retinopathy.166–168 Data from one study suggested such a beneficial effect, while that from another study suggested an increased risk of proliferative retinopathy.169,170 No relation between alcohol consumption and diabetic retinopathy was found in a population-based study in Australia.32 In the UKPDS, a relation of increased alcohol consumption to increased severity of retinopathy was found only in men with newly diagnosed type 2 diabetes.38 In the EURODIAB Prospective Study of Complications in persons with type 1 diabetes, alcohol consumption was associated with a reduction in progression of diabetic retinopathy.171 In the ADVANCE Retinopathy Measurements (ADREM), a clinical trial of persons with type 2 diabetes, there was no relation of alcohol consumption to progression of diabetic retinopathy, but for unknown reasons, a decline in the visual acuity at follow-up was seen in those who consumed alcohol when compared with those who abstained from alcohol.172 In the WESDR, alcohol consumption was associated with a lower frequency of proliferative retinopathy in persons with type 1 diabetes.173 There was no relationship, however, between alcohol consumption at the 4-year examination and the incidence and progression of retinopathy in either the younger- or older-onset groups at the 10-year follow-up,174 nor was there a relation to a change in visual acuity. Of interest in the WESDR was an association of reduction in cardiovascular disease mortality in persons with type 1 diabetes who consumed an average of one drink of alcohol per day.175
Body mass index (BMI)
The relationship between diabetic retinopathy and BMI is inconsistent among various studies.2,14,77,80,176–179 In the WESDR, body mass was inversely related to the presence or severity of diabetic retinopathy only in persons with type 2 diabetes not using insulin.179 While controlling for other risk factors, older-onset persons in the WESDR who were underweight at baseline (BMI <20 kg/m2 for both men and women) were three times as likely to develop retinopathy as those who were of normal weight (BMI of 20–27.7 kg/m2 for men and 20–27.2 kg/m2 for women). It has been speculated that underweight older-onset subjects are more likely to be in a “severe” phase of their type 2 diabetes or have late-onset type 1 diabetes. Persons obese at baseline (BMI >31.0 kg/m2 for men and >32.1 kg/m2 for women) were 35% more likely to have progression of retinopathy and 41% more likely to develop proliferative retinopathy than those who were of normal weight at baseline. However, these associations were not statistically significant.
Physical activity
Physical activity, through its beneficial effect on glycemic control, would be expected to be associated with decreased prevalence and incidence of diabetic retinopathy.180 However, few epidemiologic data are available describing the relationship between diabetic retinopathy and physical activity.177,181–183 One study found no relationship between participating in team sports in high school or college and a history of laser treatment or blindness in people with type 1 diabetes.177 The same group reported that physical activity in youth did not relate to complications of diabetes.181,182 In the WESDR, women diagnosed with diabetes before 14 years of age who participated in team sports were less likely to have proliferative diabetic retinopathy than those who did not.183 There was no association between physical activity or leisure time energy expenditure and the presence and severity of diabetic retinopathy in men. In addition, physical activity was associated with either an increased or decreased risk of progression of retinopathy or the development of proliferative retinopathy over a 6-year interval in people with type 1 diabetes in this study.184
Socioeconomic status
Inconsistent relationships between socioeconomic status and retinopathy severity have been reported.31,77,185,186 Hanna et al.185 reported a significant correlation between proliferative retinopathy and occupational status (working class) or lower income in a case–control study of 49 people with type 1 diabetes. Haffner et al.186 did not find a relationship between socioeconomic status, measured using a combination of the Duncan Index, educational attainment or income, and severe retinopathy in 343 Mexican Americans and 79 non-Hispanic whites with type 2 diabetes in San Antonio. West et al.77 also did not observe a relationship between retinopathy severity and education level in a population of Oklahoma Indians with type 2 diabetes. In the Proyecto VER cohort of Mexican Americans, low income, once adjusted for other factors, was related to proliferative retinopathy (OR 3.93; 95% CI 1.31–11.80).31
There are few studies that have examined the relation of socioeconomic factors to incidence and progression of diabetic retinopathy.62,187 In the New Jersey 725 study, low socioeconomic status was significantly associated with the 6-year incidence of macular edema but not incidence or progression of diabetic retinopathy. In that study, education, income, medical or eye care, and health insurance at baseline were not significantly different between patients with and without macular edema at follow-up. In the WESDR, except for an association of lower incidence of proliferative retinopathy in women with type 1 diabetes of 25 years of age or older with more education, socioeconomic status (education level and Duncan Socioeconomic Index score) was not associated with risk of developing proliferative retinopathy.187 It may be that the absence of a relationship of socioeconomic status and retinopathy severity in the WESDR and San Antonio Study is related to the lack of an association of glycemia to socioeconomic status in these populations.
Hormone and reproductive exposures in women
In the WESDR, menarchal status at the baseline examination was related to the prevalence and severity of retinopathy96 as noted previously in the section on puberty. Sex hormones have been hypothesized to explain the higher risk of developing retinopathy after puberty as well.96 However, it seems unlikely that increased estrogen associated with the onset of puberty is responsible for the increase in retinopathy. Use of oral contraceptives, which contain estrogens as well as progestins, does not appear to increase the risk of retinopathy188 nor does use of hormone replacement therapy.189
Pregnancy, a condition associated with high levels of estrogens, is associated with more rapid progression of retinopathy. When pregnant women were compared with nonpregnant diabetic women of similar age and duration of diabetes, the pregnant women were more likely to develop retinopathy if they had not had it before or to have greater likelihood of progression of their retinopathy when the groups were followed for a time interval roughly equal to the length of the pregnancy.190 This remained true after controlling for level of glycemia and blood pressure. Similar findings have been reported by others.191,192 This may occur in those with type 2 as well as type 1 diabetes.193 A complementary finding was reported by Lovestam-Adrian et al.194 who found that progression of retinopathy was more likely to occur in pre-eclamptic diabetic women than in those without pre-eclampsia. Similarly, Rosenn et al.195 found that glycemia and blood pressure were important determinants of progression of retinopathy during pregnancy. While these are important factors in nonpregnant women, pregnancy in all likelihood accelerates the process. Other investigators have found that progression of retinopathy was related to prior duration of diabetes.196,197 Because duration of diabetes is a risk factor for progression of retinopathy irrespective of pregnancy status, this is also not a novel finding. However, it may be useful information in tailoring a follow-up plan for eye care during pregnancy. It has been suggested that laser treatment before pregnancy for women with moderate to severe retinopathy be considered to protect against progression during pregnancy,198 although a clinical trial of the efficacy of such an approach is lacking. Aside from diabetic retinopathy, diabetic macular edema that occurs during pregnancy poses a threat to vision and this may benefit from laser treatment,199 although it is unclear how many women with this sight-threatening complication will have remission after parturition.
There are limited data to suggest that serum IGF-1 levels are associated with progression of retinopathy during pregnancy.200,201 A small study was performed to determine whether the vasoconstrictor endothelin-1 (ET-1), which is elevated in hypertension and diabetes, was associated with severity of retinopathy in pregnancy. While diabetic women had higher levels of ET-1 in pregnancy than nondiabetic women in the same trimester, there was no relationship to severity of diabetic retinopathy.202 The study was hampered by its small number of patients and so must be regarded as inconclusive.
Despite the apparent deleterious effect of pregnancy on retinopathy, however, the number of past pregnancies was unrelated to the severity of diabetic retinopathy in younger-onset women in the WESDR.189 Similarly, in a study in Oulu, Finland, there appeared to be little influence of second and subsequent pregnancies on retinopathy.203 These data may be interpreted to suggest that pregnancy imparts a transient increased risk for incidence or progression of retinopathy. However, since there may be decreased fertility that results from more severe or more complicated diabetes, it may be that those who sustain repeated pregnancies are more robust, and this is reflected in relative protection against more severe or more progressive retinopathy.
Another source of exposure to estrogens is hormone replacement therapy. Although this treatment has come under intense scrutiny, there is no evidence to suggest that exposure to these medicines increases the risk of diabetic retinopathy.189
Comorbidity and mortality
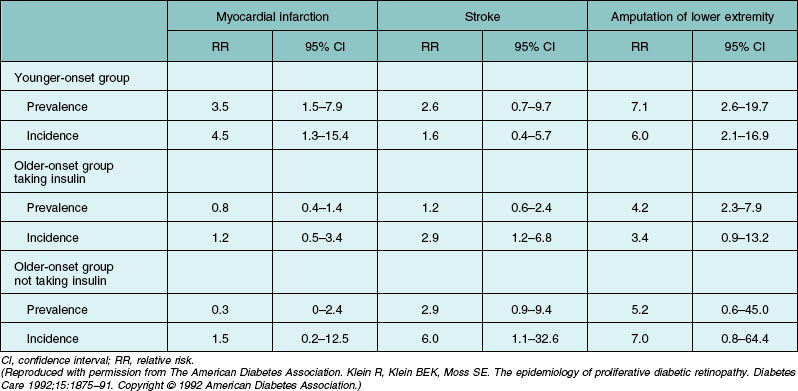
In the WESDR, the risk of developing a heart attack, stroke, diabetic nephropathy, and amputation was higher in those with proliferative diabetic retinopathy compared to those with no or minimal nonproliferative retinopathy at baseline (Table 45.4).204 In persons with type 1 diabetes, while controlling for age and sex, retinopathy severity was associated with all-cause and ischemic heart disease mortality and in persons with type 2 diabetes with all-cause, ischemic heart disease mortality, and stroke.205 After controlling for systemic factors, the relations remained only for all-cause and stroke mortality in persons with type 2 diabetes. These data suggest that the presence of more severe retinopathy in diabetic patients is an indicator for increased risk of ischemic heart disease death, and may identify individuals who should be under care for cardiovascular disease. This had been reported by others.206–208 The higher risk of cardiovascular disease in persons with more severe retinopathy may be partially due to the association of severe retinopathy with cardiovascular disease risk factors such as increased fibrinogen, increased platelet aggregation, hyperglycemia, and hypertension.
New medical interventions
Aside from glycemic, blood pressure, and lipid control, no other medical intervention has been demonstrated to reduce the incidence and progression of diabetic retinopathy. Randomized controlled clinical trials of inhibitors of aldose reductase, protein kinase C, and metalloproteinases have not shown efficacy of the intervention in preventing the incidence and progression of retinopathy in people with diabetes.209 Controlled clinical trials of intravitreally administered vascular endothelial growth factor (VEGF) inhibitors and steroid in the treatment of diabetic macular edema are presented elsewhere.210
Public health applications of epidemiological data
Based on the observation that many diabetic patients with severe retinopathy were not receiving dilated eye examinations, guidelines for these examinations were developed and implemented using epidemiological data.95,211,212 The guidelines recommended that after the initial screening examination, “subsequent examinations for both type 1 and type 2 diabetic patients should be repeated annually by an ophthalmologist or optometrist who is knowledgeable and experienced in diagnosing the presence of diabetic retinopathy, and is aware of its management.”95 However, a number of reports have demonstrated poor compliance with these guidelines.213–215 In one study, only 16% of diabetic patients who received primary care in upstate New York received an annual ophthalmic examination using funduscopy by an optometrist or ophthalmologist in two consecutive years.216 Reasons for poor compliance with the recommended ADA guidelines have been provided by others.213,217,218 Physician factors may explain the reasons that patients may not be receiving optimal care. In one study, 52% of primary care physicians reported that they performed in-office ophthalmoscopic examinations, 90% of which were through undilated pupils, an approach shown to have limited sensitivity to detecting vision-threatening retinopathy in other studies.217 Moss et al.218 studied persons with type 1 and type 2 diabetes for 10 or more years who were participating in the WESDR. In those not having a dilated eye examination in the previous year, 31% and 35% of those with type 1 diabetes and type 2 diabetes, respectively, reported not having been told by their primary care doctors that they needed one.
Patient factors also explain some of the reasons why guidelines for dilated eye examinations are not being followed. In the WESDR, among those not having a dilated eye examination in the previous year, 79% and 71% of those with type 1 diabetes and type 2 diabetes, respectively, reported not having had one because they had no problems with their eyes, and 32% and 11% said they were too busy. These data suggest the importance of educating patients with diabetes about the asymptomatic nature of diabetic retinopathy, and the benefits of a dilated eye examination. This has become an important priority of the National Eye Institute (National Eye Health Education Program) and other specialty organizations.219 Of course, patients may elect not to follow the advice given or deny its importance. Another reason is that of cost. Moss et al.218 found that the ability to afford eye care was also a reason patients gave for not having such care. In that study, 30% of persons with type 1 diabetes and 12% of those with type 2 diabetes said they could not afford an examination.
Reexamination of WESDR data by Batchelder and Barricks220 led them to conclude that based on the “remarkably low incidence of treatable conditions over 4 years for patients with retinopathy levels 21 or less and over 10 years for patients with no retinopathy at their baseline examination” that “these data do not suggest any difference in effectiveness for screening intervals of 1, 2, 3 or even 4 years for this group of low-risk patients.” Others, also using models, have suggested in those with type 2 diabetes without retinopathy, that examinations every 2 years rather than yearly would be adequate to detect vision threatening retinopathy.221 The National Committee for Quality Assurance222 released the Health Plan Employer Data and Information Set (HEDIS) 1999 draft which suggested examinations for retinopathy every other year if there was no evidence of retinopathy in the previous year’s eye exam, persons were not taking insulin, and if the A1c was less than 8% (unpublished data). However, the WESDR data showed that in individuals with type 2 diabetes with no retinopathy present at baseline, 4 per 1000 developed proliferative retinopathy and 10 per 1000 developed clinically significant macular edema over a 4-year period.50–52
There is a need to examine the issue of the sensitivity of the screens in detecting the presence of retinopathy. The epidemiologic data are based on detection of retinopathy by skilled graders using standardized protocols under study conditions to grade stereoscopic color fundus photographs of the Diabetic Retinopathy Study seven standard fields. Studies have demonstrated a variable sensitivity, in practice as low as 33%, in the detection of retinopathy by ophthalmoscopy in people with diabetes.223 Newer screening approaches, including digital cameras with central reading centers, are being used for the screening of diabetic patients not under the care of an ophthalmologist. However, a recent meta-analysis showed that retinal photography by a photographer with no specialist medical or eye qualifications (i.e., a health worker or nurse), without using pupil-dilating eye drops (the outreach model), appears unlikely to miss cases of diabetic retinopathy that screening methods using mydriasis or a photographer with specialist medical or eye qualifications would detect.224 There is a need to conduct further epidemiological studies and controlled clinical trials to evaluate the interval and type of ophthalmic screening in persons with diabetes and no retinopathy in various healthcare settings to provide better evidence of efficacy of specific approaches to validate new guidelines and screening approaches.
1 Klein R, Klein BE, Moss SE, et al. Prevalence of diabetes mellitus in southern Wisconsin. Am J Epidemiol. 1984;119:54–61.
2 Klein R, Klein BE, Moss SE, et al. The Wisconsin Epidemiologic Study of Diabetic Retinopathy. II. Prevalence and risk of diabetic retinopathy when age at diagnosis is less than 30 years. Arch Ophthalmol. 1984;102:520–526.
3 Klein R, Klein BE, Moss SE, et al. The Wisconsin Epidemiologic Study of Diabetic Retinopathy. III. Prevalence and risk of diabetic retinopathy when age at diagnosis is 30 or more years. Arch Ophthalmol. 1984;102:527–532.
4 Klein R, Klein BE, Moss SE, et al. The Wisconsin Epidemiologic Study of Diabetic Retinopathy. IV. Diabetic macular edema. Ophthalmology. 1984;91:1464–1474.
5 Kempen JH, O’Colmain BJ, Leske MC, et al. The prevalence of diabetic retinopathy among adults in the United States. Arch Ophthalmol. 2004;122:552–563.
6 Klein R, Klein BE. Vision disorders in diabetes. In: Harris MI, Cowie CC, Stern MP, et al. Diabetes in America. 2nd ed. Bethesda, MD: National Diabetes Data Group; 1995:293–338. NIH Publication No. 95–1468.
7 Houston A. Retinopathy in the Poole area: An epidemiological inquiry. In: Eschwege E, ed. Advances in diabetes epidemiology. Amsterdam: Elsevier, 1982.
8 Dwyer MS, Melton LJ, III., Ballard DJ, et al. Incidence of diabetic retinopathy and blindness: a population-based study in Rochester, Minnesota. Diabetes Care. 1985;8:316–322.
9 Dorf A, Ballintine EJ, Bennett PH, et al. Retinopathy in Pima Indians. Relationships to glucose level, duration of diabetes, age at diagnosis of diabetes, and age at examination in a population with a high prevalence of diabetes mellitus. Diabetes. 1976;25:554–560.
10 Bennett PH, Rushforth NB, Miller M, et al. Epidemiologic studies of diabetes in the Pima Indians. Recent Prog Horm Res. 1976;32:333–376.
11 West KM, Erdreich LJ, Stober JA. A detailed study of risk factors for retinopathy and nephropathy in diabetes. Diabetes. 1980;29:501–508.
12 Kahn HA, Leibowitz HM, Ganley JP, et al. The Framingham Eye Study. I. Outline and major prevalence findings. Am J Epidemiol. 1977;106:17–32.
13 King H, Balkau B, Zimmet P, et al. Diabetic retinopathy in Nauruans. Am J Epidemiol. 1983;117:659–667.
14 Ballard DJ, Melton LJ, III., Dwyer MS, et al. Risk factors for diabetic retinopathy: a population-based study in Rochester, Minnesota. Diabetes Care. 1986;9:334–342.
15 Danielsen R, Jonasson F, Helgason T. Prevalence of retinopathy and proteinuria in type 1 diabetics in Iceland. Acta Med Scand. 1982;212:277–280.
16 Constable IJ, Knuiman MW, Welborn TA, et al. Assessing the risk of diabetic retinopathy. Am J Ophthalmol. 1984;97:53–61.
17 Knuiman MW, Welborn TA, McCann VJ, et al. Prevalence of diabetic complications in relation to risk factors. Diabetes. 1986;35:1332–1339.
18 Sjolie AK. Ocular complications in insulin treated diabetes mellitus. An epidemiological study. Acta Ophthalmol Suppl. 1985;172:1–77.
19 Nielsen NV. Diabetic retinopathy II. The course of retinopathy in diabetics treated with oral hypoglycaemic agents and diet regime alone. A one year epidemiological cohort study of diabetes mellitus. The Island of Falster, Denmark. Acta Ophthalmol (Copenh). 1984;62:266–273.
20 Nielsen NV. Diabetic retinopathy I. The course of retinopathy in insulin-treated diabetics. A one year epidemiological cohort study of diabetes mellitus. The Island of Falster, Denmark. Acta Ophthalmol (Copenh). 1984;62:256–265.
21 Teuscher A, Schnell H, Wilson PW. Incidence of diabetic retinopathy and relationship to baseline plasma glucose and blood pressure. Diabetes Care. 1988;11:246–251.
22 Haffner SM, Fong D, Stern MP, et al. Diabetic retinopathy in Mexican Americans and non-Hispanic whites. Diabetes. 1988;37:878–884.
23 Jerneld B. Prevalence of diabetic retinopathy. A population study from the Swedish island of Gotland. Acta Ophthalmol Suppl. 1988;188:3–32.
24 Hamman RF, Mayer EJ, Moo-Young GA, et al. Prevalence and risk factors of diabetic retinopathy in non-Hispanic whites and Hispanics with NIDDM. San Luis Valley Diabetes Study. Diabetes. 1989;38:1231–1237.
25 McLeod BK, Thompson JR, Rosenthal AR. The prevalence of retinopathy in the insulin-requiring diabetic patients of an English country town. Eye (Lond). 1988;2(Pt 4):424–430.
26 Kostraba JN, Klein R, Dorman JS, et al. The epidemiology of diabetes complications study. IV. Correlates of diabetic background and proliferative retinopathy. Am J Epidemiol. 1991;133:381–391.
27 Fujimoto W, Fukuda M. Natural history of diabetic retinopathy and its treatment in Japan. In: Baba S, Goto Y, Fukui I. Diabetes mellitus in Asia. Amsterdam: Excerpta Medica; 1976:225–231.
28 Kullberg CE, Abrahamsson M, Arnqvist HJ, et al. Prevalence of retinopathy differs with age at onset of diabetes in a population of patients with Type 1 diabetes. Diabet Med. 2002;19:924–931.
29 Lopez IM, Diez A, Velilla S, et al. Prevalence of diabetic retinopathy and eye care in a rural area of Spain. Ophthalmic Epidemiol. 2002;9:205–214.
30 Broadbent DM, Scott JA, Vora JP, et al. Prevalence of diabetic eye disease in an inner city population: the Liverpool Diabetic Eye Study. Eye (Lond). 1999;13(Pt 2):160–165.
31 West SK, Klein R, Rodriguez J, et al. Diabetes and diabetic retinopathy in a Mexican-American population: Proyecto VER. Diabetes Care. 2001;24:1204–1209.
32 McKay R, McCarty CA, Taylor HR. Diabetic retinopathy in Victoria, Australia: the Visual Impairment Project. Br J Ophthalmol. 2000;84:865–870.
33 Toeller M, Buyken AE, Heitkamp G, et al. Prevalence of chronic complications, metabolic control and nutritional intake in type 1 diabetes: comparison between different European regions. EURODIAB Complications Study group. Horm Metab Res. 1999;31:680–685.
34 Leske MC, Wu SY, Hyman L, et al. Diabetic retinopathy in a black population: the Barbados Eye Study. Ophthalmology. 1999;106:1893–1899.
35 Rajala U, Laakso M, Qiao Q, et al. Prevalence of retinopathy in people with diabetes, impaired glucose tolerance, and normal glucose tolerance. Diabetes Care. 1998;21:1664–1669.
36 Harris MI, Klein R, Cowie CC, et al. Is the risk of diabetic retinopathy greater in non-Hispanic blacks and Mexican Americans than in non-Hispanic whites with type 2 diabetes? A U.S. population study. Diabetes Care. 1998;21:1230–1235.
37 Dowse GK, Humphrey AR, Collins VR, et al. Prevalence and risk factors for diabetic retinopathy in the multiethnic population of Mauritius. Am J Epidemiol. 1998;147:448–457.
38 Kohner EM, Aldington SJ, Stratton IM, et al. United Kingdom Prospective Diabetes Study, 30: diabetic retinopathy at diagnosis of non-insulin-dependent diabetes mellitus and associated risk factors. Arch Ophthalmol. 1998;116:297–303.
39 Mitchell P, Smith W, Wang JJ, et al. Prevalence of diabetic retinopathy in an older community. The Blue Mountains Eye Study. Ophthalmology. 1998;105:406–411.
40 Gonzalez Villalpando ME, Gonzalez VC, Arredondo PB, et al. Moderate-to-severe diabetic retinopathy is more prevalent in Mexico City than in San Antonio, Texas. Diabetes Care. 1997;20:773–777.
41 Berinstein DM, Stahn RM, Welty TK, et al. The prevalence of diabetic retinopathy and associated risk factors among Sioux Indians. Diabetes Care. 1997;20:757–759.
42 Kernell A, Dedorsson I, Johansson B, et al. Prevalence of diabetic retinopathy in children and adolescents with IDDM. A population-based multicentre study. Diabetologia. 1997;40:307–310.
43 Collins VR, Dowse GK, Plehwe WE, et al. High prevalence of diabetic retinopathy and nephropathy in Polynesians of Western Samoa. Diabetes Care. 1995;18:1140–1149.
44 Klein R, Klein BE, Moss SE, et al. The Beaver Dam Eye Study. Retinopathy in adults with newly discovered and previously diagnosed diabetes mellitus. Ophthalmology. 1992;99:58–62.
45 Roy MS. Diabetic retinopathy in African Americans with type 1 diabetes: The New Jersey 725: I. Methodology, population, frequency of retinopathy, and visual impairment. Arch Ophthalmol. 2000;118:97–104.
46 Roy MS, Klein R. Macular edema and retinal hard exudates in African Americans with type 1 diabetes: the New Jersey 725. Arch Ophthalmol. 2001;119:251–259.
47 Klein R, Klein BE. Are individuals with diabetes seeing better? A long-term epidemiological perspective. Diabetes. 2010;59:1853–1860.
48 Suh DC, Choi IS, Plauschinat C, et al. Impact of comorbid conditions and race/ethnicity on glycemic control among the US population with type 2 diabetes, 1988–1994 to 1999–2004. J Diabetes Complications. 2010;24:382–391.
49 Ong KL, Cheung BM, Wong LY, et al. Prevalence, treatment, and control of diagnosed diabetes in the U.S. National Health and Nutrition Examination Survey 1999–2004. Ann Epidemiol. 2008;18:222–229.
50 Klein R, Klein BE, Moss SE, et al. The Wisconsin Epidemiologic Study of Diabetic Retinopathy. IX. Four-year incidence and progression of diabetic retinopathy when age at diagnosis is less than 30 years. Arch Ophthalmol. 1989;107:237–243.
51 Klein R, Klein BE, Moss SE, et al. The Wisconsin Epidemiologic Study of Diabetic Retinopathy. X. Four-year incidence and progression of diabetic retinopathy when age at diagnosis is 30 years or more. Arch Ophthalmol. 1989;107:244–249.
52 Klein R, Moss SE, Klein BE, et al. The Wisconsin epidemiologic study of diabetic retinopathy. XI. The incidence of macular edema. Ophthalmology. 1989;96:1501–1510.
53 Klein R, Klein BE, Moss SE, et al. The Wisconsin Epidemiologic Study of Diabetic Retinopathy. XIV. Ten-year incidence and progression of diabetic retinopathy. Arch Ophthalmol. 1994;112:1217–1228.
54 Henricsson M, Nystrom L, Blohme G, et al. The incidence of retinopathy 10 years after diagnosis in young adult people with diabetes: results from the nationwide population-based Diabetes Incidence Study in Sweden (DISS). Diabetes Care. 2003;26:349–354.
55 Lloyd CE, Becker D, Ellis D, et al. Incidence of complications in insulin-dependent diabetes mellitus: a survival analysis. Am J Epidemiol. 1996;143:431–441.
56 Klein R, Palta M, Allen C, et al. Incidence of retinopathy and associated risk factors from time of diagnosis of insulin-dependent diabetes. Arch Ophthalmol. 1997;115:351–356.
57 Tudor SM, Hamman RF, Baron A, et al. Incidence and progression of diabetic retinopathy in Hispanics and non-Hispanic whites with type 2 diabetes. San Luis Valley Diabetes Study, Colorado. Diabetes Care. 1998;21:53–61.
58 Klein R, Klein BE, Moss SE, et al. The Wisconsin Epidemiologic Study of Diabetic Retinopathy. XVII. The 14-year incidence and progression of diabetic retinopathy and associated risk factors in type 1 diabetes. Ophthalmology. 1998;105:1801–1815.
59 Porta M, Sjoelie AK, Chaturvedi N, et al. Risk factors for progression to proliferative diabetic retinopathy in the EURODIAB Prospective Complications Study. Diabetologia. 2001;44:2203–2209.
60 Ling R, Ramsewak V, Taylor D, et al. Longitudinal study of a cohort of people with diabetes screened by the Exeter Diabetic Retinopathy Screening Programme. Eye (Lond). 2002;16:140–145.
61 Younis N, Broadbent DM, Vora JP, et al. Incidence of sight-threatening retinopathy in patients with type 2 diabetes in the Liverpool Diabetic Eye Study: a cohort study. Lancet. 2003;361:195–200.
62 Roy MS, Affouf M. Six-year progression of retinopathy and associated risk factors in African American patients with type 1 diabetes mellitus: the New Jersey 725. Arch Ophthalmol. 2006;124:1297–1306.
63 Varma R, Choudhury F, Klein R, et al. Four-year incidence and progression of diabetic retinopathy and macular edema: the Los Angeles Latino Eye Study. Am J Ophthalmol. 2010;149:752–761.
64 Hovind P, Tarnow L, Rossing K, et al. Decreasing incidence of severe diabetic microangiopathy in type 1 diabetes. Diabetes Care. 2003;26:1258–1264.
65 Bojestig M, Arnqvist HJ, Karlberg BE, et al. Unchanged incidence of severe retinopathy in a population of Type 1 diabetic patients with marked reduction of nephropathy. Diabet Med. 1998;15:863–869.
66 Nordwall M, Bojestig M, Arnqvist HJ, et al. Declining incidence of severe retinopathy and persisting decrease of nephropathy in an unselected population of Type 1 diabetes: the Linköping Diabetes Complications Study. Diabetologia. 2004;47:1266–1272.
67 Pambianco G, Costacou T, Ellis D, et al. The 30-year natural history of type 1 diabetes complications: the Pittsburgh Epidemiology of Diabetes Complications Study experience. Diabetes. 2006;55:1463–1469.
68 Klein R, Knudtson MD, Lee KE, et al. The Wisconsin Epidemiologic Study of Diabetic Retinopathy. XXII. The twenty-five-year progression of retinopathy in persons with type 1 diabetes. Ophthalmology. 2008;115:1859–1868.
69 Klein R, Knudtson MD, Lee KE, et al. The Wisconsin Epidemiologic Study of Diabetic Retinopathy. XXIII. The twenty-five-year incidence of macular edema in persons with type 1 diabetes. Ophthalmology. 2009;116:497–503.
70 Klein R, Lee KE, Knudtson MD, et al. Changes in visual impairment prevalence by period of diagnosis of diabetes: the Wisconsin Epidemiologic Study of Diabetic Retinopathy. Ophthalmology. 2009;116:1937–1942.
71 Klein R, Lee KE, Gangnon RE, et al. The 25-year incidence of visual impairment in type 1 diabetes mellitus. The Wisconsin Epidemiologic Study of Diabetic Retinopathy. Ophthalmology. 2010;117:63–70.
72 Klein R, Sharrett AR, Klein BE, et al. The association of atherosclerosis, vascular risk factors, and retinopathy in adults with diabetes : the atherosclerosis risk in communities study. Ophthalmology. 2002;109:1225–1234.
73 Klein R, Marino EK, Kuller LH, et al. The relation of atherosclerotic cardiovascular disease to retinopathy in people with diabetes in the Cardiovascular Health Study. Br J Ophthalmol. 2002;86:84–90.
74 Wong TY, Klein R, Islam FM, et al. Diabetic retinopathy in a multi-ethnic cohort in the United States. Am J Ophthalmol. 2006;141:446–455.
75 Zhang X, Saaddine JB, Chou CF, et al. Prevalence of diabetic retinopathy in the United States, 2005–2008. JAMA. 2010;304:649–656.
76 Varma R, Torres M, Pena F, et al. Prevalence of diabetic retinopathy in adult Latinos: the Los Angeles Latino eye study. Ophthalmology. 2004;111:1298–1306.
77 West KM, Erdreich LJ, Stober JA. A detailed study of risk factors for retinopathy and nephropathy in diabetes. Diabetes. 1980;29:501–508.
78 Lee ET, Lee VS, Lu M, et al. Development of proliferative retinopathy in NIDDM. A follow-up study of American Indians in Oklahoma. Diabetes. 1992;41:359–367.
79 Lee ET, Lee VS, Kingsley RM, et al. Diabetic retinopathy in Oklahoma Indians with NIDDM. Incidence and risk factors. Diabetes Care. 1992;15:1620–1627.
80 Nelson RG, Newman JM, Knowler WC, et al. Incidence of end-stage renal disease in type 2 (non-insulin-dependent) diabetes mellitus in Pima Indians. Diabetologia. 1988;31:730–736.
81 Looker HC, Krakoff J, Knowler WC, et al. Longitudinal studies of incidence and progression of diabetic retinopathy assessed by retinal photography in pima indians. Diabetes Care. 2003;26:320–326.
82 The Diabetes Control and Complications Trial Research Group. Clustering of long-term complications in families with diabetes in the diabetes control and complications trial. The Diabetes Control and Complications Trial Research Group. Diabetes. 1997;46:1829–1839.
83 Rema M, Saravanan G, Deepa R, et al. Familial clustering of diabetic retinopathy in South Indian Type 2 diabetic patients. Diabet Med. 2002;19:910–916.
84 Fukuda M, Nakano S, Imaizumi N, et al. Mitochondrial DNA mutations are associated with both decreased insulin secretion and advanced microvascular complications in Japanese diabetic subjects. J Diabetes Complications. 1999;13:277–283.
85 Demaine A, Cross D, Millward A. Polymorphisms of the aldose reductase gene and susceptibility to retinopathy in type 1 diabetes mellitus. Invest Ophthalmol Vis Sci. 2000;41:4064–4068.
86 Yamamoto T, Sato T, Hosoi M, et al. Aldose reductase gene polymorphism is associated with progression of diabetic nephropathy in Japanese patients with type 1 diabetes mellitus. Diabetes Obes Metab. 2003;5:51–57.
87 Kankova K, Muzik J, Karaskova J, et al. Duration of non-Insulin-dependent diabetes mellitus and the TNF-beta NcoI genotype as predictive factors in proliferative diabetic retinopathy. Ophthalmologica. 2001;215:294–298.
88 Santos A, Salguero ML, Gurrola C, et al. The epsilon4 allele of apolipoprotein E gene is a potential risk factor for the severity of macular edema in type 2 diabetic Mexican patients. Ophthalmic Genet. 2002;23:13–19.
89 Kao Y, Donaghue KC, Chan A, et al. Paraoxonase gene cluster is a genetic marker for early microvascular complications in type 1 diabetes. Diabet Med. 2002;19:212–215.
90 Taverna MJ, Sola A, Guyot-Argenton C, et al. eNOS4 polymorphism of the endothelial nitric oxide synthase predicts risk for severe diabetic retinopathy. Diabet Med. 2002;19:240–245.
91 Kamiuchi K, Hasegawa G, Obayashi H, et al. Intercellular adhesion molecule-1 (ICAM-1) polymorphism is associated with diabetic retinopathy in type 2 diabetes mellitus. Diabet Med. 2002;19:371–376.
92 Matsubara Y, Murata M, Maruyama T, et al. Association between diabetic retinopathy and genetic variations in alpha2beta1 integrin, a platelet receptor for collagen. Blood. 2000;95:1560–1564.
93 Yang B, Cross DF, Ollerenshaw M, et al. Polymorphisms of the vascular endothelial growth factor and susceptibility to diabetic microvascular complications in patients with type 1 diabetes mellitus. J Diabetes Complications. 2003;17:1–6.
94 Liew G, Klein R, Wong TY. The role of genetics in susceptibility to diabetic retinopathy. Int Ophthalmol Clin. 2009;49:35–52.
95 Fong DS, Aiello L, Gardner TW, et al. Diabetic retinopathy. Diabetes Care. 2003;26(Suppl 1):S99–S102.
96 Klein BE, Moss SE, Klein R. Is menarche associated with diabetic retinopathy? Diabetes Care. 1990;13:1034–1038.
97 Frost-Larsen K, Starup K. Fluorescein angiography in diabetic children. A follow-up. Acta Ophthalmol (Copenh). 1980;58:355–360.
98 Murphy RP, Nanda M, Plotnick L, et al. The relationship of puberty to diabetic retinopathy. Arch Ophthalmol. 1990;108:215–218.
99 Kostraba JN, Dorman JS, Orchard TJ, et al. Contribution of diabetes duration before puberty to development of microvascular complications in IDDM subjects. Diabetes Care. 1989;12:686–693.
100 Harris MI, Klein R, Welborn TA, et al. Onset of NIDDM occurs at least 4–7 yr before clinical diagnosis. Diabetes Care. 1992;15:815–819.
101 Aiello LM, Rand LI, Briones JC, et al. Diabetic retinopathy in Joslin Clinic patients with adult-onset diabetes. Ophthalmology. 1981;88:619–623.
102 West KM. Epidemiology of diabetes and its vascular lesions. New York: Elsevier; 1978.
103 The Diabetes Control and Complications Trial Research Group. The effect of intensive treatment of diabetes on the development and progression of long-term complications in insulin-dependent diabetes mellitus. N Engl J Med. 1993;329:977–986.
104 Diabetes Control and Complications Trial Research Group. The effect of intensive diabetes treatment on the progression of diabetic retinopathy in insulin-dependent diabetes mellitus. Arch Ophthalmol. 1995;113:36–51.
105 Diabetes Control and Complications Trial Research Group. Progression of retinopathy with intensive versus conventional treatment in the Diabetes Control and Complications Trial. Ophthalmology. 1995;102:647–661.
106 Diabetes Control and Complications Trial Research Group. The absence of a glycemic threshold for the development of long-term complications: the perspective of the Diabetes Control and Complications Trial. Diabetes. 1996;45:1289–1298.
107 The Kroc Collaborative Study Group. Diabetic retinopathy after two years of intensified insulin treatment. Follow-up of the Kroc Collaborative Study. JAMA. 1988;260:37–41.
108 Lauritzen T, Frost-Larsen K, Larsen HW, et al. Two-year experience with continuous subcutaneous insulin infusion in relation to retinopathy and neuropathy. Diabetes. 1985;34(Suppl. 3):74–79.
109 Dahl-Jørgensen K, Brinchmann-Hansen O, Hanssen KF, et al. Rapid tightening of blood glucose control leads to transient deterioration of retinopathy in insulin dependent diabetes mellitus: the Oslo study. Br Med J (Clin Res Ed). 1985;290:811–815.
110 Warram JH, Manson JE, Krolewski AS. Glycosylated hemoglobin and the risk of retinopathy in insulin-dependent diabetes mellitus. N Engl J Med. 1995;332:1305–1306.
111 The Diabetes Control and Complications Trial Research Group. Lifetime benefits and costs of intensive therapy as practiced in the diabetes control and complications trial. JAMA. 1996;276:1409–1415.
112 The Diabetes Control and Complications Trial/Epidemiology of Diabetes Interventions and Complications Research Group. Retinopathy and nephropathy in patients with type 1 diabetes four years after a trial of intensive therapy. N Engl J Med. 2000;342:381–389.
113 The Epidemiology of Diabetes Interventions and Complications (EDIC) Study Group. Sustained effect of intensive treatment of type 1 diabetes mellitus on development and progression of diabetic nephropathy. JAMA. 2003;290:2159–2167.
114 Cooper ME. Metabolic memory: implications for diabetic vascular complications. Pediatr Diabetes. 2009;10:343–346.
115 Holman RR, Paul SK, Bethel MA, et al. 10-year follow-up of intensive glucose control in type 2 diabetes. N Engl J Med. 2008;359:1577–1589.
116 United Kingdom Prospective Diabetes Study (UKPDS) Group. Intensive blood-glucose control with sulphonylureas or insulin compared with conventional treatment and risk of complications in patients with type 2 diabetes (UKPDS 33). Lancet. 1998;352:837–853.
117 United Kingdom Prospective Diabetes Study (UKPDS) Group. Effect of intensive blood-glucose control with metformin on complications in overweight patients with type 2 diabetes (UKPDS 34). Lancet. 1998;352:854–865.
118 Gray A, Raikou M, McGuire A, et al. Cost effectiveness of an intensive blood glucose control policy in patients with type 2 diabetes: economic analysis alongside randomised controlled trial (UKPDS 41). United Kingdom Prospective Diabetes Study Group. BMJ. 2000;320:1373–1378.
119 Duckworth WC, McCarren M, Abraira C. Glucose control and cardiovascular complications: the VA Diabetes Trial. Diabetes Care. 2001;24:942–945.
120 Duckworth WC, Abraira C, Moritz T, et al. Glucose control and vascular complications in veterans with type 2 diabetes. N Engl J Med. 2009;360:129–139.
121 Chew EY, Ambrosius WT, Davis MD, et al. Effects of medical therapies on retinopathy progression in type 2 diabetes. N Engl J Med. 2010;363:233–244.
122 Ismail-Beigi F, Craven T, Banerji MA, et al. Effect of intensive treatment of hyperglycaemia on microvascular outcomes in type 2 diabetes: an analysis of the ACCORD randomised trial. Lancet. 2010;376:419–430.
123 Patel A, MacMahon S, Chalmers J, et al. Intensive blood glucose control and vascular outcomes in patients with type 2 diabetes. N Engl J Med. 2008;358:2560–2572.
124 American Diabetes Association. Standards of medical care for patients with diabetes mellitus. Diabetes Care. 1994;17:616–623.
125 Harris MI. Health care and health status and outcomes for patients with type 2 diabetes. Diabetes Care. 2000;23:754–758.
126 Klein R, Klein BE, Moss SE, et al. The medical management of hyperglycemia over a 10-year period in people with diabetes. Diabetes Care. 1996;19:744–750.
127 Klein BE. Reduction in risk of progression of diabetic retinopathy. N Engl J Med. 2010;363:287–288.
128 Klein R. Intensive treatment of hyperglycaemia: ACCORD. Lancet. 2010;376:391–392.
129 Smith RB, Pyke DA, Watkins PJ, et al. C-peptide response to glucagon in diabetics with and without complications. N Z Med J. 1979;89:304–306.
130 Sjoberg S, Gunnarsson R, Gjotterberg M, et al. Residual insulin production, glycaemic control and prevalence of microvascular lesions and polyneuropathy in long-term type 1 (insulin-dependent) diabetes mellitus. Diabetologia. 1987;30:208–213.
131 Sjoberg S, Gjotterberg M, Lefvert AK, et al. Significance of residual insulin production in long-term type I diabetes mellitus. Transplant Proc. 1986;18:1498–1499.
132 Madsbad S, Lauritzen E, Faber OK, et al. The effect of residual beta-cell function on the development of diabetic retinopathy. Diabet Med. 1986;3:42–45.
133 Klein R, Moss SE, Klein BE, et al. Wisconsin Epidemiologic Study of Diabetic Retinopathy. XII. Relationship of C-peptide and diabetic retinopathy. Diabetes. 1990;39:1445–1450.
134 Klein R, Klein BE, Moss SE. The Wisconsin Epidemiologic Study of Diabetic Retinopathy. XVI. The relationship of C-peptide to the incidence and progression of diabetic retinopathy. Diabetes. 1995;44:796–801.
135 Steffes MW, Sibley S, Jackson M, et al. Beta-cell function and the development of diabetes-related complications in the diabetes control and complications trial. Diabetes Care. 2003;26:832–836.
136 Serghieri G, Bartolomei G, Pettenello C, et al. Raised retinopathy prevalence rate in insulin-treated patients: a feature of obese type II diabetes. Transplant Proc. 1986;18:1576–1577.
137 Klein R, Klein BE, Moss SE, et al. Is blood pressure a predictor of the incidence or progression of diabetic retinopathy? Arch Intern Med. 1989;149:2427–2432.
138 Adler AI, Stratton IM, Neil HA, et al. Association of systolic blood pressure with macrovascular and microvascular complications of type 2 diabetes (UKPDS 36): prospective observational study. BMJ. 2000;321:412–419.
139 Klein R, Klein BE, Moss SE, et al. The Wisconsin Epidemiologic Study of Diabetic Retinopathy. XV. The long-term incidence of macular edema. Ophthalmology. 1995;102:7–16.
140 United Kingdom Prospective Diabetes Study (UKPDS) Group. Tight blood pressure control and risk of macrovascular and microvascular complications in type 2 diabetes: UKPDS 38. BMJ. 1998;317:703–713.
141 Patel A, MacMahon S, Chalmers J, et al. Effects of a fixed combination of perindopril and indapamide on macrovascular and microvascular outcomes in patients with type 2 diabetes mellitus (the ADVANCE trial): a randomised controlled trial. Lancet. 2007;370:829–840.
142 Chaturvedi N, Sjolie AK, Stephenson JM, et al. Effect of lisinopril on progression of retinopathy in normotensive people with type 1 diabetes. The EUCLID Study Group. EURODIAB Controlled Trial of Lisinopril in Insulin-Dependent Diabetes Mellitus. Lancet. 1998;351:28–31.
143 Chaturvedi N. Modulation of the renin-angiotensin system and retinopathy. Heart. 2000;84(Suppl. 1):i29–i31.
144 Chaturvedi N, Sjoelie AK, Svensson A. The Diabetic Retinopathy Candesartan Trials (DIRECT) Programme, rationale and study design. J Renin Angiotensin Aldosterone Syst. 2002;3:255–261.
145 Chaturvedi N, Porta M, Klein R, et al. Effect of candesartan on prevention (DIRECT-Prevent 1) and progression (DIRECT-Protect 1) of retinopathy in type 1 diabetes: randomised, placebo-controlled trials. Lancet. 2008;372:1394–1402.
146 Mauer M, Zinman B, Gardiner R, et al. Renal and retinal effects of enalapril and losartan in type 1 diabetes. N Engl J Med. 2009;361:40–51.
147 Mitchell P, Wong TY. DIRECT new treatments for diabetic retinopathy. Lancet. 2008;372:1361–1363.
148 Sjølie AK, Klein R, Porta M, et al. Effect of candesartan on progression and regression of retinopathy in type 2 diabetes (DIRECT-Protect 2): a randomised placebo-controlled trial. Lancet. 2008;372:1385–1393.
149 Klein R, Moss SE, Klein BE. Is gross proteinuria a risk factor for the incidence of proliferative diabetic retinopathy? Ophthalmology. 1993;100:1140–1146.
150 Cruickshanks KJ, Ritter LL, Klein R, et al. The association of microalbuminuria with diabetic retinopathy. The Wisconsin Epidemiologic Study of Diabetic Retinopathy. Ophthalmology. 1993;100:862–867.
151 Lloyd CE, Klein R, Maser RE, et al. The progression of retinopathy over 2 years: the Pittsburgh Epidemiology of Diabetes Complications (EDC) Study. J Diabetes Complications. 1995;9:140–148.
152 Moss SE, Klein R, Klein BE. The incidence of vision loss in a diabetic population. Ophthalmology. 1988;95:1340–1348.
153 Duncan LJ, Cullen JF, Ireland JT, et al. A three-year trial of atromid therapy in exudative diabetic retinopathy. Diabetes. 1968;17:458–467.
154 Klein BE, Moss SE, Klein R, et al. The Wisconsin Epidemiologic Study of Diabetic Retinopathy. XIII. Relationship of serum cholesterol to retinopathy and hard exudate. Ophthalmology. 1991;98:1261–1265.
155 Chew EY, Klein ML, Ferris FL, III., et al. Association of elevated serum lipid levels with retinal hard exudate in diabetic retinopathy. Early Treatment Diabetic Retinopathy Study (ETDRS) Report 22. Arch Ophthalmol. 1996;114:1079–1084.
156 Gordon B, Chang S, Kavanagh M, et al. The effects of lipid lowering on diabetic retinopathy. Am J Ophthalmol. 1991;112:385–391.
157 Freyberger H, Schifferdecker E, Schatz H. [Regression of hard exudates in diabetic background retinopathy in therapy with etofibrate antilipemic agent.]. Med Klin (Munich). 1994;89:594–597. 633
158 Dale J, Farmer J, Jones AF, et al. Diabetic ischaemic and exudative maculopathy: are their risk factors different? Diab Med. 2000;17:47.
159 Keech AC, Mitchell P, Summanen PA, et al. Effect of fenofibrate on the need for laser treatment for diabetic retinopathy (FIELD study): a randomised controlled trial. Lancet. 2007;370:1687–1697.
160 Goldsmith JR, Landaw SA. Carbon monoxide and human health. Science. 1968;162:1352–1359.
161 Hawkins RI. Smoking, platelets and thrombosis. Nature. 1972;236:450–452.
162 Klein R, Klein BE, Davis MD. Is cigarette smoking associated with diabetic retinopathy? Am J Epidemiol. 1983;118:228–238.
163 Moss SE, Klein R, Klein BE. Association of cigarette smoking with diabetic retinopathy. Diabetes Care. 1991;14:119–126.
164 Moss SE, Klein R, Klein BE. Cigarette smoking and ten-year progression of diabetic retinopathy. Ophthalmology. 1996;103:1438–1442.
165 Klein R, Moss SE, Klein BE, et al. Relation of ocular and systemic factors to survival in diabetes. Arch Intern Med. 1989;149:266–272.
166 Jakubowski JA, Vaillancourt R, Deykin D. Interaction of ethanol, prostacyclin, and aspirin in determining human platelet reactivity in vitro. Arteriosclerosis. 1988;8:436–441.
167 Albert MA, Glynn RJ, Ridker PM. Alcohol consumption and plasma concentration of C-reactive protein. Circulation. 2003;107:443–447.
168 Greenfield JR, Samaras K, Jenkins AB, et al. Moderate alcohol consumption, estrogen replacement therapy, and physical activity are associated with increased insulin sensitivity: is abdominal adiposity the mediator? Diabetes Care. 2003;26:2734–2740.
169 Kingsley LA, Dorman JS, Doft BH, et al. An epidemiologic approach to the study of retinopathy: the Pittsburgh diabetic morbidity and retinopathy studies. Diabetes Res Clin Pract. 1988;4:99–109.
170 Young RJ, McCulloch DK, Prescott RJ, et al. Alcohol: another risk factor for diabetic retinopathy? Br Med J (Clin Res Ed). 1984;288:1035–1037.
171 Beulens JW, Kruidhof JS, Grobbee DE, et al. Alcohol consumption and risk of microvascular complications in type 1 diabetes patients: the EURODIAB Prospective Complications Study. Diabetologia. 2008;51:1631–1638.
172 Lee CC, Stolk RP, Adler AI, et al. Association between alcohol consumption and diabetic retinopathy and visual acuity – the AdRem Study. Diabet Med. 2010;27:1130–1137.
173 Moss SE, Klein R, Klein BE. Alcohol consumption and the prevalence of diabetic retinopathy. Ophthalmology. 1992;99:926–932.
174 Moss SE, Klein R, Klein BE. The association of alcohol consumption with the incidence and progression of diabetic retinopathy. Ophthalmology. 1994;101:1962–1968.
175 Valmadrid CT, Klein R, Moss SE, et al. Alcohol intake and the risk of coronary heart disease mortality in persons with older-onset diabetes mellitus. JAMA. 1999;282:239–246.
176 Diabetes Drafting Group. Prevalence of small vessel and large vessel disease in diabetic patients from 14 centres. The World Health Organisation Multinational Study of Vascular Disease in Diabetics. Diabetologia. 1985;28(Suppl.):615–640.
177 LaPorte RE, Dorman JS, Tajima N, et al. Pittsburgh Insulin-Dependent Diabetes Mellitus Morbidity and Mortality Study: physical activity and diabetic complications. Pediatrics. 1986;78:1027–1033.
178 van Leiden HA, Dekker JM, Moll AC, et al. Risk factors for incident retinopathy in a diabetic and nondiabetic population: the Hoorn study. Arch Ophthalmol. 2003;121:245–251.
179 Klein R, Klein BE, Moss SE. Is obesity related to microvascular and macrovascular complications in diabetes? The Wisconsin Epidemiologic Study of Diabetic Retinopathy. Arch Intern Med. 1997;157:650–656.
180 Wadén J, Tikkanen H, Forsblom C, et al. Leisure time physical activity is associated with poor glycemic control in type 1 diabetic women: the FinnDiane study. Diabetes Care. 2005;28:777–782.
181 Orchard TJ, Dorman JS, Maser RE, et al. Factors associated with avoidance of severe complications after 25 yr of IDDM. Pittsburgh Epidemiology of Diabetes Complications Study I. Diabetes Care. 1990;13:741–747.
182 Kriska AM, LaPorte RE, Patrick SL, et al. The association of physical activity and diabetic complications in individuals with insulin-dependent diabetes mellitus: the Epidemiology of Diabetes Complications Study – VII. J Clin Epidemiol. 1991;44:1207–1214.
183 Cruickshanks KJ, Moss SE, Klein R, et al. Physical activity and proliferative retinopathy in people diagnosed with diabetes before age 30 yr. Diabetes Care. 1992;15:1267–1272.
184 Cruickshanks KJ, Moss SE, Klein R, et al. Physical activity and the risk of progression of retinopathy or the development of proliferative retinopathy. Ophthalmology. 1995;102:1177–1182.
185 Hanna AK, Roy M, Zinman B, et al. An evaluation of factors associated with proliferative diabetic retinopathy. Clin Invest Med. 1985;8:109–116.
186 Haffner SM, Hazuda HP, Stern MP, et al. Effects of socioeconomic status on hyperglycemia and retinopathy levels in Mexican Americans with NIDDM. Diabetes Care. 1989;12:128–134.
187 Klein R, Klein BE, Jensen SC, et al. The relation of socioeconomic factors to the incidence of proliferative diabetic retinopathy and loss of vision. Ophthalmology. 1994;101:68–76.
188 Klein BE, Moss SE, Klein R. Oral contraceptives in women with diabetes. Diabetes Care. 1990;13:895–898.
189 Klein BE, Klein R, Moss SE. Exogenous estrogen exposures and changes in diabetic retinopathy. The Wisconsin Epidemiologic Study of Diabetic Retinopathy. Diabetes Care. 1999;22:1984–1987.
190 Klein BE, Moss SE, Klein R. Effect of pregnancy on progression of diabetic retinopathy. Diabetes Care. 1990;13:34–40.
191 Chew EY, Mills JL, Metzger BE, et al. Metabolic control and progression of retinopathy. The Diabetes in Early Pregnancy Study. National Institute of Child Health and Human Development Diabetes in Early Pregnancy Study. Diabetes Care. 1995;18:631–637.
192 Hemachandra A, Ellis D, Lloyd CE, et al. The influence of pregnancy on IDDM complications. Diabetes Care. 1995;18:950–954.
193 Rasmussen KL, Laugesen CS, Ringholm L, et al. Progression of diabetic retinopathy during pregnancy in women with type 2 diabetes. Diabetologia. 2010;53:1076–1083.
194 Lovestam-Adrian M, Agardh CD, Aberg A, et al. Pre-eclampsia is a potent risk factor for deterioration of retinopathy during pregnancy in Type 1 diabetic patients. Diabet Med. 1997;14:1059–1065.
195 Rosenn B, Miodovnik M, Kranias G, et al. Progression of diabetic retinopathy in pregnancy: association with hypertension in pregnancy. Am J Obstet Gynecol. 1992;166:1214–1218.
196 Temple RC, Aldridge VA, Sampson MJ, et al. Impact of pregnancy on the progression of diabetic retinopathy in Type 1 diabetes. Diabet Med. 2001;18:573–577.
197 Lauszus F, Klebe JG, Bek T. Diabetic retinopathy in pregnancy during tight metabolic control. Acta Obstet Gynecol Scand. 2000;79:367–370.
198 Rahman W, Rahman FZ, Yassin S, et al. Progression of retinopathy during pregnancy in type 1 diabetes mellitus. Clin Experiment Ophthalmol. 2007;35:231–236.
199 Vestgaard M, Ringholm L, Laugesen CS, et al. Pregnancy-induced sight-threatening diabetic retinopathy in women with Type 1 diabetes. Diabet Med. 2010;27:431–435.
200 Lauszus FF, Klebe JG, Bek T, et al. Increased serum IGF-I during pregnancy is associated with progression of diabetic retinopathy. Diabetes. 2003;52:852–856.
201 Ringholm L, Vestgaard M, Laugesen CS, et al. Pregnancy-induced increase in circulating IGF-I is associated with progression of diabetic retinopathy in women with type 1 diabetes. Growth Horm IGF Res. 2011;21:25–30.
202 Best RM, Hayes R, Hadden DR, et al. Plasma levels of endothelin-1 in diabetic retinopathy in pregnancy. Eye (Lond). 1999;13(Pt 2):179–182.
203 Vääräsmäki M, Anttila M, Pirttiaho H, et al. Are recurrent pregnancies a risk in Type 1 diabetes? Acta Obstet Gynecol Scand. 2002;81:1110–1115.
204 Klein R, Klein BE, Moss SE. Epidemiology of proliferative diabetic retinopathy. Diabetes Care. 1992;15:1875–1891.
205 Klein R, Klein BE, Moss SE, et al. Association of ocular disease and mortality in a diabetic population. Arch Ophthalmol. 1999;117:1487–1495.
206 Davis MD, Hiller R, Magli YL, et al. Prognosis for life in patients with diabetes: relation to severity of retinopathy. Trans Am Ophthalmol Soc. 1979;77:144–170.
207 Hanis CL, Chu HH, Lawson K, et al. Mortality of Mexican Americans with NIDDM. Retinopathy and other predictors in Starr County, Texas. Diabetes Care. 1993;16:82–89.
208 Neil A, Hawkins M, Potok M, et al. A prospective population-based study of microalbuminuria as a predictor of mortality in NIDDM. Diabetes Care. 1993;16:996–1003.
209 Sorbinil Retinopathy Trial Research Group. A randomized trial of sorbinil, an aldose reductase inhibitor, in diabetic retinopathy. Arch Ophthalmol. 1990;108:1234–1244.
210 Elman MJ, Aiello LP, Beck RW, et al. Randomized trial evaluating ranibizumab plus prompt or deferred laser or triamcinolone plus prompt laser for diabetic macular edema. Ophthalmology. 2010;117:1064–1077.
211 Witkin SR, Klein R. Ophthalmologic care for persons with diabetes. JAMA. 1984;251:2534–2537.
212 Singer DE, Nathan DM, Fogel HA, et al. Screening for diabetic retinopathy. Ann Intern Med. 1992;116:660–671.
213 Sprafka JM, Fritsche TL, Baker R, et al. Prevalence of undiagnosed eye disease in high-risk diabetic individuals. Arch Intern Med. 1990;150:857–861.
214 Brechner RJ, Cowie CC, Howie LJ, et al. Ophthalmic examination among adults with diagnosed diabetes mellitus. JAMA. 1993;270:1714–1718.
215 Weiner JP, Parente ST, Garnick DW, et al. Variation in office-based quality. A claims-based profile of care provided to Medicare patients with diabetes. JAMA. 1995;273:1503–1508.
216 Kraft SK, Marrero DG, Lazaridis EN, et al. Primary care physicians’ practice patterns and diabetic retinopathy. Current levels of care. Arch Fam Med. 1997;6:29–37.
217 Bresnick GH, Mukamel DB, Dickinson JC, et al. A screening approach to the surveillance of patients with diabetes for the presence of vision-threatening retinopathy. Ophthalmology. 2000;107:19–24.
218 Moss SE, Klein R, Klein BE. Factors associated with having eye examinations in persons with diabetes. Arch Fam Med. 1995;4:529–534.
219 National Institutes of Health. The National Eye Health Education Program. From Vision to Research to Health Educations: Planning the Partnership. Bethesda, MD: National Institutes of Health; 1990.
220 Batchelder T, Barricks M. The Wisconsin Epidemiologic Study of Diabetic Retinopathy. Arch Ophthalmol. 1995;113:702–703.
221 Vijan S, Hofer TP, Hayward RA. Cost-utility analysis of screening intervals for diabetic retinopathy in patients with type 2 diabetes mellitus. JAMA. 2000;283:889–896.
222 National Committee for Quality Assurance. Health Plan Employers Data and Information Set (HEDIS(r)), Version 2.5. Washington, DC: National Committee for Quality Assurance; 1996.
223 Velez R, Haffner SM, Stern MP, et al. Ophthalmologist versus retinal photographs in screening for diabetic retinopathy [abstract]. Clin Res. 1987;35:363A.
224 Bragge P, Gruen RL, Chau M, et al. Screening for presence or absence of diabetic retinopathy: a meta-analysis. Arch Ophthalmol. 2011;129(4):435–444.