The Cardiovascular System
After reading this chapter you will be able to:
 Describe the anatomy of the heart and vascular systems.
 State the key characteristics of cardiac tissue.

 Describe how local and central control mechanisms regulate the heart and vascular systems.

 Calculate cardiac output given stroke volume and heart rate.
 Calculate ejection fraction given stroke volume and end-diastolic volume.
 Identify how the electrical and mechanical events of the heart relate to a normal cardiac cycle.
Functional Anatomy
Heart
Anatomy of the Heart
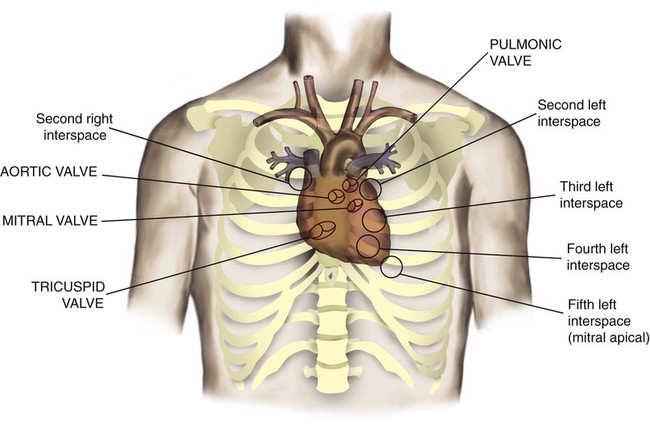
The heart is a hollow, four-chambered muscular organ approximately the size of a fist. It is positioned obliquely in the middle compartment of the mediastinum of the chest, just behind the sternum (Figure 9-1). Approximately two-thirds of the heart lies to the left of the midline of the sternum between the points of attachment of the second through the sixth ribs. The apex of the heart is formed by the tip of the left ventricle and lies just above the diaphragm at the level of the fifth intercostal space to the left. The base of the heart is formed by the atria and projects to the patient’s right lying just below the second rib. It is level with the second rib below the sternum. Posteriorly, the heart rests on the bodies of the fifth to the eighth thoracic vertebrae. Because of its position between the sternum and the spine, rhythmic compression of the heart can maintain blood flow during cardiopulmonary resuscitation.
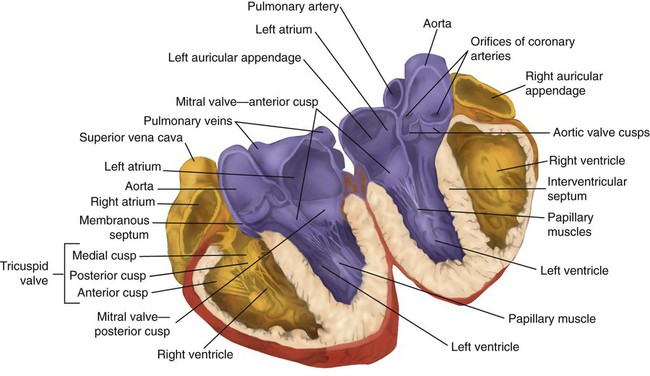
The two lower heart chambers, or ventricles, make up the bulk of the heart’s muscle mass and do most of the pumping that circulates the blood (Figure 9-2). The mass of the left ventricle is normally about two-thirds larger than the mass of the right ventricle and has a spherical appearance when viewed in anteroposterior cross section. The right ventricle is thin-walled and oblong, forming a pocket-like attachment to the left ventricle. Because of this relationship, contraction of the left ventricle pulls in the right ventricular wall, aiding its contraction. The effect, termed left ventricular aid, explains why some forms of right ventricular failure are less harmful than might be expected. The right and left ventricles are separated by a muscle wall termed the interventricular septum (see Figure 9-2).
 Rule of Thumb
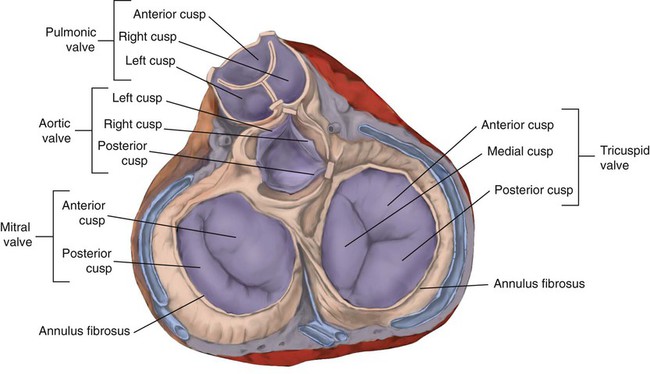
The valves of the heart are flaps of fibrous tissue firmly anchored to the anulus fibrosus cordis (Figure 9-3). Because they are located between the atria and ventricles, they are called atrioventricular valves. The valve between the right atrium and ventricle is called the tricuspid valve. The valve between the left atrium and ventricle is the bicuspid, or mitral, valve. The atrioventricular valves close during systole (contraction of the ventricles), preventing backflow of blood into the atria. Closure of these valves provides a critical period of isovolemic contraction, during which chamber pressures quickly increase just before ejection of the blood.
The free ends of the atrioventricular valves are anchored to papillary muscles of the endocardium by the chordae tendineae cordis (see Figure 9-2). During systole, papillary muscle contraction prevents the atrioventricular valves from swinging upward into the atria. Damage to either the chordae tendineae cordis or the papillary muscles can impair function of the atrioventricular valves and cause leakage upward into the atria.
Common valve problems include regurgitation and stenosis. Regurgitation is the backflow of blood through an incompetent or a damaged valve. Stenosis is a pathologic narrowing or constriction of a valve outlet, which causes increased pressure in the proximal chamber and vessels. Both conditions affect cardiac performance. In mitral stenosis, high pressures in the left atrium back up into the pulmonary circulation. This can cause pulmonary edema and a diastolic murmur (see Chapter 15).
A set of semilunar valves separates the ventricles from their arterial outflow tracts, the pulmonary artery and the aorta (see Figure 9-3). Consisting of three half-moon–shaped cusps attached to the arterial wall, these valves prevent backflow of blood into the ventricles during diastole (or when the chambers of the heart fill with blood). The pulmonary valve is at the outflow tract of the right ventricle. During the cardiac contraction (systole), blood is ejected out of the heart and to the lungs through the right valves and to the body through the left valves. Similar to the atrioventricular valves, the semilunar valves can leak (regurgitation) or become obstructed (stenosis).
Similar to the lungs, the heart has its own circulatory system, which is called the coronary circulation. However, in contrast to the lungs, the heart has a high metabolic rate, which requires more blood flow per gram of tissue weight than any other organ except the kidney. To meet these needs, the coronary circulation provides an extensive network of branches to all myocardial tissue (Figure 9-4).
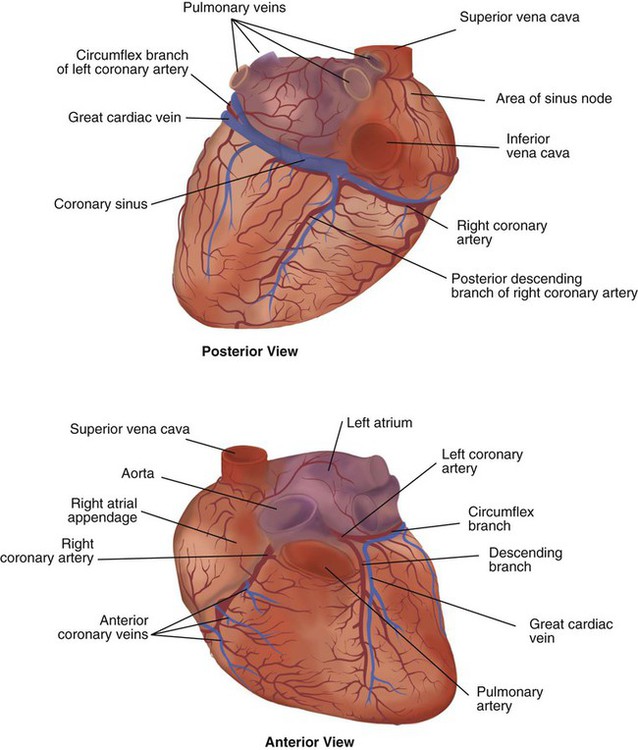
Two main coronary arteries, a left and a right, arise from the root of the aorta. Because of their position underneath the aortic semilunar valves (see Figure 9-4), the coronary arteries get the maximal pulse of pressure generated by contraction of the left ventricle. Blood flows through the coronary arteries only during ventricular diastole (relaxation). A healthy heart muscle requires about  of the blood supply of the body to function properly. As might be expected, partial obstruction of a coronary artery may lead to tissue ischemia (decreased oxygen [O2] supply), a clinical condition called angina pectoris. Complete obstruction may cause tissue death or infarct, a condition called myocardial infarction.
 Problem
 Problem
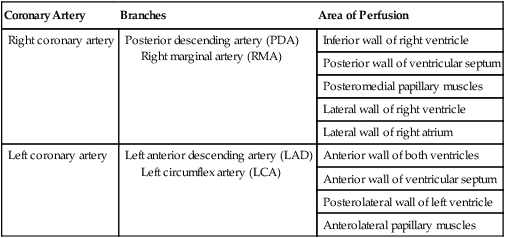
For a description of the major branches of the coronary arteries and their areas of vascularization, see Table 9-1 and Figure 9-4. After passing through the capillary beds of the myocardium, the venous blood is collected by the coronary veins that closely parallel the arteries (see Figure 9-4). These veins gather together into a large vessel called the coronary sinus, which passes left to right across the posterior surface of the heart. The coronary sinus empties into the right atrium between the opening of the inferior vena cava and the tricuspid valve.
TABLE 9-1
| Coronary Artery | Branches | Area of Perfusion |
| Right coronary artery | Posterior descending artery (PDA) Right marginal artery (RMA) |
Inferior wall of right ventricle |
| Posterior wall of ventricular septum | ||
| Posteromedial papillary muscles | ||
| Lateral wall of right ventricle | ||
| Lateral wall of right atrium | ||
| Left coronary artery | Left anterior descending artery (LAD) Left circumflex artery (LCA) |
Anterior wall of both ventricles |
| Anterior wall of ventricular septum | ||
| Posterolateral wall of left ventricle | ||
| Anterolateral papillary muscles |
In addition to these major routes for return blood flow, some coronary venous blood flows back into the heart through the thebesian veins. The thebesian veins empty directly into all the heart chambers. Any blood coming from the thebesian veins that enters the left atrium or ventricle mixes with arterial blood coming from the lungs. Whenever venous blood mixes with arterial blood, the overall O2 content decreases. Because the thebesian veins bypass, or shunt, around the pulmonary circulation, this phenomenon is called an anatomic shunt. When combined with a similar bypass in the bronchial circulation (see Chapter 8), these normal anatomic shunts account for approximately 2% to 3% of the total cardiac output.
Properties of the Heart Muscle
Inherent rhythmicity, or automaticity, is the unique ability of the cardiac muscle to initiate a spontaneous electrical impulse. Although such impulses can arise from anywhere in the cardiac tissue, this ability is highly developed in specialized areas called heart pacemaker, or nodal tissues. The sinoatrial node and the atrioventricular node are good examples of specialized heart tissues that are designed to initiate electrical impulses (see Chapter 17). An electrical impulse from any source other than a normal heart pacemaker is considered abnormal and represents one of the many causes of cardiac arrhythmias.
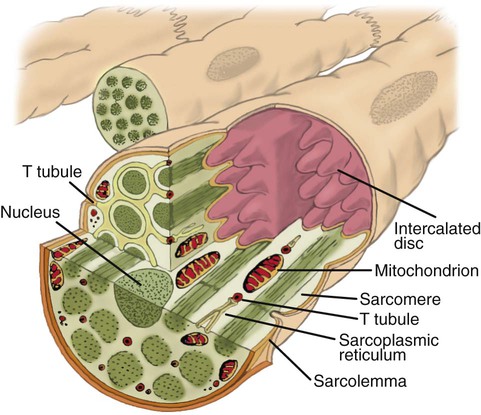
Microanatomy of the Heart Muscle
Understanding how cardiac muscle contracts requires knowledge of the microanatomy of the heart. In contrast to the long, cylindrical, multinucleated skeletal muscle fibers, cardiac cells are short, fat, branched, and interconnected. As seen under the microscope, myocardial muscle fibers are approximately 15 µm wide × 100 µm long. Individual fibers are enclosed in a membrane called the sarcolemma, which is surrounded by a rich capillary network (Figure 9-5).
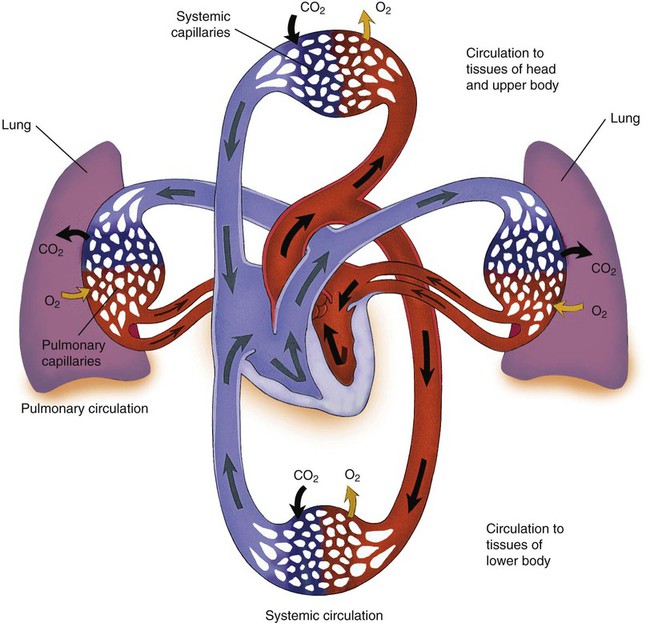
Vascular System
The vascular system has two major subdivisions: the systemic vasculature and the pulmonary vasculature. The systemic vasculature begins with the aorta on the left ventricle and ends in the right atrium. The pulmonary vasculature begins with the pulmonary trunk out of the right ventricle and ends in the left atrium. The blood flow to and from the heart is depicted in Figure 9-6.
Systemic Vasculature
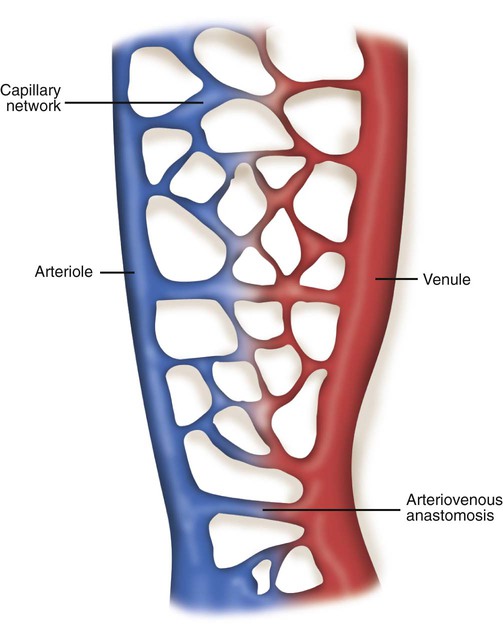
The vast capillary system, or microcirculation, maintains a constant exchange of nutrients and waste products for the cells and tissues of the body. For this reason, the capillaries are commonly referred to as exchange vessels. Figure 9-7 shows the structure of a typical capillary network. Blood flows into the network by an arteriole and out through a venule. A direct communication between these vessels is called an arteriovenous anastomosis. When open, an arteriovenous anastomosis allows arterial blood to shunt around the capillary bed and flow directly into the venules. Downstream from the arteriovenous anastomosis, the arteriole divides into terminal arterioles, which branch further into thoroughfare channels and true capillaries.
Vascular Resistance
< ?xml:namespace prefix = "mml" />
Control of the Cardiovascular System
Regulation of Cardiac Output


Changes in Stroke Volume
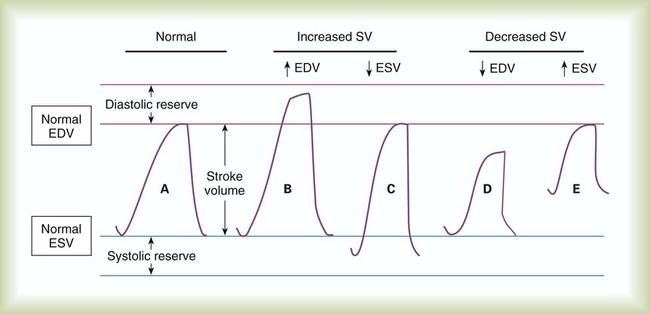
SV equals the difference between the EDV and the ESV:

As shown in Figure 9-8, an increase in SV occurs when either the EDV increases or the ESV decreases. Conversely, a decrease in SV occurs when either the EDV decreases or the ESV increases. This relationship is key to understanding regulation of cardiac output.
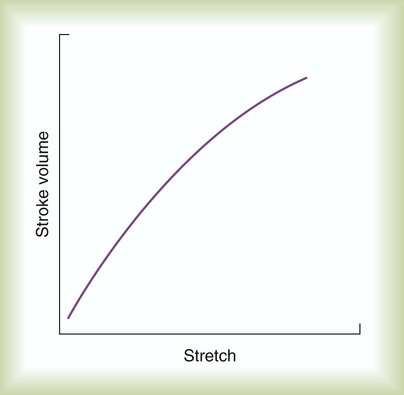
In clinical practice, this initial ventricular stretch is called preload, whereas the tension of contraction is equivalent to SV. Figure 9-9 applies the Frank-Starling law to ventricular function by plotting ventricular stretch against SV. Ventricular stretch is directly proportional to EDV, and EDV is directly related to the pressure difference across the ventricle wall. Preload can be measured indirectly as the ventricular end-diastolic pressure.
 Rule of Thumb
All else being constant, the greater the afterload on the ventricles, the harder it is for the ventricles to eject their volume. For a given EDV, an increase in afterload causes the volume remaining in the ventricle after systole (ESV) to increase. If the EDV remains constant while the ESV increases, the SV (EDV − ESV) decreases (see Figure 9-8). Normally, however, the healthy heart muscle responds to increased afterload by altering its contractility.
 Rule of Thumb
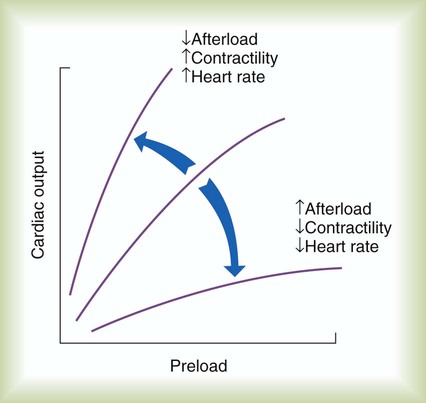
Changes in contractility affect the slope of the ventricular function curve (Figure 9-10; see Figure 9-9). A higher SV for a given preload (increased slope) indicates a state of increased contractility, often referred to as positive inotropism. The opposite is also true. A lower SV for a given preload indicates decreased contractility, referred to as negative inotropism. Drugs that increase contractility of the heart muscle are called positive inotropes; drugs that decrease contractility are negative inotropes.
 Rule of Thumb
Changes in Heart Rate
 Problem
 Rule of Thumb
Increase in HR increases cardiac output in a healthy heart up to a rate of 160 to 180 beats/min.
The combined effects of preload, afterload, contractility, and HR on cardiac performance are graphically portrayed in Figure 9-10. The middle ventricular function curve represents the normal state. The upper, steeper curve represents a hyperdynamic heart. In the hyperdynamic heart, a given preload results in a greater than normal cardiac output. Factors contributing to this state include decreased afterload, increased contractility (decreased ESV), and increased HR. The bottom curve has less slope than normal, indicating a hypodynamic heart. Factors contributing to this state include increased afterload, decreased contractility (increased ESV), and decreased rate. When the pumping efficiency of the heart is so low that cardiac output is inadequate to meet tissues needs, the heart is said to be in congestive heart failure.
Cardiovascular Control Mechanisms
 Rule of Thumb
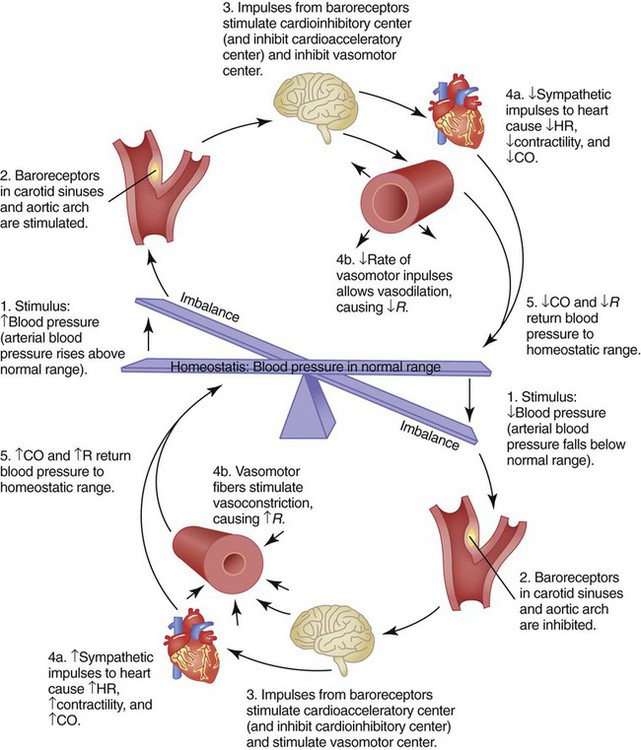
Central control of cardiovascular function occurs by interaction between the brainstem and selected peripheral receptors (Figure 9-11). The brainstem constantly receives feedback from these receptors about the pressure, volume, and chemical status of the blood. The brainstem also receives input from higher brain centers, such as the hypothalamus and cerebral cortex. All these inputs are integrated with the inputs coming from the heart and blood vessels to maintain adequate blood flow and pressure under all but the most abnormal conditions.
 Problem
Cardiovascular Control Centers
Figure 9-11 is a simplified diagram of the cardiovascular regulatory centers. Areas in the medulla receive input from higher brain centers, peripheral pressure, and chemical receptors. Stimulation of the vasoconstrictor area within the medulla causes vasoconstriction and increased vascular resistance. A vasodepressor area works mainly by inhibiting the vasoconstrictor center.
Peripheral Receptors
In addition to high-level and local input, the cardiovascular centers receive signals from peripheral receptors (see Figure 9-11). There are two types of peripheral cardiovascular receptors: baroreceptors, or stretch receptors, and chemoreceptors. Baroreceptors respond to pressure changes, whereas chemoreceptors respond to changes in blood chemistry.
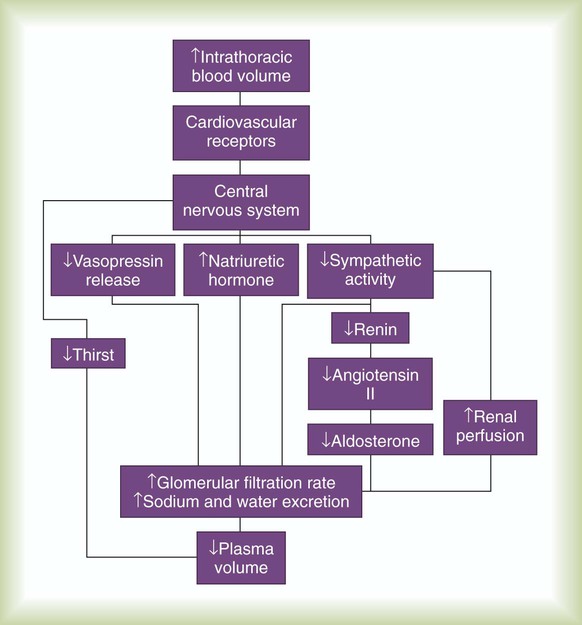
Although the high-pressure arterial receptors constantly control blood pressure, the low-pressure sensors are responsible for long-term regulation of plasma volume. The low-pressure atrial and venous baroreceptors regulate plasma volume mainly by activating several chemical and hormonal mechanisms. Table 9-2 provides a detailed description of some of these mechanisms.
TABLE 9-2
Hormonal Control Mechanisms Affecting Blood Pressure
| Hormone | Place of Action | Effect |
| Angiotensin II | Arterioles | ↑ SVR (vasoconstriction) |
| Antidiuretic hormone | Kidneys | ↑ Blood volume (↑ water retention) |
| Arterioles | ↑ SVR (vasoconstriction) | |
| Atrial natriuretic peptide | Arterioles | ↓ SVR (vasodilation) |
| Aldosterone | Kidneys | ↑ Blood volume (↑ water and salt retention) |
| Cortisol | Kidneys | ↑ Blood volume (↑ water and salt retention) |
| Norepinephrine | Heart (beta-1 receptors) | ↑ Cardiac output (HR and contractility) |
| Arterioles (alpha receptors) | ↑ SVR (vasoconstriction) |
The major pathways for plasma volume control are outlined in Figure 9-12. Combined with a central nervous system–mediated increase in renal filtration, these humoral mechanisms decrease the overall plasma volume. A decrease in blood volume has the opposite effect (i.e., sodium and water retention and an increase in plasma volume).
Because these changes occur only when the cardiopulmonary system is overtaxed, the chemoreceptors probably have little influence under normal conditions. However, their influence on respiration is clinically important. For this reason, the peripheral chemoreceptors are discussed in greater detail in Chapter 8.
Response to Changes in Overall Volume
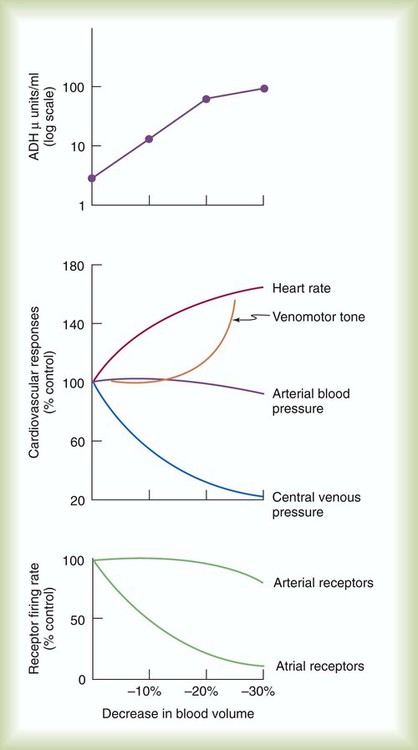
The coordinated response of the cardiovascular system is best shown under abnormal conditions. Among the most common clinical conditions in which all essential regulatory mechanisms come into play is the large blood loss that occurs with hemorrhage. Figure 9-13 illustrates changes in these key factors during progressive blood loss in an animal model.
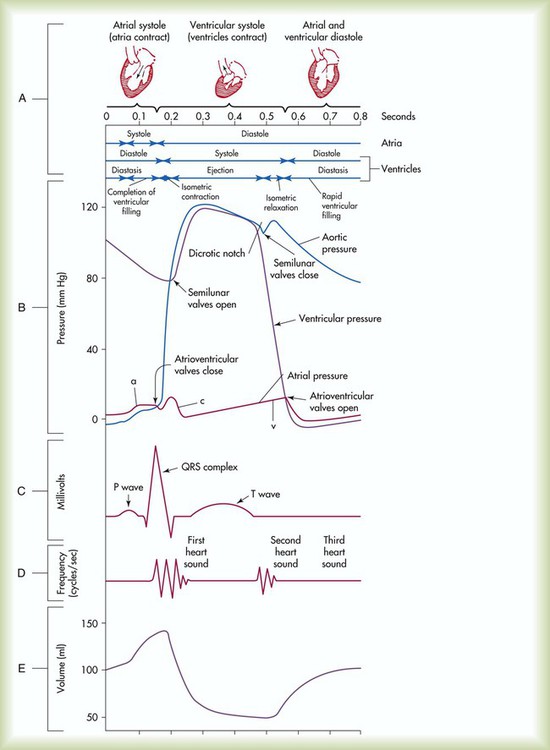
Events of the Cardiac Cycle
This chapter has focused on the mechanical properties of the heart, and the electrical activities of the heart are discussed in Chapter 17. Although they are discussed separately, the mechanical and electrical events are interdependent. Given the crucial role of RTs in dealing with cardiovascular problems, an in-depth knowledge of how these events relate is essential.
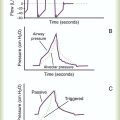
The events of the cardiac cycle are depicted in Figure 9-14. The top of the figure shows a time axis scaled in tenths of a second. Next are the timing bars for ventricular systole and diastole and pressure events in the atria, ventricles, and aorta. These are followed by an electrocardiogram (ECG), heart sounds, and ventricular flow (see Chapter 17 for an explanation of the ECG waves).