Gas Exchange and Transport
After reading this chapter you will be able to:
 Describe how oxygen and carbon dioxide move between the atmosphere and tissues.
 Identify what determines alveolar oxygen and carbon dioxide pressures.

 State the effects that normal regional variations in ventilation and perfusion have on gas exchange.
 Describe how to compute total oxygen content for arterial blood.
 State the factors that cause the arteriovenous oxygen content difference to change.
 Identify the factors that affect oxygen loading and unloading from hemoglobin.
 Describe how carbon dioxide is carried in the blood.
 Describe how oxygen and carbon dioxide transport are interrelated.
 Describe the factors that impair oxygen delivery to the tissues and how to distinguish among them.

 )
)Diffusion
Whole-Body Diffusion Gradients
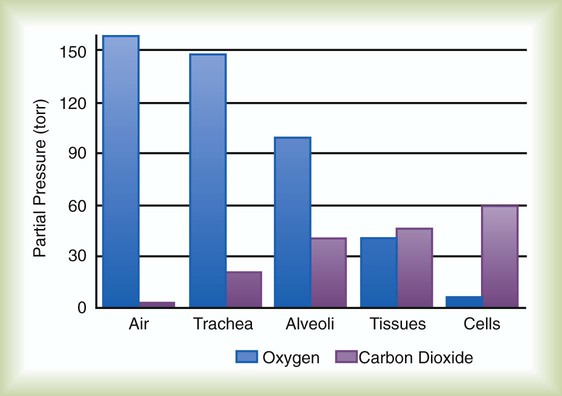
Gas movement between the lungs and tissues occurs via simple diffusion (see Chapters 6 and 8). Figure 11-1 shows the normal diffusion gradients for O2 and CO2. For O2, there is a stepwise downward “cascade” of partial pressures from the normal atmospheric inspired partial pressure of O2 (PiO2) of 159 mm Hg to a low point of 40 mm Hg or less in the capillaries. The intracellular PO2 (approximately 5 mm Hg) provides the final gradient for O2 diffusion into the cell.
Determinants of Alveolar Gas Tensions
Alveolar Carbon Dioxide
 ) and inversely with alveolar ventilation (
 ). The relationship is expressed by the following formula:
< ?xml:namespace prefix = "mml" />
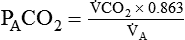
PACO2 = Alveolar CO2 tension (mm Hg)
 = Rate of CO2 produced (in ml/min standard temperature and pressure, dry [STPD])
 = Alveolar ventilation (ml/min body temperature and pressure, saturated [BTPS])
 is expressed as a flow of dry gas at 0° C and 760 mm Hg, and
  is reported as saturated gas at body temperature and ambient pressure, the factor 863 is employed to correct the measurement for comparison under the same conditions. It confers the units of pressure to the resulting dimensionless ratio of flow rates.
 of 200 ml/min and alveolar ventilation of 4315 ml/min, application of this formula yields a PACO2 of approximately 40 mm Hg:
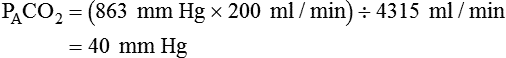
 remains constant. An increase in dead space, the portion of inspired air that is exhaled without being exposed to perfused alveoli, can also lead to an increased PACO2:
 = Alveolar ventilation
Likewise, PACO2 decreases if CO2 production decreases or alveolar ventilation increases. Normally, complex respiratory control mechanisms maintain PACO2 within a range of 35 to 45 mm Hg under various conditions (see Chapter 14). If CO2 production increases, as with exercise or fever, ventilation automatically increases to maintain PACO2 within normal range.
Alveolar Oxygen Tensions

FiO2 = Fraction of inspired O2 (decimal)
PB = Barometric pressure (mm Hg)
The equation component FiO2 × (PB − 47) is a simple application of Dalton’s law:


The accompanying Mini Clini provides an example of how to use the alveolar air equation.
Mini Clini
Alveolar-Arterial PO2 Difference and a/A Ratio
 Problem
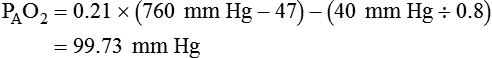
1. Compute PAO2 using one form of the alveolar O2 equation as follows: PAO2 = FiO2 × (PB − 47) − PACO2 (patient breathing >60% O2)
PAO2 = Alveolar O2 tension (mm Hg)
FiO2 = Inspired O2 fraction (decimal)
PACO2 = Alveolar CO2 tension (mm Hg, often estimated by arterial CO2 tension)
Changes in Alveolar Gas Partial Tensions

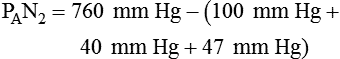

Because both water vapor tension and PAN2 remain constant, the only partial pressures that change in the alveolus are O2 and CO2. Based on the alveolar air equation, if FiO2 remains constant, PAO2 must vary inversely with PACO2.2–4
 Rule of Thumb
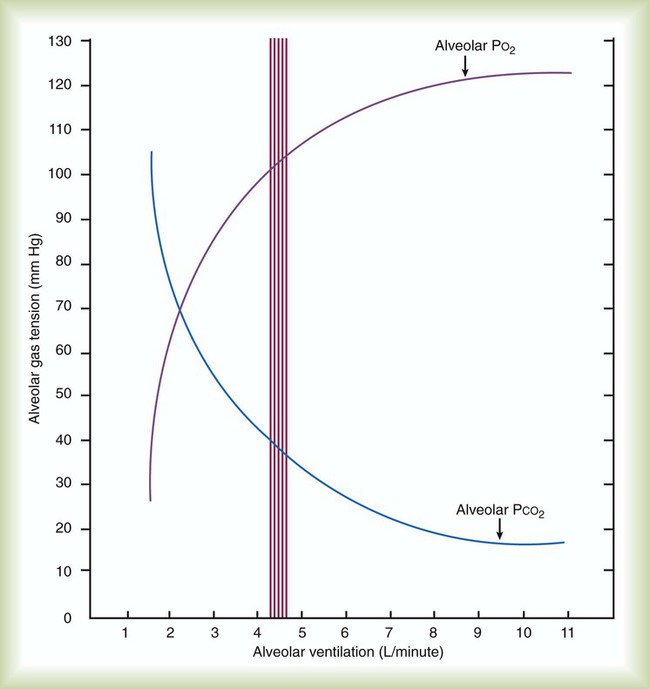
PACO2 itself varies inversely with the level of alveolar ventilation. For a constant CO2 production, a decrease in  simultaneously increases PACO2 and decreases PAO2, whereas an increase in
  has the opposite effect (Figure 11-2). However, ventilation can be increased only so much. Neural control mechanisms and the increased work of breathing prevent decreases in PACO2 much below 15 to 20 mm Hg. Whenever a patient is breathing room air at sea level, the RT should not expect to see a PaO2 greater than 120 mm Hg during hyperventilation. PaO2 values greater than 120 mm Hg indicate that the patient is breathing supplemental O2. The accompanying Mini Clini presents a clinical application of these principles.
 Problem
Mechanism of Diffusion
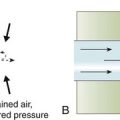
As described in Chapter 6, diffusion is the process whereby gas molecules move from an area of high partial pressure to an area of low partial pressure. To diffuse into and out of the lung and tissues, O2 and CO2 must move through significant barriers.
Barriers to Diffusion
The barrier to gaseous diffusion in the lung is the alveolar-capillary membrane. For CO2 or O2 to move between the alveoli and the pulmonary capillary blood, the following three barriers must be penetrated: (1) alveolar epithelium, (2) interstitial space, and (3) capillary endothelium. In addition, to pass into and out of the red blood cells (RBCs), these gases also must traverse the erythrocyte membrane.5,6
 ) is described by Fick’s first law of diffusion:
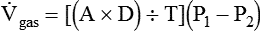
Pulmonary Diffusion Gradients
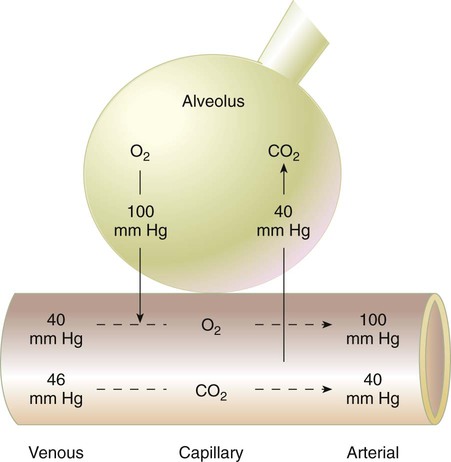
For gas exchange to occur between the alveoli and pulmonary capillaries, a difference in partial pressures (P1 − P2) must exist. Figure 11-3 shows the size and direction of these gradients for O2 and CO2. In the normal lung, the alveolar PO2 averages approximately 100 mm Hg, whereas the mean PCO2 is approximately 40 mm Hg. Venous blood returning to the lungs has a lower PO2 (40 mm Hg) than alveolar gas. The pressure gradient for O2 diffusion into the blood is approximately 60 mm Hg (100 mm Hg − 40 mm Hg). As blood flows past the alveolus, it takes up O2 and moves to the left atrium with a PO2 close to 100 mm Hg in healthy people.
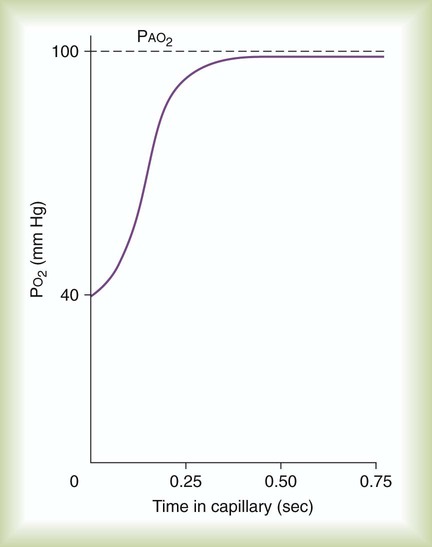
Time Limits to Diffusion
For blood leaving the pulmonary capillary to be adequately oxygenated, it must spend sufficient time in contact with the alveolus to allow equilibration.5,8 If the time available for diffusion is inadequate, blood leaving the lungs may not be fully oxygenated. The diffusion time in the lung depends on the rate of pulmonary blood flow. As depicted in Figure 11-4, blood normally takes approximately 0.75 second to pass through the pulmonary capillary. This time is more than enough to ensure complete diffusion of O2 across the alveolar-capillary membrane normally.
In clinical practice, knowledge of DL can be helpful in evaluating certain diseases. DL is the bulk flow of gas (ml/min) that diffuses into the blood for each 1-mm Hg difference in the pressure gradient. Although O2 can be used to measure DL, low concentrations (0.1% to 0.3%) of carbon monoxide are used more commonly. Chapter 19 provides details on the technique for measuring DL and its diagnostic use.
Normal Variations from Ideal Gas Exchange
Anatomic Shunts
A shunt is the portion of the cardiac output that returns to the left heart without being oxygenated by exposure to ventilated alveoli. Two right-to-left anatomic shunts exist in normal humans: (1) bronchial venous drainage and (2) thebesian venous drainage (see Chapters 8 and 9). A right-to-left shunt causes poorly oxygenated venous blood to move directly into the arterial circulation (venous admixture), reducing the O2 content of arterial blood. Together, these normal shunts account for approximately three-fourths of the normal difference between PAO2 and PaO2. The remaining difference is a result of normal inequalities in pulmonary ventilation and perfusion.5
Regional Inequalities in Ventilation and Perfusion
The normal respiratory exchange ratio of 0.8 assumes that ventilation and perfusion in the lung are in balance, with every liter of alveolar ventilation ( ) matched by approximately 1 L of pulmonary capillary blood flow (
 ). Any variation from this perfect balance alters gas tensions in the affected alveoli. As previously discussed, changes in
  affect PACO2, which alters PAO2. Changes in blood flow also alter alveolar gas pressures. If blood flow to an area of the lung increases, CO2 coming from the tissues is delivered faster, causing an increase in PACO2 if minute ventilation remains the same. At the same time, O2 is taken up by the capillaries faster than restored by ventilation, causing a decrease in alveolar PAO2. Decrease in pulmonary capillary blood flow has the opposite effect (i.e., decrease in PACO2 and increase in PAO2) assuming minute ventilation remains the same.5,7,8
 and
and  are expressed as a ratio called the ventilation/perfusion ratio (
 ). An ideal ratio of 1.0 indicates that ventilation and perfusion are in perfect balance. A high
  indicates that ventilation is greater than normal, perfusion is less than normal, or both. In the presence of a high
  , PO2 is greater and PCO2 is less than normal. Conversely, a low
  indicates that ventilation is less than normal, perfusion is greater than normal, or both. In areas with a low
  , PAO2 is less than normal and PACO2 is greater than normal.
Effect of Alterations in Ventilation/Perfusion Ratio
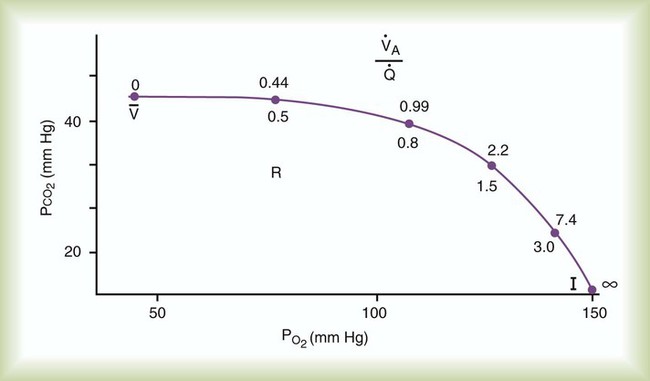
Figure 11-5 shows graphs of the effect of  changes on the respiratory exchange ratio (R), plotting all possible values of PAO2 and PACO2. When ventilation and perfusion are in perfect balance (
 = 0.99), R equals 0.8. At this point, PAO2 and PACO2 values equal the ideal values of 100 mm Hg and 40 mm Hg.
 and respiratory exchange ratio.
 As the  increases above 1.0 (following the curve to the right), R increases. The result is a higher PAO2 and lower PACO2. At the extreme right of the graph, perfusion is zero (
 = ∞). Areas with ventilation but no blood flow represent alveolar dead space (see Chapter 10). The makeup of gases in these areas is similar to that of inspired air (PO2 = 150 mm Hg; PCO2 = 0 mm Hg).
 decreases below 1.0 (following the curve to the left), R decreases. The result is a lower PAO2 and higher PACO2. At the extreme left of the graph, there is perfusion but no ventilation (
 = 0). With no ventilation to remove CO2 and restore fresh O2, the makeup of gases in these areas is similar to mixed venous blood (
 = 40 mm Hg;
  = 46 mm Hg).
 values of zero cannot pick up O2 or unload CO2 and leave the lungs unchanged. As this venous blood returns to the left side of the heart, it mixes with well-oxygenated arterial blood, diluting its O2 contents in a manner similar to that described for a right-to-left anatomic shunt. To distinguish such areas from true anatomic shunts, exchange
  values of zero are called alveolar shunts. Although small anatomic shunts are normal, alveolar shunts are not.
Causes of Regional Differences in Ventilation/Perfusion Ratio
Regional variations in  in a normal lung are mainly caused by gravity and are most evident in the upright posture. Because the pulmonary circulation is a low-pressure system, blood flow in the upright lung varies considerably from top to bottom (see Chapter 8). Farther down the lung, perfusion increases linearly in proportion to the hydrostatic pressure so that the lung bases receive nearly 20 times as much blood flow as the apexes.
Regional differences in ventilation throughout the lung also occur, but they are less drastic than the differences in perfusion. Similar to perfusion, ventilation also is increased in the lung bases, with approximately four times as much ventilation going to the bases than to the apexes of the upright lung. These regional differences in ventilation are caused by the effect of gravity on pleural pressures (see Chapter 10).
Table 11-1 summarizes the relationships between ventilation and perfusion by lung region.8 At the lung apexes, ventilation exceeds blood flow, resulting in a high  (approximately 3.3), high PO2 (132 mm Hg), and low PCO2 (32 mm Hg). Farther down the lung, blood flow increases more than ventilation owing to gravity. Toward the middle, the two are approximately equal (
 = 1.0). At the bottom of the lung, blood flow is greater than ventilation, resulting in a low
  (approximately 0.66), low PO2 (89 mm Hg), and slightly higher PCO2 (42 mm Hg).
TABLE 11-1
Summary of Variations in Gas Exchange in the Upright Lung, by Region
| Lung Region |  Ratio Ratio |
Mean PAO2 (mm Hg) | Mean PACO2 (mm Hg) | Blood Flow |
| Apexes | 3.3 | 132 | 32 | Low |
| Middle | 1.0 | 100 | 40 | Moderate |
| Bases | 0.66 | 89 | 42 | High |
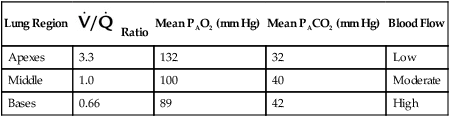
As shown in Table 11-1, because of gravity, most blood flows to the lung bases, where PO2 is less than normal and PCO2 is greater than normal. After leaving the lung, this large volume of blood combines with the smaller volume coming from the middle and apical regions. The result is a mixture of blood with less O2 and more CO2 than would come from an ideal gas exchange unit.
Oxygen Transport
Physically Dissolved Oxygen
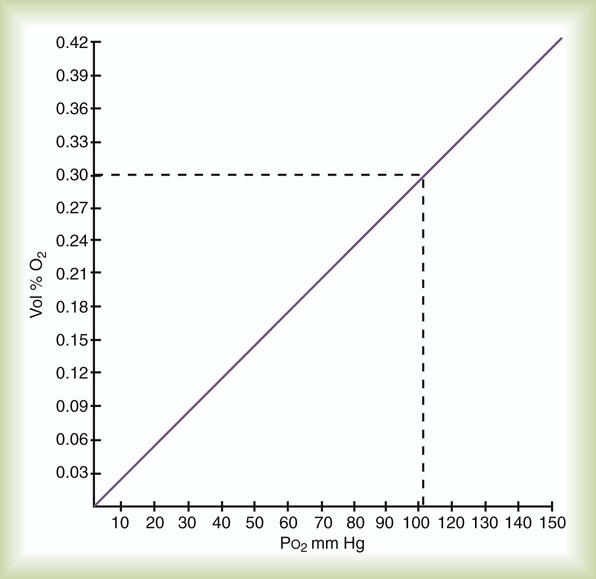
As gaseous O2 diffuses into the blood, it immediately dissolves in the plasma and erythrocyte fluid. By applying Henry’s law (see Chapter 6), the amount of dissolved O2 in the blood (at 37° C) can be computed with the following simple formula:

This equation is plotted in Figure 11-6, which shows that the relationship between partial pressure and dissolved O2 is direct and linear. In normal arterial blood with PaO2 of approximately 100 mm Hg, there is approximately 0.3 ml/dl of dissolved O2. However, if an individual with normal arterial blood breathes pure O2, PaO2 increases to approximately 670 mm Hg. In this case, the dissolved O2 would increase to approximately 2.0 ml/dl. The blood of someone breathing pure O2 in a hyperbaric chamber at 3 atm (2280 mm Hg) would carry nearly 6.5 ml/dl dissolved O2 in the plasma. This amount is enough to supply most tissue needs at rest by itself.
Chemically Combined Oxygen (Oxyhemoglobin)
Hemoglobin and Oxygen Transport
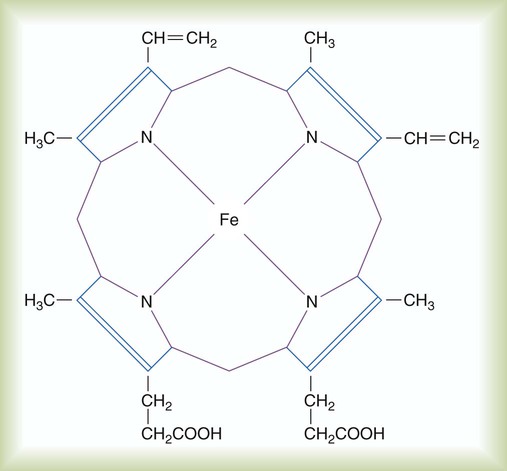
Most blood O2 is transported in chemical combination with Hb in the erythrocytes. Hb is a conjugated protein, consisting of four linked polypeptide chains (the globin portion), each of which is combined with a porphyrin complex called heme. The four polypeptide chains of Hb are coiled together into a ball-like structure, the shape of which determines its affinity for O2.5,8
As shown in Figure 11-7, each heme complex contains a centrally located ferrous iron ion (Fe++). When Hb is not carrying O2, this ion has four unpaired electrons. In this deoxygenated state, the molecule exhibits the characteristics of a weak acid. Deoxygenated Hb serves as an important blood buffer for hydrogen ions, a crucial factor in CO2 transport.


Oxyhemoglobin Dissociation Curve
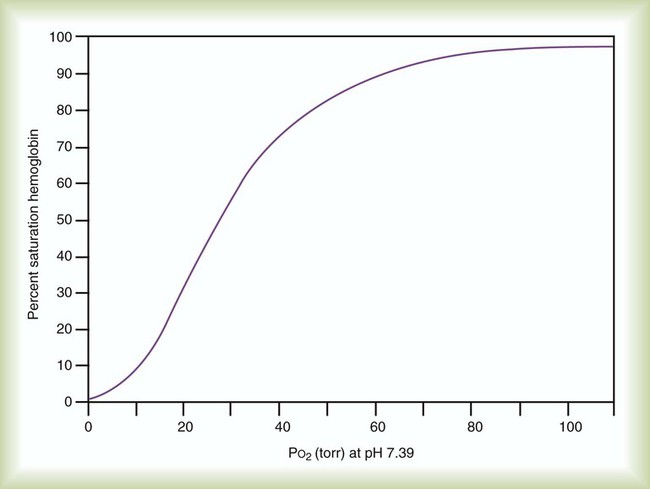
Hb saturation with O2 varies with changes in PO2. Plotting the saturation (y-axis) against PO2 (x-axis) yields the HbO2 dissociation curve (Figure 11-8). In contrast to dissolved O2, Hb saturation is not linearly related to PO2.4 Instead, the relationship forms an S-shaped curve. The flat upper part of this curve represents the normal operating range for arterial blood. Because the slope is minimal in this area, minor changes in PaO2 have little effect on SaO2, indicating a strong affinity of Hb for O2. With a normal PaO2 of 100 mm Hg, SaO2 is approximately 97%. If some abnormality (e.g., lung disease) reduced PaO2 to 65 mm Hg, SaO2 would still be approximately 90%.
Total Oxygen Content of the Blood
Total O2 content of the blood equals the sum of O2 dissolved and chemically combined with Hb.2,7 For total O2 content to be calculated, the following three values must be known: (1) PO2, (2) total Hb content (g/dl), and (3) Hb saturation. Given these values, the following equation can be applied:


 Problem
Normal Loading and Unloading of Oxygen (Arteriovenous Differences)
Figure 11-9 uses the oxyhemoglobin dissociation curve to show the effects of O2 loading and unloading in the lungs and tissues. Point A represents freshly arterialized blood leaving the pulmonary capillaries, with PO2 of approximately 100 mm Hg and Hb saturation of approximately 97%. As blood perfuses body tissues, O2 uptake causes a decrease in both PO2 and saturation, such that venous blood leaving the tissues (point V) has PO2 of approximately 40 mm Hg, with Hb saturation of approximately 73%.
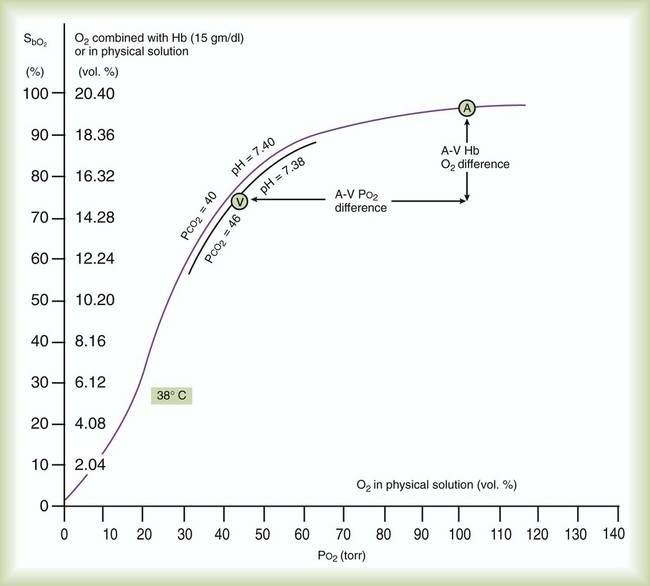
Using a normal Hb content of 15 g/dl and knowing the saturation at each possible PO2, the total O2 content can be calculated at any PO2 in the manner previously described. The y-axis of Figure 11-9 provides this information in SaO2 increments of 10%. Table 11-2 summarizes the difference between the O2 content of these normal arterial and venous points.
TABLE 11-2
Oxygen Content of Arterial and Venous Blood
| O2 Content | Arterial O2 (ml/dl) | Venous O2 (ml/dl) |
| Combined O2 (1.34 × 15 × SO2) | 19.5 | 14.7 |
| Dissolved O2 (PO2 × 0.003) | 0.3 | 0.1 |
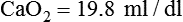
| Total O2 content | 19.8 | 14.8 |
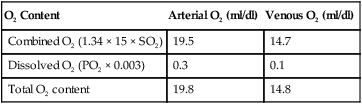
As indicated in Table 11-2, the difference between the arterial and venous O2 contents is normally approximately 5 ml/dl. This is the arterial-to-mixed venous O2 content difference (C( )O2). C(
 )O2 is the amount of O2 given up by every 100 ml of blood on each pass through the tissues.
 )O2 indicates O2 extraction in proportion to blood flow. If this measure is combined with total-body O2 consumption, cardiac output can be calculated. The basis for this calculation is the classic Fick equation:
 is cardiac output (L/min),
  is the whole-body O2 consumption (ml/min), and C(
 )O2 is the arteriovenous O2 content difference (ml/dl). The factor of 10 converts ml/dl to ml/L. Given a normal
  of 250 ml/min and a normal C(
 )O2 of 5 ml/dl, a normal cardiac output is calculated as follows:

Significance of Arterial-to-Mixed Venous Oxygen Content Difference
According to the Fick equation, if O2 consumption remains constant, a decrease in cardiac output increases C( )O2. Conversely, if the cardiac output increases and O2 consumption remains constant, C(
 )O2 decreases proportionately. Although the Fick equation for calculating cardiac output has been replaced by other techniques, the principle relating C(
 )O2 to perfusion is used to monitor tissue oxygenation at the bedside. More details on these methods are provided in Chapter 46.
Factors Affecting Oxygen Loading and Unloading
In addition to the shape of the HbO2 curve, many other factors affect O2 loading and unloading. Among the most important factors in clinical practice are blood pH, body temperature, and erythrocyte concentration of certain organic phosphates.5 Variations in the structure of Hb also affect O2 loading and unloading, as can chemical combinations of Hb with substances other than O2, such as carbon monoxide.
pH (Bohr Effect)
The impact of changes in blood pH on Hb affinity for O2 is called the Bohr effect. As shown in Figure 11-10, the Bohr effect alters the position of the HbO2 dissociation curve. A low pH (acidity) shifts the curve to the right, whereas a high pH (alkalinity) shifts it to the left. These changes are a result of variations in the shape of the Hb molecule caused by fluctuations in pH.
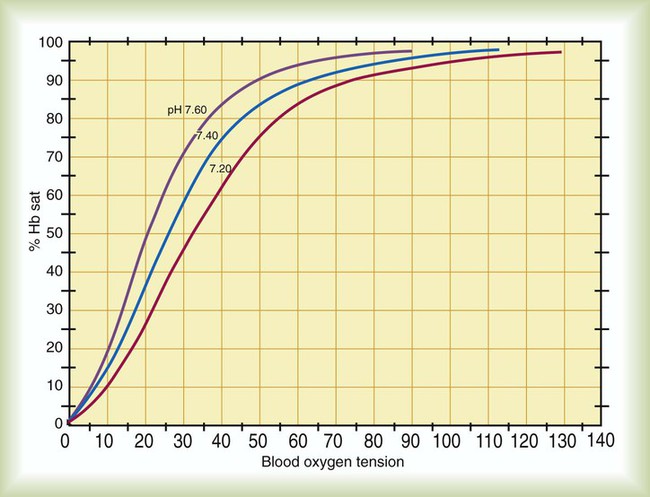
As blood pH decreases and the curve shifts to the right, the Hb saturation for a given PO2 decreases (decreased Hb affinity for O2). Conversely, as blood pH increases and the curve shifts to the left, the Hb saturation for a given PO2 increases (increased affinity of Hb for O2).4,5,8
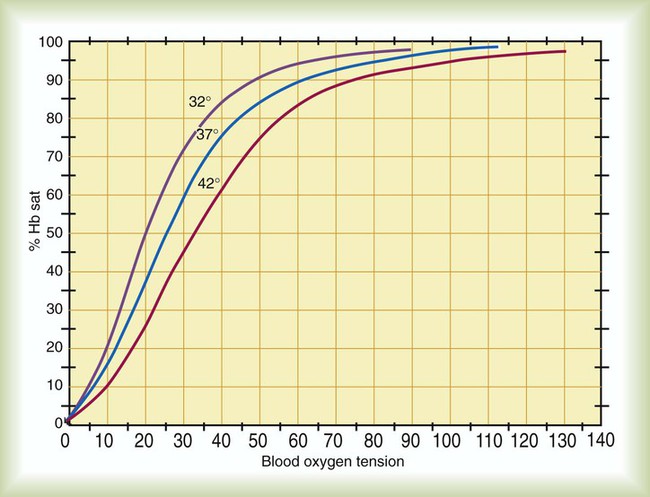
Body Temperature
Variations in body temperature also affect the HbO2 dissociation curve. As shown in Figure 11-11, a decrease in body temperature shifts the curve to the left, increasing Hb affinity for O2. Conversely, as body temperature increases, the curve shifts to the right, and the affinity of Hb for O2 decreases. As with the Bohr effect, these changes enhance normal O2 uptake and delivery. At the tissues, temperature changes are directly related to metabolic rate, such that areas of high metabolic activity have higher temperatures. In exercising muscle, higher temperatures decrease Hb affinity for O2, enhancing its release to the tissues. Conversely, in hypothermia, the O2 demands of the tissues are greatly reduced, and Hb need not give up as much of its O2.2
Organic Phosphates (2,3-Diphosphoglycerate)
The organic phosphate 2,3-diphosphoglycerate (2,3-DPG) is found in abundance in the RBCs, where it forms a loose chemical bond with the globin chains of deoxygenated Hb. In this configuration, 2,3-DPG stabilizes the molecule in its deoxygenated state, reducing its affinity for O2.5–7 Without 2,3-DPG, Hb affinity for O2 would be so great that normal O2 unloading would be impossible. Increased 2,3-DPG concentrations shift the HbO2 curve to the right, promoting O2 unloading. Conversely, low 2,3-DPG concentrations shift the curve to the left, increasing Hb affinity for O2.
Abnormal Hemoglobin
Abnormalities in the Hb molecule also can affect O2 loading and unloading. Structural abnormalities occur when the amino acid sequence in the polypeptide chains of the molecule varies from normal.5 Changes in amino acid sequences alter the shape of the molecule, increasing or decreasing its O2 affinity. More than 120 abnormal hemoglobins have been identified. In healthy individuals, 15% to 40% of the circulating Hb may be abnormal.
Methemoglobin (metHb) is an abnormal form of the molecule, in which the heme-complex normal ferrous iron ion (Fe++) loses an electron and is oxidized to its ferric state (Fe++). In the ferric state, the iron ion cannot combine with O2. The result is a special form of anemia called methemoglobinemia. As with HbCO, clinical abnormalities come from the associated increased affinity for O2 and loss of O2-binding capacity. The most common cause of methemoglobinemia is the therapeutic use of oxidant medications such as nitric oxide, nitroglycerin, and lidocaine. When using these therapeutic agents, frequent monitoring for metHb is important to weigh the risk against the benefit. The presence of metHb turns the blood brown, which can produce a slate-gray skin coloration that is often confused with cyanosis. The presence of metHb is confirmed by spectrophotometry (see Chapter 18). Methemoglobinemia is treated with reducing agents such as methylene blue or ascorbic acid when the blood level exceeds approximately 30%.
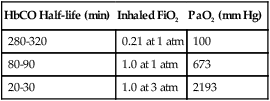
Carboxyhemoglobin (HbCO) is the chemical combination of Hb with carbon monoxide. The affinity of Hb for carbon monoxide is more than 200 times greater than it is for O2. Extremely low concentrations of carbon monoxide can quickly displace O2 from Hb, forming HbCO. Carbon monoxide partial pressure of 0.12 mm Hg can displace half the O2 from Hb. Because HbCO cannot carry O2, each 1 g of Hb saturated with carbon monoxide represents a loss in carrying capacity. The combination of carbon monoxide with Hb shifts the HbO2 curve to the left, impeding O2 delivery to the tissues further. Treatment for carbon monoxide poisoning involves giving the patient as much O2 as possible because O2 reduces the half-life of HbCO (Table 11-3). Sometimes a hyperbaric chamber is required to reverse rapidly the binding of CO with Hb.
TABLE 11-3
Half-Life of Carboxyhemoglobin (HbCO) at Different Oxygen Exposures
| HbCO Half-life (min) | Inhaled FiO2 | PaO2 (mm Hg) |
| 280-320 | 0.21 at 1 atm | 100 |
| 80-90 | 1.0 at 1 atm | 673 |
| 20-30 | 1.0 at 3 atm | 2193 |
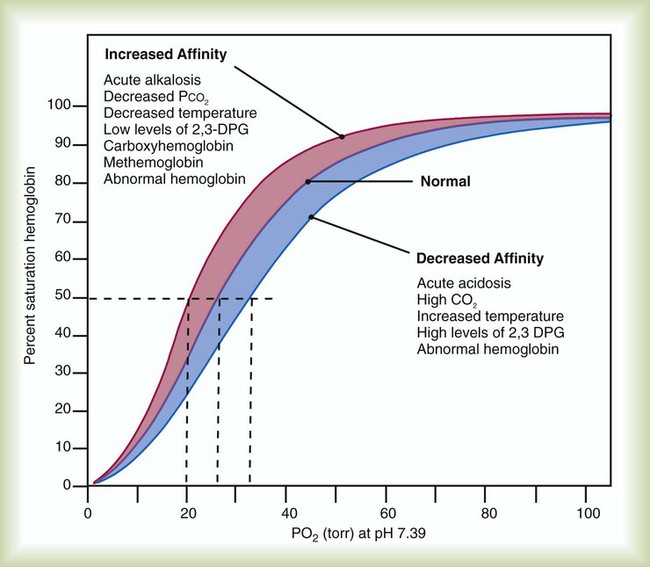
Measurement of Hemoglobin Affinity for Oxygen
Variations in the affinity of Hb for O2 are quantified by a measure called the P50.2,8 The P50 is the partial pressure of O2 at which the Hb is 50% saturated, standardized to a pH level of 7.40. A normal P50 is approximately 26.6 mm Hg. Conditions that cause a decrease in Hb affinity for O2 (a shift of the HbO2 curve to the right) increase the P50 to a value higher than normal. Conditions associated with an increase in affinity (a shift of the HbO2 curve to the left) decrease the P50 to lower than normal. With 15 g/dl Hb, a 4-mm Hg increase in P50 results in approximately 1 to 2 ml/dl more O2 being unloaded in the tissues than when the P50 is normal. Figure 11-12 shows the effect of changes in P50 and summarizes how the major factors previously discussed affect Hb affinity for O2.
Carbon Dioxide Transport
Figure 11-13 shows the physical and chemical events of gas exchange at the systemic capillaries. In the pulmonary capillaries, all events occur in the opposite direction. Although the primary focus is on CO2 transport, Figure 11-13 also includes the basic elements of O2 exchange. O2 exchange is included here for completeness and to show that the exchange and transport of these two gases are closely related.
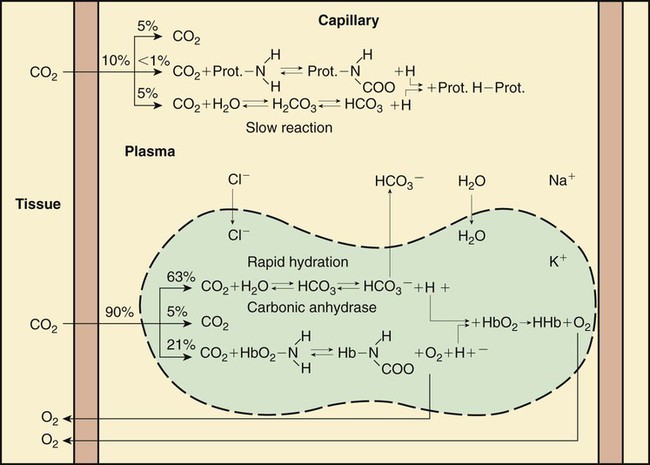
Transport Mechanisms
Approximately 45 to 55 ml/dl of CO2 is normally carried in the blood in the following three forms: (1) dissolved in physical solution, (2) chemically combined with protein, and (3) ionized as bicarbonate.5,7


Carbon Dioxide Dissociation Curve
As with O2, CO2 has a dissociation curve. The relationship between blood PCO2 and CO2 content is depicted in Figure 11-14. The first point to note is the effect of Hb saturation with O2 on this curve. As previously discussed, CO2 levels, through their influence on pH, modify the O2 dissociation curve (Bohr effect). Figure 11-14 shows that oxyhemoglobin saturation also affects the position of the CO2 dissociation curve. The influence of oxyhemoglobin saturation on CO2 dissociation is called the Haldane effect. As previously explained, this phenomenon is a result of changes in the affinity of Hb for CO2, which occur as a result of its buffering of H+ ions.4–7
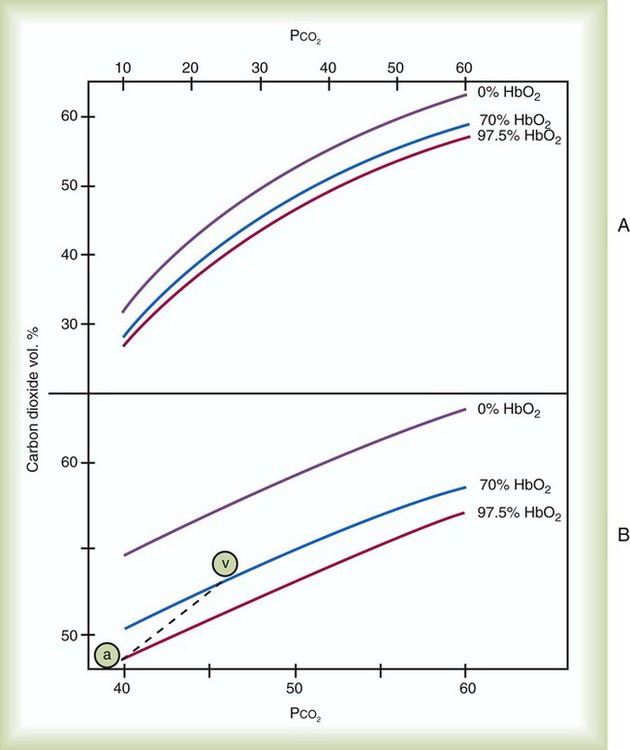
Figure 11-14, A shows CO2 dissociation curves for three levels of blood O2 saturation. The first two are physiologic values, and the third extreme value is provided for contrast. Figure 11-14, B amplifies selected segments of these curves in the physiologic range of PCO2. Note first the arterial point “a” lying on the curve representing SaO2 of 97.5%. At this point, PCO2 is 40 mm Hg, and CO2 content is approximately 48 ml/dl. The venous point “v” falls on the curve, representing SaO2 of approximately 70%. At this point, PCO2 is 46 mm Hg, and CO2 content is approximately 52 ml/dl. Because O2 saturation changes from arterial to venous blood, the true physiologic CO2 dissociation curve must lie somewhere between these two points. This physiologic curve is represented as the dashed line in Figure 11-14, B.
 ) increases the capacity of the blood for CO2, aiding uptake at the tissues.
The total CO2 content of arterial and venous blood is compared in Table 11-4. The amounts of CO2 are expressed in gaseous volume equivalents (ml/dl) and as millimoles per liter (mmol/L). This latter measure of the chemical combining power of CO2 in solutions is critical in understanding the role of this gas in acid-base balance.
TABLE 11-4
Carbon Dioxide Content of Arterial and Venous Blood
| Unit of Measure | Arterial | Venous |
| mmol/L | 21.53 | 23.21 |
| ml/dl | 48.01 | 51.76 |
Abnormalities of Gas Exchange and Transport
Gas exchange is abnormal when either tissue O2 delivery or CO2 removal is impaired.
Impaired Oxygen Delivery
O2 delivery ( ) to the tissues is a function of arterial O2 content (CaO2) times cardiac output (
 ):
):
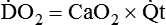
When O2 delivery is inadequate for cellular needs, hypoxia occurs. According to the preceding equation, hypoxia occurs if (1) the arterial blood O2 content is decreased, (2) cardiac output or perfusion is decreased (shock or ischemia), or (3) abnormal cellular function prevents proper uptake of O2. Table 11-5 summarizes causes, common clinical indicators, mechanisms, and examples of hypoxia.
TABLE 11-5
| Cause | Primary Indicator | Mechanism | Example |
| Hypoxemia | |||
| Low PiO2 | Low PAO2 | Reduced PB | Altitude |
| Low PaO2 | |||
| Hypoventilation | High PaCO2 | Decreased  |
Drug overdose |
 imbalance imbalance |
Low PaO2 | Decreased  relative to perfusion relative to perfusion |
COPD, aging |
| High P(A−a)O2 on air; resolves with O2 | |||
| Anatomic shunt | Low PaO2 | Blood flow from right to left side of heart | Congenital heart disease |
| High P(A−a)O2 on air; does not resolve with O2 | |||
| Physiologic shunt | Low PaO2 | Perfusion without ventilation | Atelectasis |
| High P(A−a)O2 on air; does not resolve with O2 | |||
| Diffusion defect | Low PaO2 | Damage to alveolar-capillary membrane | ARDS |
| High P(A−a)O2 on air; resolves with O2 | |||
| Hb deficiency | |||
| Absolute | Low Hb content | Loss of Hb | Hemorrhage |
| Reduced CaO2 | |||
| Relative | Abnormal SaO2 | Abnormal Hb | Carboxyhemoglobin |
| Reduced CaO2 | |||
| Low blood flow | Increased C( )O2 )O2 |
Decreased perfusion | Shock, ischemia |
| Dysoxia | Normal CaO2 | Disruption of cellular enzymes | Cyanide poisoning |
Decreased C( )O2 )O2 |
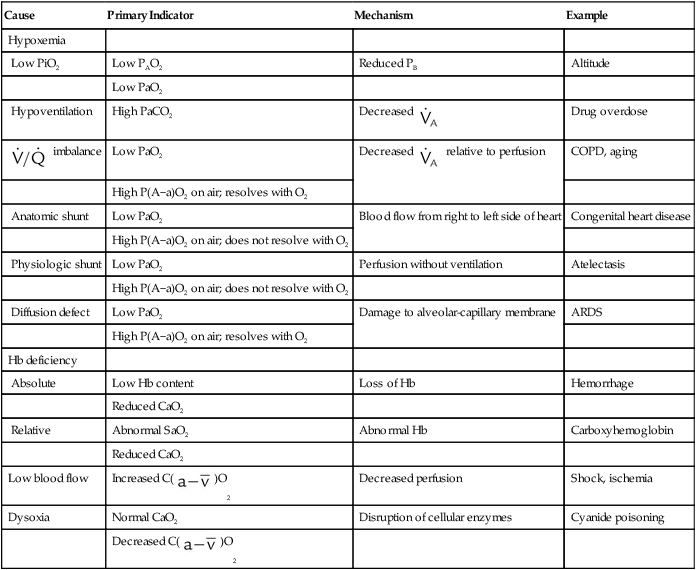
ARDS, Acute respiratory distress syndrome; COPD, chronic obstructive pulmonary disease.
Hypoxemia
Decreased Partial Pressure of Oxygen in Arterial Blood
 imbalances, and right-to-left anatomic or physiologic shunting. PO2 also decreases normally with aging. The normal predicted PaO2 decreases steadily with age, and the average is approximately 85 mm Hg at age 60 years (see later discussion).
 imbalances are the most common cause of hypoxemia in patients with lung disease. A
  imbalance is an abnormal deviation in the distribution of ventilation to perfusion in the lung. The normal lung has some
  mismatch; however, in disease states, the degree of
  imbalances becomes much greater.
 mismatch. It is usually expressed as a percentage of the total cardiac output:
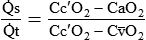
 = Blood entering systemic blood without being oxygenated in the lungs
 = Total cardiac output
Cc′O2 = O2 content at the end of the ventilated and perfused pulmonary capillaries
 = Mixed venous O2 content
Dead space is generally expressed as a ratio to total tidal volume:
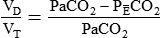
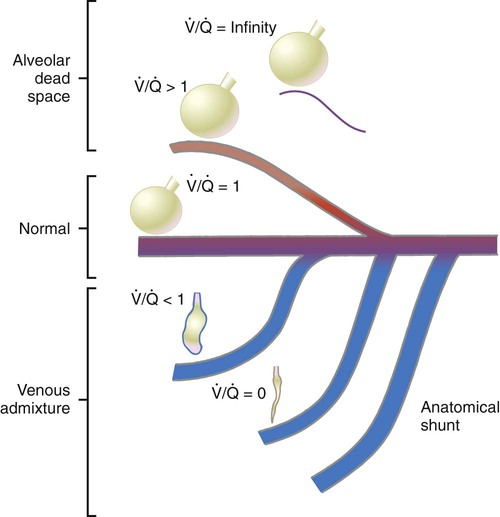
Figure 11-15 shows the possible range of  . As shown in the top two units, when ventilation is greater than perfusion (high
  ), there is wasted ventilation, or alveolar dead space. Conversely, when ventilation is less than perfusion,
  is low (bottom two lung units). In this case, blood leaves the lungs with an abnormally low O2 content. In lung disease,
  imbalances usually cause both excess wasted ventilation and poor oxygenation. Because
  imbalance impairs O2 exchange, PaO2 is reduced.
 ratios.
 To understand how  imbalance causes hypoxemia, reinspect the normal oxyhemoglobin dissociation curve, with PO2 plotted against O2 content (Figure 11-16). The curve is nearly flat in the physiologic range of PaO2 (>70 mm Hg) but falls steeply when PaO2 is less than 60 mm Hg. Points representing O2 content of three separate lung units also are shown. These units have
  of 0.1, 1.0, and 10.0.
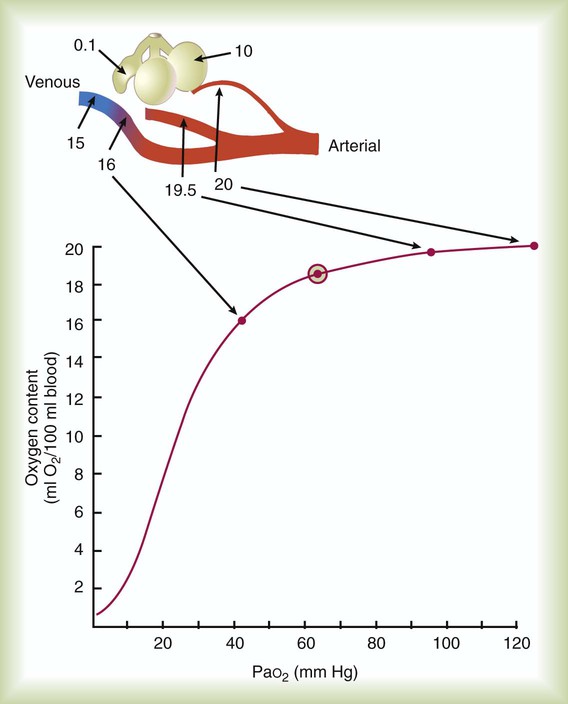
 of 0.1, 1, and 10 is 16 ml/dl, 19.5 ml/dl, and 20.0 ml/dl. Lines are drawn for each O2 content to its point on the dissociation curve. The average O2 content, 18.5 ml/dl, is represented by a circle on the dissociation curve.
  = 1) has a normal O2 content (19.5 ml/dl). Blood leaving the unit with poor ventilation (
 = 0.1) has a low O2 content (16.0 ml/dl). Because Hb is almost fully saturated at a normal PO2 of 100 mm Hg, blood leaving the over ventilated unit (
 = 10) has an O2 content that is just slightly greater than normal (20.0 ml/dl). When the blood from all three units mixes together, the result is O2 content that is reduced (18.5 ml/dl). The decrease in oxygenation caused by the
  unit.
unit. of zero represents a special type of imbalance. When
  is zero, there is blood flow but no ventilation. The result is equivalent to a right-to-left anatomic shunt, shown at the bottom of Figure 11-15. Venous blood bypasses ventilated alveoli and mixes with freshly oxygenated arterial blood, resulting in what is called a venous admixture. Right-to-left physiologic shunting results in a more severe form of hypoxemia than a simple
  imbalance, as seen in conditions such as pulmonary edema, pneumonia, and atelectasis.
 Rule of Thumb
 imbalances are the most common cause of hypoxemia in patients with respiratory diseases, physiologic shunting also can occur commonly, especially in patients who are critically ill. To differentiate between hypoxemia caused by a
  imbalance and hypoxemia caused by shunting, apply the following 50/50 rule: If O2 concentration is greater than 50 (%) and PaO2 is less than 50 (mm Hg), significant shunting is present; otherwise, the hypoxemia is mainly caused by a simple
  imbalance.
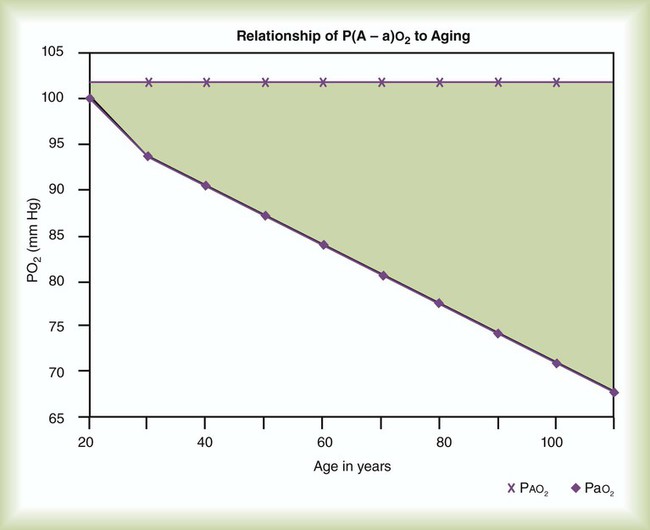
When a low PaO2 is observed, the RT must take into account the normal decrease in arterial O2 tension that occurs with aging. As shown in Figure 11-17, for an individual breathing air at sea level, the “normal” P(A−a)O2 increases in a near-linear fashion with increasing age (shaded area). This increase in P(A−a)O2 results in a gradual decline in PaO2 over time and is probably caused by reduced surface area in the lung for gas exchange and increases in  mismatching. PaO2 of 85 mm Hg in a 60-year-old adult would be interpreted as normal, but the same PaO2 in a 20-year-old adult would indicate hypoxemia. The expected PaO2 in older adults may be estimated by using the following formula:

Hemoglobin Deficiencies
Hb deficiencies, or anemias, can be either absolute or relative. Absolute Hb deficiency occurs when the Hb concentration is lower than normal. Relative Hb deficiencies are caused by either the displacement of O2 from normal Hb or the presence of abnormal Hb variants. A low blood Hb concentration may be caused either by a loss of RBCs, as with hemorrhage, or by inadequate erythropoiesis (formation of RBCs in the bone marrow). Regardless of the cause, a low Hb content can seriously impair the O2-carrying capacity of the blood, even in the presence of a normal supply (PaO2) and adequate diffusion.5
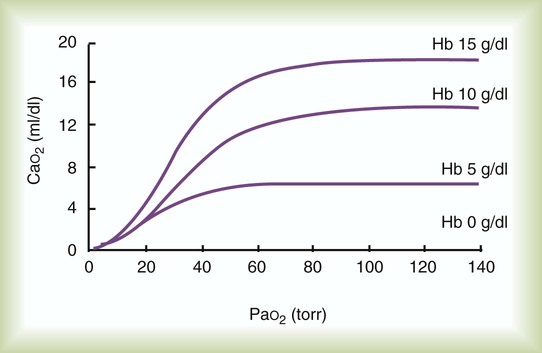
Figure 11-18 plots the relationship between arterial O2 content and PaO2 as a function of Hb concentration. As can be seen, progressive decreases in blood Hb content cause large decreases in arterial O2 content (CaO2). A 33% decrease in Hb content (from 15 g/dl to 10 g/dl) reduces CaO2 as much as would a decrease in PaO2 from 100 mm Hg to 40 mm Hg.
Mini Clini
Effect of Anemia on Oxygen Content
 Problem
1. Calculate dissolved O2 the same way for all four examples as follows:

2. Compute chemically combined O2 as follows: Chemically combined O2 = Hb (g/dl) × 1.34 ml/g × SaO2
a. 15 g/dl × 1.34 ml/g × 97% = 19.50 ml/dl
b. 12 g/dl × 1.34 ml/g × 97% = 15.60 ml/dl
3. Compute total O2 content as follows:

Dysoxia
Figure 11-19 plots tissue O2 consumption ( ) against O2 delivery (
 ) in both normal and pathologic states. Normally, the tissues extract as much O2 as they need from what is delivered, and O2 consumption equals O2 demand (flat portion of solid line). However, if delivery decreases, conditions begin to change (solid line). At a level called the point of critical delivery, tissue extraction reaches a maximum. Further decreases in delivery result in an O2 “debt,” which occurs when O2 demand exceeds O2 delivery. Under conditions of O2 debt, O2 consumption becomes dependent on O2 delivery (sloped line). This dependence leads to lactic acid accumulation and metabolic acidosis.
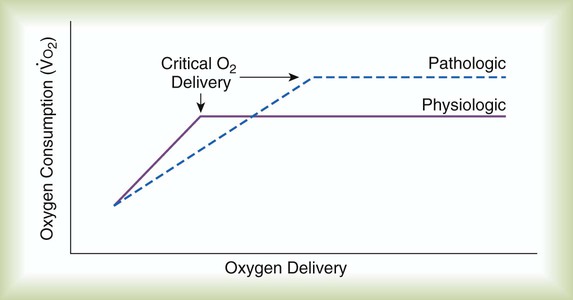
In pathologic conditions such as septic shock and acute respiratory distress syndrome (dotted line), this critical point may occur at levels of O2 delivery considered normal. In addition, the slope of the curve below the point of critical delivery may be less than normal, indicating a decreased extraction ratio ( ).6 In combination, these findings indicate that O2 demands are not being met and that a defect exists in the cellular mechanisms regulating O2 uptake.
Impaired Carbon Dioxide Removal
Any disorder that decreases alveolar ventilation ( ) relative to metabolic need impairs CO2 removal. Impaired CO2 removal by the lung causes hypercapnia and respiratory acidosis (see Chapter 13). A decrease in alveolar ventilation occurs when (1) the minute ventilation is inadequate, (2) the dead space ventilation per minute is increased, or (3) a
  imbalance exists.4–8
Ventilation/Perfusion Imbalances
 imbalance should cause an increase in PaCO2. However, PaCO2 does not always increase in these cases. Many patients who are hypoxemic because of a
  imbalance have a low or normal PaCO2. This common clinical finding suggests that
  imbalances have a greater effect on oxygenation than on CO2 removal.
Careful inspection of the O2 and CO2 dissociation curves supports this finding. The O2 and CO2 dissociation curves are plotted on the same scale in Figure 11-20. The upper CO2 curve is nearly linear in the physiologic range. The lower O2 curve is almost flat in the physiologic range. Point “a” on each curve is the normal arterial point for both content and partial pressure. To the right of the graph are two lung units, one with a low  and the other with a high
  . The blood O2 and CO2 contents from each unit are plotted on the curves.
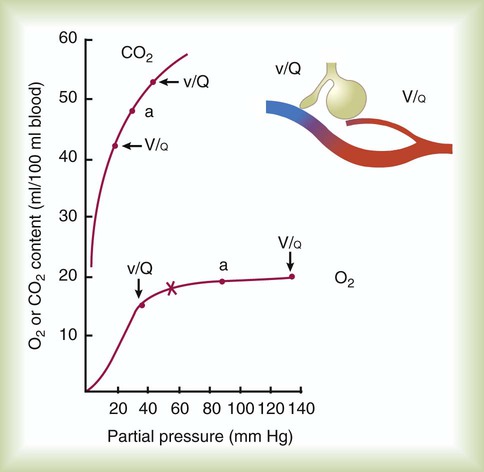
 imbalance and dissociation curves for CO2 and O2.
  represents low
  units, and V/q represents high
  units. See text for discussion.
 points, is shown as point “a” on the CO2 curve. This point is the same as the normal arterial point for CO2.
 points, is shown as point “X” on the O2 curve. Although the averaged value for CO2 was normal, the PaO2 resulting from averaging the O2 content of the high and low
  units is well below normal (point “a” on the O2 curve).
 units is decreased PaO2 and increased PaCO2. The effect of high
  units is the opposite (i.e., increased PO2 and decreased PCO2). However, the shape of the dissociation curves dictates that a high
  unit can reverse the high PCO2 but not the low PO2. Any increase in PCO2 from low
  units can be corrected by a reduction in PCO2 from high
  units. However, these same high
  units cannot compensate for the reduced O2 content because the O2 curve is nearly flat when PO2 is higher than normal.
Patients with  imbalances still must compensate for high PCO2 coming from underventilated units. To compensate for these high PCO2 values, the patient’s minute ventilation must increase (Figure 11-21). Patients who can increase their minute ventilation tend to have either normal or low PaCO2, combined with hypoxemia.
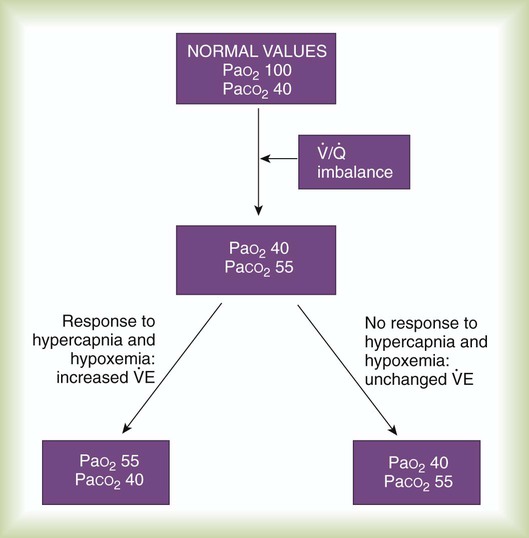
 imbalance. All values are given in millimeters of mercury (mm Hg).
 imbalance who cannot increase their minute ventilation are hypercapnic.
  imbalance is severe and chronic, as in COPD. Such a patient must sustain a higher than normal minute ventilation just to maintain normal PaCO2. If the energy costs required to sustain a high minute ventilation are prohibitive, the patient opts for less work—and hence elevated PaCO2.
Summary Checklist
• Movement of gases between the lungs and the tissues depends mainly on diffusion.
• PACO2 varies directly with CO2 production and inversely with alveolar ventilation.
• PAO2 is computed using the alveolar air equation.
• With a constant FiO2, PAO2 varies inversely with PACO2.
• Normal PAO2 averages 100 mm Hg, with mean PACO2 of approximately 40 mm Hg.
• Normal mixed venous blood has PO2 of approximately 40 mm Hg and PCO2 of approximately 46 mm Hg
• Ventilation and perfusion must be in balance for pulmonary gas exchange to be effective. Because of normal anatomic shunts and  imbalances, pulmonary gas exchange is imperfect.
• In disease,  can range from zero (perfusion without ventilation or physiologic shunting) to infinity (pure alveolar dead space).
• Blood carries a small amount of O2 in physical solution, and larger amounts are carried in chemical combination with erythrocyte Hb.
• Hb saturation is the ratio of oxyhemoglobin to total Hb, expressed as a percentage.
• To compute total O2 contents of the blood, add the dissolved O2 content (0.003 × PO2) to the product of Hb content × Hb saturation × 1.34.
• C( )O2 is the amount of O2 given up by every 100 ml of blood on each pass through the tissues. All else being equal, C(
 )O2 varies inversely with cardiac output.
• Hb affinity for O2 increases with high PO2, high pH, low temperature, and low levels of 2,3-DPG.
• Hb abnormalities can affect O2 loading and unloading and can cause hypoxia.
• Most CO2 (about 80%) is transported in the blood as ionized bicarbonate; other forms include carbamino compounds in physical solution.
• Changes in CO2 levels modify the O2 dissociation curve (Bohr effect). Changes in Hb saturation affect the CO2 dissociation curve (Haldane effect). These changes are mutually beneficial, assisting in gas exchange at the lung and the cellular level.
• Hypoxia occurs if (1) the arterial blood O2 content is decreased, (2) blood flow is decreased, or (3) abnormal cellular function prevents proper uptake of O2.
• Decreased PaO2 level may be a result of a low ambient PO2, hypoventilation, impaired diffusion,  imbalances, and right-to-left anatomic or physiologic shunting.
• A decrease in alveolar ventilation occurs when (1) the minute ventilation is inadequate, (2) dead space ventilation is increased, or (3) a  imbalance exists.