Nutrition Assessment
After reading this chapter you will be able to:
 Describe how a comprehensive nutrition assessment is conducted.
 Describe how to calculate and interpret body mass index.
 Describe how to distinguish two forms of protein-energy malnutrition from each other.
 List the biochemical indicators of nutrition status.
 State what to observe clinically in a malnourished patient.
 Describe how to obtain and evaluate a nutrition history.
 Describe how to estimate daily resting energy expenditure.
 List the indications, contraindications, hazards, and limitations of indirect calorimetry.
 Describe how to prepare a patient properly for indirect calorimetry.
 Describe how to interpret the results of indirect calorimetry.

 State the effects of malnutrition on the respiratory system.
 Describe how to identify patients at high risk for malnutrition.
 Identify the effect of too much protein, carbohydrate, or fat on a patient.
 State when enteral nutrition and parenteral nutrition are needed.
 Describe how to identify and minimize the common respiratory complications of enteral feedings.
 State specific nutrition guidelines that apply to patients with specific pulmonary diseases.

Nutrition Assessment
Registered dietitians or physicians obtain data from numerous sources for nutrition assessment. Interviewing the individual or the caregiver to determine past and current eating practices is most helpful. Medical charts reveal additional information regarding social, pharmaceutical, environmental, and medical issues. In particular, the ABCDs of nutrition assessment—anthropometrics, biochemical tests, clinical observations, and dietary analyses (described subsequently)—lead to nutrition care plans.1
The social history of an individual includes marital status, employment, education, and economic status. Drug-nutrient interactions may be identified from prescribed medications that lead to potential nutrient deficiencies. Environmental issues could point out the difficulties the individual has in procuring, storing, or preparing food. The education attained by the individual could determine the potential for understanding and applying nutrition counseling. The economic status of the individual may drive certain food choices.2 Box 21-1 presents an overview of the information to incorporate into a nutrition assessment.
Anthropometrics
Height and Weight
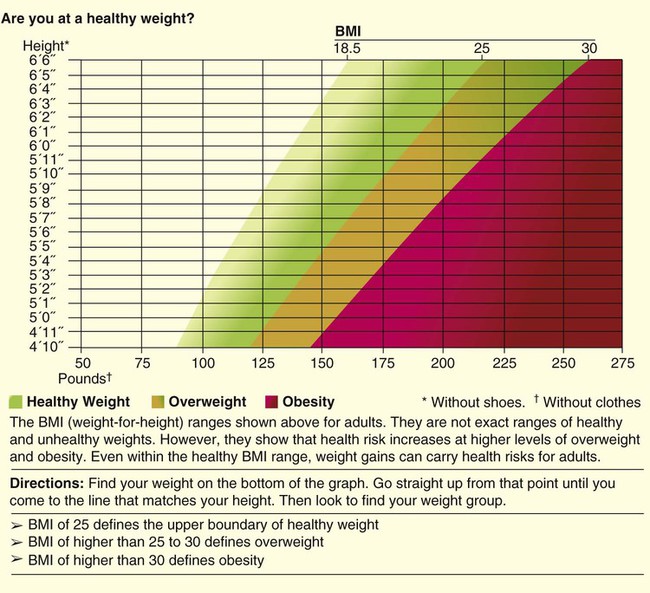
A measured height and weight is preferred, but the clinician may ask the patient or caregiver for the height and weight. When the data are recorded, a notation should be made of the date and whether the height and weight were stated or measured. The height and weight can be evaluated to determine weight status by comparing actual body weight with ideal body weight. Table 21-1 shows healthy weights for adults. Ideal body weight may also be determined using the Hamwi formulas. To estimate ideal body weight in pounds, the following simple formulas (Hamwi method) can be used:
TABLE 21-1
| Weight (lb)* | ||
| Height* | Midpoint | Range |
| 4′10″ | 105 | 91-119 |
| 4′11″ | 109 | 94-124 |
| 5′0″ | 112 | 97-128 |
| 5′1″ | 116 | 101-132 |
| 5′2″ | 120 | 104-137 |
| 5′3″ | 124 | 107-141 |
| 5′4″ | 128 | 111-146 |
| 5′5″ | 132 | 114-150 |
| 5′6″ | 136 | 118-155 |
| 5′7″ | 140 | 121-160 |
| 5′8″ | 144 | 125-164 |
| 5′9″ | 149 | 129-169 |
| 5′10″ | 153 | 132-174 |
| 5′11″ | 157 | 136-179 |
| 6′0″ | 162 | 140-184 |
| 6′1″ | 166 | 144-189 |
| 6′2″ | 171 | 148-195 |
| 6′3″ | 176 | 152-200 |
| 6′4″ | 180 | 156-205 |
| 6′5″ | 185 | 160-201 |
| 6′6″ | 190 | 164-216 |

From Report of the Dietary Guidelines Advisory Committee on the Dietary Guidelines for Americans, Washington, DC, 1995, Government Printing Office.
< ?xml:namespace prefix = "mml" />


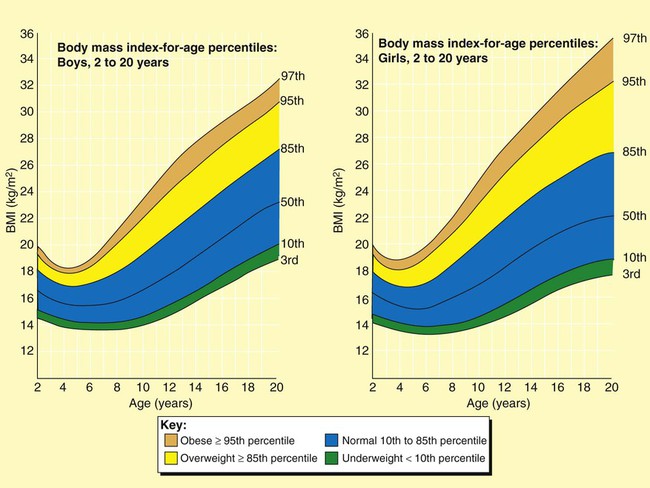
A more useful number, the body mass index (BMI), may also be calculated. This number is a handy tool for determining the category of body weight: underweight, healthy weight, overweight, obese, or morbidly obese (Figures 21-1 and 21-2). BMI numerically states the relationship of weight to height. The formula used to calculate BMI is as follows for measurements in kilograms and meters:

The following formula is used when the weight and height measurements are in pounds and inches:

An Internet calculator for BMI is available at: http://www.nhlbisupport.com/bmi/.
Body Mass Index Categories
A healthy weight is defined as a BMI between 18.5 and 24.9 for adults or a BMI-for-age between the 10th and 85th percentiles for children.2 A BMI of 25.0 to 29.9 indicates excessive weight in adults and a BMI-for-age between the 85th and 95th percentiles indicates excessive weight in children. Obesity is defined as a BMI greater than 30 in adults and greater than the 95th percentile in boys and girls 2 to 20 years old. Adults who are categorized as underweight have a BMI less than 18.5, and underweight children have a BMI-for-age in the 10th percentile (see Figures 21-1 and 21-2).3,4
Kwashiorkor and Marasmus
Undernutrition classifications include kwashiorkor and marasmus. Typically seen in children 6 to 18 months old in deprived areas of the world, marasmus results from an extreme lack of calories and protein over a long time. “Matchstick” arms and obvious lack of muscle and fat characterize a child or adult with marasmus. Kwashiorkor results from a more sudden lack of protein and calories, as in a first-born infant weaned suddenly on the arrival of a new sibling, when a diet of nutrient-rich breast milk is traded for a nutrient-poor, cereal-based diet.2 The protruding belly and edematous face and limbs that are characteristics of kwashiorkor result from a lack of circulating proteins needed to maintain fluid balance and to transport fat out of the liver. Numerous sequelae accompany changes in the liver. Infections and parasites may also cause the enlarged belly seen in kwashiorkor.2 Some patients exhibit combined kwashiorkor and marasmus from protein and calorie deprivation over an extended period. A mixture of loss of muscle and fat and circulating albumin is evident in the extreme wasting and edema that are present.
Body Composition
Other anthropometric measurements useful in nutrition assessment are arm muscle area (index for muscle) and skinfolds (measures of fat), bioelectric impedance analysis devices, and more sophisticated imaging technologies. These methods are generally expensive and time-consuming and are not relevant in the clinical setting but may be more useful in research settings.5
Triceps Skinfold
Measurement of the triceps skinfold is done on the right arm at the midpoint between the acromion process of the scapula and the inferior margin of the olecranon process of the ulna. The arm should be bent at a 90-degree angle at the elbow to mark the midpoint. The arm hangs by the side with the palm facing anteriorly as a caliper is used to measure a pinch of skinfold. The thumb and index finger of the left hand of the measurer grasp the skinfold while the caliper is placed approximately  inch from the fingers. When the caliper is perpendicular to the skinfold, the dial can be easily read.5
Arm Muscle Area
The triceps skinfold (TSF) measurement is used to calculate the arm muscle area (AMA). The result indicates muscle stores available for protein synthesis or energy needs. Changes over time in AMA show whether the patient has been deprived of protein or calories; AMA is one of the markers of nutrition status and can be a predictor of mortality.6 The formula to calculate AMA is as follows:

where MAC equals midarm circumference. A factor for sex is included for a corrected AMA formula because this accounts for bone area and provides a more accurate assessment of bone-free muscle area.7 Standards have been established for age groups throughout the life span.5
Biochemical Indicators
Laboratory values of particular significance used in assessing nutrition status include serum proteins. PEM may be reflected in low values for albumin, transferrin, transthyretin, and retinol-binding protein. Blood levels of these markers indicate the level of protein synthesis and yield information on overall nutrition status. However, inadequate intake may not be the cause of low values; certain disease states, level of hydration, liver function, pregnancy, infection, and medical therapies may alter laboratory values for each of the circulating proteins.8 Other visceral proteins that may help evaluate nutrition risk are positive acute phase reactants and include fibronectin, insulinlike growth hormone, and C-reactive protein.
Albumin
Albumin constitutes most protein in plasma and is commonly measured at minimal cost. The half-life of albumin is 14 to 21 days, which reduces its usefulness for monitoring the effectiveness of nutrition in the critical care setting.8 The general availability and stability of albumin levels from day to day make it one of the most useful tests for assessing long-term trends (Table 21-2). It is important to determine an albumin value before the onset of disease or insult of injury. In combination with other findings, such as hair pluckability, edema, and poor wound healing, a serum albumin level less than 2.8 g/dl helps differentiate kwashiorkor from marasmus.9 Table 21-3 compares the two forms of PEM.10,11
TABLE 21-2
| Level (g/dl) | Interpretation |
| 3.5-5.0 | Normal |
| 2.8-3.5 | Mild depletion |
| 2.1-2.7 | Moderate depletion |
| <2.1 | Severe depletion |
TABLE 21-3
Comparison of Two Primary Forms of Protein-Energy Malnutrition
| Parameter | Starvation (Marasmus) | Hypercatabolism (Kwashiorkor) |
| Etiology | Inadequate energy intake | Response to injury or infection |
| Examples | Cancer, pulmonary emphysema | Sepsis, burns |
| Body habitus | Thin, wasted, cachexic | May be normal, edematous |
| Rate of malnutrition | Slow | Rapid |
| Metabolic rate | Decreased | Increased |
| Fuel | Glucose/fat | Mixed |
| Catabolism | Decreased | Increased |
| Gluconeogenesis | Increased | Markedly increased |
| Glucagon | Increased | Markedly increased |
| Insulin | Decreased | Increased |
| Ketogenesis | Increased | Slightly increased |
| Catecholamines | Unchanged | Increased |
| Cortisol | Unchanged | Increased |
| Growth hormone | Increased | Increased |
| Visceral proteins | Normal | Decreased |
| Cytokines | Variable | Increased |
| Immune function | Normal | Impaired |
| Clinical course | Adequate responsiveness to short-term stress | Infections, poor wound healing, decubitus ulcers, skin breakdown |
| Mortality | Low unless related to underlying disease | High |
Transferrin
Transferrin is the transport protein for iron. It has a half-life of 8 to 10 days and is a better indicator of improved nutrition status than albumin. However, lack of iron influences transferrin values along with numerous other factors, including hepatic and renal disease, inflammation, and congestive heart failure.8,12
Transthyretin and Retinol-Binding Protein
Transthyretin, also called prealbumin, has a half-life of 2 to 3 days, and retinol-binding protein has a half-life of 12 hours. Each of these proteins responds to nutrition changes more quickly than either albumin or transferrin. However, numerous metabolic states, diseases, therapies, and infections influence the laboratory values.13
These two tests are more costly than testing for albumin. Levels of each protein are influenced by many factors other than nutrition status. Because these conditions are so common among critically ill patients, visceral protein markers are of limited usefulness for assessing nutrition deficiency and of greater usefulness in assessing the severity of illness and the risk for future malnutrition.14 Inflammatory metabolism causes a 25% decrease in the synthesis of these visceral proteins and causes lean body mass depletion and anorexia. It is important to evaluate their values with positive acute phase reactants (fibronectin, insulinlike growth hormone, C-reactive protein) where there is a reverse relationship.
Fibronectin, Insulinlike Growth Hormone, and C-Reactive Protein
C-reactive protein is an acute phase protein released with infection and inflammation. As transport proteins (albumin and prealbumin) decrease, levels of the acute phase proteins increase. Increased levels of C-reactive protein during stress, illness, and trauma have been linked to increased nutrition risk.12
Creatinine-Height Index
Because the rate of creatinine formation in skeletal muscle is constant, the amount of creatinine excreted in the urine every 24 hours reflects skeletal muscle mass. Predicted values are based on gender and height, with reference values of approximately 18 mg/kg body weight/day for women and approximately 23 mg/kg body weight/day for men. Values of 60% to 80% of predicted indicate a mild deficit of muscle mass, values of 40% to 60% of predicted indicate a moderate deficit, and values less than 40% of predicted indicate a severe depletion of muscle mass.5 Factors that influence creatinine excretion and complicate interpretation of this index include age, diet, exercise, stress, trauma, fever, and sepsis.12


Immune Status
Impaired immunity (anergy) is a common finding in malnutrition, especially the kwashiorkor type. Two laboratory values, white blood cells and percentage of lymphocytes, have been used as measures of a compromised immune system. The result is often a reduction in lymphocytes, as measured by the total lymphocyte count (TLC): TLC = white blood cells × % lymphocytes. Many nonnutrition variables influence these laboratory values, and their usefulness in assessing nutrition status is questioned.15
Malnourished patients also may exhibit signs of depressed immunity when challenged by certain hypersensitivity skin tests. Because many disease states and drugs are associated with anergy, the value of this test also is limited.16
Pulmonary Function
Pulmonary function test results may change with malnutrition. Weakness of the diaphragm and other muscles of inspiration can lead to reduced vital capacity and peak inspiratory pressures. The strength and endurance of respiratory muscles are affected, in particular, the diaphragm. Healthy lung function has been correlated with dietary antioxidant intake, such as vitamins C and E, beta-carotene, and selenium.17
Clinical Indicators
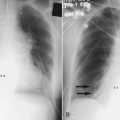
The physical signs of malnutrition often appear first in selected tissues, such as the hair, eyes, lips, mouth and gums, skin, and nails. Hair that is shiny and firmly in the scalp; bright clear eyes that adjust to light easily; an appropriately red tongue without swelling; gums without bleeding or swelling; skin of good color that is smooth and firm; and nails that are pink, smooth, and firm all are signs of acceptable nutrition status. In addition to malnutrition, other causes of these abnormalities might be medical therapies, anemia, allergies, sunburn, medications, poor hygiene practices, aging, or various pathologies.8 Patients with persistent malnutrition often appear very thin to the point that their ribs and bony structures of the chest are very visible. A patient is said to be cachexic in such cases.
Dietary Measures
Evaluation of Nutrition History
Food Guide Pyramid
The U.S. Department of Agriculture and the U.S. Department of Health and Human Services have cooperated through the years to recommend balanced nutrition for U.S. citizens. The current graphic showing recommendations, My Pyramid,18 divides foods into groups based on the nutrient contribution of the grouping. For example, the grains group consists of breads, pasta, and rice, which all contribute B vitamins, folate, iron, and protein to the diet. The measure (ounces or cups) of servings is recommended for multiple calorie levels of each of the food groups: grains, protein, dairy, fruits, and vegetables. Consuming the recommended amounts of each should provide balanced, adequate nutrition for a healthy person (Table 21-4). The calorie level is based on age, gender, and activity level. The clinician or patient can go to http://mypyramid.gov to enter an individual’s data and be given the recommended calorie level. A comparison of a 24-hour recall with My Pyramid (Figure 21-3) gives an estimation of the adequacy of the patient’s diet.18 Individuals choosing meatless meals may select foods and number of servings from My Vegetarian Food Pyramid (Figure 21-4).19
TABLE 21-4
Dietary Guidelines for Americans—2005
| Guideline | Application |
| Adequate nutrients with calorie needs | Consume a variety of nutrient-dense foods and beverages within and among the basic food groups while choosing foods that limit the intake of saturated and trans fats, cholesterol, added sugars, salt, and alcohol |
| Meet recommended intakes within energy needs by adopting a balanced eating pattern, such as the USDA Food Guide or the DASH Eating Plan | |
| Weight management | Maintain body weight in a healthy range, balance calories from food and beverage calories, and increase physical activity |
| To prevent gradual weight gain, make small reductions in calorie intake and increase physical activity | |
| Physical activity | Engage in regular physical activity |
| Achieve physical fitness through cardiovascular conditioning, stretching, and resistance exercises | |
| Food groups to encourage | Consume sufficient amounts of fruits and vegetables |
| Choose a variety of fruits and vegetables every day | |
| Consume ≥3 oz equivalents of whole-grain products per day; half of the grains should be whole | |
| Consume 3 cups per day of fat-free or low-fat milk or equivalent milk products | |
| Fats | Consume 10% of calories from saturated fats and <300 mg/day of cholesterol, and keep trans fats as low as possible |
| Keep total fat intake between 20% and 35% of calories | |
| Choose lean, low-fat, or fat-free meat, poultry, dry beans, milk, and milk products | |
| Limit intake of fats and oils high in saturated and trans fats, and choose products low in such fats and oils | |
| Carbohydrates | Choose fiber-rich fruits, vegetables, and whole grains often |
| Choose and prepare foods and beverages with little added sugars | |
| Reduce incidence of dental caries by practicing good oral hygiene and consuming sugars and starches less often | |
| Sodium and potassium | Consume <2300 mg of sodium per day (approximately 1 tsp of salt) |
| Choose and prepare foods with little salt | |
| Consume potassium-rich foods (i.e., fruits and vegetables) | |
| Alcoholic beverages | Alcohol should be consumed in moderation |
| Pregnant and lactating women, individuals who cannot restrict their intake of alcohol, patients taking medications that interact with alcohol, and patients with specific medical conditions should not consume alcohol | |
| Food safety | Clean your hands, food contact surfaces, and fruits and vegetables; meats and poultry should not be rinsed |
| Separate raw, cooked, and ready-to-eat foods while shopping, preparing, or storing foods | |
| Cook foods to a safe temperature to kill microorganisms | |
| Refrigerate perishable food promptly, and defrost foods properly | |
| Avoid raw (unpasteurized) milk or any products made from unpasteurized milk, raw or partially cooked eggs or foods containing raw eggs, raw or undercooked meat and poultry, unpasteurized juices, and raw sprouts4 |
Compiled from U.S. Department of Agriculture and U.S. Department of Health and Human Services: Nutrition and your health: dietary guidelines for Americans, Washington, DC, 2005, U.S. Government Printing Office.


Subjective Global Assessment
Nutrition assessment may be accomplished through a process referred to as subjective global assessment. This process uses patient information regarding weight changes, food intake, various symptoms, functional capacity in numerous areas, the disease and its nutrient requirements, and numerous physical traits. Scores are given in each category to determine the subjective global assessment rating of well-nourished, moderately malnourished, or severely malnourished clients.20,21
Considerations Throughout the Life Span
Pregnancy and Lactation
A healthful diet with added nutrients is essential to a successful pregnancy and to lactation. The demands of the growing fetus and of the nursing infant add to the calorie and protein needs of the mother.22 Ensuring adequate vitamin and mineral intake to support pregnancy and lactation requires a modest increase in all vitamins and minerals compared with the requirements for 19- to 30-year-old women with the exceptions of magnesium; phosphorus; vitamins D, E, and K; and biotin for certain age groups.23–26
Children
The rapid growth seen in infancy slows during the toddler and school-age years. Nutrition must provide the nutrients for the steady growth of childhood. During these years, eating habits for a lifetime form, influenced by peers, parents, other relatives, television, and advertising. Children, especially an ill child, use food to manipulate parents and caregivers.27
Adolescents
Adolescents continue to grow in spurts. Nutrient needs reflect growth and activity levels at this stage, which may be met by varying the number of servings of the same foods fed to the rest of the family. Food choices need to be based on the U.S. Dietary Guidelines and the Food Guide Pyramid, rather than on advertising or peer pressure. Food is an area where teens may express their growing independence by choosing new food patterns. Some patterns are based on needs or perceived needs, whereas others are based on image (e.g., pregnancy, muscle-building, calorie restricted or calorie excessive, fast foods, multiple snacks with skipped meals). Other adolescents choose vegetarian meal patterns.27,28
Adults
Previous adult nutrition recommendations aimed to decrease nutrient deficiencies. Beriberi, pellagra, and scurvy are no longer the primary health concerns of Americans. Heart disease, strokes, cancer, diabetes, and diseases that result from obesity drive the current recommendations. The U.S. Dietary Guidelines, the Food Guide Pyramid, and the food label together recommend meal patterns low in total fat, saturated fat, cholesterol, sodium, and sugar, while including abundant fruits, vegetables, and whole grains in food choices.4,18,19,29
Elderly Adults
The percentage of the U.S. population older than 65 years has increased from 4% in 1900 to 12.8% in 2000. This group of citizens is a very heterogeneous group ranging from very active individuals to institutionalized individuals. As the years pass, weight loss becomes a prime concern. Loss of total lean body mass (muscle) and an increase in total body fat secondary to a decrease in activity result in a decrease in the total calories needed. With the exception of increases from adult years in vitamins D and B6 and minerals calcium and chromium,23–26 nutrient needs for elderly adults remain the same even though total calories have decreased. Often, elderly adults choose to consume fewer calories than previously consumed because of changes in the ability to taste, to smell, and to discern brightly colored foods; because of taste alterations from medications; and because of lack of interest in food procurement or food preparation. Socioeconomic issues may limit the ability to purchase food. In addition, the enjoyment of food decreases when eating alone.30
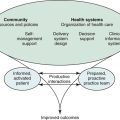
Outcomes of Nutrition Assessment
With nutrition intervention, patients improve their nutrient intake and reduce mortality and morbidity. Improved nutrition status increases the patient’s tolerance of therapeutic regimens in the treatment of disease and decreases recovery time. The resulting economic benefits are multifactorial and include reduced hospital stays, reduced need for medication or medical care or extended care, and increased years of productivity.31
Base Recommendations on Major Guidelines
Past dietary practices may be evaluated using recommendations from many sources. U.S. government agencies, nongovernment groups, and professional organizations have developed recommendations for the public to improve the nutrition status of Americans. Basic to a national nutrition policy are the Dietary Guidelines for Americans,4 MyPyramid,18,19 and the food label.29 Recommendations have come from other sources as well.
Macronutrients and Energy Requirements
Macronutrients supply the energy requirements of the body. The three macronutrients are protein, carbohydrate, and fat. Each contributes to calorie intake with 4, 4, and 9 calories (kcal) per gram. Alcohol is the only other calorie source with approximately 7 kcal/g. Box 21-2 outlines the factors influencing energy and macronutrient needs.
Estimating Energy Requirements
An individual’s energy requirement represents the ratio of energy intake to energy expenditure relative to body weight, activity level, and stressors (Table 21-5). The classic measure of energy expenditure is the basal metabolic rate (BMR). Obtained after 10 hours of fasting, the BMR measures the number of calories (kcal) expended at rest per square meter of body surface per hour (kcal/m2/hr). BMR varies by body size, age, and sex. Calorie needs for energy expenditure increase beyond the BMR based on activity level, stage of growth (pregnancy, lactation), and extent of injury.
TABLE 21-5
| Instructions: Multiply REE times (1) the most relevant stress factor, then (2) the appropriate activity factor | |
| Condition | Factor |
| Stress Factors | |
| Malnutrition | 0.7 |
| Chronic renal failure, nondialyzed | 1.00 |
| Maintenance hemodialysis | 1.00-1.05 |
| Elective surgery, uncomplicated | 1.0 |
| Peritonitis | 1.15 |
| Soft tissue trauma | 1.15 |
| Fracture | 1.20 |
| Infection, mild | 1.00 |
| Infection, moderate | 1.20-1.30 |
| Infection, severe | 1.40-1.50 |
| Burns, 0%-20% BSA | 1.00-1.50 |
| Burns, 20%-40% BSA | 1.50-1.80 |
| Burns, 40%-100% BSA | 1.80-2.00 |
| Activity Factors | |
| Confined to bed | 1.2 |
| Out of bed | 1.3 |
| Example: A bedridden patient with a moderately severe infection has a Harris-Benedict predicted REE of 1100 kcal/day; estimate this patient’s actual energy needs | |
| Actual energy needs = predicted REE × stress factor × activity factor | |
| Actual energy needs = 1100 kcal × 1.25 × 1.2 | |
| Actual energy needs = 1650 kcal | |
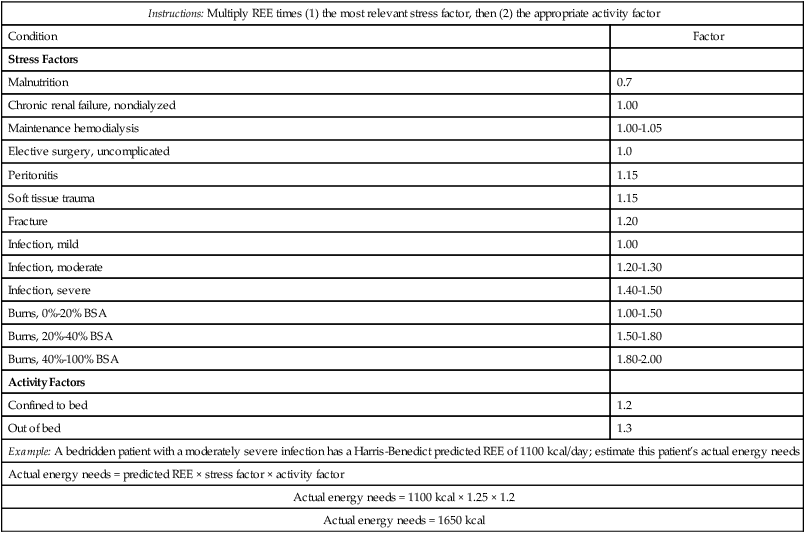
In clinical practice, clinicians are more interested in a patient’s daily energy requirements (kcal/day). Multiple methods are available for estimating daily energy needs. The “quick method” estimates daily energy needs based on a simple body weight factor of 20 to 35 kcal/kg.31 Alternatively, predictive equations such as the Harris-Benedict equation can be used to estimate daily resting energy expenditure (REE):


An Internet calculator for REE is located at http://www.brianmac.demon.co.uk/predictrdee.htm; height in inches is converted to centimeters by multiplying by 2.54, and weight in pounds is converted to kilograms by dividing by 2.2. REE is multiplied by an activity factor to determine daily calorie needs. Although the predicted REE averages approximately 10% higher than the BMR, it still tends to underestimate actual energy needs.
 Rule of Thumb
Indirect Calorimetry
Indirect calorimetry is the estimation of energy expenditure by measurement of O2 consumption and CO2 production. Data obtained can be used to assess a patient’s metabolic state, to determine nutrition needs, or to assess response to nutrition therapy.32 To guide practitioners in using indirect calorimetry, the American Association for Respiratory Care (AARC) has published Clinical Practice Guideline: Metabolic Measurement Using Indirect Calorimetry During Mechanical Ventilation. Excerpts appear in Clinical Practice Guideline 21-1.33
21-1 Metabolic Measurement Using Indirect Calorimetry During Mechanical Ventilation
AARC Clinical Practice Guideline (Excerpts)*
Metabolic measurements may be indicated:
• In patients with known nutrition deficits or derangements
• When patients fail attempts at weaning from mechanical ventilation to measure the O2 cost of breathing in mechanically ventilated patients
• When the need exists to assess the  to evaluate the hemodynamic support of mechanically ventilated patients
• Closed circuit calorimeters may cause a reduction in alveolar ventilation secondary to increased compressible volume of the breathing circuit
• Closed circuit calorimeters may decrease the trigger sensitivity of the ventilator and result in increased patient work of breathing
• Short-term disconnection of the patient from the ventilator for connection of the indirect calorimetry apparatus may result in hypoxemia, bradycardia, and patient discomfort
• Inappropriate calibration or system setup may result in erroneous results causing incorrect patient management
Test quality can be evaluated by determining whether:
• RQ is consistent with the patient’s nutrition intake
• RQ is in the normal physiologic range (0.67-1.3)
• Variability of the measurements of  and
and  should be ≤5% for a 5-minute data collection
• The measurement is of sufficient length to account for variability in  and
and  if the conditions above are not met
*For the complete guidelines, see American Association of Respiratory Care: Clinical practice guideline. Respir Care 49:1073, 2004. Accessed at www.rcjournal.com/contents/09.04/09.04.1073.pdf on June 1, 2007.
In regard to the indications for indirect calorimetry, the determination of energy and protein needs by an empiric formula is sufficient for most patients. Given the cost and complexity of this procedure, its routine use cannot be justified.34 Specific clinical conditions supporting the need for indirect calorimetry as a tool in nutrition assessment are listed in Box 21-3.10,11,34,35
Equipment and Technique
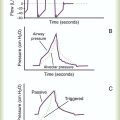
Good calorimetry results require extensive preparation. Box 21-4 outlines the key preparatory steps to be taken before testing.10 Indirect calorimetry can be performed with a Douglas bag, a Tissot spirometer, and CO2 and O2 gas analyzers. The patient’s expired gas is collected in the Douglas bag where it is sampled for O2 and CO2 concentrations; the Tissot spirometer measures expired volume. Commercially available metabolic carts are much easier to use. These automated systems either use a mixing chamber or perform breath-by-breath analysis. The breath-by-breath method provides real-time data, which may aid in ensuring optimal measurement conditions, particularly in mechanically ventilated patients.36
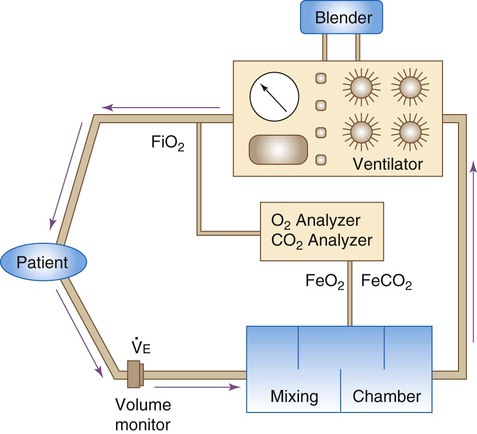
Figure 21-5 shows the basic configuration for open-circuit indirect calorimetry during mechanical ventilation using a metabolic cart with mixing chamber. Gas sampled from the inspiratory limb of the ventilator circuit is assessed for fractional inspired oxygen (FiO2) using a paramagnetic or zirconium oxide O2 analyzer. Volume exhaled by the patient is measured using a flow transducer. The patient’s exhaled gas enters a mixing chamber, from which a sample is drawn to measure FeCO2 (usually by infrared analysis) and FeO2. Exhaled gas is returned to the ventilator after volume and gas concentration measurements. After all measurements are obtained, O2 consumption, CO2 production, and respiratory quotient (RQ) are computed using the equations shown in Box 21-5. All measurements must be corrected to standard temperature and pressure and dry conditions (STPD) before computation.38 The values are used in the abbreviated Weir equation to determine REE:
 and
and  Using the Gas Exchange Method
 =
=  × [3 FiO24] − (
 × FeO2)
 =
=  × FeCO2

Indirect calorimetry is more difficult to perform on spontaneously breathing patients, especially patients breathing supplemental O2. Although a mouthpiece with nose clips or a mask can be used to collect expired gas, these items tend to alter the patient’s steady state and invalidate results.36 Instead, most clinicians recommend using a plastic canopy that covers the patient’s head. Expired gases are cleared from the canopy by a preset flow of air; expired gas concentrations are sampled and corrected for the air dilution.
Because standard modes of O2 therapy do not deliver a consistent FiO2 to spontaneously breathing patients, special delivery systems must be used. To overcome this problem, the clinician can substitute a precise O2 mixture for the air used to clear the canopy. Alternatively, one can place a large gas reservoir (e.g., a Douglas bag) between an O2 flow source and the subject36; this ensures that the FiO2 remains stable throughout the test procedure.
Problems and Limitations
Indirect calorimetry is a technically complex procedure that requires rigorous attention to both instrument and procedure quality control. Regarding instrumentation, small errors in measurements can result in large errors in calculated O2, CO2, and energy expenditure. For this reason, the calorimeter’s gas analyzers and volume measurement device must be properly calibrated before each patient use. Gas analyzers should be accurate to the hundredth percent and linear over the clinical range of O2 concentrations.38,39
Regarding procedure quality control, it is essential that measurements be made during steady-state conditions. Although proper patient preparation (see Box 21-4) is helpful in this regard, steady-state conditions can be confirmed only during the test procedure itself. A common standard for ensuring steady-state conditions is five consecutive 1-minute averages with a variability of 5% or less.36
Perhaps the most significant problem in performing indirect calorimetry on mechanically ventilated patients is the presence of leaks (circuit, tracheal tube cuff, chest tubes).33 Because any leak would invalidate test results, no procedure should begin until a leak-free patient-ventilator-calorimeter system is confirmed. Other sources of error during open-circuit indirect calorimetry of mechanically ventilated patients are listed in Box 21-6.33
Interpretation and Use of Results
The second step in metabolic assessment is to interpret the RQ. The RQ is the ratio of moles of CO2 expired to moles of O2 consumed. The RQ correlates to the ratio of percent calories provided to the percent calories required. Traditionally, the RQ has been used to determine substrate use, where carbohydrates have an RQ of 1.0, protein has an RQ of 0.82, and fat has an RQ of 0.7. Table 21-6 outlines the basic significance of the RQ relative to substrate use and traditional nutrition strategies.36 The RQ has been shown more recently to have low sensitivity and reduced specificity in critically ill patients.37 This finding limits the RQ as an indicator for substrate use. The RQ may be low in an overfed patient because of a shift in substrates secondary to inflammatory mediators. If the RQ is outside its physiologic range of 0.67 to 1.3, this should alert the clinician to assess the validity of the study.
TABLE 21-6
Interpretation and Use of the Respiratory Quotient (RQ)
| Value | Interpretation | General Nutrition Strategy |
| >1.00 | Overfeeding | Decrease total kcal |
| 0.9-1.00 | Carbohydrate oxidation | Decrease carbohydrates or increase lipids |
| 0.8-0.9 | Fat, protein, and carbohydrate oxidation | Target range for mixed substrate |
| 0.7-0.8 | Fat and protein oxidation | Increase total kcal |
| Starvation |
Mini Clini
Metabolic Assessment Based on Indirect Calorimetry
 Problem
From McArthur C: Indirect calorimetry. Respir Care Clin N Am 3:291, 1997.

 of 69%, the REE would be computed as follows:


General Aspects of Nutrition Support
Meeting Overall Energy Needs
When the patient’s REE is derived, it needs to be adjusted to account for variations in activity and stress levels. If using the Harris-Benedict equations, it is recommended that the predicted REE be corrected for both stress and activity levels (see Table 21-5).11 When the REE is derived from indirect calorimetry, a stress or activity factor should not be used.
Insufficient Energy Consumed
Malnutrition results from insufficient energy (calorie) intake over time. This insufficient intake leads to a state of impaired metabolism in which the intake of essential nutrients falls short of the body’s needs. Certain factors may place a patient at risk for malnutrition (Box 21-7).
Protein-Energy Malnutrition
Protein-energy malnutrition (PEM) has adverse effects on respiratory musculature and the immune response.15 PEM may be either primary or secondary. Primary PEM results from inadequate intake of calories or protein or both and is typically seen only in developing countries.10
Secondary PEM is due to underlying illness. Illness may cause (1) decreased caloric or protein intake (e.g., anorexia, dysphagia); (2) increased nutrient losses (e.g., malabsorption or diarrhea); and (3) increased nutrient demands (e.g., injury or infection).32 Secondary PEM may be present in 50% of hospital patients.
When PEM is due to inadequate nutrient intake or excessive loss, the body responds by decreasing its metabolic rate, ventilatory drive, thyroid function, and adrenergic activity.34 As calorie intake decreases, energy for metabolic processes is initially supplied by converting liver glycogen stores into glucose (gluconeogenesis). However, liver reserves of glycogen are adequate for less than 1 day at rest and only a few hours during exercise.8 Thereafter, endogenous fat stores are mobilized in the form of free fatty acids (ketogenesis). When fat stores are depleted, nutrient needs must be met by catabolizing skeletal muscle protein. This type of PEM usually manifests as a gradual wasting process, as seen in patients with chronic diseases such as cancer and emphysema. The primary clinical sign is progressive weight loss.
When PEM is due to increased demand for nutrients, metabolism, thyroid function, and adrenergic activity all increase. Visceral protein levels tend to decrease early in the course of illness and are associated with impaired immunity.34 This type of PEM typically occurs with acute catabolic disease, such as in sepsis, burns, or trauma. Weight loss and depletion of muscle and fat stores generally do not occur because of the rapidity of onset of the underlying disease.11 The two types of PEM are often referred to as marasmus and kwashiorkor,2,10,11 as previously described (see Table 21-3).
Micronutrient Malnutrition
The same problems that lead to PEM can produce deficiencies in micronutrients. Deficiencies of nutrients that are stored only in small amounts (e.g., water-soluble vitamins) or are lost through external secretions (e.g., zinc in diarrhea fluid or burn exudate) are quite common.10 Although the causes and results of micronutrient deficiencies are beyond the scope of this chapter, a few of the most common problems are described.
Respiratory Consequences of Malnutrition
Malnutrition affects all organ systems. In addition, malnutrition seems to interact with disease processes to increase the morbidity and mortality of respiratory, cardiac, and renal failure.34 Specific effects of malnutrition on the respiratory system are listed in Box 21-8.11,13
Approximately one-third of all patients with acute respiratory failure have malnutrition. In these patients, the underlying diseases (e.g., sepsis, burns, trauma) increase energy expenditure and promote skeletal muscle catabolism. These patients are prone to hypercapnia and can be difficult to wean from ventilatory support. Malnourished patients who require mechanical ventilatory support also have higher mortality rates than patients with normal nutrition status.11
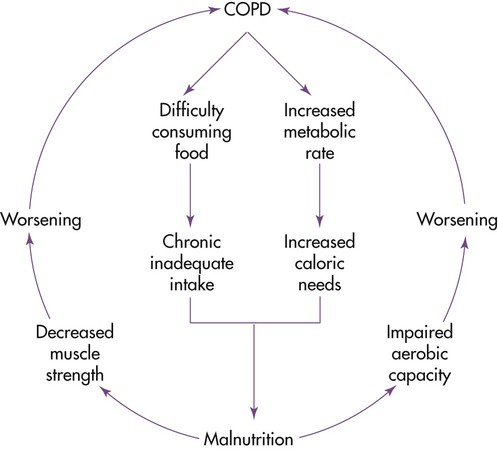
Malnutrition also plays a role in chronic obstructive pulmonary disease (COPD). The combined effect of increased energy expenditure (because of high work of breathing) and inadequate caloric intake contributes to a marasmus-type malnutrition. The resulting progressive muscle weakness and dyspnea can limit caloric intake further, as can several profound psychosocial factors. Box 21-9 summarizes the factors contributing to malnutrition in patients with COPD.15,17 The RT may notice signs that could lead to malnutrition in patients for whom they provide care (Box 21-10).
Providing the Appropriate Combination of Substrates
Protein
Amino acids or proteins are essential to maintaining or restoring lean body mass. Because illness usually increases protein catabolism and protein requirements, the Recommended Dietary Allowance (RDA) of 0.8 g/kg/day is generally insufficient for sick patients. Based on the assessment of the protein catabolism rate (see previous equations for nitrogen balance), protein intake may need to be doubled or tripled above the RDA (1.5 to 2.5 g/kg/day).15,40 Ideally, approximately 20% of a patient’s estimated calorie needs should be provided by protein. Higher percentages of protein may be needed in cachexic patients, critically ill patients, and patients with severe infections. However, whenever high protein intakes are given, the patient should be monitored for progressive azotemia (blood urea nitrogen >100 mg/dl).
Too much protein is harmful, especially for patients with limited pulmonary reserves. Excess protein can increase O2 consumption, REE, minute ventilation, and central ventilatory drive.41 In addition, overzealous protein feeding may lead to symptoms such as dyspnea in patients with chronic pulmonary disease.
Carbohydrate
Adequate amounts of carbohydrates and fat help prevent protein catabolism. Glucose (dextrose) is the most commonly administered intravenous carbohydrate. For critically ill patients, 50% to 60% of the total daily calories can be in the form of simple carbohydrate.16,40,42 In an average-sized patient, daily glucose provision should be 300 to 400 g/day or less. Glucose blood levels should be monitored and maintained at less than 200 mg/dl.16
For patients with pulmonary disease or patients requiring mechanical ventilation, high carbohydrate loads can cause problems. High carbohydrate loads increase CO2 production and the RQ, resulting in increased ventilatory demand, O2 consumption, and work of breathing.40 Although the observed effects are usually modest, some patients with limited functional reserves cannot tolerate these changes, resulting in development or worsening of ventilatory failure. More recent evidence indicates that this problem is probably more closely related to total calorie load (overfeeding) than to the proportion of carbohydrate in the diet.10 Based on this knowledge, overfeeding should be carefully avoided in patients with pulmonary disease and patients requiring mechanical ventilation.
Fat
The remaining calories (20% to 30%) should be provided from fat.39,40 In critically ill patients, current guidelines support increased levels of omega-3 fatty acid intake to modulate inflammation, to enhance immune response, and ultimately to support recovery.41,42 Fat intakes greater than 50% of energy needs have been associated with fever, impaired immune function, liver dysfunction, and hypotension.
The initiation of nutrition support is determined by the patient’s nutrition status and the estimated length of time the patient will be unable to consume a diet by mouth to meet his or her nutrition needs. To ensure a satisfactory nutrition and metabolic response, early enteral nutrition begun within 24 to 48 hours provides significant benefits to critically ill patients, including reduced infectious complications and lengths of stay.42
Routes of Administration
There are two primary routes for supplying nutrients to patients: enteral (oral and tube feeding) and parenteral (peripheral or central venous alimentation). Box 21-11 provides guidelines for initiating nutrition support as recommended by the American Society for Parenteral and Enteral Nutrition.46–48
Enteral Feeding
Enteral feedings are the route of choice: “If the gut works, use it.” The enteral route is safer and cheaper to use than the parenteral route. Enteral feeding stimulates gut hormones, subjects nutrients to the absorptive and metabolic controls of the intestinal tract and liver, and produces less hyperglycemia (providing for better immune function) than the parenteral route. In addition, the buffering capacity of enteral feeding can improve resistance against stress ulcers. Finally, enteral feeding maintains a more normal intestinal mucosa than the parenteral route (the intestinal mucosa may undergo atrophy during parenteral nutrition).10
Enteral Tube Routes
Gastric feedings are indicated if there are no physiologic factors affecting GI function, such as gastroparesis, delayed gastric emptying, or obstruction or surgery in the upper GI tract. Small bowel (duodenum and jejunal) feedings are indicated if the upper GI tract cannot be used. Intestinal feeding tube placement is often recommended to minimize the risk of aspiration because it is believed to decrease the risk of gastric distention and gastroesophageal reflux; however, this has not yet been convincingly shown.49
Long-term feeding tubes can be placed endoscopically and surgically. Percutaneous endoscopic placement of a feeding tube can be done to establish gastric (percutaneous endoscopic gastrostomy) or intestinal (percutaneous endoscopic jejunostomy) access. This method is generally preferred to surgical placement because it is associated with reduced costs, lack of need for operating room time, and lack of need for anesthesia.50 Surgical laparotomy is indicated if endoscopy is contraindicated.
Tube Feeding Administration
Continuous drip infusion provides a constant, steady flow of formula at a predetermined rate for a set period, generally 12 to 24 hours per day. Drip regulators, roll clamps, or pumps are used to control rates. Because the small bowel lacks storage capacity, feedings delivered beyond the pylorus must be provided by the continuous drip method. This method is generally preferred for critically ill patients because it is usually associated with less gastric residual volume, less abdominal distention, less gastroesophageal reflux, and a decreased incidence of aspiration.49
Enteral Formula Selection
Selection of an enteral formula depends on the patient’s medical and surgical state, GI function, energy and nutrient needs, and route of administration. There are eight broad categories of enteral formulas: oral supplements, blenderized, whole protein lactose-free, fiber containing, nutrient dense, elemental, disease specific, and modular. Table 21-7 describes the indications for the various formulas and lists examples of commercial preparations.
TABLE 21-7
Enteral Product Reference Guide
| Category | Indications | Examples |
| Oral supplements | Given with an oral diet to increase calorie and protein intake | Boost*†, Carnation Instant Breakfast* |
| Blenderized | Made from natural foods and usually lower in sucrose and corn syrup than other formulas; beneficial if intolerance to synthetic formulas exists | Compleat*, Compleat Modified*† |
| Fiber containing | Dietary fiber can increase stool bulk and transit time, decrease intraluminal pressure, and improve bowel motility | Jevity*†, FiberSource*†, Nutren 1.0 with Fiber*† |
| Nutrient dense | Increased calories in a limited volume; useful in hypermetabolic states (burns, trauma, sepsis, major surgery) and congestive heart failure | Two Cal HN*†, Ensure Plus*†, Deliver*†, Nutren 2.0*† |
| Elemental | Impaired GI function with impaired ability to digest or absorb intact nutrients | Peptamen†, Vital HN†, Criticare†, Vivonex TEN†, Subdue Plus†, Alitraq† |
| Disease specific | Liver disease; renal disease; pulmonary disease; glucose intolerance; fat modified, trauma; immune-enhancing | Nutrihep*†, Deliver 2.0*†; Nepro*†, Magnacal Renal*†, NovaSource Renal*†; Pulmocare*†, NutriVent*†, Respalor*†; Diabetisource*†, Glucerna*†, Choice DMTF*†, Glytrol*†; Travasorb MCT, Portagen, Advera*†, Lipisorb*†; TraumaCal*†; Impact*†, Advera*†, Lipisorb*† |
| Modular | Need to modify a single nutrient (carbohydrate, protein, fat) | Polycose, Promod, Microlipid, MCT oil |
Complications of Enteral Therapy
Aggressive suctioning of oropharyngeal secretions can help prevent aspiration. The greatest risk is in patients with endotracheal tubes. Endotracheal tubes increase aspiration risk because they alter sensation, impair glottic closure, increase secretion volume, and act as “wicks” to allow secretions to enter the airway.49 The use of special endotracheal tubes that provide continuous aspiration of subglottic secretions may help overcome the leakage-type aspiration that is so common in tube-fed patients.51 The use of blue dye to detect aspiration is no longer a standard practice because of numerous problems surrounding the practice including a U.S. Food and Drug Administration Public Health Advisory issued in 2003. Blue discoloration of body parts and fluids followed by refractory hypotension, metabolic acidosis, and death were reported in some patients receiving blue food dye.
Parenteral Nutrition Support
When it is impossible to provide nutrition support through the GI tract, intravenous or parenteral nutrition support may be needed. Parenteral nutrition support can be administered through a peripheral or central vein. Ideally, the vascular access line should be isolated and maintained as a sterile route and not used for any other purpose. Because the volume and concentration of nutrients given through a small vein are limited, peripheral parenteral nutrition is generally considered only for short-term support. Mechanical, infectious, and metabolic complications have been reported in patients fed parenterally.52
Nutrition Support in Specific Circumstances
General Guidelines for Critically Ill Patients
The general goals of nutrition support in critically ill patients are to (1) provide for energy needs; (2) maintain nitrogen balance; (3) provide adequate (not excessive) calories to preserve lean body mass (muscle); (4) provide a positive nitrogen balance; (5) provide adequate vitamins, minerals, and fat; and (6) provide appropriate fluid.53 Table 21-8 outlines the general guidelines recommended to achieve these goals.53
TABLE 21-8
General Nutrition Guidelines for Chronically Critically Ill Patients
| Category | Guideline |
| Energy need | Provide 25-30 kcal/kg/day for men and 20-25 kcal/kg/day for women in volume consistent with total fluid needs of the patient (approximately 1 ml H2O/kcal) or use Harris-Benedict equations times a stress factor of 1.2-1.4 |
| Protein | 20% of total calories/day; 1-2 g/kg/day and adjust by periodic monitoring of nitrogen balance |
| Carbohydrate | 60%-70% total calories/day. Fat 20%-30% total calories/day; provide essential fatty acids |
| Micronutrients | Adequate vitamins and minerals such as vitamins A, B6, C, E; potassium; magnesium; zinc; iron; selenium; phosphate |
| Fluid | Approximately 1 ml/kcal |
| Specialized nutrients | Glutamine (may improve nitrogen stores), arginine (may improve immune system), and omega-3 fatty acids (may reduce inflammatory processes) |
| Route of delivery | Use enteral nutrition unless the gut is not functioning, then choose total parenteral nutrition |
Compiled from Pingleton SK: Nutrition in chronic critical illness. Clin Chest Med 22:149, 2001.
Systemic Inflammatory Response Syndrome
The systemic inflammatory response syndrome underlies many critical illnesses, including sepsis and acute respiratory distress syndrome (ARDS). Metabolism in systemic inflammatory response syndrome is characterized by increased total caloric requirements, hyperglycemia, triglyceride intolerance, increased net protein catabolism, and increased macronutrient and micronutrient requirements.16 Caloric requirements may need to be increased by 10% to 20%. If blood glucose level exceeds 225 mg/dl, glucose intake must be reduced, insulin must be given, or both. Because of the hypercatabolic state, protein administration may need to be increased to 1.7 to 2.0 g/kg/day. If serum triglycerides exceed 500 mg/dl, total calories or the dose of polyunsaturated fatty acids, or both, should be reduced.15 Enteral supplementation with omega-3 fatty acid may have a beneficial effect in treatment for ARDS. Omega-3 fatty acids have been observed to reduce inflammation, improve oxygenation, and improve outcomes in these patients.44,45
Requirements for micronutrients are also increased in systemic inflammatory response syndrome. Because of the potential high losses of potassium, zinc, magnesium, calcium, and phosphorus, serum levels of these minerals need to be closely monitored and maintained within the normal range.16
Mechanical Ventilation
Adequate nutrition support is crucial for ventilator-dependent patients. During acute illness, proper nutrition helps prevent the loss of lean body mass. After the resolution of the acute phase of illness, good nutrition helps the muscles regain strength and improves the likelihood of successful ventilator weaning.43
For most patients requiring ventilatory support, following the general guidelines provided in Table 21-8 suffices. As always, care must be taken to avoid overfeeding and the increased ventilatory demands that follow. Patients with COPD present a special situation, in terms of both nutrition needs and ventilatory support. More details regarding these patients are provided in the next section.
Nutrition support alone is insufficient to ensure weaning of ventilator-dependent patients. For these patients, appropriate nutrition may need to be combined with a tailored exercise program designed to strengthen and retrain muscles. Methods used to wean ventilator-dependent patients are discussed in detail in Chapter 47.
Chronic Obstructive Pulmonary Disease
Malnutrition occurs in 70% of patients with COPD,54 and it is most evident in patients with pulmonary emphysema. Progressive weight loss is common. Malnutrition seems to have two causes: an insufficient intake for a prolonged period and increased nutrient needs because of chronic increases in metabolism. Malnutrition and low body weight seem to be independent factors associated with a poor prognosis.55
The degree of weight loss generally correlates with deterioration of pulmonary function values. COPD can create a cycle in which respiratory dysfunction promotes weight loss, and weight loss further hinders respiratory function.10 Figure 21-6 illustrates the cycle.
The goal for the health care team is to increase nutrient intake carefully without overfeeding the patient. For most COPD patients, 1.2 to 1.5 times the REE for energy and 1.2 to 1.7 g/kg body weight for protein are sufficient. If the patient is malnourished, additional calories and protein are needed to replenish body stores. Cachexic patients with COPD should be refed cautiously.56 Functional capacity and the patient’s overall health status may improve with an anabolic stimulus, such as exercise, along with nutrition supplementation.57
In patients with COPD without hypercapnia, conventional macronutrient allocations are satisfactory (15% to 20% as protein, 50% to 60% as carbohydrates, and 20% to 30% as fat). For patients with hypercapnia, the diet should be individually tailored to provide the lowest percentage of fat that maintains an acceptable PaCO2.10 However, as previously stated, setting an appropriate total calorie load is more important than fine-tuning the ratio of carbohydrates to fat.
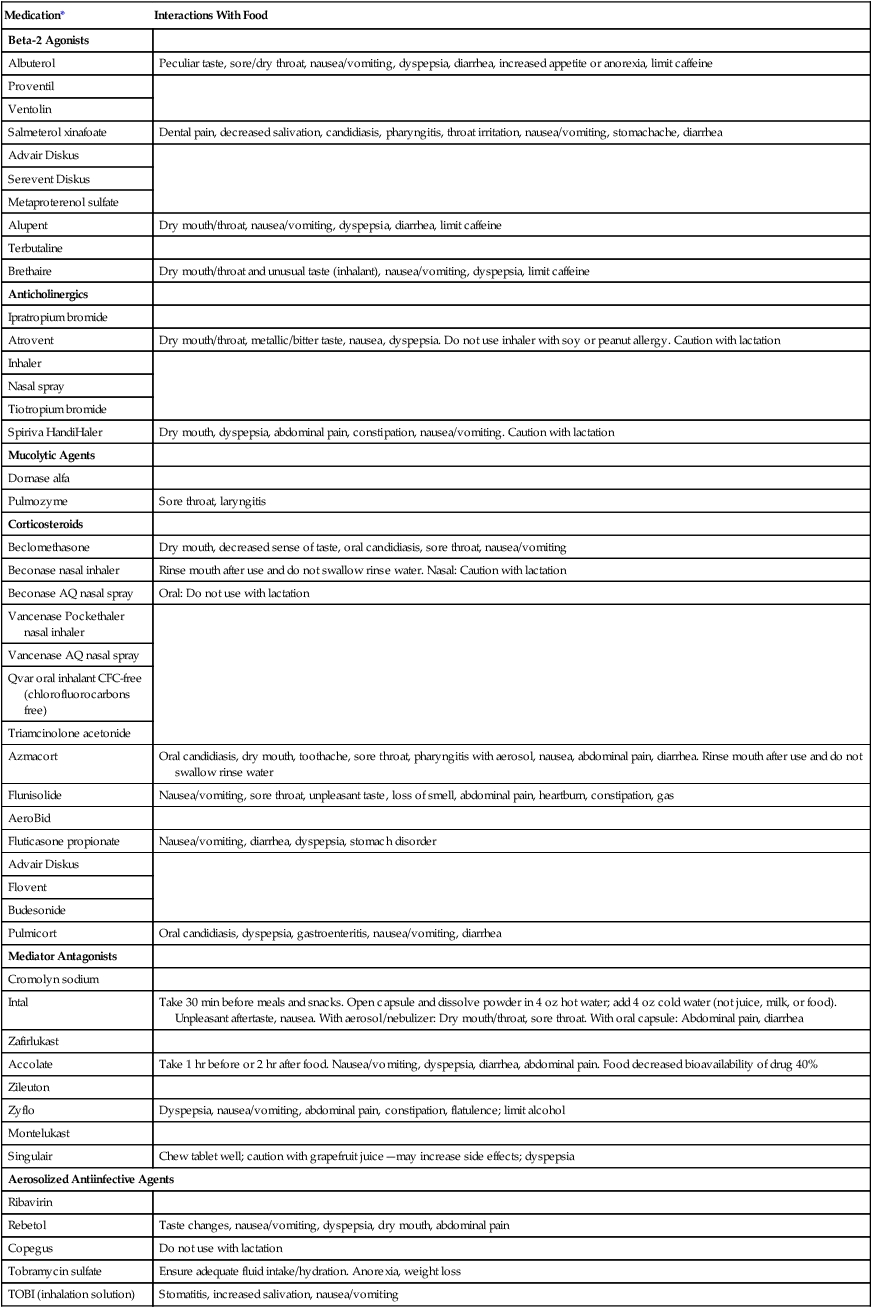
Given the positive link between dietary intake and knowledge of diet and health, good patient education is crucial.58 Patients should be taught to select easy-to-consume, calorically dense foods (Box 21-12). Emphasis should be placed on small, frequent feedings, and use of high-calorie, high-protein nutrition supplements should be encouraged. Because many of the listed foods are not consistent with publicly disseminated guidelines, health care team members need to explain and justify the differences. Other considerations in providing nutrition support to patients with COPD are listed in Box 21-13.10 Medications prescribed for patients with respiratory disease may influence food intake or interact with foods. Common medications with their effects on nutrition are listed in Table 21-9.59,60
TABLE 21-9
Common Respiratory Medication Interactions With Food
| Medication* | Interactions With Food |
| Beta-2 Agonists | |
| Albuterol | Peculiar taste, sore/dry throat, nausea/vomiting, dyspepsia, diarrhea, increased appetite or anorexia, limit caffeine |
| Proventil | |
| Ventolin | |
| Salmeterol xinafoate | Dental pain, decreased salivation, candidiasis, pharyngitis, throat irritation, nausea/vomiting, stomachache, diarrhea |
| Advair Diskus | |
| Serevent Diskus | |
| Metaproterenol sulfate | |
| Alupent | Dry mouth/throat, nausea/vomiting, dyspepsia, diarrhea, limit caffeine |
| Terbutaline | |
| Brethaire | Dry mouth/throat and unusual taste (inhalant), nausea/vomiting, dyspepsia, limit caffeine |
| Anticholinergics | |
| Ipratropium bromide | |
| Atrovent | Dry mouth/throat, metallic/bitter taste, nausea, dyspepsia. Do not use inhaler with soy or peanut allergy. Caution with lactation |
| Inhaler | |
| Nasal spray | |
| Tiotropium bromide | |
| Spiriva HandiHaler | Dry mouth, dyspepsia, abdominal pain, constipation, nausea/vomiting. Caution with lactation |
| Mucolytic Agents | |
| Dornase alfa | |
| Pulmozyme | Sore throat, laryngitis |
| Corticosteroids | |
| Beclomethasone | Dry mouth, decreased sense of taste, oral candidiasis, sore throat, nausea/vomiting |
| Beconase nasal inhaler | Rinse mouth after use and do not swallow rinse water. Nasal: Caution with lactation |
| Beconase AQ nasal spray | Oral: Do not use with lactation |
| Vancenase Pockethaler nasal inhaler | |
| Vancenase AQ nasal spray | |
| Qvar oral inhalant CFC-free (chlorofluorocarbons free) | |
| Triamcinolone acetonide | |
| Azmacort | Oral candidiasis, dry mouth, toothache, sore throat, pharyngitis with aerosol, nausea, abdominal pain, diarrhea. Rinse mouth after use and do not swallow rinse water |
| Flunisolide | Nausea/vomiting, sore throat, unpleasant taste, loss of smell, abdominal pain, heartburn, constipation, gas |
| AeroBid | |
| Fluticasone propionate | Nausea/vomiting, diarrhea, dyspepsia, stomach disorder |
| Advair Diskus | |
| Flovent | |
| Budesonide | |
| Pulmicort | Oral candidiasis, dyspepsia, gastroenteritis, nausea/vomiting, diarrhea |
| Mediator Antagonists | |
| Cromolyn sodium | |
| Intal | Take 30 min before meals and snacks. Open capsule and dissolve powder in 4 oz hot water; add 4 oz cold water (not juice, milk, or food). Unpleasant aftertaste, nausea. With aerosol/nebulizer: Dry mouth/throat, sore throat. With oral capsule: Abdominal pain, diarrhea |
| Zafirlukast | |
| Accolate | Take 1 hr before or 2 hr after food. Nausea/vomiting, dyspepsia, diarrhea, abdominal pain. Food decreased bioavailability of drug 40% |
| Zileuton | |
| Zyflo | Dyspepsia, nausea/vomiting, abdominal pain, constipation, flatulence; limit alcohol |
| Montelukast | |
| Singulair | Chew tablet well; caution with grapefruit juice—may increase side effects; dyspepsia |
| Aerosolized Antiinfective Agents | |
| Ribavirin | |
| Rebetol | Taste changes, nausea/vomiting, dyspepsia, dry mouth, abdominal pain |
| Copegus | Do not use with lactation |
| Tobramycin sulfate | Ensure adequate fluid intake/hydration. Anorexia, weight loss |
| TOBI (inhalation solution) | Stomatitis, increased salivation, nausea/vomiting |
*The generic name is followed by brand names of the drug.
Compiled from the Physicians’ desk reference, ed 60, Montvale, NJ, 2006, Medical Economics (www.pdr.net, Accessed August 24, 2006); and Pronsky Z: Food medication interactions, ed 14, Birchrunville, PA, 2006, Food-Medication Interactions.
When patients with COPD are hospitalized for ventilatory failure, the clinical outcome is affected by nutrition support. Patients who receive adequate nutrition support are more readily weaned from mechanical ventilators than patients whose diets are deficient in protein and energy. In patients who are not catabolic, reducing energy intake to a level equal to or just below the REE may also aid weaning.10 Nutrition support may be ineffective in some patients.61 Factors associated with such outcomes include aging, anorexia, and elevated inflammatory response.62
Asthma
Bronchial asthma is subdivided into allergic asthma and nonallergic asthma. Nutrient-dense small meals are recommended that are high in quality protein, calories, vitamins, and minerals during prolonged asthma attacks. The patient should avoid foods identified as allergens; most often, these foods are milk, eggs, seafood, and fish. Fluid intake should be generous, unless contraindicated. Saturated fats may aggravate the airway, and monounsaturated fats may be inversely related.63 Omega-3 fatty acids may be beneficial; these are available in walnuts and flaxseed if the patient is allergic to fish.21
Cystic Fibrosis
The goals of nutrition management in CF are to (1) maximize a nutrition intake through calorically dense foods (see Box 21-12), (2) balance intake with pancreatic enzymes to maximize absorption, and (3) provide a nutrition plan that meets the changing clinical and psychosocial needs of the patient.64 Use of calorically dense nutrition supplements (see Table 21-7) consumed throughout the day has proved helpful in achieving weight gain.65,66 Because of the malabsorption of micronutrients, vitamin and mineral supplementation is encouraged, especially of fat-soluble vitamins.15 Evidence suggests that the progressive pulmonary dysfunction seen in CF is partly attributable to nutrition deficiencies that can be readily corrected.67 Helping CF patients achieve optimal nutritional health may minimize the decline in pulmonary function and improve their quality of life.68
Summary Checklist
• Nutrition assessment is the basis for developing a nutrition care plan.
• The ABCDs of nutrition assessment include anthropometry, biochemical indicators, clinical indicators, and dietary history of the patient.
• Body mass index is a comparison of weight to height used to determine underweight, healthy weight, overweight, obesity, or morbid obesity.
• Classifications of undernutrition, called protein-energy malnutrition, include kwashiorkor, marasmus, and a combination of the two (lack of circulating protein, starvation, and a mixture of the two).
• Laboratory values of albumin, transferrin, transthyretin, and retinal-binding protein may indicate malnutrition.
• The creatinine-height index reflects skeletal muscle mass.
• Nitrogen balance compares protein intake to nitrogen excretion in the urine.
• Observable signs in hair, eyes, lips, mouth and gums, skin, and nails may indicate malnutrition.
• Resting energy expenditure (REE) may be determined by the Harris-Benedict equations or indirect calorimetry.
• Estimation of total caloric need involves multiplying the REE by a factor that accounts for activity and stressors.
• Indirect calorimetry involves measurement of whole-body  ,
,  , and respiratory quotient (RQ); results are used to assess a patient’s metabolic state, determine nutrition needs, or assess response to nutrition therapy.
• RQ greater than 1.00 indicates overfeeding and the need to decrease total calories; values between 0.7 and 0.8 indicate fat and protein oxidation secondary to starvation and the need to increase total calories.
• Malnutrition is a state of impaired metabolism in which the intake of essential nutrients is less than the body’s needs; marasmus is malnutrition associated with inadequate nutrient intake (starvation), and kwashiorkor is the hypercatabolic form.
• Malnutrition can affect the respiratory system by causing loss of respiratory muscle mass and contractility, decreased ventilatory drive, impaired immune response, and alterations in lung parenchymal structure.
• About one-third of all patients with acute respiratory failure have malnutrition, mainly the hypercatabolic form; these patients are prone to hypercapnia, can be difficult to wean from ventilatory support, and have higher mortality rates than patients with a normal nutrition status.
• In chronic lung disease, the combined effect of increased energy expenditure (secondary to increased work of breathing) and inadequate caloric intake contributes to a marasmus-type malnutrition.
• The primary goal of nutrition support is to maintain or restore lean body (skeletal muscle) mass by (1) meeting the overall energy needs of the patient and (2) providing the appropriate combination of macronutrients (protein, carbohydrate, and fat) and micronutrients (vitamins and minerals).
• Predicted REEs should be corrected for both stress and activity levels; typical factors range from 0.7 (for starvation) to 2.0 (for severe burns) of REE calories.
• For most patients, a balance of 20% of daily calorie needs from protein, 50% to 60% from simple carbohydrate, and 20% to 30% from fat is adequate.
• For a patient with pulmonary disease, high carbohydrate loads can increase CO2 production and the RQ, resulting in increased ventilatory demand, O2 consumption, and work of breathing.
• Nutrients can be supplied enterally (oral and tube feeding) or parenterally (peripheral or central venous alimentation); the enteral route should be used whenever possible.
• The likelihood of aspiration during tube feedings can be minimized by delivering the feeding beyond the pylorus using the continuous drip method and raising the head of the bed at least 45 degrees.
• Nutrition support should be individualized according to patient needs and condition or disease process; accepted guidelines for systemic inflammatory response syndrome, COPD, mechanical ventilation, asthma, and cystic fibrosis should be followed.