[level-membership-for-endocrinology-diabetes-and-metabolism-category]Chapter 11
Role of the Adipocyte in Metabolism and Endocrine Function
In an evolutionary sense, adipose tissue represents the most efficient way to store energy in periods of feast to allow survival during periods of famine. There are two main reasons for this efficiency. First, on a weight basis, triacylglycerol, commonly called triglycerides, yields more than two times more energy than glycogen or proteins. Second, triglycerides are stored without associated water, whereas glycogen, which is hydrophilic, binds as much as twice its weight to water. Similarly, proteins, the building blocks of cells, are associated with large amounts of water. As a result, the energy that can be recovered from triglycerides stores by unit of weight is more than four times greater than that from glycogen and/or protein stores. An average 75 kg man can store only approximately 500 g of carbohydrate in liver and muscle, representing less than a day of energy stores (see Chapter 10). By contrast, even in lean individuals, fat stores in the adipose tissue alone can amount to approximately 10 kg, which is sufficient to maintain bodily functions for weeks of survival during total food deprivation. In obesity, fat stores can be multiplied by as much as 10 to 20 times and can provide energy for months of starvation. The energy from triglycerides is stored in some 25 to 50 billion fat cells, representing the adipose tissue, most beneath the skin and in the abdomen. Until only 15 years ago, the adipose tissue was considered primarily as an energy storage compartment that provides energy fuel to the entire body between meals and during periods of energy deficit.
With the discovery of leptin in 19941 and the many other secreted proteins since that time,2 the adipose tissue now is not only considered as an energy reservoir but has reached the status of a true endocrine organ. Over the past decade, effort has been concentrated on gaining a better understanding of the regulation of adipose tissue development and apoptosis throughout the life span and its consequences for health and disease. In this chapter, we review the role of the adipose as an energy storage compartment, but more important, we summarize the current knowledge of what is now considered a finely tuned endocrine organ that can influence many facets of the conditions often referred as the metabolic syndrome (see Chapter 18). We first describe the link between too much fat (obesity), inflammation, endoplasmic reticulum (ER) stress, and insulin resistance, and alternatively, we provide arguments regarding why too little fat is equally and paradoxically associated with insulin resistance. Next, we review the pioneering work that led to the concept of hypertrophic and hyperplastic obesity and the critical periods during which adipose tissue is thought to develop. Our current understanding of the regulation of adipogenesis then is reviewed, and this is followed by a description of the afferent endocrine and neural signals to the adipose tissue. We also provide new information regarding the potential importance of brown adipose tissue in humans, a concept that has been discarded over the past two decades because of the belief that such tissue was lacking in adult humans. In the next section, we discuss the lipostatic theory, which led to the discovery of leptin and many other hormones involved in health and disease. Beside leptin, we provide additional details on adiponectin, resistin, tumor necrosis factor (TNF), apelin, and adipose. We conclude by proposing the adipocyte as a potential target for the treatment of obesity, dyslipidemia, and type 2 diabetes, with emphasis placed on inducing brown adipose tissue.
Obesity, Insulin Resistance, Inflammation, ER Stress, and Type 2 Diabetes Mellitus
Link Between Obesity and Insulin Resistance (Figs. 11-1 and 11-2)
Numerous cross-sectional studies have shown an association between obesity and type 2 diabetes. Data from the Third National Health Examination Survey (NHANES III) provide unequivocal evidence that the prevalence of diabetes is almost three times greater in overweight than in non-overweight persons.3 Many prospective studies have confirmed this association. As an example, the likelihood of developing diabetes increases steeply with increasing body weight and fatness in Pima Indians.4 The association between obesity and diabetes is attributed in most part to the increase in insulin resistance that is so common in obese people.5 Insulin resistance is a clear predisposing factor for the development of type 2 diabetes in individuals at risk for the disease.6–8
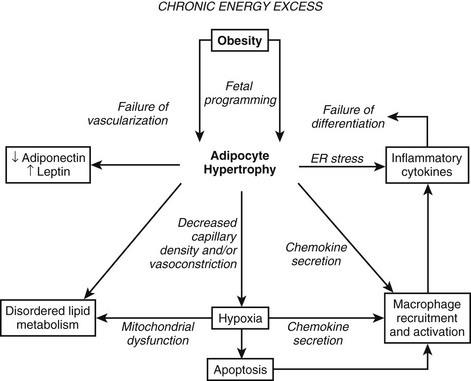
FIGURE 11-1 Obesity and adipocyte hypertrophy. Adipocyte hypertrophy is a key feature of the insulin-resistant state. The flux of free fatty acids out of adipose tissue is disordered in obesity, especially when adipocyte hypertrophy is present. In addition, hypoxia, inflammation, and endoplasmic reticulum (ER) stress have been implicated as important mechanistic links between obesity and insulin resistance. This figure attempts to reconcile the available data on how obesity might lead to insulin resistance. In many instances, the directionality of the connections between mechanistic factors is unclear. For example, it is clear that ER stress can lead to the secretion of inflammatory cytokines, but it is not entirely clear whether inflammation and macrophages might lead to ER stress. Similarly, reduced capillary density (rarefaction) leads to hypoxia, and hypoxia leads to the secretion of chemokines and inflammatory cytokines and probably disordered adipokine secretion. Hypertrophic adipocytes secrete the inflammatory peptide SAA, which may serve to amplify inflammation and chemotaxis of macrophages.342,343 At this time, it is difficult to disentangle the web of deleterious connections. It appears that once the cascade is initiated, multiple interlocking pathways may sustain the dysfunctional adipose tissue.
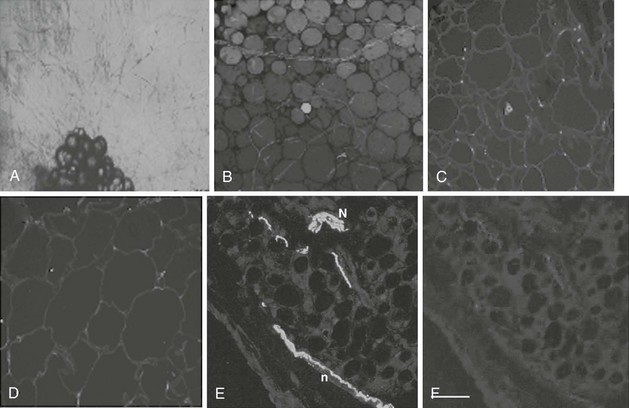
FIGURE 11-2 Angiogenesis and innervations in adipose tissue. Adipose tissue has the capacity to grow new blood vessels. A, Adipose tissue fragments show outgrowth of new capillaries after 10 days culture ex vivo.
(Photomicrograph courtesy Dr. Frank Greenway, Pennington Biomedical Research Center; methods as in reference 174.)
B, In human adipose tissue, capillaries form a rich meshwork around adipocytes.
(Photomicrograph courtesy Drs. Magdalena Pasarica, David Burk, and Steven Smith, Pennington Biomedical Research Center.)
Adipocytes are stained green (BODIPY) and capillaries are stained red (Lectin UEA). In obesity, capillary density is decreased in subcutaneous adipose tissue. Obese (C) adipose tissue and lean (D) adipose tissue have different capillary density. Adipocyte plasmalemma is stained green with Lectin-GS, and capillaries are stained red (Lectin UEA).
(Methods are presented in reference 59.)
Human adipose tissue is innervated with sympathetic nerve system (SNS) nerve terminals, which are important for the activation of lipolysis. E, Fluorescent immunohistochemistry of nerve fibers (neural specific antibody) in white adipose tissue. F, SNS-specific staining with tyrosine hydroxylase. (E and F are reprinted from Giordano209 with permission.)
Obesity usually is characterized by increased circulating plasma free fatty acid concentrations. Studies in animals and humans support a causal effect of elevated free fatty acids (produced by lipolysis of triglycerides from adipose tissue) on impaired insulin-mediated glucose metabolism.9–12 Such studies reinforce the original hypothesis proposed by Randle et al in 196313,14 that altered fatty acid metabolism is the key contributing factor to insulin resistance in obese and diabetic patients. Randle and colleagues demonstrated that free fatty acids compete with glucose for substrate oxidation in isolated preparations of heart and diaphragm muscle from rats. More specifically, they proposed that increased fatty acid availability in obesity causes an increase in the intramitochondrial acetyl–coenzyme A (CoA)/CoA and NADH/NAD+ ratios, leading to inactivation of the enzyme pyruvate dehydrogenase. This in turn causes an intracellular increase in citrate concentration, leading to inhibition of phosphofructokinase, the rate-limiting enzyme for glycolysis. As a consequence, glucose-6-phosphate accumulates in the cell and inhibits hexokinase II activity, leading to an increase in intracellular glucose and a decrease in glucose uptake, oxidation, and storage.
First, Wolfe15 identified some of the flaws in the notion that fatty acid availability controls substrate oxidation in the fasting state. He provided evidence that fatty acid oxidation is largely controlled at the site of oxidation, which, in turn, is determined by the availability of glucose. In this model, the primary physiologic role of increased adipose lipolysis in fasting conditions is to provide the necessary glycerol as a gluconeogenic precursor16; the rate of fatty acid oxidation then is regulated by the rate of intracellular metabolism of glucose.
Second, it now is well accepted that skeletal muscle predominantly relies on lipid oxidation during fasting and can easily switch from lipid to increased glucose uptake and oxidation in response to feeding and hyperinsulinemia.17 This switch from fat to carbohydrate oxidation in skeletal muscle has been called metabolic flexibility. It is important to note that Kelley and Mandarino provided convincing evidence that glucose oxidation is increased in the leg of subjects with type 2 diabetes, thereby decreasing its reliance on fat oxidation.18 In opposition to Randle’s glucose–fatty acid cycle, their series of studies suggest that hyperglycemia itself causes an impairment of the normal fasting reliance of skeletal muscle on fatty acids, thereby causing an accumulation of lipids into the muscle tissue. This reversed Randle cycle theory highlights the primary role of impaired lipid oxidation in skeletal muscle rather than excessive lipolysis in the adipose tissue. Growing evidence suggests that the primary cause of the metabolic inflexibility noted in subjects susceptible to insulin resistance is impaired fat oxidation in the fasting state rather than a lack of increased carbohydrate oxidation in response to feeding.19 In support of this concept, evidence now points toward decreased mitochondrial oxidative capacity in insulin-resistant subjects with diabetes20 or a family history of diabetes21 and in insulin-resistant older individuals.22
To prove or disprove the “Randle cycle” hypothesis, Shulman and colleagues23 went one step further. If the Randle hypothesis was true, one would predict an accumulation of glucose-6-phosphate in the skeletal muscle of healthy subjects during glucose and insulin infusions in the presence of high plasma free fatty acid concentration. They directly tested this hypothesis using magnetic resonance spectroscopy. As was expected, high concentrations of circulating free fatty acids caused a reduction in insulin-mediated glucose uptake, with an approximately 50% decrease in glucose storage and a 50% decrease in glucose oxidation.11 However, in contrast to what would be predicted by Randle’s hypothesis, no accumulation of glucose-6-phosphate occurred. Therefore, reduced glucose uptake when free fatty acids are high is due to impaired glucose transport or impaired intracellular signaling. This series of studies shows that intramuscular fatty acids or fatty acid metabolites seem to interfere with the transport of glucose into skeletal muscle cells. Studies have provided some potential mechanisms for the effects of free fatty acid–induced insulin resistance via an impact on insulin signaling at the level of protein kinase C.24–27 More recently, however, Koves et al28 using targeted metabolomics found that obesity-related insulin resistance in skeletal muscle is characterized by excessive β oxidation, impaired switching to carbohydrate during the fasted-to-fed transition, and simultaneous depletion of organic intermediates of the tricarboxylic acid cycle. Therefore, excessive rather than reduced β oxidation underlies the development of muscle insulin resistance by accumulation of acyl-CoAs and their respective acyl-carnitines.28
Although many studies have provided evidence for an association between insulin sensitivity and visceral fat mass (reviewed in reference 29), other studies provide as good evidence for an association between the amount of subcutaneous fat on the trunk and insulin resistance in obese nondiabetic men30,31 and in men with type 2 diabetes.18,32,33 Similarly, insulin resistance in obese women is better related to overall elevated fat mass than to just visceral fat mass.34,35 Thus, subcutaneous fat, which does not drain into the portal vein, causes insulin resistance through a nonportal mechanism. Growing experimental evidence, which does not support the Randle/portal hypothesis, therefore calls for a change in the scientific paradigm to explain the insulin resistance so common in obesity. The bulk of the literature now provides evidence that excessive total fat mass (rather than just visceral fat mass) and impaired muscle fat oxidation are associated with insulin resistance and increased risk for the development of type 2 diabetes. Some of our own studies have clearly shown that gluteal adipose tissue may be protective against insulin resistance rather than precipitating it.36
Links Between Obesity, Inflammation, and ER Stress (see Figs. 11-1 and 11-2)
Studies of murine adipocyte differentiation have revealed an intermediate developmental phenotype between the preadipocyte and the adipocyte that Cousin et al.37 termed the adipiphage, a cell intermediate between the adipocyte and a macrophage. This relationship is not surprising in light of the similarities in gene expression profiles between the two cell types. The macrophage is responsible for consuming extracellular bacteria, cellular debris, and lipids, whereas the adipocyte is responsible for internalizing and sequestering excess lipids. Studies in mice and humans have suggested that adipose tissue contains not only adipocytes and supporting cells, but also macrophages.38,39 The macrophages appear to serve as the major site of TNF secretion and may secrete other cytokines such as interleukin (IL)-8,40,41 an atherogenic cytokine produced in adipose tissue. These studies have also suggested that the bone marrow was the major site of origin for adipose tissue macrophages, indicating that obesity and diabetes might recruit these cells through the production of one or more chemokines.42 The significance of the inflammatory cells is that they, like TNF-α, are likely to activate the NF-κb signaling cascade. Iκκ-β, the upstream activator of NF-κb signaling, plays a key role in insulin signaling and is necessary for the full expression of the insulin-resistant phenotype in the obese ob/ob mouse.43 Upstream activators of this pathway include not only TNF-α, but also fatty acids44 and bacterial lipopolysaccharide. Fatty acids activate this pathway via the Toll-receptor 4, which also responds to lipopolysaccharide.44 In vivo studies in mice43 and humans45 demonstrate that salicylates, inhibitors of the Iκκ-β pathway,46 play an important therapeutic role in insulin resistance and diabetes,47 in part through adipocyte-mediated pathways.48,49 The antidiabetic peroxisome-proliferator–activated receptor (PPAR-γ) ligands (e.g., thiazolidinediones [TZDs]) also decrease the gene transcriptional effects of the Iκκ-β pathway.50
Many more inflammatory cytokines such as monocyte chemoattractant protein-1 (MCP-1) and plasminogen activator protein (PAI) have been linked to adiposity. The increase in inflammatory cytokines found in obesity ultimately characterizes excess adipose tissue as a state of low-grade systemic inflammation, which may link obesity to its comorbidities.51 Obesity therefore occurs in association with an increase in inflammatory cytokines and an infiltration of macrophages within the adipose tissue. Two of the major unsolved questions regarding this observation are these: Why does inflammation occur in parallel with obesity? What is the consequence of this inflammation? One of the growing hypotheses first proposed by Trayhurn’s group52 and recently reviewed53,54 is that inflammation is likely the result of reduced oxygenation (hypoxia; see Figs. 11-1, 11-2, and 11-3) in adipose tissue, which may provide cellular mechanisms for macrophage infiltration, reduced adiponectin secretion, increased leptin secretion, adipocyte death, ER stress, and mitochondrial dysfunction55 in white adipose tissue in obesity.56–58 Inhibition of adipogenesis and triglyceride synthesis by hypoxia may be a mechanism for elevating plasma free fatty acids and reducing adiponectin concentrations, both of which lead to insulin resistance in obesity.56,57 The biological basis for adipose tissue hypoxia could be related to a reduction in arterial blood flow as a result of adipocytes outgrowing their blood supply (Fig. 11-3). A failure to maintain blood flow or a reduction in capillary density (lack of compensatory angiogenesis) or vasoconstriction may serve as the basis for the reduction in blood flow observed in human adipose tissue.53 The hypothesis that increased adipose tissue mass in obesity without adequate support of vascularization might lead to hypoxia, macrophage infiltration, and inflammation was recently confirmed in human studies.59
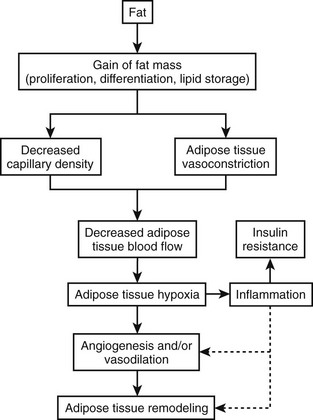
FIGURE 11-3 Hypoxia, inflammation, and insulin resistance.
(This figure is adapted from a recent review by Ye.53)
Rapid growth of adipose tissue leads to an expansion that may not be accompanied by a simultaneous maintenance of capillary density through increased angiogenesis or vasodilation and therefore a decrease in blood flow to the tissue. Decreased blood flow per unit of adipose tissue leads to tissue hypoxia, which, in turn, induces inflammation. When inflammation becomes out of control with increased systemic and local cytokine concentrations, insulin resistance occurs. Adipose hypoxia therefore is a signal for the remodeling of adipose tissue.
Over the past few years, publications have provided growing evidence suggesting that ER stress may play a role in the pathogenesis of type 2 diabetes.60 The ER is a highly dynamic organelle with a central role in lipid and protein biosynthesis. It produces the transmembrane proteins and lipids for most cell organelles and is responsible for the synthesis of almost all secreted proteins. After translation of proteins is performed by ribosomes on the cytosolic surface of the ER, the unfolded polypeptide chains are translocated into the ER lumen, where numerous chaperone proteins are crucial for the proper folding of proteins and protein complexes.61
However, the ER is exquisitely sensitive to alterations in homeostasis, and proteins formed in the ER may fail to attain proper conformation owing to (1) lack of chaperones or energy to promote chaperone–protein interactions, (2) calcium depletion, (3) disruption of the redox state, (4) protein mutations that hamper adequate folding, and (5) reduction of disulfide bonds.60 ER stress is also called the unfolded protein response (UPR). Lipotoxicity and glucotoxicity as seen in prediabetes and diabetes are triggers of ER stress.
Excess free fatty acids as seen in obesity activate the ER stress response in β cells, eventually causing apoptosis.62 Recent data suggest that hypoxia in adipose tissue of obese mice and people may contribute to the induction of ER stress, thereby affecting adipokine production. For example, adiponectin expression was decreased in adipose tissue from high-fat–fed KKAy mice.63 Evidence for the role of ER stress in human tissues such as pancreas, muscle, and adipose is presently not available. Similarly, increases in expression and phosphorylation of stress-activated kinases such as p38 and JNK were detected in omental adipose tissue from obese women compared with lean controls.64 Over the next few years, research in this area should lead to a better understanding of the interaction between obesity, inflammation, hypoxia, and ER stress.
Link Between too Little Fat and Insulin Resistance
At the other end of the spectrum from obesity, it is now recognized that a lack of adipose tissue is associated with insulin resistance and increased risk for development of type 2 diabetes (see Chapter 12). Lipodystrophy in humans is an acquired or hereditary syndrome characterized by decreased adipose tissue mass, insulin resistance, and often diabetes mellitus.65–68 In these patients, insufficient adipose tissue mass leads to excess energy storage as triglycerides in liver and skeletal muscle and causes insulin resistance in these tissues.69,70 Genetic manipulation causing ablation of adipose tissue in mice supports the link between adipose deficiency and insulin resistance. Transgenic animals without adipose tissue store lipid in skeletal muscle and liver and develop insulin resistance, glucose intolerance, and eventually diabetes.71–73 This is identical to the fatty liver and muscle seen in obesity and type 2 diabetes. Furthermore, transplantation of adipose tissue back into lipoatrophic animals reverses the elevated glucose levels.74 However, transplantation of adipose tissue from leptin-deficient mice (ob/ob) did not improve the metabolic abnormalities, indicating that the sequestration of triglyceride into adipose tissue is not entirely sufficient to restore insulin sensitivity.75 In humans, treatment of lipodystrophic patients with leptin can dramatically reverse the fatty liver and insulin resistance.76–78 On the other hand, surgical removal of adipose tissue causes the metabolic syndrome.79 Together, these studies demonstrate that, as in obesity, inadequate adipose tissue mass leads to ectopic fat storage and metabolic disturbances. Too little fat therefore is as deleterious as too much fat and predisposes to the development of the metabolic syndrome with insulin resistance and ultimately type 2 diabetes. Three new paradigms may explain insulin resistance:
1. The ectopic fat storage syndrome, in which excess fat is deposited in tissues other than adipose tissue with functional disturbances noted in these tissues
2. The endocrine adipocyte, which secretes hormones involved in insulin resistance and cardiovascular disease
3. The inflammatory adipose tissue, with adipose tissue macrophage infiltration and macrophage activation leading to dysregulation of adipocyte lipid metabolism and adipokine secretion
Obesity Is Another Ectopic Fat Storage Syndrome
Positive energy balance in our “obesigenic” environment produces a pattern similar to lipodystrophy in humans, that is, excess lipid storage in liver80 and skeletal muscle,23,81,82 followed by insulin resistance, glucose intolerance, and diabetes. However, in contrast to lipodystrophic patients, adipose tissue stores are adequate or even large in obese patients, suggesting that the size of adipose tissue becomes inadequate to sequester dietary lipid away from liver, skeletal muscle, and pancreas. The adipocyte becomes hypertrophic and is unable to recruit and/or differentiate new adipocytes to store the excessive dietary fat.83 The Danforth hypothesis is supported by the fact that, independent of total fat mass, individuals with larger fat cells are at higher risk of developing type 2 diabetes than are individuals with smaller fat cells.84 Furthermore, TZDs improve insulin resistance in part by promoting the differentiation of new fat cells in subcutaneous adipose tissue through activation of PPAR-γ, thereby providing extra storage capacity for dietary fat.85,86 Adipogenesis translates into a gain in subcutaneous adipose tissue87 and a decrease in lipid infiltration in skeletal muscle and liver.88,89 Through the upregulation of genes in the lipid storage and synthesis pathways in adipose tissue, TZDs also decrease free fatty acids, providing a second mechanism for protection of liver, muscle, and the cell from fatty acids.90–92 As is discussed later in this chapter, drugs may be designed to decrease ectopic fat storage by increasing adipogenesis and/or increasing fat oxidation, leading to improved insulin action. Weight gain in humans is probably due to an increase in food intake consistent with the action of the PPAR-γ agonists in increasing food intake.93,94
Adipose Tissue: Hypertrophy vs. Hyperplasia
Historically, adipose tissue was viewed as an inert tissue with a singular function: lipid storage. The main areas of research in the field of adipose tissue were related to adipocyte size and number, as well as to lipid synthesis, adrenergic regulation of lipolysis, and insulin signaling in isolated adipocytes. In adults, obesity is associated with an increase in both the number and the size of adipocytes95,96 (Fig. 11-4). The increase in fat cell size (hypertrophy) is thought to reflect an imbalance between adipocyte lipid uptake or synthesis and the release of lipid via lipolytic pathways. In addition to increased adipocyte size, obese individuals have an increase in the absolute number of adipocytes (hyperplasia). Early studies demonstrated heterogeneity in fat cell size; some obese patients have adipocytes as large as 1 mL, and others have very small fat cells. This heterogeneity led to the concept of hypertrophic or hyperplastic obesity based on the average size of fat cells (see Fig. 11-4). In contrast to this dichotomous viewpoint, the reality is that obese individuals cannot be grouped into such simple categories. There is a continuous distribution of fat cell size, and most obese patients have both hypertrophy and hyperplasia. Increased fat cell size is correlated positively with fasting insulin and negatively with insulin sensitivity.97 In Pima Indians, increased abdominal adipocyte size is associated with insulin resistance,84,98 a potential inherited trait99 that predicts the onset of type 2 diabetes.84 Together, these data suggest that increased fat cell size is important to whole body metabolism and insulin action.
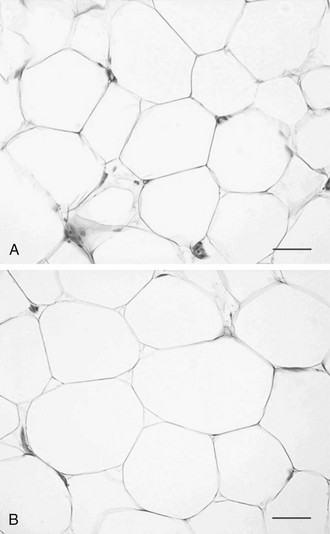
FIGURE 11-4 Hyperplastic versus hypertrophic obesity. Adipocytes are derived from mesenchymal stem cell precursors (see Fig. 11-7). Both mesenchymal precursors and the preadipocyte, whose differentiation potential is limited to the adipocyte lineage, can undergo mitosis. Hyperplastic obesity (A) is defined by an increase in the number of adipocytes, while adipocyte size remains small. Hypertrophic obesity (B) is characterized by larger adipocytes. The reason for the increase in adipocyte size is unclear. Current hypotheses suggest that failure of the large adipocyte to recruit preadipocytes to differentiate may play a role in the development of insulin resistance, a precursor to overt β cell failure as manifested by diabetes. (Photomicrographs courtesy of Prof. Saverio Cinti, MD, Institute of Anatomy, Faculty of Medicine, University of Ancona, Italy.)
There are several ways of thinking about why fat cells might be large in obese individuals. First, adult adipose tissue has been viewed as a nonmitotic tissue, and increases in adipocyte size might simply reflect an imbalance between storage and lipolysis. If the number of adipocytes is considered fixed, any increase in adipose tissue mass is the result of increased lipid storage in adipocytes. A second view is that fat cells can be recruited continually to differentiate into mature lipid-storing fat cells, and large fat cells are an indication of the failure of this process. Several investigators have proposed that once adipocytes are filled to a certain degree, new fat cells are recruited, and lipid then is stored in these new insulin-sensitive and lipid-hungry adipocytes. The cross-sectional data used to support this model are presented in Fig. 11-5. Average fat cell size increases as body fatness increases up to a certain point, after which increased adiposity does not result in an increase in fat cell size. Even if individuals with hyperplastic or hypertrophic obesity lose weight equally, hyperplastic obese patients regain the weight much more quickly than do hypertrophic subjects, lending support for the concept of small lipid-hungry fat cells100 (Fig. 11-6). During weight loss, fat cell size decreases without a change in fat cell number but with a decrease in fasting insulin.97 This has been interpreted as evidence that once a fat cell is formed, it is permanent. However, recent studies demonstrate a relatively high rate of adipocyte turnover101 and evidence for regulation of apoptosis.102 It should be noted that longitudinal data and precise measures of fat cell number are not sufficient to confirm this model in humans. This in part is the result of our current inability to accurately quantify the numbers of stem cells and preadipocytes in adipose tissue in vitro or in vivo, and it is associated with the difficulties involved in quantifying the very smallest fat cells in adipose tissue.103
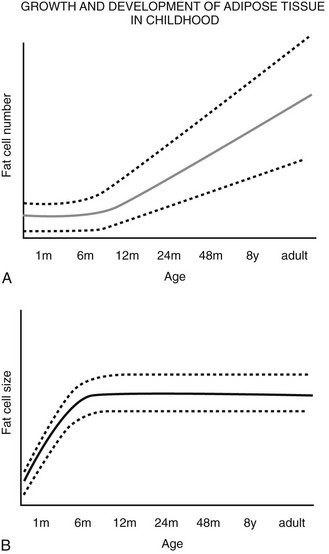
FIGURE 11-5 Schematic relationship between age, body fat mass, and fat cell size/number in childhood. A, Whole body fat cell number remains constant during the first year of life and then increases over time.
(A and B adapted from the data from Hager105 and Soriguer Escofet.106)
A wide range of fat cell size and number across individuals is indicated by the dashed lines. B, The increase in body fat that is seen during the first year of life occurs primarily as a result of increased lipid storage and hypertrophy of existing adipocytes rather than through the recruitment of preadipocytes.
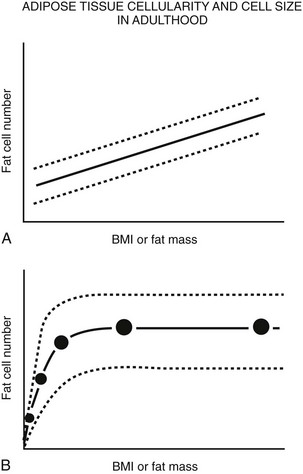
FIGURE 11-6 Schematic relationship between body fat mass and fat cell size/number in adulthood. A, In adults, whole body fat cell number increases with increasing body mass (hyperplasia). B, Again in adults, cross-sectional data show a positive correlation between body fat mass and fat cell size at lower body fat mass (solid line) until fat cell size reaches a plateau at higher levels of fat mass. At this point, fat cell size cannot increase any further because of (1) limitations in lipid storage for unknown reasons, and/or (2) recruitment of existing preadipocytes to differentiate and store lipid, and/or (3) proliferation and differentiation of mesenchymal precursor cells into mature lipid-storing adipocytes. If fat cell proliferation, differentiation, and/or recruitment did not occur, fat cell size would continue to increase as fat mass increased. A wide range of fat cell size and number across individuals is indicated by the dashed lines. Fat cell number does not appear to change with weight gain or loss; however, precise tools are not available to quantify small changes in adipocyte number in vivo in humans. (Data from Hirsch J, Batchelor B: Adipose tissue cellularity in human obesity, Clin Endocrinol Metab 1976;5:299–311.)
In contrast, the cross-sectional data illustrated in Fig. 11-6 could be interpreted as evidence for the recruitment of new adipocytes. If fat cell hypertrophy was the only way to gain fat, then fat cell size would increase linearly with fat mass. This is not the case. Based on cross-sectional data, the point at which hypertrophy recruits new fat cells probably occurs at a cell volume between 0.8 and 1.0 mL.104–106 Two additional pieces of evidence support the view that recruitment of new fat cells occurs in vivo in humans. First, when adipose tissue is separated into fat cells and the remaining cell populations (stromal-vascular fraction), adipocytic precursor cells from the stromal-vascular fraction are able to differentiate in vitro into mature lipid-storing adipocytes throughout life and into old age. Obesity and age are determinants of the capacity to differentiate adipocytes in vitro.107,108 Recent studies of in vivo DNA synthesis in humans suggest that adipocyte turnover is high in adult humans with a  ranging from 240 to 425 days.101,109 In addition, recent work suggests that the large fat cells secrete a factor or factor(s) that promote adipocyte proliferation and differentiation—a finding that is consistent with the recruitment of new adipocytes by hypertrophic adipocytes, as was discussed earlier.110
Studies by Hirsch and others in rodents demonstrated that animals that were calorically deprived before weaning had a reduced total number of fat cells when compared with animals that were suckled in smaller litters with higher caloric intake. Similarly, about one half of the obesity in Zucker fatty rats can be prevented by early restriction of energy.111 This gave rise to the concept that early overfeeding during adipose tissue development might increase the population of adipocytes and their precursors that produce obesity over time. This model, known as the adipose cell or critical period hypothesis, predicts that a large number of adipocyte precursors early in life could lead to the development of obesity by providing a “sink” destined to be filled with lipid. A corollary to this concept is that individuals with a reduction in adipocyte precursors, similar to those individuals with failure of adipocyte differentiation as described earlier, would be predisposed to the development of diabetes when food intake is increased, as their storage capacity for excess fat is diminished.
Although the concept of an early life critical period for adipocyte precursor development has been much discussed, by comparison the actual data supporting this concept are sparse. Consistent with this concept, obese subjects with an early childhood onset of obesity tend to have smaller fat cells when compared with those with later adult onset of obesity.112,113 Similarly, children of mothers who were energy deprived during the Dutch famine of 1945 had a lower incidence of obesity in adulthood.114 Although no prospective long-term data exist to support the adipose cell hypothesis, the cross-sectional data support the concept that in many cases of early-onset obesity, adipose tissue size tends to be hyperplastic rather than hypertrophic; the latter is seen with late-onset obesity.
The original data and hypothesis presented by Hirsch suggested a single early critical period; later discussions offered the concept that additional critical periods of adipocyte precursor proliferation might exist,96 with recruitment from the precursor pools into mature adipocytes throughout life. At birth, a typical infant has about 4 billion observable fat cells, and this number increases to approximately 10 to 40 billion in lean individuals and up to 50 to 100 billion in obese patients,115 supporting the concept of ongoing adipocyte proliferation and/or recruitment throughout life. In contrast to rodents, humans have a long, slow growth and development period (neotony) and are likely to have several critical periods of adipocyte development.116
Body fat mass increases during the first year of life, most often through fat cell hypertrophy. After the first year, the number of adipocytes increases, the fat cell size remains relatively constant, and whole body adiposity (% fat) decreases. At about 6 years of age, % body fat begins to increase again. This has been termed the adiposity rebound. Longitudinal body weight data in children demonstrate that an earlier adiposity rebound is associated with obesity in adulthood.117–119 Although no detailed information is available on the relative role of hypertrophy versus hyperplasia for this age range, the adiposity rebound is considered a critical period for adiposity later in life.120
Regulation of Adipogenesis
• Adipocyte precursor proliferation
• Differentiation of these precursors into mature insulin-sensitive, lipid-storing adipocytes
• The balance of lipid storage, utilization, and release within each mature adipocyte
Adipocytes can be classified based on anatomic location as subcutaneous, visceral (intraperitoneal), bone marrow, and structural (periorbital, palms of the hands and soles of the feet). The hereditary and acquired lipodystrophies teach us that each of these depots of adipose tissue is developed or regulated differently, as each form of lipodystrophy results in loss or failure to differentiate in specific depots. For example, in congenital generalized lipodystrophy, mechanical adipose tissue of the palms and soles is spared.121
Adipose tissue precursors are primarily mesenchymal in origin (Fig. 11-7). These precursor cells, also known as preadipocytes or stromal cells, have the capacity to differentiate into a limited number of cell types, including adipocytes, osteoblasts, and chondrocytes.122 At least two distinct subtypes of preadipocytes have been identified (reviewed in reference 123). These two subtypes, probably distinct from the white adipose tissue/brown adipose tissue switch described later, differ in their capacity for replication, differentiation, and susceptibility to TNF-α-induced apoptosis. Subcutaneous adipose tissue preadipocyte precursors replicate faster and differentiate better than omental precursors. Evidence suggests that omental and mesenteric adipose tissue preadipocytes differ as well.124,125 These differences in preadipocyte characteristics are postulated to influence the propensity of an individual to store fat in the visceral versus subcutaneous depots. Transcriptome analysis of subcutaneous and visceral adipose tissue reveals a distinct pattern of expression of many genes; not only between depots but also across body mass indices (BMI).126,127 In addition, major differences have been noted in the expression of developmental genes in subcutaneous versus visceral adipose tissue. Taken together with the cellular phenotypes identified by Kirkland’s laboratory,128 this suggests that different cell types contribute to differences in the function of each adipose tissue region, and these differences can be explained by developmental programming. In addition to these developments in the different types of preadipocytes, the origins of the preadipocyte are becoming clearer. Recent work involving multiple tissues, including adipose tissue, suggests that pericytes—cells that lie just outside the capillary—are a major source of mesenchymal stem cells and preadipocytes.129,130
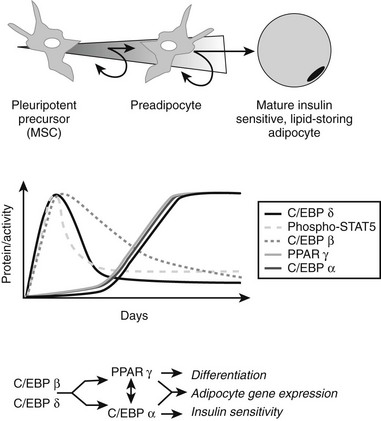
FIGURE 11-7 Adipocyte differentiation cascade. Adipocytes are derived from mesenchymal stem cell precursors (MSCs). Both the mesenchymal precursors and the preadipocyte, whose differentiation potential is limited to the adipocyte lineage, can undergo mitosis. The middle panel depicts the coordinate, sequential activation of the major nuclear transcription factors thought to be involved in the adipogenic differentiation process. PPAR-γ is considered an obligatory “master” regulator of adipogenesis. The PPAR-γ system turns on genes involved in lipid synthesis and insulin action (see text for details).
We know very little about the systems that control proliferation of adipose tissue precursors. Most of what we know is derived from the study of the cellularity of rodent adipose tissue or the behavior of stromal-vascular cultures in vitro. Some of the known activators and inhibitors of adipogenesis are presented in Table 11-1. For example, insulin-like growth factor-1 (IGF-1), a growth factor under the control of insulin and growth hormone in adipose tissue, promotes the proliferation and differentiation of preadipocytes, while transforming growth factor (TGF) inhibits proliferation.131 More is known about the processes whereby adipocyte precursors, particularly 3T3-L1 preadipocytes, proceed along the pathway from precursor to mature adipocyte. We now know that a series of transcription factors coordinately regulate multiple genes in a tightly regulated temporal fashion. As is shown in Fig. 11-7, each of these transcription factors forms a nonredundant network that, once initiated, leads to the emergence of the adipocyte phenotype. Some of the known key transcription factors include PPAR-γ, STAT5, C/EBP/α, and SREBP1c/ADD, CREB, and Wnt/frizzled. In addition, a new family of proteins—the krüppel-like factors—has been identified as regulators of adipocyte differentiation.132
Table 11-1
Multiple hormones, cytokines, growth factors, cell cycle regulators, and adhesion molecules control this differentiation cascade. Classic studies by Green and others showed that when confluent, clonal cell lines such as 3T3-L1 and F442A differentiate into adipocytes if exposed to a cocktail of insulin, dexamethasone, and isomethylbutylxanthine (IBMX).133–135 Emphasis has also been placed on the role of cell cycle and the necessity for proliferation prior to differentiation of precursors. However, recent data suggest that this has more to do with the E2F transcription factors than with the process of mitosis per se.136,137
IBMX and other agents that increase cyclic adenosine monophosphatase (cAMP) act through the transcription factor CREB.138 Several transcription factors are critical for the conversion of cells from a fibroblastic phenotype to an adipocytic phenotype. PPAR-γ has received the most attention, and this is warranted since overexpression of PPAR-γ into fibroblastic cell types is sufficient to confer the adipocytic phenotype.139 There are several putative endogenous ligands for PPAR-γ, including the prostaglandin PGJ2,140,141 long-chain fatty acids, and 13-HODE and 15-HETE, which can be generated from linoleic and arachidonic acids, respectively, by a 12/15-lipoxygenase.142 All of these compounds can activate the PPAR-γ transcription factor that heterodimerizes with the RXR transcription factor to turn on genes in the glucose uptake,143,144 lipid uptake,145 and lipid synthesis pathways.146,147 The true endogenous ligands are unknown, but their synthesis/activity appears to be downstream of the C/EBP-β transcription factor.148 C/EBP-α is expressed contemporaneously with PPAR-γ and facilitates the full adipocytic phenotype. Immediately upstream of PPAR-γ lie the C/EBP transcription factors C/EBP-β and C/EBP-δ, which upregulate PPAR-γ. Other transcriptional promoters of adipogenesis include STAT 5,149 the glucocorticoid receptor, and ADD/SREBP-1c.150 Transcriptional inhibitors include GATA 3,151 TCF/LEF, and the Wnt pathway.152 Combined with the transcriptional activators, they cooperate in an orchestrated cascade of transcriptional events leading to a mature adipocyte.
Last, PPAR-γ cofactors may regulate the ultimate transcriptional program in adipocytes. For example, adipocytes can be converted from energy storage to energy consumers by the PPAR-γ cofactor PGC-1a.153 Similarly, the PPAR-γ cofactors SRC-1 and TIF2 may determine the responses of adipose tissue to high-fat diets, with SRC-1 activating fatty acid oxidation and TIF2 promoting lipid storage.154 These two examples highlight a growing understanding that not only the ligand but also the transcription factors and cofactors are important in whole body metabolism. The intracellular transcriptional control system is regulated by extracellular signals from cytokines, hormones, neural inputs, and the autocrine/paracrine production of ligands for these transcription factors.
Adipocytes and indeed virtually all other cells store neutral lipids such as triglycerides in droplets of varying sizes. These droplets are formed as triglyceride is synthesized in the endoplasmic reticulum or is taken into the cell from the plasma membrane. Lipid droplets are coated by a layer of phospholipids and proteins that serve to sequester the neutral lipids from the cytosol and to regulate the access of lipases to the surface of the lipid droplet. Substantial progress has been made in the identification of these lipid coat proteins since the initial discovery of perilipin and other members of the perilipin family (Perilipin, Adipophilin, S3-12, and TIP-47 [PAT]).155 Consistent with their functional role, the structure of these proteins is highly conserved with both hydrophilic and hydrophobic domains. In adipose tissue, each PAT protein plays a distinct role, contributing to lipid synthesis or lipolysis. For example, perilipin-A is phosphorylated by PKA and PKG, which allows docking of lipases and the initiation of lipolysis.156 On the synthesis side, the repertoire of lipid droplet proteins changes as the lipid droplet is formed and matures, demonstrating the on-off exchange of these proteins and the dynamic nature of the process for formation and movement of lipid droplets. Once again, the biology is showing us that the adipocyte is not a static, inert tissue but rather participates as an active organ in the regulation of metabolism via lipid droplets, which are dynamic organelles in their own right. Lipid droplet proteins may play an important role in lipid oxidation independent of their role in lipolysis. A novel PAT protein, LDRP5 (also called OXPAT or Mldp) appears to be important for activating lipid oxidation in oxidative tissues such as cardiac myocytes.157
Brown Adipose Tissue in Humans
Brown adipose tissue (BAT) is an exquisitely designed tissue/organ system that has evolved for the maintenance of body temperature. It is characterized by smaller cells with large quantities of mitochondria and small lipid droplets, providing the potential for high cellular metabolism. At the metabolic, protein, and transcription levels, the BAT is upregulated principally by the sympathetic nervous system when production of heat is needed to maintain body temperature. Years ago, Nicholls and Ricquier158,159 described a mechanism for heat production based upon a specific highly abundant protein (uncoupling protein 1; Ucp1) in the inner mitochondria of brown adipocytes that uncouples the production of chemical energy as adenosine triphosphate (ATP) from oxidative phosphorylation and instead produces heat.
Until recently, BAT has been thought to be most important for maintaining body temperature in small mammals and infants, but a function in the physiology of adult humans was dismissed because of low numbers of brown adipocytes.160,161 However, unrelated pursuits in nuclear medicine using positron emission tomography (PET)/computed tomography (CT) scanning techniques have revealed the presence of BAT in adult humans, especially after cold exposure.162,163 The question now is how can we induce this amazing organ not only to generate heat but also to enhance fat oxidation and thereby reduce obesity.
Although the normal function of brown fat thermogenesis may be specific for the regulation of body temperature, many genetic and pharmacologic studies in rodents have shown that constitutive overexpression of Ucp1 in white fat and skeletal muscle can drastically reduce both genetic and diet-induced obesity, offering therefore a new safe molecular target for the treatment of obesity.164–166 This potential for brown fat adaptive thermogenesis as a drug target for obesity has not been ignored by the pharmaceutical industry. Unfortunately, many candidate agonists of the β3-adrenergic receptor have failed in human clinical trials, even though these drugs have been efficacious in rodent models of obesity. What is different in the human and in the mouse?
Most of the effects of genetic, pharmaceutical, or cold-induced upregulation of Ucp1 in the mouse models result in the emergence of new brown adipocytes in white fat depots with levels of Ucp1 upregulated several-hundred fold (Fig. 11-8). Unfortunately, human white adipose tissue does not appear to be able to mount such transient induction of brown adipocytes. The failure of brown fat thermogenesis in humans appears to be based on the lack of fundamental information on the mechanisms controlling the developmental origins of brown adipocytes within discrete brown fat depots (e.g., interscapular brown fat) and on the small number of diffusely localized brown adipocytes in various white fat depots. However, a recent paper from the Spiegelman group167 elegantly describes a novel transcription factor PRDM16, whose presence can promote the differentiation of preadipocytes and myoblasts into brown adipocytes, and whose absence promotes the myogenic differentiation program (see Fig. 11-8). It is important to note that the ability of PRDM16 to induce the brown adipocyte lineage is restricted to discrete brown fat depots, such as those found in the interscapular region, but it does not participate in induction of the diffuse brown adipocytes located in the white fat depots. The data support the concept that interscapular BAT and brown adipocytes in white fat have separate independent developmental origins.168 PRDM16 is clearly an important player in brown adipogenesis but may not be sufficient, since PRDM16 KO mice have significant levels of interscapular fat with Ucp1 expression.167 However, one does not know whether upregulation of PRDM16 in humans can induce increased discrete brown adipose tissue and/or diffuse brown adipocytes.
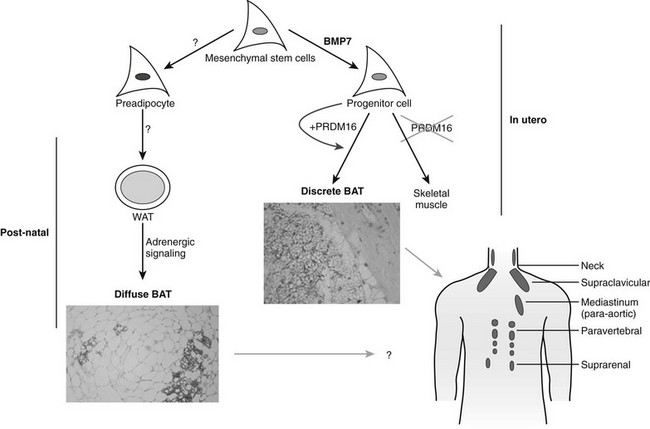
FIGURE 11-8 Brown adipose tissue in humans. Mesenchymal stem cells can have two major pathways, one into preadipocytes and another into progenitor cells of brown adipocytes or skeletal muscle cells. Bone morphorgenetic protein 7170 activates a full program of brown adipogenesis, including induction of early regulators of brown fat PRDM16 and PGC-1α.167 In absence of PRDM16, these progenitor cells are transformed into skeletal muscle cells. Preadipocytes are differentiated into white adipocytes in subcutaneous and visceral adipose tissue. By stimulation of adrenergic signaling, some of these white adipocytes can be transformed into brown adipocytes defused in the white adipose tissue. On the other hand, discrete brown adipocytes are concentrated in brown adipose tissue depots such as in the neck and supraclavicular, paravertebral, and suprarenal regions. The recently discovered brown adipocyte tissue regulator PRDM16167 is responsible, at least in rodents, only for the generation of discrete brown adipose tissue.
Although the regulator PRDM16 has provided important insights into the developmental origins of discrete brown fat depots, the next important step will be to determine the origin(s) of diffusely localized brown adipocytes in white fat depots at least in rodents. Diffuse BAT adipogenesis is more closely related to increased thermogenesis and reduced obesity.127 Enthusiasm for the promise of PRDM16 as a drug target needs to be tempered by the caveat that mice with an inactivated PRDM16 gene die at birth, suggesting that PRDM16 is a transcription factor with additional unknown functions in mammalian development. It has long been known that chronic increases in circulating catecholamines in patients with pheochromocytoma lead to large brown fat depots.169 These historical data, together with recent findings of discrete brown fat depots uncovered by PET technologies,162 should stimulate a renewed effort to find strategies to induce an increase in brown adipocytes, and to ask why the many previous studies with β3-agonists failed to significantly stimulate thermogenesis in humans. Maybe the lack of β3-adrenergic receptors in human white adipocytes is something that needs to be overcome to facilitate conversion of white to brown adipose tissue and to stimulate thermogenesis. It is also important to evaluate the effects of BMP7 on stimulating the enhanced expression of brown adipocytes, as recently shown by Tseng et al.170 The discovery of previously uncovered brown adipose tissue/cells in adult humans and its potential physiologic significance in cold- and dietary-induced thermogenesis should help in revamping our effort to target the molecular development of brown adipogenesis for the treatment of obesity.170a–170c
Integrative Biology of the Adipose Tissue
Appreciation of the importance of the vasculature to the proper functioning of the adipose tissue is increasing. Nutrients such as glucose, fatty acids, and proteins are supplied from the vasculature and are critical to the growth and maintenance of adipose tissue. Recent studies have focused on the supply of oxygen for oxidative metabolism in adipocytes. Current data suggest that the delivery of oxygen may be limiting in adipose tissue of obese mice. The consequences of the hypoxia are unclear, but in vitro data52 support the in vivo data,56 suggesting that hypoxia leads to chemotaxis of macrophages and inflammation. These findings were recapitulated in human adipose tissue.59 Under these circumstances, hypoxia should turn on the transcription factor HIF-1, leading to angiogenesis and a reversal of the hypoxia. This does not appear to be the case in mature adipose tissue,171,172 in which vascular endothelial growth factor (VEGF), a primary downstream transcriptional target of the HIF-1 pO2 sensing system, is not activated. Anatomically, good evidence suggests that the new blood vessels sprout from existing endothelial cells,173 and this has been co-opted in the development of ex vivo assays to clearly demonstrate that human adipose tissue is capable of sprouting/angiogenesis.174 Why the angiogenic signals are not increased when pO2 is decreased is a paradox that needs to be investigated.
In murine adipose tissue development, angiogenesis, adipogenesis, and the stromal cells interact in a way that is coordinated175,176 and relies on VEGF.177 This is different from the situation in mature hypoxic adipose tissue, highlighting the differences in mechanisms and the relative importance of growth factors in growth and development as opposed to the events that occur in mature adipose tissue. Adiponectin, secreted by small but not hypertrophic inflammatory adipocytes, stimulates angiogenesis, highlighting the interplay of adipokines, which we typically consider metabolic hormones working in concert with the growth factors classically implicated in angiogenesis.178
Endocrine Signals
Glucocorticoids: Glucocorticoid treatment of laboratory animals results in the development of obesity. Animal models of obesity invariably have increased levels of corticosterone. Adrenalectomy results in the reversal or prevention of obesity. Activation of the glucocorticoid receptor results in differentiation of preadipocyte precursors133–135 and lipid storage in adipocytes. In humans, overproduction of cortisol (Cushing’s syndrome) results in a phenotype of central (abdominal) obesity, hypertension, and diabetes. Of the many investigations into the role of adrenal glucocorticoids in human obesity, most show normal urinary free cortisol, normal circadian variation in cortisol values, and normal plasma cortisol values, although metabolic clearance rate and production are increased.179 The enzyme 11HSD-1 is present in human adipose tissue and converts inactive cortisone into active cortisol.180 It is important to note that there is a strong positive correlation between adipocyte size and the activity of 11HSD-1 in converting cortisone into cortisol. This fits with the idea that adipocyte hypertrophy generates signals, like cortisol, to recruit new adipocytes.
The most compelling data for an association between human obesity and cortisol come from studies that classify obese women into central and peripheral types of obesity. By stratifying volunteers on this basis, Marin and coworkers181 demonstrated an increase in urinary and serum cortisol as the waist-to-hip ratio (WHR) increased. Serum cortisol responses to stress were greater in women with high WHR, suggesting a role of response to environmental stressors as a potential factor in abdominal obesity.181,182 Other evidence in humans suggests that cortisol values within normal concentrations are sometimes related to fat patterning, possibly via increased sensitivity to exogenous stressors. Genetic factors also may determine the susceptibility of adipose tissue to these exogenous stressors.183
Growth Hormone/IGF-1: Growth hormone (GH) is a potent lipolytic hormone.184 GH receptors activate classic cAMP lipolytic systems in adipose tissue. In addition to stimulating lipolysis, GH increases IGF-1 production in adipose tissue.185 IGF-1 potently activates preadipocyte proliferation and differentiation of precursors into mature lipid-storing adipocytes.131 Deficiency of GH is associated with central obesity, and replacement of GH reduces visceral adiposity.186 Despite early reports of the therapeutic efficacy of GH in men with central obesity,187 other studies do not show this effect and in fact report an increase in body fat after GH withdrawal compatible with the effects of IGF-1 in promoting adipoctye differentiation.171 GH treatment in the absence of clear-cut GH deficiency cannot be recommended, as the side effect profile includes edema, carpal tunnel syndrome, glucose intolerance, and many others. GH-like peptides that increase lipolysis without upregulation of IGF-1 synthesis have been discovered188 and may be beneficial without the adverse effects of GH.
Estrogen in Adipose Tissue: Men and women have a different distribution of body fat; a gluteal-femoral pattern is seen in women and an abdominal pattern in men. This sexual dimorphism is thought to be due to differences in the sex steroids estrogen and testosterone. Lipoprotein lipase (LPL) activity, indicative of lipid storage, is increased in the gluteal-femoral region of women as compared with men. After menopause, LPL activity is equivalent across all adipose tissue depots, suggesting that estrogen upregulates LPL in a depot-specific fashion.189 In support of this concept, treatment of postmenopausal women with estradiol increased LPL activity in the gluteal-femoral region,190 and this was reversed by the addition of a progestin.191 In vitro in human abdominal subcutaneous adipocytes, low-dose estradiol increased LPL protein and higher-dose estradiol decreased LPL.192 These dose-dependent effects of estradiol in decreasing LPL were also observed in a cross-sectional study193 and after local transdermal application of estradiol.194 In addition to systemic estradiol, the stromal-vascular fraction of adipose tissue is able to convert estrogenic precursors to estrogen vis-à-vis the enzyme aromatase. In men, testosterone, but not the nonaromatizable steroid dihydrotestosterone, increases adipose tissue lipid turnover, suggesting that testosterone acts in adipose tissue via local conversion of testosterone into estrogen by aromatase.195,196 In vitro, estradiol increases the proliferation of stromal-vascular cell cultures of both human197 and rodent preadipocytes.198
Several investigators199–202 have demonstrated estradiol binding and estrogen receptors mRNA in adipose tissue extracts. After cloning of the ER gene, both mRNA and protein for estrogen receptors were subsequently described in adipose tissue.201–203 In human adipose tissue, estrogen receptors was higher in abdominal compared with gluteal femoral adipose tissue, and regional differences in adipose tissue expression of estrogen receptors were described by Pedersen et al.204 However, not all of the effects of estrogen occur in the adipose tissue. By administering estrogen directly into the brain, one can reverse the gain in visceral fat seen with ovariectomy, suggesting that much of the fat patterning attributed to peripheral effects might actually be mediated through hypothalamic signaling.205
Neural Signals to the Adipose Tissue
As was discussed earlier, human adipose tissue can be divided into two major compartments—subcutaneous and visceral (approximately 80% and 10%, respectively)—whereas other depots such as retroperitoneal, perirenal, and orbital fat account for the remainder.206 The two major compartments have clearly different rates of lipid synthesis and lipolysis, probably owing to differences in hormonal exposure and innervation. The brain needs to transmit messages to different parts of the body in a selective manner. For this reason, the sympathetic nervous system innervates different adipose tissues in different ways, influencing not only regional blood flow but also functions such as lipolysis and lipid synthesis. By viral injection into fat pads of Siberian hamsters, Youngstown and Bartness showed the presence of sympathetic projections from central sympathetic ganglia, which was confirmed by injection of fluorescent anterograde tract tracers into the sympathetic chain ganglia207 and viral tracing studies.208–210 In addition, denervated fat depots weigh 10% more than the intact contralateral depot, implying impaired lipid mobilization in fat pads deprived of their innervation.211 From such studies, it was hypothesized that catecholamines not only increase lipolysis but also inhibit adipose tissue hyperplasia from preadipocytes, and this is supported by in vitro data.208,212,213
Regulation of Lipolysis (Fig. 11-9)
Adipose tissue lipolysis (i.e., the catabolic process that leads to the breakdown of triglycerides into fatty acids and glycerol) is often regarded as a simple and well-understood metabolic pathway (see Fig. 11-9). However, we continue to discover new layers of complexity in the system. Hormone-sensitive lipase (HSL), the rate-limiting enzyme of intracellular triglyceride hydrolysis, is a major determinant of fatty acid mobilization in adipose tissue. Translocation of hormone-sensitive lipase to the lipid droplet seems to be an important step during lipolytic activation. Reorganization of the lipid droplet coating by perilipin may facilitate access to the enzyme. In humans, alterations of hormone-sensitive lipase expression are associated with changes in lipolysis in various physiologic and pathologic states. The major hormones controlling the lipolytic process are catecholamines (stimulation of lipolysis) and insulin (inhibition of lipolysis). It is well accepted that the adrenergic system is the major regulator of lipolysis via a cAMP pathway. In turn, cAMP increases the activity of protein kinase A, which phosphorylates both the hormone-sensitive lipase and perilipin. As a counteracting hormone, insulin binds to its receptor and activates the various elements of the insulin signaling cascade through stimulation of type III cyclic guanosine monophosphate (cGMP)-inhibited phosphodiesterase (PDE3B), thereby decreasing cAMP and suppressing lipolysis.214 The antilipolytic effect of insulin is reduced in the insulin-resistant state.215 Progress on the hormonal regulation and molecular mechanisms of β-lipolytic and α2-antilipolytic adrenergic control of lipolysis has improved our understanding of the relative contributions of the two types of receptors.216 Genetic studies show that polymorphisms in genes coding for different β-adrenoceptor subtypes and hormone-sensitive lipase may participate in the polygenic background of obesity.217
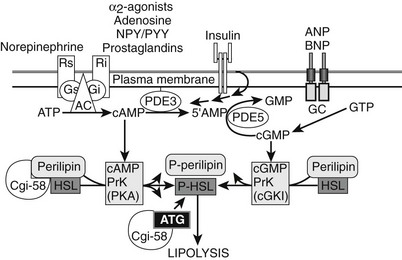
FIGURE 11-9 Regulators of human adipocyte lipolysis. Hormone-sensitive lipase and perilipin are rate-limiting steps in the regulation of adipocyte lipolysis. Both enzymes need to be phosphorylated to be active and allow the breakdown of triglycerides into glycerol and free fatty acid. Part of this process involves the release of CGi-58 when perilipin is phosphorylated; it then can bind and activate ATGL, the specific triglyceride hydrolase. The adrenergic systems (β receptors and α2 receptors) are major regulators of lipolysis via cyclic AMP pathways. β Receptors stimulate lipolysis, whereas α2 receptors inhibit lipolysis. There are other novel Gi-coupled G protein–coupled receptors (see text for details). Cyclic AMP increases the activity of protein kinase A, which in turn phosphorylates the hormone-sensitive lipase and perilipin. Insulin inhibits lipolysis via inhibition of phosphodiesterase (PDE), thereby decreasing cAMP and lipolysis. A novel lipolytic system using natriuretic peptides stimulates lipolysis through a cGMP-dependent pathway, which is not influenced or suppressed by insulin action. In adipose tissue, cGMP is degraded by PDE-5.344 AC, adenylate cyclase; AMP, adenosine monophosphate; ANP, atrial natriuretic protein; BNP, brain natriuretic protein; cAMP, cyclic AMP; cGMP, cyclic guanine monophosphate; GC, guanylate cyclase; Gi, inhibitory G protein; Gs, stimulatory G protein; NPY/PYY, neuropeptide Y/peptide YY; PDE, phosphodiesterase; Ri, inhibitory receptor; Rs, stimulating receptor.
More recently, a novel lipolytic system has been characterized in human fat cells. Natriuretic peptides stimulate lipolysis through a cGMP-dependent pathway, which is not influenced or suppressed by insulin action,218–220 along with catecholamine stimulation of cAMP natriuretic peptide activation of the cGMP system, which plays an important role in exercise-activated lipolysis.221
It once was thought that hormone-sensitive lipase represented the first step in the lipolytic cascade. The recent discovery of adipose triglyceride lipase (ATGL) changed that view, and we now know that ATGL is a key molecule for the first step in triglyceride hydrolysis, TAG hydrolase activity.222 ATGL and its coactivator protein CGi-58/ABHD5 are required for full activation of the lipolytic cascade (see Fig. 11-9), with HSL acting to hydrolyze diacyglycerol (DAGs) into monoacylglycerol (MAGs) and with monoglyceride lipase (MGL) finishing the cascade. New data show that this sequential model may be too simplified. When perilipin-A is phosphorylated by PKA, CGi-58 is released and assists in the recruitment of ATGL to the lipid droplet.223 Taken together, the discovery of ATGL, along with the discovery of the natriuretic peptide–driven cGMP lipolytic pathway,220 has dramatically changed our view of the regulation of lipolysis. We now know that translocation of HSL to the lipid droplet is not the only regulatory step involved in the activation of lipolysis; a network of controlled signaling includes interactions between the lipases and the PAT proteins. This is a hot area for research, and it is hoped that a better understanding of the interactions between PAT proteins, lipases, and their signaling systems will lead to new therapies to prevent the dysregulated lipolysis observed in the hypertrophic adipocyte.
Adipocyte as an Endocrine Organ
The study of the biology of adipose tissue, including the mechanisms of adipogenesis, has enjoyed an explosive growth over the past 15 years. Unarguably, the trigger for this renewed interest came from the cloning of the ob (obese) gene and the discovery of leptin in 1994.1 This seminal discovery initiated a period of intense research for uncovering the endocrine and paracrine roles of the adipose tissue and its role in the regulation of energy balance and the development of obesity and related diseases. The steps that led to the discovery of leptin were summarized in the original description of the cloning of the leptin gene.1 In brief, the original notion of a homeostatic regulation of energy balance (and therefore adipose mass) dates back to Lavoisier and Laplace.224–226 The key role of the brain in this regulation was determined later from clinical observations and was confirmed by stereotaxic lesions of different regions of the brain.227 It therefore was postulated that energy balance was regulated by a feedback loop in which body energy stores were sensed by the hypothalamus, which in turn sent signals to control both food intake and energy expenditure. However, the nature of the signal inputs to the hypothalamus was not clear. Jean Mayer proposed a glucostatic theory, in which blood glucose was the sensed signal.228 Kennedy postulated the presence of a fat metabolism factor and proposed what is now accepted as the lipostatic theory.229 In this model, a signal coming from fat stores in the adipose tissue is read by the central nervous system to regulate feeding and energy homeostasis. Subsequent parabiosis studies performed by Hervey confirmed that bloodborne signals coming from the adipose tissue regulated food intake and body weight.230 Not too long after, Coleman performed the seminal parabiosis studies using single-gene models of obesity and diabetes (ob/ob and db/db mice) and concluded that the product of the ob gene was secreted by the adipose tissue, transported by the blood, and received in the hypothalamus by the receptor encoded by the db gene.231 This interaction between a factor produced by the adipose tissue and a receptor in the hypothalamus became the foundation on which Leibel and colleagues undertook the positioning cloning effort of the ob and db genes that led to the publication of the discovery of leptin in Nature in 19941 and of its receptor in Cell 1 year later.232
Since the discovery of leptin, the simple paradigm of adipose tissue as a fat storage tank has evolved into a complex paradigm. First, the size of the adipose tissue is controlled by the filling of preexisting adipocytes, but this also involves finely tuned mechanisms that control differentiation and apoptosis of the tissue. Second, adipose tissue depots are multipotential secretory organs with different secretory capacities for different depots. These adipose tissues most often comprise adipocytes as well as fibroblasts and immune cells such as macrophages and mast cells, all of which use endocrine, paracrine, and autocrine pathways to secrete multiple bioactive proteins called adipokines or adipocytokines. The adipocytes respond to various stimuli such as circulating hormones, circulating metabolites, neural input, and cellular energy signals by releasing hormones and substrates, as is shown in Fig. 11-10.2,233 The molecular revolution brought to light many adipocyte-secreted factors, some of which, such as IL-6 and leptin, are secreted into the bloodstream, whereas others, such as TNF, exert their effects in an autocrine/paracrine fashion.234 Although adipose tissue has a similar histologic appearance throughout the body, it is now obvious that fundamental regional differences can be found in the quality and the amount of secreted adipokines when these different depots are used.
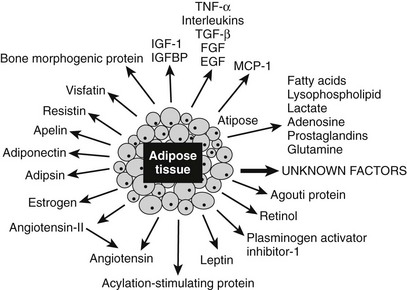
FIGURE 11-10 Proteins secreted by the adipose tissue. Adipose tissue is an endocrine gland that secretes numerous factors, many of which are implicated in affecting energy homeostasis, insulin sensitivity, and nutrient-sensing pathways. The proteins in blue are discussed in greater detail in the text. Note that the protein adipose (Adp) has not been found to be secreted.
A major emphasis in adipose tissue biology research is the understanding of the molecular mechanisms that control the secretion of adipokines by different depots and its implication in a variety of chronic diseases. These secreted proteins have been recently grouped2 into (1) molecules that regulate physiologic and pathophysiologic functions such as energy homeostasis (leptin, adiponectin, resistin, visfatin, omentin, apelin) and (2) the innate immune system (TNF, IL-6, IL-8), which involves the following:
• Vasculature (VEGF, monobutyrin, ESM-1)
• Acute-phase reactant response (α1-acid glycoprotein, SAA3, PTX-3)
• Molecules involved in lipoprotein metabolism such as LPL or components of extracellular matrix (type VI collagen)
In this chapter, we have chosen to present the current knowledge on only six of these adipokines, including leptin, adiponectin, resistin, TNF, apelin, and adipose, a new player in obesity, which does not seem to be secreted. As can be seen in Fig. 11-11, these adipokines are involved in whole body metabolism, since they act on different tissues, including brain, liver, skeletal muscle, and adipose tissue itself.
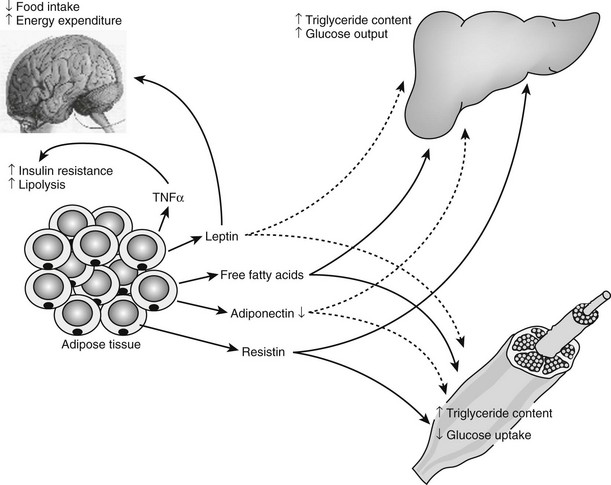
FIGURE 11-11 Central role of adipose tissue in the insulin resistance syndrome. The production by the adipocytes of substrates such as free fatty acids, hormones such as leptin, adiponectin, and resistin, and cytokines such as tumor necrosis factor (TNF) positions the adipocyte as a central mediator of the insulin resistance syndrome in obese individuals. In response to weight gain, free fatty acids, leptin, resistin, and TNF-α all are increased, whereas adiponectin concentration is decreased. These changes affect the insulin sensitivity of skeletal muscle and liver and the central nervous system control of energy expenditure and food intake. Positive feedbacks are shown in green solid lines, whereas negative feedbacks are shown in red dotted lines. (Figure adapted from S. Farmer.345)
Leptin: Leptin is a highly conserved 16 kDa hormone that is secreted principally but not exclusively by adipocytes, which act both centrally and peripherally. Plasma leptin concentrations are positively correlated with body fat mass.235 Leptin crosses the blood-brain barrier through a saturable active transport system and serves as a signal to the central nervous system after originating in the adipose tissue. Even though it was described originally as the hormone-regulating energy balance, the available data now suggest that a relative lack of leptin or resistance to its action is probably not causal in most cases of human obesity. The main biological function of leptin seems to be the maintenance of a minimum level of energy stores during periods of caloric restriction.236,237 Low leptin concentrations therefore can be seen as a starvation signal when energy stores become insufficient, commanding the body to seek food and become thrifty. As part of such a protective mechanism, leptin plays a role in reproduction, angiogenesis, bone architecture, and immune function, and it also may influence processes such as β cell insulin secretion, carbohydrate transport, and platelet aggregation.238 Low levels of circulating leptin trigger strong biological responses to protect the organism against the deleterious effects of starvation, whereas high levels of leptin (as seen in obesity) engender rather weak biological responses.236 This asymmetrical biological effect of leptin is illustrated in the upper panel of Fig. 11-12.
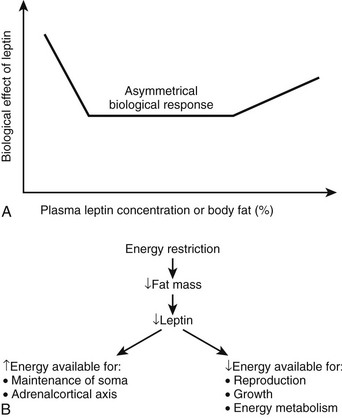
FIGURE 11-12 Leptin as the master neuroendocrine signal. As shown on the top panel (A), the biological response to changes in body energy stores and circulating leptin is asymmetrical and is much more robust when plasma leptin concentration decreases with caloric restriction and significant weight loss rather than when it increases with obesity.236 Leptin’s main function may be to provide the appropriate metabolic responses to decreased energy stores (by acting to increase feeding and by sparing energy/fat expenditure) rather than to protect the body against excess energy stores (i.e., by increasing energy/fat expenditure and decreasing food intake). The bottom panel (B) describes the role of leptin as a master regulator of neuroendocrine pathways involved in response to the effects of caloric restriction. It is probably a major signal for the antiaging effects of dietary restriction.239
Studies of caloric restriction in animals and humans provide information regarding the importance of leptin as a mediator of neuroendocrine responses. Shimokawa has reviewed the endocrine changes associated with short-term caloric deprivation in rodent models.239 Many of these alterations have been described in humans as well and include a fall in T3,240 an increase in cortisol secretion,241 and a decrease in gonadal function.237 It has long been hypothesized that the neuroendocrine system coordinates and integrates some of the antiaging actions of calorie restriction.242–245 In a 48-hour prolonged starvation study in mice, Ahima et al237 provided evidence that the reduction in leptin with starvation caused a decrease in the activity of the gonadal and thyroid axes, as well as an increase in the activity of the adrenal axis.237 The changes in activity of these axes during fasting were prevented by leptin administration, suggesting that leptin is a master regulator of the neuroendocrine system and possibly the endocrine candidate of the disposable soma theory of aging, stating that longevity requires investment in somatic maintenance by reducing the resources available for reproduction239,246 (see Fig. 11-12A).
In the obese state in which the circulating leptin concentration is already high (see Fig. 11-12), the hormone serves as a rather weak signal to prevent overconsumption of food and does not appear to be a viable treatment for obesity.247 However, if provided in sufficient amounts in obese individuals or to organisms deficient in circulating leptin, injection of the hormone can reduce body weight and fat mass by decreasing food intake and increasing energy expenditure. The mechanism by which leptin seems to exert its peripheral metabolic effects involves activating 5′-AMP–activated protein kinase (AMPK) in muscle and liver.248,249 As a consequence of AMPK activation, ATP-consuming anabolic pathways are inhibited, whereas ATP-producing catabolic pathways are activated. Activated mechanisms include glucose transport, β oxidation, glycolysis, and mitochondrial biogenesis. The relevance of leptin in normal human metabolic function is provided by leptin replacement in individuals with genetic leptin deficiency,250 deficiency due to weight loss,251 or lipodystrophy.252 The effects of recombinant leptin therapy in children with congenital leptin deficiency were investigated, and a spectacular effect on reducing food intake and body weight was observed, with almost no effect on energy expenditure and fat oxidation.250 In adult patients with a similar congenital deficiency, leptin replacement not only affected food intake but also prevented the drop in energy expenditure that is usually observed with weight loss and increased 24-hour fat oxidation by more than three times.253 It is interesting to note that weight loss seems to be amplified in a synergetic manner when leptin is administered in conjunction with Pramlintide, an analogue of amylin.254,254a
Human immunodeficiency virus (HIV) and HIV therapy are associated with alterations in body composition, including lipoatrophy, lipid storage as abdominal adipose tissue, and buffalo hump.255 The constellation of metabolic findings in these patients is consistent with the ectopic fat storage hypothesis, as presented earlier. Several studies suggest that activation and rebound of the immune system during antiretroviral therapy are associated with lipodystrophy.256,257 This is analogous to defects seen in congenital partial lipodystrophy, which are due to mutations in the Lamin A/C gene.258–260 Increased apoptosis in adipose tissue from patients with HIV lipodystrophy is also evident.261 It is interesting to note that patients with congenital lipodystrophy and patients with acquired immunodeficiency syndrome (AIDS) and lipoatrophy induced by antiretroviral therapy have shown dramatic improvement in their ectopic fat storage syndrome following leptin replacement therapy.262,263
Adiponectin: Adiponectin (also known as AdipoQ, Acrp30, APM1, and GBP28) is expressed exclusively in adipose tissue264 and circulates in human serum at very high concentrations of 5 to 30 μM.265 Adiponectin, a 30 kDa protein consisting of an N-terminal collagenous domain and a C-terminal globular domain, was discovered almost simultaneously by four separate groups that used different methods.264,266–268 Adiponectin exists in the blood as a monomer, trimer, and hexamer and in very high molecular weight forms.269 This protein is closely related to complement factor Cq1,266 but the folded crystal structure and gene organization show close similarity to TNF.270,271 Arguably the most interesting observation is that unlike other adipocytokines whose expression increases with increasing fat mass, adiponectin is inversely related to fat mass.272–274 How increased mass of the tissue from which the gene is expressed reduces expression and/or secretion of the protein remains an unanswered question. Consistent with the observation that lipodystrophic patients have very low concentrations of adiponectin275 and increased ectopic fat, a reduction in circulating adiponectin (as well as leptin) may facilitate the ectopic storage of fat.
Adiponectin is clearly an insulin-sensitizing hormone, and administration of recombinant adiponectin in rodents increases glucose uptake and fat oxidation in muscle, reduces fatty acid uptake and hepatic glucose production in liver, and improves whole body insulin resistance. Two receptors for adiponectin have been discovered, with the first isoform (AdipoR1) most often expressed in skeletal muscle and the second (AdipoR2) most often in liver.276 Unlike in mice, gene expression profiling in humans indicates that both isoforms are highly expressed in skeletal muscle.277 It is interesting to note that in individuals with normal glucose tolerance, muscle expression levels of AdipoR1 and AdipoR2 were lower in subjects with a family history of type 2 diabetes than in those without family history, and the expression levels of both receptors correlated positively with insulin sensitivity.277 These data indicate that both isoforms of the receptor may play a role in the insulin-sensitizing effect of adiponectin, probably via stimulation of mitochondrial biogenesis, mitochondrial function, and fat oxidation.278
Even if the signaling cascade for adiponectin is unclear, growing evidence suggests that adiponectin may activate AMPK, the putative master metabolic regulator described earlier. Thus, excitement surrounds the potential for adiponectin (or mimetics of adiponectin) to represent pharmacologic agents for patients suffering from insulin resistance and type 2 diabetes. As for leptin, many functions have already been attributed to adiponectin: it has been linked to cardiovascular disease and to endothelial and immune dysfunction.279 However, we focus here primarily on the role of adiponectin as an insulin-sensitizing hormone.
Adiponectin acts peripherally to improve insulin sensitivity in rodents,280–283 although the proposed mechanisms differ. Combs et al284 found that increasing circulating adiponectin concentrations in mice during a euglycemic clamp increased the rate of glucose infusion by 73%. Rates of glucose uptake, glycolysis, and glycogen synthesis were unchanged, but the rate of glucose production was suppressed by 65%. Chronic infusion of a proteolytic product of adiponectin prevents weight gain in mice fed a high-fat diet, whereas mice infused with full-length adiponectin or saline gained weight.280 The prevention of weight gain was associated with increased fat oxidation. The same investigators went on to show that adiponectin induces fatty acid oxidation in muscle in vitro and reduces free fatty acid flux following a high-fat meal or intralipid infusion in vivo.280 Similarly, Yamauchi et al.281 observed that adiponectin treatment during high-fat feeding prevents adipose tissue deposition in wild-type mice by increasing energy expenditure and decreasing ectopic fat deposition.281 To determine the cellular mechanisms underlying this observation, investigators measured the expression of genes involved in fatty acid transport, oxidation, and energy dissipation in both muscle and liver. Adiponectin treatment increased the mRNA of genes involved in fatty acid uptake and oxidation (specifically, CD36, acyl-CoA oxidase, and uncoupling protein-2) in muscle and decreased the expression of genes involved in fatty acid transport in the liver, resulting in decreased storage of triglycerides in nonadipose tissues and indirectly improved insulin sensitivity. Taken together, the results support the theory that adiponectin is a regulator of insulin sensitivity through the reduction of ectopic fat deposition.
Similar to leptin, adiponectin was shown to directly activate adenosine 5′-monophosphate–activated protein kinase (AMPK) in muscle, thereby increasing the phosphorylation of acetyl–coenzyme A carboxylase (ACC).283 In turn, malonyl CoA content is reduced, increasing carnitine palmitoyltransferase 1 (CPT-1) activity and stimulating fat oxidation. In the liver, AMPK stimulates fatty acid oxidation and ketogenesis and inhibits cholesterol synthesis, lipogenesis, and triglyceride synthesis, whereas it modulates insulin secretion in pancreatic β cells (reviewed by Winder285).
Human studies in Pima Indians and Japanese demonstrated an association between low plasma adiponectin concentrations and obesity or type 2 diabetes.272,274 Furthermore, positive correlations between plasma adiponectin concentrations and insulin sensitivity have been reported in several studies.273,274,286 More important is the fact that low adiponectin concentrations were predictive of type 2 diabetes incidence rates over 5-year follow-up in Pima Indians.287 Other indicators that low levels of adiponectin may be involved in the development of insulin resistance are derived from intervention studies showing that adiponectin is decreased by behaviors leading to obesity and diabetes281 and is increased in situations of reduced body fat or increased insulin sensitivity.288,289
At present, adiponectin remains a validated target for the potential treatment of patients with insulin resistance and type 2 diabetes. However, many questions regarding adiponectin remain to be resolved before the use of adiponectin or mimetics as therapeutic agents is considered. These include the following: (1) Which circulating form of adiponectin is biologically active? (2) What are the posttranslational mechanisms that regulate adiponectin concentration/secretion? (3) What are the exact sites of action of adiponectin in central and peripheral tissues? and (4) What is the signaling cascade of adiponectin after it binds to its receptor? Kim et al.290 in Scherer’s laboratory recently took a big step toward a better understanding of the function of adiponectin by creating mice that lacked leptin while overexpressing adiponectin. Investigators were surprised to note that these mice had normalized glucose and insulin concentrations, dramatically improved glucose tolerance, and positively affected serum triglyceride levels despite morbid obesity. The authors propose that adiponectin acts as a peripheral starvation signal, promoting the storage of triglycerides preferentially in adipose tissue and thereby protecting the animals from ectopic fat depots.290
Resistin: Resistin is a putative adipocyte–derived insulin resistance hormone that was identified during an in vitro screen for genes upregulated during adipocyte differentiation and downregulated by peroxisome-proliferator–activated receptor (PPAR-γ) agonists.291 In mice, serum resistin and resistin mRNA expression in adipose tissue are increased by a high-fat diet and are decreased after rosiglitazone treatment.291 It is important to note that blocking resistin (by antibodies) increases glucose uptake in fat cells and increases insulin sensitivity. In vitro, resistin decreases glucose uptake in skeletal muscle cells but does not affect the classic insulin signaling pathways.292 As would be expected from these results, intraperitoneal administration of resistin increased blood glucose following a glucose tolerance test in mice.291 Taken together, these results led to the hypothesis that resistin promotes insulin resistance. At about the same time, two other groups independently identified resistin.293,294 Kim et al.293 observed that resistin inhibited adipocyte differentiation in 3T3-L1 cells, suggesting that resistin may promote insulin resistance by increasing storage of triglycerides in muscle and liver instead of adipose tissue. Resistin-deficient mice have low blood glucose after a fast, decreased hepatic glucose production, and less hyperglycemia when obese, suggesting a key role in the regulation of hepatic glucose production.295 Ahima and Lazar have recently reviewed the role of adipokines, including resistin, in the control of energy and carbohydrate metabolism.296
In humans, the role of resistin in regulating insulin sensitivity is unclear. In one study, serum resistin was related to fat mass in young, healthy subjects and was significantly higher in women than in men,297 but it was not related to body mass index (BMI), % body fat, or insulin sensitivity in other studies.298,299 Resistin mRNA expression was shown to be higher in morbidly obese subjects as compared with lean control subjects300 and higher in individuals with a promoter mutation and high levels of oxidative stress.301 However, in that same study, serum resistin was not different between nonobese, obese, and obese diabetic groups. Recent data in humans indicate that resistin is derived mainly from macrophages.302 Given the emerging interrelationship between inflammation and metabolic disease, hyperresistinemia may serve as a biomarker and/or a mediator of metabolic and inflammatory disease in humans.
TNF-α: TNF-α is a cytokine that is produced by macrophages, monocytes, endothelial cells, neutrophils, smooth muscle cells, activated lymphocytes, astrocytes, and adipocytes.303 TNF-α has a variety of functions, such as mediating expression of genes for growth factors, cytokines, transcription factors, and receptors. TNF-α is synthesized as a 26 kDa transmembrane protein found on the surface or processed to release the 17 kDa soluble form.304 Some adipocytokines are secreted and transported into the blood (e.g., leptin, PAI-1, IL-6), whereas TNF-α is secreted and probably acts locally in an autocrine-paracrine fashion.234
Initial reports implicated TNF-α as an adipocyte-derived cytokine that was able to block adipocyte differentiation305,306 and was upregulated in human obesity/insulin resistance.307,308 As a pluripotent cytokine, the mechanisms by which TNF-α might decrease insulin action and affect adipocyte functioning are numerous. As one example, TNF-α suppresses adipocyte-specific genes with NF-κB being an obligatory signaling intermediate48 and decreases the expression of transcription factors necessary for adipocyte differentiation.305 In an autocrine-paracrine fashion, TNF-α blocks further energy accumulation in adipocytes through deactivation of the insulin-signaling pathway (i.e., insulin resistance),48,309 increased lipolysis, and decreased lipid uptake.310 TNF-α may be a homeostatic mechanism that may prevent further fat deposition by regulating LPL activity and leptin production.311
TNF-α has been termed an adipostat because its adipose tissue expression is, like that of leptin, more or less proportional to the degree of adiposity. TNF-α has also been proposed to link obesity with insulin resistance, with serine phosphorylation of the insulin receptor substrate-1 being a prominent mechanism for TNF-α—induced insulin resistance.312 TNF-α increases 11HSD1 mRNA and enzyme activity and therefore local cortisol production in human adipocytes,313 thus potentially linking TNF-α to visceral adiposity. The mechanism by which transcription is upregulated during energy excess is not entirely clear. Insulin upregulates TNF-α mRNA, and TZDs appear to downregulate TNF-α,314 whereas environmental toxins such as TCCD upregulate TNF-α.315
Clinically, higher plasma levels of TNF-α are also associated with insulin resistance, higher BMI, higher fasting glucose levels, and higher low-density lipoprotein cholesterol (LDL-C) levels.316 With the use of confirmatory factor analysis and structural equation modeling, it was shown that obesity, dyslipidemia, and TNF-α were the principal explanatory variables for the various components of the metabolic syndrome.317 TNF-α has also been implicated in HIV-associated lipodystrophy.318
Apelin: Apelin is a novel bioactive peptide first identified in 1998 as the endogenous ligand of the orphan G protein–coupled receptor APJ.319 A 77 amino acid precursor can be cleaved into a 55 amino acid fragment and then into shorter less characterized forms. The physiologically active form of apelin is thought to be Apelin-36, although shorter C-terminal sequences also elicit biological activity.319 It was only 10 years later that a putative role for apelin in the origin of obesity was described. Rayalam et al.320 first described that apelin’s major role was to promote angiogenesis in adipose tissue. At the same time, Kunduzova et al.321 proposed that the angiogenic response to apelin in adipose tissue—endothelial cell migration and proliferation, and capillary formation—was dose dependent.321 Furthermore, hypoxia upregulates the expression of apelin in adipocytes, thus confirming the fact that the apelin/APJ signaling pathway plays a critical role in the development of the functional vascular network in adipose tissue.321 The adipokine apelin is upregulated not only by hypoxia and insulin but also by the transcriptional coactivator PGC-1α in human white adipocytes.322 Finally, and it is important to note, the same laboratory presented a convincing argument that acute intravenous injection of apelin had a powerful effect on lowering plasma glucose by enhancing glucose utilization in skeletal muscle and adipose tissue.323 Therefore, apelin probably will soon be considered an important target for the treatment of obesity-related insulin resistance.
Adipose (Adp): Fat cell lipid accumulation and formation of new fat cells are the processes controlling adipose mass expansion. Adipose (Adp) is an evolutionarily conserved gene isolated from naturally occurring obese flies homozygous for an adp mutation. In 2007, Suh et al.324 showed that the antiobesity function of Adp was conserved from worms to mammals. Further, Adp appears to inhibit fat formation in a dosage-sensitive manner. In vitro studies in 3T3-L1 cells show that this gene has a potent inhibitory effect on lipid accumulation. In mice, this gene is found in adipose tissue as well as in several other tissues. Adp heterozygous mutant mice are obese and insulin resistant, as are mice that express a dominant negative form of Adp in fat cells. Conversely, Adp transgenic mice are lean and display improved metabolic profiles. Adp may elicit these antiadipogenic functions by regulating chromatin dynamics and gene transcription, as it binds to both histones and HDAC3 and inhibits PPAR-γ activity. Thus Adp appears to be involved in an ancient pathway that regulates fat accumulation.
The Adipocyte as a Target for the Treatment of Obesity and Type 2 Diabetes
The brain serves as the main therapeutic target for the treatment of obesity. Given the central role of the adipocyte in the regulation of body weight and energy metabolism, the adipocyte should not be discarded as a target. Classic adipocyte biology, emphasizing the adrenergic signaling systems, provided the rationale for the development of β3-adrenoreceptor agonists as a means to increase energy expenditure in muscle and promote lipolysis in adipose tissue. These efforts have been hampered by the failure of the drug discovery systems to identify “clean” β3-selective agonists.325 Alternate lipolytic systems such as activation of the growth hormone receptor, blockade of the antilipolytic α2-adrenergic receptor, or activation of the recently discovered natriuretic peptide signaling pathway may provide alternate strategies for increasing adipose tissue lipolysis. Increasing lipolysis and lipid delivery to peripheral tissue will produce weight loss only in the presence of increased energy expenditure or fat oxidation in liver and skeletal muscle. The concern associated with this approach is whether the increased lipid supply to liver and skeletal muscle will produce or exacerbate ectopic fat and insulin resistance.
Studies suggest that angiogenesis might precede and drive adipogenesis.326 This is logical that adipose tissue might need nutrients and oxygen to develop properly. However, the opposite concept, namely that antiangiogenic agents might prevent weight gain or result in weight loss, has been demonstrated in animals326 and, along with targeting adipocytes with a lytic peptide,327 holds promise as a way to modulate adipose tissue mass and function.328
The secretion of potent endocrine hormones from adipose tissue is another approach to treat insulin resistance or obesity. As an example, antidiabetic thiazolidenediones upregulate the expression of the insulin-sensitizing hormone adiponectin and increase blood concentrations up to threefold.329 Given that body weight is regulated by leptin-dependent and leptin-independent signals, and adipose tissue communicates with the brain to regulate food intake, additional therapeutic targets and therapeutic opportunities are likely.
Exogenous cortisol administration or overproduction of cortisol in conditions such as Cushing’s disease increases the accumulation of lipid in visceral depots.330,331 The local production of cortisol within adipose tissue by conversion of cortisone to bioactive cortisol by the enzyme 11beta HSD-1 also increases the accumulation of lipid in visceral depots.332–334 Acting through both adipogenic and lipogenic pathways, blockade of the local production of cortisol is likely to reduce visceral adipose tissue mass; therapeutic agents are currently in preclinical studies.
β3-Receptor agonists not only increase energy expenditure in rodents, but also increase the number of brown adipocytes.335,336 It has been suggested that this occurs as a result of transdifferentiation of lipid-storing white adipocytes into energy-consuming brown adipocytes. The hallmark of the brown adipocyte is the expression of the thermogenic uncoupling protein UCP-1. In rodents, the conversion of WAT into BAT is under genetic control, and the resulting weight loss improves the features of the metabolic syndrome. Overexpression of the transcriptional factor enhancer PGC-1 in human adipocytes in vitro also increases UCP-1 mRNA and protein and serves as an example of how this might also occur in humans in vivo.153 Increased energy expenditure and fat oxidation would result in a decrease in body weight, although the potential mechanisms remain elusive.337,338 Recent findings of discrete brown fat depots uncovered by PET technologies162,170a–170c should stimulate a renewed effort to find strategies to induce a greater number of brown adipocytes.
Last, as discussed above, once precursor cells are recruited to differentiate into white adipocytes, they are conceptually permanent. Recent studies in vivo in humans suggest that adipocytes are constantly being formed and undergo apoptosis.101,109 These high turnover rates for adipose tissue suggest that a reduction in adipocyte recruitment and/or an increase in adipocyte apoptosis might lead to a reduction in adipocyte mass. As noted for the lipolytic pathways, if the excess energy is not completely oxidized, then a possible outcome might be accumulation of lipid in skeletal muscle and liver, as occurs in lipodystrophy syndromes. This approach would make sense in the setting of weight loss achieved by other means as a way to reduce the number of lipid-storing small adipocytes.
Another approach to reversing excess lipid supply to the liver and skeletal muscle is to modulate lipolysis. Lipolysis is disordered in obesity and in type 2 diabetes, where insulin fails to fully suppress lipolysis. Decreasing lipolysis to mimic the normal decrease in FFA that occurs with daytime meals might improve insulin action. Indeed, reducing lipolysis for only 7 days improved insulin action in vivo.88,339 Preserving the increase in lipolysis during sleep and exercise might be necessary for normalizing the meal-related and circadian pattern of lipolysis.
In addition to exercise, which improves blood flow and insulin sensitivity in adipose tissue, it might be possible to pharmacologically manipulate lipolysis. Nicotinic acid therapy is a well-established treatment for hypertriglyceridemia and low high-density lipoprotein (HDL) cholesterol, and the recent discovery of a nicotinic acid receptor (HM74) has opened the door for the development of small molecule inhibitors of lipolysis.340 Other previously orphan G protein–coupled receptors such as the antilipolytic GPR 43 are ripe as targets for improving insulin sensitivity via suppression of lipolysis.341 GPR 43 belongs to a subfamily of GPRs that include GPR 40 and GPR 41; all are fatty acid receptors. Given the modulation of lipolysis across the day, the rational design of these drugs should consider dosing and pharmacokinetics in an attempt to mimic the normal variation in free fatty acids.
References
1. Zhang, Y, Proenca, R, Maffei, M, et al. Positional cloning of the mouse obese gene and its human homologue [published erratum appears in Nature 374:479 1995 Mar 30] [see comments]. Nature. 1994;372:425–432.
2. Rajala, MW, Scherer, PE. Minireview: The adipocyte-at the crossroads of energy homeostasis, inflammation, and atherosclerosis. Endocrinology. 2003;144:3765–3773.
3. Harris, MI, Flegal, KM, Cowie, CC, et al. Prevalence of diabetes, impaired fasting glucose, and impaired glucose tolerance in U.S. adults. The Third National Health and Nutrition Examination Survey, 1988–1994 [see comments]. Diabetes Care. 1998;21:518–524.
4. Knowler, WC, Pettitt, DJ, Savage, PJ, et al. Diabetes incidence in Pima Indians: contributions of obesity and parental diabetes. Am J Epidemiol. 1981;113:144–156.
5. Olefsky, JM. Lilly lecture 1980. Insulin resistance and insulin action. An in vitro and in vivo perspective. Diabetes. 1981;230:148–162.
6. Reaven, GM. Banting lecture 1988. Role of insulin resistance in human disease. Diabetes. 1988;237:1595–1607.
7. Martin, BC, Warram, JH, Krolewski, AS, et al. Role of glucose and insulin resistance in development of type 2 diabetes mellitus: results of a 25-year follow-up study [see comments]. Lancet. 1992;340:925–929.
8. Lillioja, S, Mott, DM, Spraul, M, et al. Insulin resistance and insulin secretory dysfunction as precursors of non-insulin-dependent diabetes mellitus. Prospective studies of Pima Indians. N Engl J Med. 1993;329:1988–1992.
9. Boden, G, Chen, X, Ruiz, J, et al. Mechanisms of fatty acid-induced inhibition of glucose uptake. J Clin Invest. 1994;693:2438–2446.
10. Kelley, DE, Mokan, M, Simoneau, JA, et al. Interaction between glucose and free fatty acid metabolism in human skeletal muscle. J Clin Invest. 1993;192:91–98.
11. Roden, M, Price, TB, Perseghin, G, et al. Mechanism of free fatty acid-induced insulin resistance in humans. J Clin Invest. 1996;1297:2859–2865.
12. Boden, G, Chen, X. Effects of fat on glucose uptake and utilization in patients with non-insulin-dependent diabetes. J Clin Invest. 1995;396:1261–1268.
13. Randle, PJ, Garland, PB, Hales, CN, et al. The glucose fatty acid cycle: its role in insulin sensitivity and metabolic disturbances of diabetes mellitus. Lancet. 1963;i:7285–7289.
14. Randle, PJ, Garland, PB, Newsholme, EA, et al. The glucose fatty acid cycle in obesity and maturity onset diabetes mellitus. Ann N Y Acad Sci. 1965;1131:324–333.
15. Wolfe, RR. Metabolic interactions between glucose and fatty acids in humans. Am J Clin Nutr. 1998;3 Suppl 67:519S–526S.
16. Baba, H, Zhang, XJ, Wolfe, RR. Glycerol gluconeogenesis in fasting humans. Nutrition. 1995;11(2):149–153.
17. Kelley, DE, Goodpaster, B, Wing, RR, et al. Skeletal muscle fatty acid metabolism in association with insulin resistance, obesity, and weight loss. Am J Physiol. 1999;6 Pt 1277:E1130–1141.
18. Kelley, DE, Mandarino, LJ. Fuel selection in human skeletal muscle in insulin resistance: a reexamination. Diabetes. 2000;549:677–683.
19. Galgani, JE, Heilbronn, LK, Azuma, K, et al. Metabolic flexibility in response to glucose is not impaired in people with type 2 diabetes after controlling for glucose disposal rate. Diabetes. 2008;57:841–845.
20. Petersen, KF, Dufour, S, Befroy, D, et al. Impaired mitochondrial activity in the insulin-resistant offspring of patients with type 2 diabetes. N Engl J Med. 2004;350:664–671.
21. Ukropcova, B, Sereda, O, de Jonge, L, et al. Family history of diabetes links impaired substrate switching and reduced mitochondrial content in skeletal muscle. Diabetes. 2007;56:720–727.
22. Petersen, KF, Befroy, D, Dufour, S, et al. Mitochondrial dysfunction in the elderly: possible role in insulin resistance. Science. 2003;300:1140–1142.
23. Shulman, GI. Cellular mechanisms of insulin resistance. J Clin Invest. 2000;106:171–176.
24. Cortright, RN, Azevedo, JL, Jr., Zhou, Q, et al. Protein kinase C modulates insulin action in human skeletal muscle. Am J Physiol Endocrinol Metab. 2000;78:E553–562.
25. Itani, SI, Zhou, Q, Pories, WJ, et al. Involvement of protein kinase C in human skeletal muscle insulin resistance and obesity. Diabetes. 2000;49:1353–1358.
26. Schmitz-Peiffer, C, Browne, CL, Oakes, ND, et al. Alterations in the expression and cellular localization of protein kinase C isozymes epsilon and theta are associated with insulin resistance in skeletal muscle of the high-fat-fed rat. Diabetes. 1997;46(2):169–178.
27. Schmitz-Peiffer, C, Oakes, ND, Browne, CL, et al. Reversal of chronic alterations of skeletal muscle protein kinase C from fat-fed rats by BRL-49653. Am J Physiol. 1997;5 Pt 1273:E915–921.
28. Koves, TR, Ussher, JR, Noland, RC, et al. Mitochondrial overload and incomplete fatty acid oxidation contribute to skeletal muscle insulin resistance. Cell Metab. 2008;7(1):45–56.
29. Kissebah, AH, Krakower, GR. Regional adiposity and morbidity. Physiol Rev. 1994;74:761–811.
30. Abate, N, Garg, A, Peshock, RM, et al. Relationships of generalized and regional adiposity to insulin sensitivity in men. J Clin Invest. 1995;96:88–98.
31. Goodpaster, BH, Thaete, FL, Simoneau, JA, et al. Subcutaneous abdominal fat and thigh muscle composition predict insulin sensitivity independently of visceral fat. Diabetes. 1997;46:1579–1585.
32. Smith, SR, Lovejoy, JC, Greenway, F, et al. Contributions of total body fat, abdominal subcutaneous adipose tissue compartments, and visceral adipose tissue to the metabolic complications of obesity. Metabolism. 2001;50:425–435.
33. Abate, N, Garg, A, Peshock, RM, et al. Relationship of generalized and regional adiposity to insulin sensitivity in men with NIDDM. Diabetes. 1996;1245:1684–1693.
34. Marcus, MA, Murphy, L, Pi-Sunyer, FX, et al. Insulin sensitivity and serum triglyceride level in obese white and black women: relationship to visceral and truncal subcutaneous fat. Metabolism. 1999;248:194–199.
35. Albu, JB, Kovera, AJ, Johnson, JA. Fat distribution and health in obesity. Ann N Y Acad Sci. 2000;904:491–501.
36. Azuma, K, Heilbronn, LK, Albu, JB, et al. Adipose tissue distribution in relation to insulin resistance in type 2 diabetes mellitus. Am J Physiol Endocrinol Metab. 2007;293:E435–442.
37. Cousin, B, Munoz, O, Andre, M, et al. A role for preadipocytes as macrophage-like cells. Faseb J. 1999;13(2):305–312.
38. Weisberg, SP, McCann, D, Desai, M, et al. Obesity is associated with macrophage accumulation in adipose tissue. J Clin Invest. 2003;112(12):1796–1808.
39. Xu, H, Barnes, GT, Yang, Q, et al. Chronic inflammation in fat plays a crucial role in the development of obesity-related insulin resistance. J Clin Invest. 2003;112(12):1821–1830.
40. Bruun, JM, Pedersen, SB, Richelsen, B. Regulation of interleukin 8 production and gene expression in human adipose tissue in vitro. J Clin Endocrinol Metab. 2001;86(3):1267–1273.
41. Bruun, JM, Pedersen, SB, Richelsen, B. Interleukin-8 production in human adipose tissue. Inhibitory effects of anti-diabetic compounds, the thiazolidinedione ciglitazone and the biguanide metformin. Horm Metab Res. 2000;32(11–12):537–541.
42. Sartipy, P, Loskutoff, DJ. Monocyte chemoattractant protein 1 in obesity and insulin resistance. Proc Natl Acad Sci U S A. 2003;100(12):7265–7270.
43. Yuan, M, Konstantopoulos, N, Lee, J, et al. Reversal of obesity- and diet-induced insulin resistance with salicylates or targeted disruption of Ikkbeta. Science. 2001;293(5535):1673–1677.
44. Lee, JY, Plakidas, A, Lee, WH, et al. Differential modulation of Toll-like receptors by fatty acids: preferential inhibition by n-3 polyunsaturated fatty acids. J Lipid Res. 2003;44(3):479–486.
45. Hundal, RS, Petersen, KF, Mayerson, AB, et al. Mechanism by which high-dose aspirin improves glucose metabolism in type 2 diabetes. J Clin Invest. 2002;109(10):1321–1326.
46. Kopp, E, Ghosh, S. Inhibition of NF-kappa B by sodium salicylate and aspirin. Science. 1994;265(5174):956–959.
47. Shoelson, SE, Lee, J, Yuan, M. Inflammation and the IKK beta/I kappa B/NF-kappa B axis in obesity- and diet-induced insulin resistance. Int J Obes Relat Metab Disord. 2003;27(Suppl 3):S49–52.
48. Ruan, H, Miles, PD, Ladd, CM, et al. Profiling gene transcription in vivo reveals adipose tissue as an immediate target of tumor necrosis factor-alpha: implications for insulin resistance. Diabetes. 2002;51(11):3176–3188.
49. Wellen, KE, Hotamisligil, GS. Obesity-induced inflammatory changes in adipose tissue. J Clin Invest. 2003;112(12):1785–1788.
50. Ruan, H, Pownall, HJ, Lodish, HF. Troglitazone antagonizes tumor necrosis factor-alpha-induced reprogramming of adipocyte gene expression by inhibiting the transcriptional regulatory functions of NF-kappaB. J Biol Chem. 2003;278(30):28181–28192.
51. Hotamisligil, GS. Inflammation and metabolic disorders. Nature. 2006;444(7121):860–867.
52. Trayhurn, P, Wang, B, Wood, IS. Hypoxia and the endocrine and signalling role of white adipose tissue. Arch Physiol Biochem. 2008;114(4):267–276.
53. Ye, J. Emerging role of adipose tissue hypoxia in obesity and insulin resistance. Int J Obes (Lond). 2008.
54. Wang, B, Wood, IS, Trayhurn, P. Dysregulation of the expression and secretion of inflammation-related adipokines by hypoxia in human adipocytes. Pflugers Arch. 2007;455(3):479–492.
55. Bogacka, I, Xie, H, Bray, GA, et al. Pioglitazone induces mitochondrial biogenesis in human subcutaneous adipose tissue in vivo. Diabetes. 2005;54(5):1392–1399.
56. Ye, J, Gao, Z, Yin, J, et al. Hypoxia is a potential risk factor for chronic inflammation and adiponectin reduction in adipose tissue of ob/ob and dietary obese mice. Am J Physiol Endocrinol Metab. 2007;293(4):E1118–1128.
57. Yin, J, Zhanguo, G, He, Q, et al. Role of hypoxia in obesity-induced disorders of glucose and lipid metabolism in adipose tissue. Am J Physiol Endocrinol Metab. 2009;296:E333–E342.
58. Cinti, S, Mitchell, G, Barbatelli, G, et al. Adipocyte death defines macrophage localization and function in adipose tissue of obese mice and humans. J Lipid Res. 2005;46(11):2347–2355.
59. Pasarica, M, Sereda, OR, Redman, LM, et al. Reduced adipose tissue oxygenation in human obesity— evidence for rarefaction, macrophage chemotaxis and inflammation without an angiogenic response. Diabetes. 2009;58:718–725.
60. Eizirik, DL, Cardozo, AK, Cnop, M. The role for endoplasmic reticulum stress in diabetes mellitus. Endocr Rev. 2008;29(1):42–61.
61. Gething, MJ, Sambrook, J. Protein folding in the cell. Nature. 1992;355(6355):33–45.
62. Laybutt, DR, Preston, AM, Akerfeldt, MC, et al. Endoplasmic reticulum stress contributes to beta cell apoptosis in type 2 diabetes. Diabetologia. 2007;50(4):752–763.
63. Hosogai, N, Fukuhara, A, Oshima, K, et al. Adipose tissue hypoxia in obesity and its impact on adipocytokine dysregulation. Diabetes. 2007;56(4):901–911.
64. Bashan, N, Dorfman, K, Tarnovscki, T, et al. Mitogen-activated protein kinases, inhibitory-kappaB kinase, and insulin signaling in human omental versus subcutaneous adipose tissue in obesity. Endocrinology. 2007;148(6):2955–2962.
65. Garg, A. Lipodystrophies. Am J Med. 2000;108(2):143–152.
66. Agarwal, AK, Garg, A. Genetic disorders of adipose tissue development, differentiation, and death. Annu Rev Genomics Hum Genet. 2006;7:175–199.
67. Agarwal, AK, Garg, A. Genetic basis of lipodystrophies and management of metabolic complications. Annu Rev Med. 2006;57:297–311.
68. Simha, V, Garg, A. Lipodystrophy: lessons in lipid and energy metabolism. Curr Opin Lipidol. 2006;17(2):162–169.
69. Robbins, DC, Danforth, E, Jr., Horton, ES, et al. The effect of diet on thermogenesis in acquired lipodystrophy. Metabolism. 1979;928:908–916.
70. Robbins, DC, Horton, ES, Tulp, O, et al. Familial partial lipodystrophy: complications of obesity in the non- obese? Metabolism. 1982;531:445–452.
71. Reitman, ML, Mason, MM, Moitra, J, et al. Transgenic mice lacking white fat: models for understanding human lipoatrophic diabetes. Ann N Y Acad Sci. 1999;892:289–296.
72. Shimomura, I, Hammer, RE, Ikemoto, S, et al. Leptin reverses insulin resistance and diabetes mellitus in mice with congenital lipodystrophy. Nature. 1999;6748401:73–76.
73. Kim, JK, Gavrilova, O, Chen, Y, et al. Mechanism of insulin resistance in A-ZIP/F-1 fatless mice. J Biol Chem. 2000;12275:8456–8460.
74. Gavrilova, O, Marcus-Samuels, B, Graham, D, et al. Surgical implantation of adipose tissue reverses diabetes in lipoatrophic mice. J Clin Invest. 2000;3105:271–278.
75. Colombo, C, Cutson, JJ, Yamauchi, T, et al. Transplantation of adipose tissue lacking leptin is unable to reverse the metabolic abnormalities associated with lipoatrophy. Diabetes. 2002;51(9):2727–2733.
76. Ebihara, K, Kusakabe, T, Hirata, M, et al. Efficacy and safety of leptin-replacement therapy and possible mechanisms of leptin actions in patients with generalized lipodystrophy. J Clin Endocrinol Metab. 2007;92(2):532–541.
77. Javor, ED, Ghany, MG, Cochran, EK, et al. Leptin reverses nonalcoholic steatohepatitis in patients with severe lipodystrophy. Hepatology. 2005;41(4):753–760.
78. Park, JY, Javor, ED, Cochran, EK, et al. Long-term efficacy of leptin replacement in patients with Dunnigan-type familial partial lipodystrophy. Metabolism. 2007;56(4):508–516.
79. Weber, RV, Buckley, MC, Fried, SK, et al. Subcutaneous lipectomy causes a metabolic syndrome in hamsters. Am J Physiol Regul Integr Comp Physiol. 2000;279(3):R936–R943.
80. Ryysy, L, Hakkinen, AM, Goto, T, et al. Hepatic fat content and insulin action on free fatty acids and glucose metabolism rather than insulin absorption are associated with insulin requirements during insulin therapy in type 2 diabetic patients. Diabetes. 2000;549:749–758.
81. Goodpaster, BH, Thaete, FL, Kelley, DE. Thigh adipose tissue distribution is associated with insulin resistance in obesity and in type 2 diabetes mellitus. Am J Clin Nutr. 2000;471:885–892.
82. McGarry, JD. Banting lecture 2001: dysregulation of fatty acid metabolism in the etiology of type 2 diabetes. Diabetes. 2002;151:7–18.
83. Danforth, E, Jr. Failure of adipocyte differentiation causes type II diabetes mellitus? Nat Genet. 2000;24(4):377–380.
84. Weyer, C, Foley, JE, Bogardus, C, et al. Enlarged subcutaneous abdominal adipocyte size, but not obesity itself, predicts type II diabetes independent of insulin resistance. Diabetologia. 2000;43(12):1498–1506.
85. Adams, M, Montague, CT, Prins, JB, et al. Activators of peroxisome proliferator-activated receptor gamma have depot-specific effects on human preadipocyte differentiation. J Clin Invest. 1997;12100:3149–3153.
86. Smith, SR, Xie, H, Baghian, S, et al. Pioglitazone changes the distribution of adipocyte size in Type 2 diabetics. Adipocytes. 2006;2(1):11–22.
87. Akazawa, S, Sun, F, Ito, M, et al. Efficacy of troglitazone on body fat distribution in type 2 diabetes [In Process Citation]. Diabetes Care. 2000;823:1067–1071.
88. Bajaj, M, Suraamornkul, S, Kashyap, S, et al. Sustained reduction in plasma free fatty acid concentration improves insulin action without altering plasma adipocytokine levels in subjects with strong family history of type 2 diabetes. J Clin Endocrinol Metab. 2004;89(9):4649–4655.
89. Bajaj, M, Suraamornkul, S, Pratipanawatr, T, et al. Pioglitazone reduces hepatic fat content and augments splanchnic glucose uptake in patients with type 2 diabetes. Diabetes. 2003;52(6):1364–1370.
90. Qi, N, Kazdova, L, Zidek, V, et al. Pharmacogenetic evidence that cd36 is a key determinant of the metabolic effects of pioglitazone. J Biol Chem. 2002;277(50):48501–48507.
91. Mayerson, AB, Hundal, RS, Dufour, S, et al. The effects of rosiglitazone on insulin sensitivity, lipolysis, and hepatic and skeletal muscle triglyceride content in patients with type 2 diabetes. Diabetes. 2002;51(3):797–802.
92. Boden, G, Cheung, P, Mozzoli, M, et al. Effect of thiazolidinediones on glucose and fatty acid metabolism in patients with type 2 diabetes. Metabolism. 2003;52(6):753–759.
93. Pickavance, LC, Buckingham, RE, Wilding, JP. Insulin-sensitizing action of rosiglitazone is enhanced by preventing hyperphagia. Diabetes Obes Metab. 2001;3(3):171–180.
94. Wang, Q, Dryden, S, Frankish, HM, et al. Increased feeding in fatty Zucker rats by the thiazolidinedione BRL 49653 (rosiglitazone) and the possible involvement of leptin and hypothalamic neuropeptide Y. Br J Pharmacol. 1997;122(7):1405–1410.
95. Noppa, H, Bengtsson, C, Isaksson, B, et al. Adipose tissue cellularity in adulthood and its relation to childhood obesity. Int J Obes. 1980;4(3):253–263.
96. Hirsch, J, Batchelor, B. Adipose tissue cellularity in human obesity. Clin Endocrinol Metab. 1976;5(2):299–311.
97. Stern, JS, Batchelor, BR, Hollander, N, et al. Adipose-cell size and immunoreactive insulin levels in obese and normal-weight adults. Lancet. 1972;2(7784):948–951.
98. Paolisso, G, Tataranni, PA, Foley, JE, et al. A high concentration of fasting plasma non-esterified fatty acids is a risk factor for the development of NIDDM. Diabetologia. 1995;1038:1213–1217.
99. Weyer, C, Wolford, JK, Hanson, RL, et al. Subcutaneous abdominal adipocyte size, a predictor of type 2 diabetes, is linked to chromosome 1q21–q23 and is associated with a common polymorphism in LMNA in Pima Indians. Mol Genet Metab. 2001;72(3):231–238.
100. Krotkiewski, M, Sjostrom, L, Bjorntorp, P, et al. Adipose tissue cellularity in relation to prognosis for weight reduction. Int J Obes. 1977;1(4):395–416.
101. Strawford, A, Antelo, F, Christiansen, M, et al. Adipose tissue triglyceride turnover, de novo lipogenesis and cell proliferation in humans measured with 2H2O. Am J Physiol Endocrinol Metab. 2004;286:E577–E588.
102. Domingo, P, Matias-Guiu, X, Pujol, RM, et al. Subcutaneous adipocyte apoptosis in HIV-1 protease inhibitor-associated lipodystrophy. AIDS. 1999;13(16):2261–2267.
103. Julien, P, Despres, JP, Angel, A. Scanning electron microscopy of very small fat cells and mature fat cells in human obesity. J Lipid Res. 1989;30(2):293–299.
104. Hager, A. Adipose cell size and number in relation to obesity. Postgrad Med J. 1977;53(Suppl 2):101–110.
105. Hager, A, Sjostrom, L, Arvidsson, B, et al. Body fat and adipose tissue cellularity in infants: a longitudinal study. Metabolism. 1977;26(6):607–614.
106. Soriguer Escofet, FJ, Esteva de Antonio, I, Tinahones, FJ, et al. Adipose tissue fatty acids and size and number of fat cells from birth to 9 years of age-a cross-sectional study in 96 boys. Metabolism. 1996;45(11):1395–1401.
107. Hauner, H, Entenmann, G, Wabitsch, M, et al. Promoting effect of glucocorticoids on the differentiation of human adipocyte precursor cells cultured in a chemically defined medium. J Clin Invest. 1989;84(5):1663–1670.
108. van Harmelen, V, Skurk, T, Rohrig, K, et al. Effect of BMI and age on adipose tissue cellularity and differentiation capacity in women. Int J Obes Relat Metab Disord. 2003;27(8):889–895.
109. Pilyugin, SS, Ganusov, VV, Murali-Krishna, K, et al. The rescaling method for quantifying the turnover of cell populations. J Theor Biol. 2003;225(2):275–283.
110. Marques, BG, Hausman, DB, Martin, RJ. Association of fat cell size and paracrine growth factors in development of hyperplastic obesity. Am J Physiol. 1998;275(6 Pt 2):R1898–1908.
111. Johnson, PR, Stern, JS, Greenwood, MR, et al. Effect of early nutrition on adipose cellularity and pancreatic insulin release in the Zucker rat. J Nutr. 1973;103(5):738–743.
112. Salans, LB, Cushman, SW, Weismann, RE. Studies of human adipose tissue. Adipose cell size and number in nonobese and obese patients. J Clin Invest. 1973;52(4):929–941.
113. Sjostrom, L, Bjorntorp, P. Body composition and adipose cellularity in human obesity. Acta Med Scand. 1974;195(3):201–211.
114. Ravelli, GP, Stein, ZA, Susser, MW. Obesity in young men after famine exposure in utero and early infancy. N Engl J Med. 1976;295(7):349–353.
115. Kirtland, J, Gurr, MI. Adipose tissue cellularity: a review. 2. The relationship between cellularity and obesity. Int J Obes. 1979;3(1):15–55.
116. Hirsch, J. Obesity: Matter Over Mind? In: Nevins JR, ed. Cerebrum: The Dana Forum on Brain Science. New York: Dana Press; 2003:7–18.
117. Rolland-Cachera, MF, Deheeger, M, Bellisle, F, et al. Adiposity rebound in children: a simple indicator for predicting obesity. Am J Clin Nutr. 1984;39(1):129–135.
118. Prokopec, M, Bellisle, F. Adiposity in Czech children followed from 1 month of age to adulthood: analysis of individual BMI patterns. Ann Hum Biol. 1993;20(6):517–525.
119. Siervogel, RM, Roche, AF, Guo, SM, et al. Patterns of change in weight/stature2 from 2 to 18 years: findings from long-term serial data for children in the Fels longitudinal growth study. Int J Obes. 1991;15(7):479–485.
120. Dietz, WH. Periods of risk in childhood for the development of adult obesity—what do we need to learn? J Nutr. 1997;127(9):1884S–1886S.
121. Premkumar, A, Chow, C, Bhandarkar, P, et al. Lipoatrophic-lipodystrophic syndromes: the spectrum of findings on MR imaging. AJR Am J Roentgenol. 2002;178(2):311–318.
122. Gimble, J, Guilak, F. Adipose-derived adult stem cells: isolation, characterization, and differentiation potential. Cytotherapy. 2003;5(5):362–369.
123. Cartwright, MJ, Tchkonia, T, Kirkland, JL. Aging in adipocytes: potential impact of inherent, depot-specific mechanisms. Exp Gerontol. 2007;42(6):463–471.
124. Tchkonia, T, Giorgadze, N, Pirtskhalava, T, et al. Fat depot-specific characteristics are retained in strains derived from single human preadipocytes. Diabetes. 2006;55(9):2571–2578.
125. Tchkonia, T, Lenburg, M, Thomou, T, et al. Identification of depot-specific human fat cell progenitors through distinct expression profiles and developmental gene patterns. Am J Physiol Endocrinol Metab. 2007;292(1):E298–307.
126. Gesta, S, Bluher, M, Yamamoto, Y, et al. Evidence for a role of developmental genes in the origin of obesity and body fat distribution. Proc Natl Acad Sci U S A. 2006;103(17):6676–6681.
127. Gesta, S, Tseng, YH, Kahn, CR. Developmental origin of fat: tracking obesity to its source. Cell. 2007;131(2):242–256.
128. Tchkonia, T, Tchoukalova, YD, Giorgadze, N, et al. Abundance of two human preadipocyte subtypes with distinct capacities for replication, adipogenesis, and apoptosis varies among fat depots. Am J Physiol Endocrinol Metab. 2005;288(1):E267–277.
129. Crisan, M, Yap, S, Casteilla, L, et al. A perivascular origin for mesenchymal stem cells in multiple human organs. Cell Stem Cell. 2008;3(3):301–313.
130. Traktuev, DO, Merfeld-Clauss, S, Li, J, et al. A population of multipotent CD34-positive adipose stromal cells share pericyte and mesenchymal surface markers, reside in a periendothelial location, and stabilize endothelial networks. Circ Res. 2008;102(1):77–85.
131. Richardson, RL, Hausman, GJ, Gaskins, HR. Effect of transforming growth factor-beta on insulin-like growth factor 1- and dexamethasone-induced proliferation and differentiation in primary cultures of pig preadipocytes. Acta Anat. 1992;145(4):321–326.
132. Banerjee, SS, Feinberg, MW, Watanabe, M, et al. The Kruppel-like factor KLF2 inhibits peroxisome proliferator-activated receptor-gamma expression and adipogenesis. J Biol Chem. 2003;278(4):2581–2584.
133. Green, H, Kehinde, O. An established preadipose cell line and its differentiation in culture. II. Factors affecting the adipose conversion. Cell. 1975;5(1):19–27.
134. Green, H, Kehinde, O. Spontaneous heritable changes leading to increased adipose conversion in 3T3 cells. Cell. 1976;7(1):105–113.
135. Russell, TR, Ho, R. Conversion of 3T3 fibroblasts into adipose cells: triggering of differentiation by prostaglandin F2alpha and 1-methyl-3-isobutyl xanthine. Proc Natl Acad Sci U S A. 1976;73(12):4516–4520.
136. Fajas, L, Landsberg, RL, Huss-Garcia, Y, et al. E2Fs regulate adipocyte differentiation. Dev Cell. 2002;3(1):39–49.
137. Janderova, L, McNeil, M, Murrell, AN, et al. Human mesenchymal stem cells as an in vitro model for human adipogenesis. Obes Res. 2003;11(1):65–74.
138. Reusch, JE, Colton, LA, Klemm, DJ. CREB activation induces adipogenesis in 3T3-L1 cells. Mol Cell Biol. 2000;20(3):1008–1020.
139. Tontonoz, P, Hu, E, Spiegelman, BM. Stimulation of adipogenesis in fibroblasts by PPAR gamma 2, a lipid-activated transcription factor. Cell. 1994;79(7):1147–1156.
140. Yu, K, Bayona, W, Kallen, CB, et al. Differential activation of peroxisome proliferator-activated receptors by eicosanoids. J Biol Chem. 1995;270(41):23975–23983.
141. Kliewer, SA, Lenhard, JM, Willson, TM, et al. A prostaglandin J2 metabolite binds peroxisome proliferator-activated receptor gamma and promotes adipocyte differentiation. Cell. 1995;83(5):813–819.
142. Huang, JT, Welch, JS, Ricote, M, et al. Interleukin-4-dependent production of PPAR-gamma ligands in macrophages by 12/15-lipoxygenase. Nature. 1999;400(6742):378–382.
143. Wu, Z, Xie, Y, Morrison, RF, et al. PPARgamma induces the insulin-dependent glucose transporter GLUT4 in the absence of C/EBPalpha during the conversion of 3T3 fibroblasts into adipocytes. J Clin Invest. 1998;101(1):22–32.
144. Baumann, CA, Chokshi, N, Saltiel, AR, et al. Cloning and characterization of a functional peroxisome proliferator activator receptor-gamma-responsive element in the promoter of the CAP gene. J Biol Chem. 2000;275(13):9131–9135.
145. Schoonjans, K, Peinado-Onsurbe, J, Lefebvre, AM, et al. PPARalpha and PPARgamma activators direct a distinct tissue-specific transcriptional response via a PPRE in the lipoprotein lipase gene. Embo J. 1996;15(19):5336–5348.
146. Picard, F, Auwerx, J. PPAR(gamma) and glucose homeostasis. Annu Rev Nutr. 2002;22:167–197.
147. Glorian, M, Duplus, E, Beale, EG, et al. A single element in the phosphoenolpyruvate carboxykinase gene mediates thiazolidinedione action specifically in adipocytes. Biochimie. 2001;83(10):933–943.
148. Hamm, JK, Park, BH, Farmer, SR. A role for C/EBPbeta in regulating peroxisome proliferator-activated receptor gamma activity during adipogenesis in 3T3-L1 preadipocytes. J Biol Chem. 2001;276(21):18464–18471.
149. Floyd, ZE, Stephens, JM. STAT5A promotes adipogenesis in nonprecursor cells and associates with the glucocorticoid receptor during adipocyte differentiation. Diabetes. 2003;52(2):308–314.
150. Tontonoz, P, Kim, JB, Graves, RA, et al. ADD1: a novel helix-loop-helix transcription factor associated with adipocyte determination and differentiation. Mol Cell Biol. 1993;13(8):4753–4759.
151. Tong, Q, Dalgin, G, Xu, H, et al. Function of GATA transcription factors in preadipocyte-adipocyte transition. Science. 2000;290(5489):134–138.
152. Ross, SE, Hemati, N, Longo, KA, et al. Inhibition of adipogenesis by Wnt signaling. Science. 2000;289(5481):950–953.
153. Tiraby, C, Tavernier, G, Lefort, C, et al. Acquirement of brown fat cell features by human white adipocytes. J Biol Chem. 2003;278(35):33370–33376.
154. Picard, F, Gehin, M, Annicotte, J, et al. SRC-1 and TIF2 control energy balance between white and brown adipose tissues. Cell. 2002;111(7):931–941.
155. Ducharme, NA, Bickel, PE. Lipid droplets in lipogenesis and lipolysis. Endocrinology. 2008;149(3):942–949.
156. Londos, C, Sztalryd, C, Tansey, JT, et al. Role of PAT proteins in lipid metabolism. Biochimie. 2005;87(1):45–49.
157. Wolins, NE, Quaynor, BK, Skinner, JR, et al. OXPAT/PAT-1 is a PPAR-induced lipid droplet protein that promotes fatty acid utilization. Diabetes. 2006;55(12):3418–3428.
158. Heaton, GM, Wagenvoord, RJ, Kemp, A, Jr., et al. Brown-adipose-tissue mitochondria: photoaffinity labelling of the regulatory site of energy dissipation. Eur J Biochem. 1978;82(2):515–521.
159. Ricquier, D, Kader, JC. Mitochondrial protein alteration in active brown fat: a sodium dodecyl sulfate-polyacrylamide gel electrophoretic study. Biochem Biophys Res Commun. 1976;73(3):577–583.
160. Astrup, A, Bulow, J, Christensen, NJ, et al. Ephedrine-induced thermogenesis in man: no role for interscapular brown adipose tissue. Clin Sci (Lond). 1984;66(2):179–186.
161. Astrup, A, Bulow, J, Madsen, J, et al. Contribution of BAT and skeletal muscle to thermogenesis induced by ephedrine in man. Am J Physiol. 1985;248(5 Pt 1):E507–505.
162. Nedergaard, J, Bengtsson, T, Cannon, B. Unexpected evidence for active brown adipose tissue in adult humans. Am J Physiol Endocrinol Metab. 2007;293(2):E444–452.
163. Tatsumi, M, Engles, JM, Ishimori, T, et al. Intense (18)F-FDG uptake in brown fat can be reduced pharmacologically. J Nucl Med. 2004;45(7):1189–1193.
164. Cummings, DE, Brandon, EP, Planas, JV, et al. Genetically lean mice result from targeted disruption of the RII beta subunit of protein kinase A. Nature. 1996;382(6592):622–626.
165. Ghorbani, M, Himms-Hagen, J. Appearance of brown adipocytes in white adipose tissue during CL 316,243-induced reversal of obesity and diabetes in Zucker fa/fa rats. Int J Obes Relat Metab Disord. 1997;21(6):465–475.
166. Kopecky, J, Clarke, G, Enerback, S, et al. Expression of the mitochondrial uncoupling protein gene from the aP2 gene promoter prevents genetic obesity. J Clin Invest. 1995;96(6):2914–2923.
167. Seale, P, Bjork, B, Yang, W, et al. PRDM16 controls a brown fat/skeletal muscle switch. Nature. 2008;454(7207):961–967.
168. Xue, B, Rim, JS, Hogan, JC, et al. Genetic variability affects the development of brown adipocytes in white fat but not in interscapular brown fat. J Lipid Res. 2007;48(1):41–51.
169. Ricquier, D, Nechad, M, Mory, G. Ultrastructural and biochemical characterization of human brown adipose tissue in pheochromocytoma. J Clin Endocrinol Metab. 1982;54(4):803–807.
170. Tseng, YH, Kokkotou, E, Schulz, TJ, et al. New role of bone morphogenetic protein 7 in brown adipogenesis and energy expenditure. Nature. 2008;454(7207):1000–1004.
170a. Virtanen, KA, Lidell, ME, Orava, J, et al. Functional brown adipose tissue in healthy adults. N Engl J Med. 2009;360(15):1518–1525.
170b. Cypess, AM, Lehman, S, Williams, G, et al. Identification and importance of brown adipose tissue in adult humans. N Engl J Med. 2009;360(15):1509–1517.
170c. van Marken Lichtenbelt, WD, Vanhommerig, JW, Smulders, NM, et al. Cold-activated brown adipose tissue in healthy men. N Engl J Med. 2009;360(15):1500–1508.
171. Pasarica, M, Zachwieja, JJ, Dejonge, L, et al. Effect of growth hormone on body composition and visceral adiposity in middle-aged men with visceral obesity. J Clin Endocrinol Metab. 2007;92(11):4265–4270.
172. Voros, G, Maquoi, E, Demeulemeester, D, et al. Modulation of angiogenesis during adipose tissue development in murine models of obesity. Endocrinology. 2005;146(10):4545–4554.
173. Neels, JG, Thinnes, T, Loskutoff, DJ. Angiogenesis in an in vivo model of adipose tissue development. FASEB J. 2004;18(9):983–985.
174. Greenway, FL, Liu, Z, Yu, Y, et al. An assay to measure angiogenesis in human fat tissue. Obes Surg. 2007;17(4):510–515.
175. Cao, Y. Angiogenesis modulates adipogenesis and obesity. J Clin Inves. 2007;117(9):2362–2368.
176. Fukumura, D, Ushiyama, A, Duda, DG, et al. Paracrine regulation of angiogenesis and adipocyte differentiation during in vivo adipogenesis. Circ Res. 2003;93(9):e88–97.
177. Nishimura, S, Manabe, I, Nagasaki, M, et al. Adipogenesis in obesity requires close interplay between differentiating adipocytes, stromal cells, and blood vessels. Diabetes. 2007;56(6):1517–1526.
178. Shibata, R, Ouchi, N, Kihara, S, et al. Adiponectin stimulates angiogenesis in response to tissue ischemia through stimulation of amp-activated protein kinase signaling. J Biol Chem. 2004;279(27):28670–28674.
179. Smith, SR. The Endocrinology of Obesity. In: Bray G, ed. Endocrinology and Metabolism Clinics of North America. W.B Saunders; 1996:921–942.
180. Lee, MJ, Fried, SK, Mundt, SS, et al. Depot-specific regulation of the conversion of cortisone to cortisol in human adipose tissue. Obesity (Silver Spring). 2008;16(6):1178–1185.
181. Marin, P, Darin, N, Amemiya, T, et al. Cortisol secretion in relation to body fat distribution in obese premenopausal women. Metabolism. 1992;41(8):882–886.
182. Pasquali, R, Cantobelli, S, Casimirri, F, et al. The hypothalamic-pituitary-adrenal axis in obese women with different patterns of body fat distribution. J Clin Endocrinol Metab. 1993;77(2):341–346.
183. Rosmond, R, Chagnon, YC, Holm, G, et al. A glucocorticoid receptor gene marker is associated with abdominal obesity, leptin, and dysregulation of the hypothalamic-pituitary-adrenal axis. Obes Res. 2000;8(3):211–218.
184. Galton, DJ, Bray, GA. Studies on lipolysis in human adipose cells. J Clin Invest. 1967;46(4):621–629.
185. Ramsay, TG, Chung, IB, Czerwinski, SM, et al. Tissue IGF-I protein and mRNA responses to a single injection of somatotropin. Am J Physiol. 1995;269(4 Pt 1):E627–635.
186. Snel, YE, Brummer, RJ, Doerga, ME, et al. Adipose tissue assessed by magnetic resonance imaging in growth hormone-deficient adults: the effect of growth hormone replacement and a comparison with control subjects. Am J Clin Nutr. 1995;61(6):1290–1294.
187. Johannsson, G, Marin, P, Lonn, L, et al. Growth hormone treatment of abdominally obese men reduces abdominal fat mass, improves glucose and lipoprotein metabolism, and reduces diastolic blood pressure [see comments]. J Clin Endocrinol Metab. 1997;82(3):727–734.
188. Heffernan, MA, Jiang, WJ, Thorburn, AW, et al. Effects of oral administration of a synthetic fragment of human growth hormone on lipid metabolism. Am J Physiol Endocrinol Metab. 2000;279(3):E501–507.
189. Rebuffe-Scrive, M, Eldh, J, Hafstrom, LO, et al. Metabolism of mammary, abdominal, and femoral adipocytes in women before and after menopause. Metabolism. 1986;35(9):792–797.
190. Rebuffe-Scrive, M, Lonnroth, P, Marin, P, et al. Regional adipose tissue metabolism in men and postmenopausal women. Int J Obes. 1987;11(4):347–355.
191. Lindberg, UB, Crona, N, Silfverstolpe, G, et al. Regional adipose tissue metabolism in postmenopausal women after treatment with exogenous sex steroids. Horm Metab Res. 1990;22(6):345–351.
192. Palin, SL, McTernan, PG, Anderson, LA, et al. 17beta-estradiol and anti-estrogen ICI: Compound 182,780 regulate expression of lipoprotein lipase and hormone-sensitive lipase in isolated subcutaneous abdominal adipocytes. Metabolism. 2003;52(4):383–388.
193. Iverius, PH, Brunzell, JD. Relationship between lipoprotein lipase activity and plasma sex steroid level in obese women. J Clin Invest. 1988;82(3):1106–1112.
194. Price, TM, O’Brien, SN, Welter, BH, et al. Estrogen regulation of adipose tissue lipoprotein lipase-possible mechanism of body fat distribution. Am J Obstet Gynecol. 1998;178(1 Pt 1):101–107.
195. Marin, P, Krotkiewski, M, Bjorntorp, P. Androgen treatment of middle-aged, obese men: effects on metabolism, muscle and adipose tissues. Eur J Med. 1992;1(6):329–336.
196. Marin, P, Oden, B, Bjorntorp, P. Assimilation and mobilization of triglycerides in subcutaneous abdominal and femoral adipose tissue in vivo in men: effects of androgens. J Clin Endocrinol Metab. 1995;80(1):239–243.
197. Anderson, LA, McTernan, PG, Barnett, AH, et al. The effects of androgens and estrogens on preadipocyte proliferation in human adipose tissue: influence of gender and site. J Clin Endocrinol Metab. 2001;86(10):5045–5051.
198. Dieudonne, MN, Pecquery, R, Leneveu, MC, et al. Opposite effects of androgens and estrogens on adipogenesis in rat preadipocytes: evidence for sex and site-related specificities and possible involvement of insulin-like growth factor 1 receptor and peroxisome proliferator-activated receptor gamma2. Endocrinology. 2000;141(2):649–656.
199. Price, TM, O’Brien, SN. Determination of estrogen receptor messenger ribonucleic acid (mRNA) and cytochrome P450 aromatase mRNA levels in adipocytes and adipose stromal cells by competitive polymerase chain reaction amplification. J Clin Endocrinol Metab. 1993;77(4):1041–1045.
200. Mizutani, T, Nishikawa, Y, Adachi, H, et al. Identification of estrogen receptor in human adipose tissue and adipocytes. J Clin Endocrinol Metab. 1994;78(4):950–954.
201. Pedersen, SB, Fuglsig, S, Sjogren, P, et al. Identification of steroid receptors in human adipose tissue. Eur J Clin Invest. 1996;26(12):1051–1056.
202. Pedersen, SB, Hansen, PS, Lund, S, et al. Identification of oestrogen receptors and oestrogen receptor mRNA in human adipose tissue. Eur J Clin Invest. 1996;26(4):262–269.
203. Crandall, DL, Busler, DE, Novak, TJ, et al. Identification of estrogen receptor beta RNA in human breast and abdominal subcutaneous adipose tissue. Biochem Biophys Res Commun. 1998;248(3):523–526.
204. Pedersen, SB, Bruun, JM, Hube, F, et al. Demonstration of estrogen receptor subtypes alpha and beta in human adipose tissue: influences of adipose cell differentiation and fat depot localization. Mol Cell Endocrinol. 2001;182(1):27–37.
205. Clegg, DJ, Brown, LM, Woods, SC, et al. Gonadal hormones determine sensitivity to central leptin and insulin. Diabetes. 2006;55(4):978–987.
206. Arner, P. Free fatty acids—do they play a central role in type 2 diabetes? Diabetes Obes Metab. 2001;3 Suppl 1:11–19.
207. Youngstrom, TG, Bartness, TJ. Catecholaminergic innervation of white adipose tissue in Siberian hamsters. Am J Physiol. 1995;268(3 Pt 2):R744–751.
208. Bowers, RR, Festuccia, WT, Song, CK, et al. Sympathetic innervation of white adipose tissue and its regulation of fat cell number. Am J Physiol Regul Integr Comp Physiol. 2004;286(6):R1167–1175.
209. Giordano, A, Song, CK, Bowers, RR, et al. White adipose tissue lacks significant vagal innervation and immunohistochemical evidence of parasympathetic innervation. Am J Physiol Regul Integr Comp Physiol. 2006;291(5):R1243–1255.
210. Song, CK, Schwartz, GJ, Bartness, TJ. Anterograde transneuronal viral tract tracing reveals central sensory circuits from white adipose tissue. Am J Physiol Regul Integr Comp Physiol. 2009;296:R501–511.
211. Cousin, B, Casteilla, L, Lafontan, M, et al. Local sympathetic denervation of white adipose tissue in rats induces preadipocyte proliferation without noticeable changes in metabolism. Endocrinology. 1993;133(5):2255–2262.
212. Jones, DD, Ramsay, TG, Hausman, GJ, et al. Norepinephrine inhibits rat pre-adipocyte proliferation. Int J Obes Relat Metab Disord. 1992;16(5):349–354.
213. Hodgson, AJ, Abolhasan, P, Kubbinga, A, et al. Sympathetic control of pacemaker adipocytes. Int J Obes. 2002;26(supplement 1):A659.
214. Summers, SA, Whiteman, EL, Birnbaum, MJ. Insulin signaling in the adipocyte. Int J Obes Relat Metab Disord. 2000;24(Suppl 4):S67–S70.
215. Kahn, BB, Flier, JS. Obesity and insulin resistance. J Clin Invest. 2000;106(4):473–481.
216. Langin, D, Lucas, S, Lafontan, M. Millennium fat-cell lipolysis reveals unsuspected novel tracks. Horm Metab Res. 2000;32(11–12):443–452.
217. Arner, P, Hoffstedt, J. Adrenoceptor genes in human obesity. J Intern Med. 1999;245(6):667–672.
218. Sengenes, C, Bouloumie, A, Hauner, H, et al. Involvement of a cGMP-dependent pathway in the natriuretic peptide-mediated hormone-sensitive lipase phosphorylation in human adipocytes. J Biol Chem. 2003;278(49):48617–48626.
219. Moro, C, Crampes, F, Sengenes, C, et al. Atrial natriuretic peptide contributes to the physiological control of lipid mobilization in humans. FASEB J. 2004;18:908–910.
220. Lafontan, M, Moro, C, Berlan, M, et al. Control of lipolysis by natriuretic peptides and cyclic GMP. Trends Endocrinol Metab. 2008;19(4):130–137.
221. Moro, C, Pillard, F, de Glisezinski, I, et al. Exercise-induced lipid mobilization in subcutaneous adipose tissue is mainly related to natriuretic peptides in overweight men. Am J Physiol Endocrinol Metab. 2008;295(2):E505–513.
222. Zechner, R, Kienesberger, PC, Haemmerle, G, et al. Adipose triglyceride lipase and the lipolytic catabolism of cellular fat stores. J Lipid Res. 2009;50(1):3–21.
223. Granneman, JG, Moore, HP. Location, location: protein trafficking and lipolysis in adipocytes. Trends Endocrinol Metab. 2008;19(1):3–9.
224. Rubner, M. Die Quelle der thierischen Warme. Ztschr Biol. 1894;30:73–142.
225. Adolph, E. Urges to eat and drink in rats. Am J Physiol. 1947;151:110–125.
226. Hervey, GR. Regulation of energy balance. Nature. 1969;222:629–631.
227. Brobeck, J. Mechanism of the development of obesity in animals with hypothalamic lesions. Physiol Rev. 1946;25:541–559.
228. Mayer, J. Regulation of energy intake and the body weight: the glucostatic theory and the lipostatic hypothesis. Ann N Y Acad Sci. 1955;163:15–43.
229. Kennedy, GC. The role of depot fat in the hypothalamic control of food intake in the rat. Proc R Soc Lond B Biol Sci. 1953;901140:578–596.
230. Hervey, GR. The effects of lesions in the hypothalamus in parabiotic rats. J Physiol. 1959;2145:336–352.
231. Coleman, DL. Effects of parabiosis of obese with diabetes and normal mice. Diabetologia. 1973;9(4):294–298.
232. Tartaglia, LA, Dembski, M, Weng, X, et al. Identification and expression cloning of a leptin receptor, OB-R. Cell. 1995;783:1263–1271.
233. Heilbronn, LK, Smith, SR, Ravussin, E. The insulin-sensitizing role of the fat derived hormone adiponectin. Curr Pharm Des. 2003;9(17):1411–1418.
234. Mohamed-Ali, V, Goodrick, S, Rawesh, A, et al. Subcutaneous adipose tissue releases interleukin-6, but not tumor necrosis factor-alpha, in vivo. J Clin Endocrinol Metab. 1997;1282:4196–4200.
235. Maffei, M, Halaas, J, Ravussin, E, et al. Leptin levels in human and rodent: measurement of plasma leptin and ob RNA in obese and weight-reduced subjects. Nat Med. 1995;111:1155–1161.
236. Leibel, RL. The role of leptin in the control of body weight. Nutr Rev. 2002;10 Pt 260:S15–S19.
237. Ahima, RS, Prabakaran, D, Mantzoros, C, et al. Role of leptin in the neuroendocrine response to fasting. Nature. 1996;6588382:250–252.
238. Huang, L, Li, C. Leptin: a multifunctional hormone. Cell Res. 2000;210:81–92.
239. Shimokawa, I, Higami, Y. Leptin and anti-aging action of caloric restriction. J Nutr Health Aging. 2001;15:43–48.
240. Roti, E, Minelli, R, Salvi, M. Thyroid hormone metabolism in obesity. Int J Obes Relat Metab Disord. 2000;24 Suppl 2:S113–S115.
241. Fichter, MM, Pirke, KM, Holsboer, F. Weight loss causes neuroendocrine disturbances: experimental study in healthy starving subjects. Psychiatry Res. 1986;17:61–72.
242. Everitt, AV, Seedsman, NJ, Jones, F. The effects of hypophysectomy and continuous food restriction, begun at ages 70 and 400 days, on collagen aging, proteinuria, incidence of pathology and longevity in the male rat. Mech Ageing Dev. 1980;12:161–172.
243. Meites, J. Evidence that underfeeding acts via the neuroendocrine system to influence aging processes. Prog Clin Biol Res. 1989;287:169–180.
244. Masoro, EJ. Food restriction in rodents: an evaluation of its role in the study of aging. J Gerontol. 1988;343:B59–B64.
245. Nelson, JF. Neuroendocrine involvement in the retardation of aging by food restriction: a hypothesis. In: BP Yu, ed. Modulation of Aging Processes by Dietary Restriction. Boca Raton, FL: CRC Press; 1994:37–55.
246. Kirkwood, TB. Evolution of ageing. Nature. 1977;5635270:301–304.
247. Heymsfield, SB, Greenberg, AS, Fujioka, K, et al. Recombinant leptin for weight loss in obese and lean adults: a randomized, controlled, dose-escalation trial. JAMA. 1999;16282:1568–1575.
248. Minokoshi, Y, Kim, Y, Peroni, O, et al. Leptin stimulates fatty-acid oxidation by activating AMP-activated protein kinase. Nature. 2002;415:339–343.
249. Minokoshi, Y, Kahn, BB. Role of AMP-activated protein kinase in leptin-induced fatty acid oxidation in muscle. Biochem Soc Trans. 2003;Pt 131:196–201.
250. Farooqi, IS, Jebb, SA, Langmack, G, et al. Effects of recombinant leptin therapy in a child with congenital leptin deficiency. N Engl J Med. 1999;12341:879–884.
251. Rosenbaum, M, Murphy, EM, Heymsfield, SB, et al. Low dose leptin administration reverses effects of sustained weight-reduction on energy expenditure and circulating concentrations of thyroid hormones. J Clin Endocrinol Metab. 2002;87:2391–2394.
252. Petersen, KF, Oral, EA, Dufour, S, et al. Leptin reverses insulin resistance and hepatic steatosis in patients with severe lipodystrophy. J Clin Invest. 2002;10109:1345–1350.
253. Ravussin, E, Caglayan, S, Williamson, DA, et al. Effects of human leptin replacement of food intake and energy metabolism in 3 leptin-deficient adults (Abstract). International Journal of Obesity. 2002;S126:S136.
254. Roth, JD, Roland, BL, Cole, RL, et al. Leptin responsiveness restored by amylin agonism in diet-induced obesity: evidence from nonclinical and clinical studies. Proc Natl Acad Sci U S A. 2008;105(20):7257–7262.
254a. Ravussin E, Smith SR, Mitchell JA, et al: Enhanced weight loss with pramlintide/metreleptin: an integrated neurohormonal approach to obesity pharmacotherapy, Obesity (Silver Spring) Jun 11, 2009. [Epub ahead of print.]
255. Carr, A, Samaras, K, Thorisdottir, A, et al. Diagnosis, prediction, and natural course of HIV-1 protease-inhibitor-associated lipodystrophy, hyperlipidaemia, and diabetes mellitus: a cohort study [see comments]. Lancet. 1999;353(9170):2093–2099.
256. Ledru, E, Christeff, N, Patey, O, et al. Alteration of tumor necrosis factor-alpha T-cell homeostasis following potent antiretroviral therapy: contribution to the development of human immunodeficiency virus-associated lipodystrophy syndrome [In Process Citation]. Blood. 2000;95(10):3191–3198.
257. Mynarcik, DC, McNurlan, MA, Steigbigel, RT, et al. Association of severe insulin resistance with both loss of limb fat and elevated serum tumor necrosis factor receptor levels in HIV lipodystrophy [In Process Citation]. J Acquir Immune Defic Syndr. 2000;25(4):312–321.
258. Cao, H, Hegele, RA. Nuclear lamin A/C R482Q mutation in Canadian kindreds with Dunnigan-type familial partial lipodystrophy. Hum Mol Genet. 2000;9(1):109–112.
259. Genschel, J, Schmidt, HH. Mutations in the LMNA gene encoding lamin A/C. Hum Mutat. 2000;16(6):451–459.
260. Shackleton, S, Lloyd, DJ, Jackson, SN, et al. LMNA, encoding lamin A/C, is mutated in partial lipodystrophy. Nat Genet. 2000;24(2):153–156.
261. Lloreta, J, Domingo, P, Pujol, RM, et al. Ultrastructural features of highly active antiretroviral therapy-associated partial lipodystrophy. Virchows Arch. 2002;441(6):599–604.
262. Lee, JH, Chan, JL, Sourlas, E, et al. Recombinant methionyl human leptin therapy in replacement doses improves insulin resistance and metabolic profile in patients with lipoatrophy and metabolic syndrome induced by the highly active antiretroviral therapy. J Clin Endocrinol Metab. 2006;91(7):2605–2611.
263. Oral, EA, Simha, V, Ruiz, E, et al. Leptin-replacement therapy for lipodystrophy. N Engl J Med. 2002;346(8):570–578.
264. Maeda, K, Okubo, K, Shimomura, I, et al. cDNA cloning and expression of a novel adipose specific collagen-like factor, apM1 (AdiPose Most abundant Gene transcript 1). Biochem Biophys Res Commun. 1996;2221:286–289.
265. Combs, TP, Berg, AH, Rajala, MW, et al. Sexual differentiation, pregnancy, calorie restriction, and aging affect the adipocyte-specific secretory protein adiponectin. Diabetes. 2003;252:268–276.
266. Scherer, PE, Williams, S, Fogliano, M, et al. A novel serum protein similar to C1q, produced exclusively in adipocytes. J Biol Chem. 1995;45270:26746–26749.
267. Hu, E, Liang, P, Spiegelman, BM. AdipoQ is a novel adipose-specific gene dysregulated in obesity. J Biol Chem. 1996;18271:10697–10703.
268. Nakano, Y, Tobe, T, ChoiMiura, NH, et al. Isolation and characterization of GBP28, a novel gelatin-binding protein purified from human plasma. Journal of Biochemistry. 1996;4120:803–812.
269. Pajvani, UB, Du, X, Combs, TP, et al. Structure-function studies of the adipocyte-secreted hormone Acrp30/adiponectin. Implications for metabolic regulation and bioactivity. J Biol Chem. 2003;278(11):9073–9085.
270. Shapiro, L, Scherer, PE. The crystal structure of a complement-1q family protein suggests an evolutionary link to tumor necrosis factor. Current Biology. 1998;68:335–338.
271. Schaffler, A, Orso, E, Palitzsch, KD, et al. The human apM-1, an adipocyte-specific gene linked to the family of TNF’s and to genes expressed in activated T cells, is mapped to chromosome 1q21.3-q23, a susceptibility locus identified for familial combined hyperlipidaemia (FCH). Biochem Biophys Res Commun. 1999;260:416–425.
272. Hotta, K, Funahashi, T, Arita, Y, et al. Plasma Concentrations of a novel, adipose-specific protein, adiponectin, in type 2 diabetic patients. Arterioscler Thromb Vasc Biol. 2000;20(6):1595–1599.
273. Arita, Y, Kihara, S, Ouchi, N, et al. Paradoxical decrease of an adipose-specific protein, adiponectin, in obesity. Biochem Biophys Res Commun. 1999;1257:79–83.
274. Weyer, C, Funahashi, T, Tanaka, S, et al. Hypoadiponectinemia in obesity and type 2 diabetes: close association with insulin resistance and hyperinsulinemia. J Clin Endocrinol Metab. 2001;586:1930–1935.
275. Haque, WA, Shimomura, I, Matsuzawa, Y, et al. Serum adiponectin and leptin levels in patients with lipodystrophies. J Clin Endocrinol Metab. 2002;587:2395.
276. Yamauchi, T, Kamon, J, Ito, Y, et al. Cloning of adiponectin receptors that mediate antidiabetic metabolic effects. Nature. 2003;423:762–769.
277. Civitarese, AE, Jenkinson, CP, Richardson, D, et al. Adiponectin receptors gene expression and insulin sensitivity in non-diabetic Mexican Americans with or without family history of Type 2 diabetes. Diabetologia. 2004;47:816–820.
278. Civitarese, AE, Carling, S, Heilbronn, LK, et al. Calorie restriction increases muscle mitochondrial biogenesis in healthy humans. PLoS Med. 2007;4(3):e76.
279. Okamoto, Y, Arita, Y, Nishida, M, et al. An adipocyte-derived plasma protein, adiponectin, adheres to injured vascular walls. Hormone and Metabolic Research. 2000;232:47–50.
280. Fruebis, J, Tsao, T-S, Javorschi, S, et al. Proteolytic cleavage product of 30-kDa adipocyte complement-related protein increases fatty acid oxidation in muscle and causes weight loss in mice. PNAS. 2001;498:2005–2010.
281. Yamauchi, T, Kamon, J, Waki, H, et al. The fat-derived hormone adiponectin reverses insulin resistance associated with both lipoatrophy and obesity. Nat Med. 2001;87:941–946.
282. Berg, AH, Combs, TP, Du, X, et al. The adipocyte-secreted protein Acrp30 enhances hepatic insulin action. Nat Med. 2001;87:947–953.
283. Yamauchi, T, Kamon, J, Minokoshi, Y, et al. Adiponectin stimulates glucose utilization and fatty-acid oxidation by activating AMP-activated protein kinase. Nat Med. 2002;118:1288–1295.
284. Combs, TP, Berg, AH, Obici, S, et al. Endogenous glucose production is inhibited by the adipose-derived protein Acrp30. J Clin Invest. 2001;108:1875–1881.
285. Winder, WW, Hardie, DG. AMP-activated protein kinase, a metabolic master switch: possible roles in Type 2 diabetes. Am J Physiol Endocrinol Metab. 1999;1277:E1–10.
286. Yamamoto, Y, Hirose, H, Saito, I, et al. Correlation of the adipocyte-derived protein adiponectin with insulin resistance index and serum high-density lipoprotein-cholesterol, independent of body mass index, in the Japanese population. Clinical Science. 2002;2103:137–142.
287. Lindsay, RS, Funahashi, T, Hanson, RL, et al. Adiponectin and development of type 2 diabetes in the Pima Indian population. Lancet. 2002;9326360:57–58.
288. Yang, W-S, Lee, W-J, Funahashi, T, et al. Weight reduction increases plasma levels of an adipose-derived anti-inflammatory protein, adiponectin. J Clin Endocrinol Metab. 2001;886:3815–3819.
289. Yu, JG, Javorschi, S, Hevener, AL, et al. The effect of thiazolidinediones on plasma adiponectin levels in normal, obese, and type 2 diabetic subjects. Diabetes. 2002;1051:2968–2974.
290. Kim, JY, van de Wall, E, Laplante, M, et al. Obesity-associated improvements in metabolic profile through expansion of adipose tissue. J Clin Invest. 2007;117(9):2621–2637.
291. Steppan, CM, Bailey, ST, Bhat, S, et al. The hormone resistin links obesity to diabetes. Nature. 2001;409(6818):307–312.
292. Moon, B, Kwan, JJ, Duddy, N, et al. Resistin inhibits glucose uptake in L6 cells independently of changes in insulin signaling and GLUT4 translocation. Am J Physiol Endocrinol Metab. 2003;285(1):E106–115.
293. Kim, KH, Lee, K, Moon, YS, et al. A cysteine-rich adipose tissue-specific secretory factor inhibits adipocyte differentiation. J Biol Chem. 2001;276(14):11252–11256.
294. Holcomb, IN, Kabakoff, RC, Chan, B, et al. FIZZ1, a novel cysteine-rich secreted protein associated with pulmonary inflammation, defines a new gene family. Embo J. 2000;19(15):4046–4055.
295. Banerjee, RR, Rangwala, SM, Shapiro, JS, et al. Regulation of fasted blood glucose by resistin. Science. 2004;303(5661):1195–1198.
296. Ahima, RS, Lazar, MA. Adipokines and the peripheral and neural control of energy balance. Mol Endocrinol. 2008;22(5):1023–1031.
297. Yannakoulia, M, Yiannakouris, N, Bluher, S, et al. Body fat mass and macronutrient intake in relation to circulating soluble leptin receptor, free leptin index, adiponectin, and resistin concentrations in healthy humans. J Clin Endocrinol Metab. 2003;88(4):1730–1736.
298. Lee, S, Batzoglou, S. Application of independent component analysis to microarrays. Genome Biology. 2003;4(11):R76.
299. Heilbronn, LK, Janderova, L, Rood, J, et al. Relationship between serum resistin concentrations and insulin resistance in non-obese, obese and obese-diabetic subjects. J Clin Endocrinol Metab. 2004;89:1844–1848.
300. Savage, DB, Sewter, CP, Klenk, ES, et al. Resistin / Fizz3 expression in relation to obesity and peroxisome proliferator-activated receptor-gamma action in humans. Diabetes. 2001;50(10):2199–2202.
301. Smith, SR, Bai, F, Charbonneau, C, et al. A promoter genotype and oxidative stress potentially link resistin to human insulin resistance. Diabetes. 2003;52(7):1611–1618.
302. Lazar, MA. Resistin- and Resistin- and Obesity-associated metabolic diseases. Horm Metab Res. 2007;39(10):710–716.
303. Smith, AD. Oxford Dictionary of Biochemistry and Molecular Biology. Oxford: Oxford Science Publications; 2000.
304. Xu, H, Hirosumi, J, Uysal, KT, et al. Exclusive action of transmembrane TNF alpha in adipose tissue leads to reduced adipose mass and local but not systemic insulin resistance. Endocrinology. 2002;143(4):1502–1511.
305. Stephens, JM, Butts, M, Stone, R, et al. Regulation of transcription factor mRNA accumulation during 3T3-L1 preadipocyte differentiation by antagonists of adipogenesis. Mol Cell Biochem. 1993;123(1–2):63–71.
306. Xing, H, Northrop, JP, Grove, JR, et al. TNF alpha-mediated inhibition and reversal of adipocyte differentiation is accompanied by suppressed expression of PPARgamma without effects on Pref-1 expression. Endocrinology. 1997;138(7):2776–2783.
307. Hotamisligil, GS, Shargill, NS, Spiegelman, BM. Adipose expression of tumor necrosis factor-alpha: direct role in obesity-linked insulin resistance. Science. 1993;259(5091):87–91.
308. Tsigos, C, Kyrou, I, Chala, E, et al. Circulating tumor necrosis factor alpha concentrations are higher in abdominal versus peripheral obesity. Metabolism. 1999;48(10):1332–1335.
309. Lofgren, P, van Harmelen, V, Reynisdottir, S, et al. Secretion of tumor necrosis factor-alpha shows a strong relationship to insulin-stimulated glucose transport in human adipose tissue. Diabetes. 2000;49(5):688–692.
310. Fried, SK, Zechner, R. Cachectin/tumor necrosis factor decreases human adipose tissue lipoprotein lipase mRNA levels, synthesis, and activity. J Lipid Res. 1989;30(12):1917–1923.
311. Bullo, M, Garcia-Lorda, P, Peinado-Onsurbe, J, et al. TNFalpha expression of subcutaneous adipose tissue in obese and morbid obese females: relationship to adipocyte LPL activity and leptin synthesis. Int J Obes Relat Metab Disord. 2002;26(5):652–658.
312. Sykiotis, GP, Papavassiliou, AG. Serine phosphorylation of insulin receptor substrate-1: a novel target for the reversal of insulin resistance. Mol Endocrinol. 2001;15(11):1864–1869.
313. Friedberg, M, Zoumakis, E, Hiroi, N, et al. Modulation of 11 beta-hydroxysteroid dehydrogenase type 1 in mature human subcutaneous adipocytes by hypothalamic messengers. J Clin Endocrinol Metab. 2003;88(1):385–393.
314. McTernan, PG, Harte, AL, Anderson, LA, et al. Insulin and rosiglitazone regulation of lipolysis and lipogenesis in human adipose tissue in vitro. Diabetes. 2002;51(5):1493–1498.
315. Kern, PA, Dicker-Brown, A, Said, ST, et al. The stimulation of tumor necrosis factor and inhibition of glucose transport and lipoprotein lipase in adipose cells by 2,3,7,8-tetrachlorodibenzo-p-dioxin. Metabolism. 2002;51(1):65–68.
316. Nilsson, J, Jovinge, S, Niemann, A, et al. Relation between plasma tumor necrosis factor-alpha and insulin sensitivity in elderly men with non-insulin-dependent diabetes mellitus. Arterioscler Thromb Vasc Biol. 1998;18(8):1199–1202.
317. Chan, JC, Cheung, JC, Stehouwer, CD, et al. The central roles of obesity-associated dyslipidaemia, endothelial activation and cytokines in the metabolic syndrome—an analysis by structural equation modelling. Int J Obes Relat Metab Disord. 2002;26(7):994–1008.
318. Mynarcik, DC, McNurlan, MA, Steigbigel, RT, et al. Association of severe insulin resistance with both loss of limb fat and elevated serum tumor necrosis factor receptor levels in HIV lipodystrophy. J Acquir Immune Defic Syndr. 2000;25(4):312–321.
319. Tatemoto, K, Hosoya, M, Habata, Y, et al. Isolation and characterization of a novel endogenous peptide ligand for the human APJ receptor. Biochem Biophys Res Commun. 1998;251(2):471–476.
320. Rayalam, S, Della-Fera, MA, Krieg, PA, et al. A putative role for apelin in the etiology of obesity. Biochem Biophys Res Commun. 2008;368(3):815–819.
321. Kunduzova, O, Alet, N, Delesque-Touchard, N, et al. Apelin/APJ signaling system: a potential link between adipose tissue and endothelial angiogenic processes. FASEB J. 2008;22(12):4146–4153.
322. Mazzucotelli, A, Ribet, C, Castan-Laurell, I, et al. The transcriptional co-activator PGC-1alpha up regulates apelin in human and mouse adipocytes. Regul Pept. 2008;150(1–3):33–37.
323. Dray, C, Knauf, C, Daviaud, D, et al. Apelin stimulates glucose utilization in normal and obese insulin-resistant mice. Cell Metab. 2008;8(5):437–445.
324. Suh, JM, Zeve, D, McKay, R, et al. Adipose is a conserved dosage-sensitive antiobesity gene. Cell Metab. 2007;6(3):195–207.
325. Weyer, C, Gautier, JF, Danforth, E, Jr. Development of beta 3-adrenoceptor agonists for the treatment of obesity and diabetes—an update. Diabetes Metab. 1999;25(1):11–21.
326. Rupnick, MA, Panigrahy, D, Zhang, CY, et al. Adipose tissue mass can be regulated through the vasculature. Proc Natl Acad Sci U S A. 2002;99(16):10730–10735.
327. Kolonin, MG, Saha, PK, Chan, L, et al. Reversal of obesity by targeted ablation of adipose tissue. Nat Med. 2004;10(6):625–632.
328. Kahn, CR. Medicine. Can we nip obesity in its vascular bud? Science. 2008;322(5901):542–543.
329. Hirose, H, Kawai, T, Yamamoto, Y, et al. Effects of pioglitazone on metabolic parameters, body fat distribution, and serum adiponectin levels in Japanese male patients with type 2 diabetes. Metabolism. 2002;51(3):314–317.
330. Bjorntorp, P, Rosmond, R. Obesity and cortisol. Nutrition. 2000;16(10):924–936.
331. Bjorntorp, P, Rosmond, R. The metabolic syndrome—a neuroendocrine disorder? Br J Nutr. 2000;83(Suppl 1):S49–57.
332. Bujalska, IJ, Kumar, S, Stewart, PM. Does central obesity reflect “Cushing’s disease of the omentum”? Lancet. 1997;349(9060):1210–1213.
333. Masuzaki, H, Paterson, J, Shinyama, H, et al. A transgenic model of visceral obesity and the metabolic syndrome. Science. 2001;294(5549):2166–2170.
334. Kotelevtsev, Y, Holmes, MC, Burchell, A, et al. 11beta-Hydroxysteroid dehydrogenase type 1 knockout mice show attenuated glucocorticoid-inducible responses and resist hyperglycemia on obesity or stress. PNAS. 1997;94(26):14924–14929.
335. Kozak, LP. Genetic studies of brown adipocyte induction. J Nutr. 2000;130(12):3132S–3133S.
336. Guerra, C, Koza, RA, Yamashita, H, et al. Emergence of brown adipocytes in white fat in mice is under genetic control. Effects on body weight and adiposity. J Clin Invest. 1998;102(2):412–420.
337. Tiraby, C, Langin, D. Conversion from white to brown adipocytes: a strategy for the control of fat mass? Trends Endocrinol Metab. 2003;14(10):439–441.
338. Walczak, R, Tontonoz, P. Setting fat on fire. Nat Med. 2003;9(11):1348–1349.
339. Bajaj, M, Suraamornkul, S, Romanelli, A, et al. Effect of a sustained reduction in plasma free fatty acid concentration on intramuscular long-chain fatty Acyl-CoAs and insulin action in type 2 diabetic patients. Diabetes. 2005;54(11):3148–3153.
340. Tunaru, S, Kero, J, Schaub, A, et al. PUMA-G and HM74 are receptors for nicotinic acid and mediate its anti-lipolytic effect. Nat Med. 2003;9(3):352–355.
341. Ge, H, Li, X, Weiszmann, J, et al. Activation of G protein-coupled receptor 43 in adipocytes leads to inhibition of lipolysis and suppression of plasma free fatty acids. Endocrinology. 2008;149(9):4519–4526.
342. Yang, RZ, Lee, MJ, Hu, H, et al. Acute-phase serum amyloid A: an inflammatory adipokine and potential link between obesity and its metabolic complications. PLoS Med. 2006;3(6):e287.
343. Jernas, M, Palming, J, Sjoholm, K, et al. Separation of human adipocytes by size: hypertrophic fat cells display distinct gene expression. FASEB J. 2006;20(9):1540–1542.
344. Moro, C, Klimcakova, E, Lafontan, M, et al. Phosphodiesterase-5A and neutral endopeptidase activities in human adipocytes do not control atrial natriuretic peptide-mediated lipolysis. Br J Pharmacol. 2007;152(7):1102–1110.
345. Farmer, SR. International Textbook of Diabetes Mellitus. In Alberti KGM, DeFronzo RA, Keen H, et al, eds.: International Textbook of Diabetes Mellitus, ed 3, John Wiley & Sons, Ltd, 2004.
[/level-membership-for-endocrinology-diabetes-and-metabolism-category][not-level-membership-for-endocrinology-diabetes-and-metabolism-category]Chapter 11
Role of the Adipocyte in Metabolism and Endocrine Function
In an evolutionary sense, adipose tissue represents the most efficient way to store energy in periods of feast to allow survival during periods of famine. There are two main reasons for this efficiency. First, on a weight basis, triacylglycerol, commonly called triglycerides, yields more than two times more energy than glycogen or proteins. Second, triglycerides are stored without associated water, whereas glycogen, which is hydrophilic, binds as much as twice its weight to water. Similarly, proteins, the building blocks of cells, are associated with large amounts of water. As a result, the energy that can be recovered from triglycerides stores by unit of weight is more than four times greater than that from glycogen and/or protein stores. An average 75 kg man can store only approximately 500 g of carbohydrate in liver and muscle, representing less than a day of energy stores (see Chapter 10). By contrast, even in lean individuals, fat stores in the adipose tissue alone can amount to approximately 10 kg, which is sufficient to maintain bodily functions for weeks of survival during total food deprivation. In obesity, fat stores can be multiplied by as much as 10 to 20 times and can provide energy for months of starvation. The energy from triglycerides is stored in some 25 to 50 billion fat cells, representing the adipose tissue, most beneath the skin and in the abdomen. Until only 15 years ago, the adipose tissue was considered primarily as an energy storage compartment that provides energy fuel to the entire body between meals and during periods of energy deficit.
With the discovery of leptin in 19941 and the many other secreted proteins since that time,2 the adipose tissue now is not only considered as an energy reservoir but has reached the status of a true endocrine organ. Over the past decade, effort has been concentrated on gaining a better understanding of the regulation of adipose tissue development and apoptosis throughout the life span and its consequences for health and disease. In this chapter, we review the role of the adipose as an energy storage compartment, but more important, we summarize the current knowledge of what is now considered a finely tuned endocrine organ that can influence many facets of the conditions often referred as the metabolic syndrome (see Chapter 18). We first describe the link between too much fat (obesity), inflammation, endoplasmic reticulum (ER) stress, and insulin resistance, and alternatively, we provide arguments regarding why too little fat is equally and paradoxically associated with insulin resistance. Next, we review the pioneering work that led to the concept of hypertrophic and hyperplastic obesity and the critical periods during which adipose tissue is thought to develop. Our current understanding of the regulation of adipogenesis then is reviewed, and this is followed by a description of the afferent endocrine and neural signals to the adipose tissue. We also provide new information regarding the potential importance of brown adipose tissue in humans, a concept that has been discarded over the past two decades because of the belief that such tissue was lacking in adult humans. In the next section, we discuss the lipostatic theory, which led to the discovery of leptin and many other hormones involved in health and disease. Beside leptin, we provide additional details on adiponectin, resistin, tumor necrosis factor (TNF), apelin, and adipose. We conclude by proposing the adipocyte as a potential target for the treatment of obesity, dyslipidemia, and type 2 diabetes, with emphasis placed on inducing brown adipose tissue.
Obesity, Insulin Resistance, Inflammation, ER Stress, and Type 2 Diabetes Mellitus
Link Between Obesity and Insulin Resistance (Figs. 11-1 and 11-2)
Numerous cross-sectional studies have shown an association between obesity and type 2 diabetes. Data from the Third National Health Examination Survey (NHANES III) provide unequivocal evidence that the prevalence of diabetes is almost three times greater in overweight than in non-overweight persons.3 Many prospective studies have confirmed this association. As an example, the likelihood of developing diabetes increases steeply with increasing body weight and fatness in Pima Indians.4 The association between obesity and diabetes is attributed in most part to the increase in insulin resistance that is so common in obese people.5 Insulin resistance is a clear predisposing factor for the development of type 2 diabetes in individuals at risk for the disease.6–8
FIGURE 11-1 Obesity and adipocyte hypertrophy. Adipocyte hypertrophy is a key feature of the insulin-resistant state. The flux of free fatty acids out of adipose tissue is disordered in obesity, especially when adipocyte hypertrophy is present. In addition, hypoxia, inflammation, and endoplasmic reticulum (ER) stress have been implicated as important mechanistic links between obesity and insulin resistance. This figure attempts to reconcile the available data on how obesity might lead to insulin resistance. In many instances, the directionality of the connections between mechanistic factors is unclear. For example, it is clear that ER stress can lead to the secretion of inflammatory cytokines, but it is not entirely clear whether inflammation and macrophages might lead to ER stress. Similarly, reduced capillary density (rarefaction) leads to hypoxia, and hypoxia leads to the secretion of chemokines and inflammatory cytokines and probably disordered adipokine secretion. Hypertrophic adipocytes secrete the inflammatory peptide SAA, which may serve to amplify inflammation and chemotaxis of macrophages.342,343 At this time, it is difficult to disentangle the web of deleterious connections. It appears that once the cascade is initiated, multiple interlocking pathways may sustain the dysfunctional adipose tissue.
FIGURE 11-2 Angiogenesis and innervations in adipose tissue. Adipose tissue has the capacity to grow new blood vessels. A, Adipose tissue fragments show outgrowth of new capillaries after 10 days culture ex vivo.
(Photomicrograph courtesy Dr. Frank Greenway, Pennington Biomedical Research Center; methods as in reference 174.)
B, In human adipose tissue, capillaries form a rich meshwork around adipocytes.
(Photomicrograph courtesy Drs. Magdalena Pasarica, David Burk, and Steven Smith, Pennington Biomedical Research Center.)
Adipocytes are stained green (BODIPY) and capillaries are stained red (Lectin UEA). In obesity, capillary density is decreased in subcutaneous adipose tissue. Obese (C) adipose tissue and lean (D) adipose tissue have different capillary density. Adipocyte plasmalemma is stained green with Lectin-GS, and capillaries are stained red (Lectin UEA).
(Methods are presented in reference 59.)
Human adipose tissue is innervated with sympathetic nerve system (SNS) nerve terminals, which are important for the activation of lipolysis. E, Fluorescent immunohistochemistry of nerve fibers (neural specific antibody) in white adipose tissue. F, SNS-specific staining with tyrosine hydroxylase. (E and F are reprinted from Giordano209 with permission.)
Obesity usually is characterized by increased circulating plasma free fatty acid concentrations. Studies in animals and humans support a causal effect of elevated free fatty acids (produced by lipolysis of triglycerides from adipose tissue) on impaired insulin-mediated glucose metabolism.9–12 Such studies reinforce the original hypothesis proposed by Randle et al in 196313,14 that altered fatty acid metabolism is the key contributing factor to insulin resistance in obese and diabetic patients. Randle and colleagues demonstrated that free fatty acids compete with glucose for substrate oxidation in isolated preparations of heart and diaphragm muscle from rats. More specifically, they proposed that increased fatty acid availability in obesity causes an increase in the intramitochondrial acetyl–coenzyme A (CoA)/CoA and NADH/NAD+ ratios, leading to inactivation of the enzyme pyruvate dehydrogenase. This in turn causes an intracellular increase in citrate concentration, leading to inhibition of phosphofructokinase, the rate-limiting enzyme for glycolysis. As a consequence, glucose-6-phosphate accumulates in the cell and inhibits hexokinase II activity, leading to an increase in intracellular glucose and a decrease in glucose uptake, oxidation, and storage.
First, Wolfe15 identified some of the flaws in the notion that fatty acid availability controls substrate oxidation in the fasting state. He provided evidence that fatty acid oxidation is largely controlled at the site of oxidation, which, in turn, is determined by the availability of glucose. In this model, the primary physiologic role of increased adipose lipolysis in fasting conditions is to provide the necessary glycerol as a gluconeogenic precursor16; the rate of fatty acid oxidation then is regulated by the rate of intracellular metabolism of glucose.
Second, it now is well accepted that skeletal muscle predominantly relies on lipid oxidation during fasting and can easily switch from lipid to increased glucose uptake and oxidation in response to feeding and hyperinsulinemia.17 This switch from fat to carbohydrate oxidation in skeletal muscle has been called metabolic flexibility. It is important to note that Kelley and Mandarino provided convincing evidence that glucose oxidation is increased in the leg of subjects with type 2 diabetes, thereby decreasing its reliance on fat oxidation.18 In opposition to Randle’s glucose–fatty acid cycle, their series of studies suggest that hyperglycemia itself causes an impairment of the normal fasting reliance of skeletal muscle on fatty acids, thereby causing an accumulation of lipids into the muscle tissue. This reversed Randle cycle theory highlights the primary role of impaired lipid oxidation in skeletal muscle rather than excessive lipolysis in the adipose tissue. Growing evidence suggests that the primary cause of the metabolic inflexibility noted in subjects susceptible to insulin resistance is impaired fat oxidation in the fasting state rather than a lack of increased carbohydrate oxidation in response to feeding.19 In support of this concept, evidence now points toward decreased mitochondrial oxidative capacity in insulin-resistant subjects with diabetes20 or a family history of diabetes21 and in insulin-resistant older individuals.22
To prove or disprove the “Randle cycle” hypothesis, Shulman and colleagues23 went one step further. If the Randle hypothesis was true, one would predict an accumulation of glucose-6-phosphate in the skeletal muscle of healthy subjects during glucose and insulin infusions in the presence of high plasma free fatty acid concentration. They directly tested this hypothesis using magnetic resonance spectroscopy. As was expected, high concentrations of circulating free fatty acids caused a reduction in insulin-mediated glucose uptake, with an approximately 50% decrease in glucose storage and a 50% decrease in glucose oxidation.11 However, in contrast to what would be predicted by Randle’s hypothesis, no accumulation of glucose-6-phosphate occurred. Therefore, reduced glucose uptake when free fatty acids are high is due to impaired glucose transport or impaired intracellular signaling. This series of studies shows that intramuscular fatty acids or fatty acid metabolites seem to interfere with the transport of glucose into skeletal muscle cells. Studies have provided some potential mechanisms for the effects of free fatty acid–induced insulin resistance via an impact on insulin signaling at the level of protein kinase C.24–27 More recently, however, Koves et al28 using targeted metabolomics found that obesity-related insulin resistance in skeletal muscle is characterized by excessive β oxidation, impaired switching to carbohydrate during the fasted-to-fed transition, and simultaneous depletion of organic intermediates of the tricarboxylic acid cycle. Therefore, excessive rather than reduced β oxidation underlies the development of muscle insulin resistance by accumulation of acyl-CoAs and their respective acyl-carnitines.28
Although many studies have provided evidence for an association between insulin sensitivity and visceral fat mass (reviewed in reference 29), other studies provide as good evidence for an association between the amount of subcutaneous fat on the trunk and insulin resistance in obese nondiabetic men30,31 and in men with type 2 diabetes.18,32,33 Similarly, insulin resistance in obese women is better related to overall elevated fat mass than to just visceral fat mass.34,35 Thus, subcutaneous fat, which does not drain into the portal vein, causes insulin resistance through a nonportal mechanism. Growing experimental evidence, which does not support the Randle/portal hypothesis, therefore calls for a change in the scientific paradigm to explain the insulin resistance so common in obesity. The bulk of the literature now provides evidence that excessive total fat mass (rather than just visceral fat mass) and impaired muscle fat oxidation are associated with insulin resistance and increased risk for the development of type 2 diabetes. Some of our own studies have clearly shown that gluteal adipose tissue may be protective against insulin resistance rather than precipitating it.36
Links Between Obesity, Inflammation, and ER Stress (see Figs. 11-1 and 11-2)
Studies of murine adipocyte differentiation have revealed an intermediate developmental phenotype between the preadipocyte and the adipocyte that Cousin et al.37 termed the adipiphage, a cell intermediate between the adipocyte and a macrophage. This relationship is not surprising in light of the similarities in gene expression profiles between the two cell types. The macrophage is responsible for consuming extracellular bacteria, cellular debris, and lipids, whereas the adipocyte is responsible for internalizing and sequestering excess lipids. Studies in mice and humans have suggested that adipose tissue contains not only adipocytes and supporting cells, but also macrophages.38,39 The macrophages appear to serve as the major site of TNF secretion and may secrete other cytokines such as interleukin (IL)-8,40,41 an atherogenic cytokine produced in adipose tissue. These studies have also suggested that the bone marrow was the major site of origin for adipose tissue macrophages, indicating that obesity and diabetes might recruit these cells through the production of one or more chemokines.42 The significance of the inflammatory cells is that they, like TNF-α, are likely to activate the NF-κb signaling cascade. Iκκ-β, the upstream activator of NF-κb signaling, plays a key role in insulin signaling and is necessary for the full expression of the insulin-resistant phenotype in the obese ob/ob mouse.43 Upstream activators of this pathway include not only TNF-α, but also fatty acids44 and bacterial lipopolysaccharide. Fatty acids activate this pathway via the Toll-receptor 4, which also responds to lipopolysaccharide.44 In vivo studies in mice43 and humans45 demonstrate that salicylates, inhibitors of the Iκκ-β pathway,46 play an important therapeutic role in insulin resistance and diabetes,47 in part through adipocyte-mediated pathways.48,49 The antidiabetic peroxisome-proliferator–activated receptor (PPAR-γ) ligands (e.g., thiazolidinediones [TZDs]) also decrease the gene transcriptional effects of the Iκκ-β pathway.50
Many more inflammatory cytokines such as monocyte chemoattractant protein-1 (MCP-1) and plasminogen activator protein (PAI) have been linked to adiposity. The increase in inflammatory cytokines found in obesity ultimately characterizes excess adipose tissue as a state of low-grade systemic inflammation, which may link obesity to its comorbidities.51 Obesity therefore occurs in association with an increase in inflammatory cytokines and an infiltration of macrophages within the adipose tissue. Two of the major unsolved questions regarding this observation are these: Why does inflammation occur in parallel with obesity? What is the consequence of this inflammation? One of the growing hypotheses first proposed by Trayhurn’s group52 and recently reviewed53,54 is that inflammation is likely the result of reduced oxygenation (hypoxia; see Figs. 11-1, 11-2, and 11-3) in adipose tissue, which may provide cellular mechanisms for macrophage infiltration, reduced adiponectin secretion, increased leptin secretion, adipocyte death, ER stress, and mitochondrial dysfunction55 in white adipose tissue in obesity.56–58 Inhibition of adipogenesis and triglyceride synthesis by hypoxia may be a mechanism for elevating plasma free fatty acids and reducing adiponectin concentrations, both of which lead to insulin resistance in obesity.56,57 The biological basis for adipose tissue hypoxia could be related to a reduction in arterial blood flow as a result of adipocytes outgrowing their blood supply (Fig. 11-3). A failure to maintain blood flow or a reduction in capillary density (lack of compensatory angiogenesis) or vasoconstriction may serve as the basis for the reduction in blood flow observed in human adipose tissue.53 The hypothesis that increased adipose tissue mass in obesity without adequate support of vascularization might lead to hypoxia, macrophage infiltration, and inflammation was recently confirmed in human studies.59
FIGURE 11-3 Hypoxia, inflammation, and insulin resistance.
(This figure is adapted from a recent review by Ye.53)
Rapid growth of adipose tissue leads to an expansion that may not be accompanied by a simultaneous maintenance of capillary density through increased angiogenesis or vasodilation and therefore a decrease in blood flow to the tissue. Decreased blood flow per unit of adipose tissue leads to tissue hypoxia, which, in turn, induces inflammation. When inflammation becomes out of control with increased systemic and local cytokine concentrations, insulin resistance occurs. Adipose hypoxia therefore is a signal for the remodeling of adipose tissue.
Over the past few years, publications have provided growing evidence suggesting that ER stress may play a role in the pathogenesis of type 2 diabetes.60 The ER is a highly dynamic organelle with a central role in lipid and protein biosynthesis. It produces the transmembrane proteins and lipids for most cell organelles and is responsible for the synthesis of almost all secreted proteins. After translation of proteins is performed by ribosomes on the cytosolic surface of the ER, the unfolded polypeptide chains are translocated into the ER lumen, where numerous chaperone proteins are crucial for the proper folding of proteins and protein complexes.61
However, the ER is exquisitely sensitive to alterations in homeostasis, and proteins formed in the ER may fail to attain proper conformation owing to (1) lack of chaperones or energy to promote chaperone–protein interactions, (2) calcium depletion, (3) disruption of the redox state, (4) protein mutations that hamper adequate folding, and (5) reduction of disulfide bonds.60 ER stress is also called the unfolded protein response (UPR). Lipotoxicity and glucotoxicity as seen in prediabetes and diabetes are triggers of ER stress.
Excess free fatty acids as seen in obesity activate the ER stress response in β cells, eventually causing apoptosis.62 Recent data suggest that hypoxia in adipose tissue of obese mice and people may contribute to the induction of ER stress, thereby affecting adipokine production. For example, adiponectin expression was decreased in adipose tissue from high-fat–fed KKAy mice.63 Evidence for the role of ER stress in human tissues such as pancreas, muscle, and adipose is presently not available. Similarly, increases in expression and phosphorylation of stress-activated kinases such as p38 and JNK were detected in omental adipose tissue from obese women compared with lean controls.64 Over the next few years, research in this area should lead to a better understanding of the interaction between obesity, inflammation, hypoxia, and ER stress.
Link Between too Little Fat and Insulin Resistance
At the other end of the spectrum from obesity, it is now recognized that a lack of adipose tissue is associated with insulin resistance and increased risk for development of type 2 diabetes (see Chapter 12). Lipodystrophy in humans is an acquired or hereditary syndrome characterized by decreased adipose tissue mass, insulin resistance, and often diabetes mellitus.65–68 In these patients, insufficient adipose tissue mass leads to excess energy storage as triglycerides in liver and skeletal muscle and causes insulin resistance in these tissues.69,70 Genetic manipulation causing ablation of adipose tissue in mice supports the link between adipose deficiency and insulin resistance. Transgenic animals without adipose tissue store lipid in skeletal muscle and liver and develop insulin resistance, glucose intolerance, and eventually diabetes.71–73 This is identical to the fatty liver and muscle seen in obesity and type 2 diabetes. Furthermore, transplantation of adipose tissue back into lipoatrophic animals reverses the elevated glucose levels.74 However, transplantation of adipose tissue from leptin-deficient mice (ob/ob) did not improve the metabolic abnormalities, indicating that the sequestration of triglyceride into adipose tissue is not entirely sufficient to restore insulin sensitivity.75 In humans, treatment of lipodystrophic patients with leptin can dramatically reverse the fatty liver and insulin resistance.76–78 On the other hand, surgical removal of adipose tissue causes the metabolic syndrome.79 Together, these studies demonstrate that, as in obesity, inadequate adipose tissue mass leads to ectopic fat storage and metabolic disturbances. Too little fat therefore is as deleterious as too much fat and predisposes to the development of the metabolic syndrome with insulin resistance and ultimately type 2 diabetes. Three new paradigms may explain insulin resistance:
1. The ectopic fat storage syndrome, in which excess fat is deposited in tissues other than adipose tissue with functional disturbances noted in these tissues
2. The endocrine adipocyte, which secretes hormones involved in insulin resistance and cardiovascular disease
3. The inflammatory adipose tissue, with adipose tissue macrophage infiltration and macrophage activation leading to dysregulation of adipocyte lipid metabolism and adipokine secretion
Obesity Is Another Ectopic Fat Storage Syndrome
Positive energy balance in our “obesigenic” environment produces a pattern similar to lipodystrophy in humans, that is, excess lipid storage in liver80 and skeletal muscle,23,81,82 followed by insulin resistance, glucose intolerance, and diabetes. However, in contrast to lipodystrophic patients, adipose tissue stores are adequate or even large in obese patients, suggesting that the size of adipose tissue becomes inadequate to sequester dietary lipid away from liver, skeletal muscle, and pancreas. The adipocyte becomes hypertrophic and is unable to recruit and/or differentiate new adipocytes to store the excessive dietary fat.83 The Danforth hypothesis is supported by the fact that, independent of total fat mass, individuals with larger fat cells are at higher risk of developing type 2 diabetes than are individuals with smaller fat cells.84 Furthermore, TZDs improve insulin resistance in part by promoting the differentiation of new fat cells in subcutaneous adipose tissue through activation of PPAR-γ, thereby providing extra storage capacity for dietary fat.85,86 Adipogenesis translates into a gain in subcutaneous adipose tissue87 and a decrease in lipid infiltration in skeletal muscle and liver.88,89 Through the upregulation of genes in the lipid storage and synthesis pathways in adipose tissue, TZDs also decrease free fatty acids, providing a second mechanism for protection of liver, muscle, and the cell from fatty acids.90–92 As is discussed later in this chapter, drugs may be designed to decrease ectopic fat storage by increasing adipogenesis and/or increasing fat oxidation, leading to improved insulin action. Weight gain in humans is probably due to an increase in food intake consistent with the action of the PPAR-γ agonists in increasing food intake.93,94
Adipose Tissue: Hypertrophy vs. Hyperplasia
Historically, adipose tissue was viewed as an inert tissue with a singular function: lipid storage. The main areas of research in the field of adipose tissue were related to adipocyte size and number, as well as to lipid synthesis, adrenergic regulation of lipolysis, and insulin signaling in isolated adipocytes. In adults, obesity is associated with an increase in both the number and the size of adipocytes95,96 (Fig. 11-4). The increase in fat cell size (hypertrophy) is thought to reflect an imbalance between adipocyte lipid uptake or synthesis and the release of lipid via lipolytic pathways. In addition to increased adipocyte size, obese individuals have an increase in the absolute number of adipocytes (hyperplasia). Early studies demonstrated heterogeneity in fat cell size; some obese patients have adipocytes as large as 1 mL, and others have very small fat cells. This heterogeneity led to the concept of hypertrophic or hyperplastic obesity based on the average size of fat cells (see Fig. 11-4). In contrast to this dichotomous viewpoint, the reality is that obese individuals cannot be grouped into such simple categories. There is a continuous distribution of fat cell size, and most obese patients have both hypertrophy and hyperplasia. Increased fat cell size is correlated positively with fasting insulin and negatively with insulin sensitivity.97 In Pima Indians, increased abdominal adipocyte size is associated with insulin resistance,84,98 a potential inherited trait99 that predicts the onset of type 2 diabetes.84 Together, these data suggest that increased fat cell size is important to whole body metabolism and insulin action.
FIGURE 11-4 Hyperplastic versus hypertrophic obesity. Adipocytes are derived from mesenchymal stem cell precursors (see Fig. 11-7). Both mesenchymal precursors and the preadipocyte, whose differentiation potential is limited to the adipocyte lineage, can undergo mitosis. Hyperplastic obesity (A) is defined by an increase in the number of adipocytes, while adipocyte size remains small. Hypertrophic obesity (B) is characterized by larger adipocytes. The reason for the increase in adipocyte size is unclear. Current hypotheses suggest that failure of the large adipocyte to recruit preadipocytes to differentiate may play a role in the development of insulin resistance, a precursor to overt β cell failure as manifested by diabetes. (Photomicrographs courtesy of Prof. Saverio Cinti, MD, Institute of Anatomy, Faculty of Medicine, University of Ancona, Italy.)
There are several ways of thinking about why fat cells might be large in obese individuals. First, adult adipose tissue has been viewed as a nonmitotic tissue, and increases in adipocyte size might simply reflect an imbalance between storage and lipolysis. If the number of adipocytes is considered fixed, any increase in adipose tissue mass is the result of increased lipid storage in adipocytes. A second view is that fat cells can be recruited continually to differentiate into mature lipid-storing fat cells, and large fat cells are an indication of the failure of this process. Several investigators have proposed that once adipocytes are filled to a certain degree, new fat cells are recruited, and lipid then is stored in these new insulin-sensitive and lipid-hungry adipocytes. The cross-sectional data used to support this model are presented in Fig. 11-5. Average fat cell size increases as body fatness increases up to a certain point, after which increased adiposity does not result in an increase in fat cell size. Even if individuals with hyperplastic or hypertrophic obesity lose weight equally, hyperplastic obese patients regain the weight much more quickly than do hypertrophic subjects, lending support for the concept of small lipid-hungry fat cells100 (Fig. 11-6). During weight loss, fat cell size decreases without a change in fat cell number but with a decrease in fasting insulin.97 This has been interpreted as evidence that once a fat cell is formed, it is permanent. However, recent studies demonstrate a relatively high rate of adipocyte turnover101 and evidence for regulation of apoptosis.102 It should be noted that longitudinal data and precise measures of fat cell number are not sufficient to confirm this model in humans. This in part is the result of our current inability to accurately quantify the numbers of stem cells and preadipocytes in adipose tissue in vitro or in vivo, and it is associated with the difficulties involved in quantifying the very smallest fat cells in adipose tissue.103
FIGURE 11-5 Schematic relationship between age, body fat mass, and fat cell size/number in childhood. A, Whole body fat cell number remains constant during the first year of life and then increases over time.
(A and B adapted from the data from Hager105 and Soriguer Escofet.106)
A wide range of fat cell size and number across individuals is indicated by the dashed lines. B, The increase in body fat that is seen during the first year of life occurs primarily as a result of increased lipid storage and hypertrophy of existing adipocytes rather than through the recruitment of preadipocytes.
FIGURE 11-6 Schematic relationship between body fat mass and fat cell size/number in adulthood. A, In adults, whole body fat cell number increases with increasing body mass (hyperplasia). B, Again in adults, cross-sectional data show a positive correlation between body fat mass and fat cell size at lower body fat mass (solid line) until fat cell size reaches a plateau at higher levels of fat mass. At this point, fat cell size cannot increase any further because of (1) limitations in lipid storage for unknown reasons, and/or (2) recruitment of existing preadipocytes to differentiate and store lipid, and/or (3) proliferation and differentiation of mesenchymal precursor cells into mature lipid-storing adipocytes. If fat cell proliferation, differentiation, and/or recruitment did not occur, fat cell size would continue to increase as fat mass increased. A wide range of fat cell size and number across individuals is indicated by the dashed lines. Fat cell number does not appear to change with weight gain or loss; however, precise tools are not available to quantify small changes in adipocyte number in vivo in humans. (Data from Hirsch J, Batchelor B: Adipose tissue cellularity in human obesity, Clin Endocrinol Metab 1976;5:299–311.)
In contrast, the cross-sectional data illustrated in Fig. 11-6 could be interpreted as evidence for the recruitment of new adipocytes. If fat cell hypertrophy was the only way to gain fat, then fat cell size would increase linearly with fat mass. This is not the case. Based on cross-sectional data, the point at which hypertrophy recruits new fat cells probably occurs at a cell volume between 0.8 and 1.0 mL.104–106 Two additional pieces of evidence support the view that recruitment of new fat cells occurs in vivo in humans. First, when adipose tissue is separated into fat cells and the remaining cell populations (stromal-vascular fraction), adipocytic precursor cells from the stromal-vascular fraction are able to differentiate in vitro into mature lipid-storing adipocytes throughout life and into old age. Obesity and age are determinants of the capacity to differentiate adipocytes in vitro.107,108 Recent studies of in vivo DNA synthesis in humans suggest that adipocyte turnover is high in adult humans with a ranging from 240 to 425 days.101,109 In addition, recent work suggests that the large fat cells secrete a factor or factor(s) that promote adipocyte proliferation and differentiation—a finding that is consistent with the recruitment of new adipocytes by hypertrophic adipocytes, as was discussed earlier.110
Studies by Hirsch and others in rodents demonstrated that animals that were calorically deprived before weaning had a reduced total number of fat cells when compared with animals that were suckled in smaller litters with higher caloric intake. Similarly, about one half of the obesity in Zucker fatty rats can be prevented by early restriction of energy.111 This gave rise to the concept that early overfeeding during adipose tissue development might increase the population of adipocytes and their precursors that produce obesity over time. This model, known as the adipose cell or critical period hypothesis, predicts that a large number of adipocyte precursors early in life could lead to the development of obesity by providing a “sink” destined to be filled with lipid. A corollary to this concept is that individuals with a reduction in adipocyte precursors, similar to those individuals with failure of adipocyte differentiation as described earlier, would be predisposed to the development of diabetes when food intake is increased, as their storage capacity for excess fat is diminished.
Although the concept of an early life critical period for adipocyte precursor development has been much discussed, by comparison the actual data supporting this concept are sparse. Consistent with this concept, obese subjects with an early childhood onset of obesity tend to have smaller fat cells when compared with those with later adult onset of obesity.112,113 Similarly, children of mothers who were energy deprived during the Dutch famine of 1945 had a lower incidence of obesity in adulthood.114 Although no prospective long-term data exist to support the adipose cell hypothesis, the cross-sectional data support the concept that in many cases of early-onset obesity, adipose tissue size tends to be hyperplastic rather than hypertrophic; the latter is seen with late-onset obesity.
The original data and hypothesis presented by Hirsch suggested a single early critical period; later discussions offered the concept that additional critical periods of adipocyte precursor proliferation might exist,96 with recruitment from the precursor pools into mature adipocytes throughout life. At birth, a typical infant has about 4 billion observable fat cells, and this number increases to approximately 10 to 40 billion in lean individuals and up to 50 to 100 billion in obese patients,115 supporting the concept of ongoing adipocyte proliferation and/or recruitment throughout life. In contrast to rodents, humans have a long, slow growth and development period (neotony) and are likely to have several critical periods of adipocyte development.116
Body fat mass increases during the first year of life, most often through fat cell hypertrophy. After the first year, the number of adipocytes increases, the fat cell size remains relatively constant, and whole body adiposity (% fat) decreases. At about 6 years of age, % body fat begins to increase again. This has been termed the adiposity rebound. Longitudinal body weight data in children demonstrate that an earlier adiposity rebound is associated with obesity in adulthood.117–119 Although no detailed information is available on the relative role of hypertrophy versus hyperplasia for this age range, the adiposity rebound is considered a critical period for adiposity later in life.120
Regulation of Adipogenesis
• Adipocyte precursor proliferation
• Differentiation of these precursors into mature insulin-sensitive, lipid-storing adipocytes
• The balance of lipid storage, utilization, and release within each mature adipocyte
Adipocytes can be classified based on anatomic location as subcutaneous, visceral (intraperitoneal), bone marrow, and structural (periorbital, palms of the hands and soles of the feet). The hereditary and acquired lipodystrophies teach us that each of these depots of adipose tissue is developed or regulated differently, as each form of lipodystrophy results in loss or failure to differentiate in specific depots. For example, in congenital generalized lipodystrophy, mechanical adipose tissue of the palms and soles is spared.121
Adipose tissue precursors are primarily mesenchymal in origin (Fig. 11-7). These precursor cells, also known as preadipocytes or stromal cells, have the capacity to differentiate into a limited number of cell types, including adipocytes, osteoblasts, and chondrocytes.122 At least two distinct subtypes of preadipocytes have been identified (reviewed in reference 123). These two subtypes, probably distinct from the white adipose tissue/brown adipose tissue switch described later, differ in their capacity for replication, differentiation, and susceptibility to TNF-α-induced apoptosis. Subcutaneous adipose tissue preadipocyte precursors replicate faster and differentiate better than omental precursors. Evidence suggests that omental and mesenteric adipose tissue preadipocytes differ as well.124,125 These differences in preadipocyte characteristics are postulated to influence the propensity of an individual to store fat in the visceral versus subcutaneous depots. Transcriptome analysis of subcutaneous and visceral adipose tissue reveals a distinct pattern of expression of many genes; not only between depots but also across body mass indices (BMI).126,127 In addition, major differences have been noted in the expression of developmental genes in subcutaneous versus visceral adipose tissue. Taken together with the cellular phenotypes identified by Kirkland’s laboratory,128 this suggests that different cell types contribute to differences in the function of each adipose tissue region, and these differences can be explained by developmental programming. In addition to these developments in the different types of preadipocytes, the origins of the preadipocyte are becoming clearer. Recent work involving multiple tissues, including adipose tissue, suggests that pericytes—cells that lie just outside the capillary—are a major source of mesenchymal stem cells and preadipocytes.129,130
FIGURE 11-7 Adipocyte differentiation cascade. Adipocytes are derived from mesenchymal stem cell precursors (MSCs). Both the mesenchymal precursors and the preadipocyte, whose differentiation potential is limited to the adipocyte lineage, can undergo mitosis. The middle panel depicts the coordinate, sequential activation of the major nuclear transcription factors thought to be involved in the adipogenic differentiation process. PPAR-γ is considered an obligatory “master” regulator of adipogenesis. The PPAR-γ system turns on genes involved in lipid synthesis and insulin action (see text for details).
We know very little about the systems that control proliferation of adipose tissue precursors. Most of what we know is derived from the study of the cellularity of rodent adipose tissue or the behavior of stromal-vascular cultures in vitro. Some of the known activators and inhibitors of adipogenesis are presented in Table 11-1. For example, insulin-like growth factor-1 (IGF-1), a growth factor under the control of insulin and growth hormone in adipose tissue, promotes the proliferation and differentiation of preadipocytes, while transforming growth factor (TGF) inhibits proliferation.131 More is known about the processes whereby adipocyte precursors, particularly 3T3-L1 preadipocytes, proceed along the pathway from precursor to mature adipocyte. We now know that a series of transcription factors coordinately regulate multiple genes in a tightly regulated temporal fashion. As is shown in Fig. 11-7, each of these transcription factors forms a nonredundant network that, once initiated, leads to the emergence of the adipocyte phenotype. Some of the known key transcription factors include PPAR-γ, STAT5, C/EBP/α, and SREBP1c/ADD, CREB, and Wnt/frizzled. In addition, a new family of proteins—the krüppel-like factors—has been identified as regulators of adipocyte differentiation.132
Table 11-1
Multiple hormones, cytokines, growth factors, cell cycle regulators, and adhesion molecules control this differentiation cascade. Classic studies by Green and others showed that when confluent, clonal cell lines such as 3T3-L1 and F442A differentiate into adipocytes if exposed to a cocktail of insulin, dexamethasone, and isomethylbutylxanthine (IBMX).133–135 Emphasis has also been placed on the role of cell cycle and the necessity for proliferation prior to differentiation of precursors. However, recent data suggest that this has more to do with the E2F transcription factors than with the process of mitosis per se.136,137
IBMX and other agents that increase cyclic adenosine monophosphatase (cAMP) act through the transcription factor CREB.138 Several transcription factors are critical for the conversion of cells from a fibroblastic phenotype to an adipocytic phenotype. PPAR-γ has received the most attention, and this is warranted since overexpression of PPAR-γ into fibroblastic cell types is sufficient to confer the adipocytic phenotype.139 There are several putative endogenous ligands for PPAR-γ, including the prostaglandin PGJ2,140,141 long-chain fatty acids, and 13-HODE and 15-HETE, which can be generated from linoleic and arachidonic acids, respectively, by a 12/15-lipoxygenase.142 All of these compounds can activate the PPAR-γ transcription factor that heterodimerizes with the RXR transcription factor to turn on genes in the glucose uptake,143,144 lipid uptake,145 and lipid synthesis pathways.146,147 The true endogenous ligands are unknown, but their synthesis/activity appears to be downstream of the C/EBP-β transcription factor.148 C/EBP-α is expressed contemporaneously with PPAR-γ and facilitates the full adipocytic phenotype. Immediately upstream of PPAR-γ lie the C/EBP transcription factors C/EBP-β and C/EBP-δ, which upregulate PPAR-γ. Other transcriptional promoters of adipogenesis include STAT 5,149 the glucocorticoid receptor, and ADD/SREBP-1c.150 Transcriptional inhibitors include GATA 3,151 TCF/LEF, and the Wnt pathway.152 Combined with the transcriptional activators, they cooperate in an orchestrated cascade of transcriptional events leading to a mature adipocyte.
Last, PPAR-γ cofactors may regulate the ultimate transcriptional program in adipocytes. For example, adipocytes can be converted from energy storage to energy consumers by the PPAR-γ cofactor PGC-1a.153 Similarly, the PPAR-γ cofactors SRC-1 and TIF2 may determine the responses of adipose tissue to high-fat diets, with SRC-1 activating fatty acid oxidation and TIF2 promoting lipid storage.154 These two examples highlight a growing understanding that not only the ligand but also the transcription factors and cofactors are important in whole body metabolism. The intracellular transcriptional control system is regulated by extracellular signals from cytokines, hormones, neural inputs, and the autocrine/paracrine production of ligands for these transcription factors.
Adipocytes and indeed virtually all other cells store neutral lipids such as triglycerides in droplets of varying sizes. These droplets are formed as triglyceride is synthesized in the endoplasmic reticulum or is taken into the cell from the plasma membrane. Lipid droplets are coated by a layer of phospholipids and proteins that serve to sequester the neutral lipids from the cytosol and to regulate the access of lipases to the surface of the lipid droplet. Substantial progress has been made in the identification of these lipid coat proteins since the initial discovery of perilipin and other members of the perilipin family (Perilipin, Adipophilin, S3-12, and TIP-47 [PAT]).155 Consistent with their functional role, the structure of these proteins is highly conserved with both hydrophilic and hydrophobic domains. In adipose tissue, each PAT protein plays a distinct role, contributing to lipid synthesis or lipolysis. For example, perilipin-A is phosphorylated by PKA and PKG, which allows docking of lipases and the initiation of lipolysis.156 On the synthesis side, the repertoire of lipid droplet proteins changes as the lipid droplet is formed and matures, demonstrating the on-off exchange of these proteins and the dynamic nature of the process for formation and movement of lipid droplets. Once again, the biology is showing us that the adipocyte is not a static, inert tissue but rather participates as an active organ in the regulation of metabolism via lipid droplets, which are dynamic organelles in their own right. Lipid droplet proteins may play an important role in lipid oxidation independent of their role in lipolysis. A novel PAT protein, LDRP5 (also called OXPAT or Mldp) appears to be important for activating lipid oxidation in oxidative tissues such as cardiac myocytes.157
Brown Adipose Tissue in Humans
Brown adipose tissue (BAT) is an exquisitely designed tissue/organ system that has evolved for the maintenance of body temperature. It is characterized by smaller cells with large quantities of mitochondria and small lipid droplets, providing the potential for high cellular metabolism. At the metabolic, protein, and transcription levels, the BAT is upregulated principally by the sympathetic nervous system when production of heat is needed to maintain body temperature. Years ago, Nicholls and Ricquier158,159 described a mechanism for heat production based upon a specific highly abundant protein (uncoupling protein 1; Ucp1) in the inner mitochondria of brown adipocytes that uncouples the production of chemical energy as adenosine triphosphate (ATP) from oxidative phosphorylation and instead produces heat.
Until recently, BAT has been thought to be most important for maintaining body temperature in small mammals and infants, but a function in the physiology of adult humans was dismissed because of low numbers of brown adipocytes.160,161 However, unrelated pursuits in nuclear medicine using positron emission tomography (PET)/computed tomography (CT) scanning techniques have revealed the presence of BAT in adult humans, especially after cold exposure.162,163 The question now is how can we induce this amazing organ not only to generate heat but also to enhance fat oxidation and thereby reduce obesity.
Although the normal function of brown fat thermogenesis may be specific for the regulation of body temperature, many genetic and pharmacologic studies in rodents have shown that constitutive overexpression of Ucp1 in white fat and skeletal muscle can drastically reduce both genetic and diet-induced obesity, offering therefore a new safe molecular target for the treatment of obesity.164–166 This potential for brown fat adaptive thermogenesis as a drug target for obesity has not been ignored by the pharmaceutical industry. Unfortunately, many candidate agonists of the β3-adrenergic receptor have failed in human clinical trials, even though these drugs have been efficacious in rodent models of obesity. What is different in the human and in the mouse?
Most of the effects of genetic, pharmaceutical, or cold-induced upregulation of Ucp1 in the mouse models result in the emergence of new brown adipocytes in white fat depots with levels of Ucp1 upregulated several-hundred fold (Fig. 11-8). Unfortunately, human white adipose tissue does not appear to be able to mount such transient induction of brown adipocytes. The failure of brown fat thermogenesis in humans appears to be based on the lack of fundamental information on the mechanisms controlling the developmental origins of brown adipocytes within discrete brown fat depots (e.g., interscapular brown fat) and on the small number of diffusely localized brown adipocytes in various white fat depots. However, a recent paper from the Spiegelman group167 elegantly describes a novel transcription factor PRDM16, whose presence can promote the differentiation of preadipocytes and myoblasts into brown adipocytes, and whose absence promotes the myogenic differentiation program (see Fig. 11-8). It is important to note that the ability of PRDM16 to induce the brown adipocyte lineage is restricted to discrete brown fat depots, such as those found in the interscapular region, but it does not participate in induction of the diffuse brown adipocytes located in the white fat depots. The data support the concept that interscapular BAT and brown adipocytes in white fat have separate independent developmental origins.168 PRDM16 is clearly an important player in brown adipogenesis but may not be sufficient, since PRDM16 KO mice have significant levels of interscapular fat with Ucp1 expression.167 However, one does not know whether upregulation of PRDM16 in humans can induce increased discrete brown adipose tissue and/or diffuse brown adipocytes.
FIGURE 11-8 Brown adipose tissue in humans. Mesenchymal stem cells can have two major pathways, one into preadipocytes and another into progenitor cells of brown adipocytes or skeletal muscle cells. Bone morphorgenetic protein 7170 activates a full program of brown adipogenesis, including induction of early regulators of brown fat PRDM16 and PGC-1α.167 In absence of PRDM16, these progenitor cells are transformed into skeletal muscle cells. Preadipocytes are differentiated into white adipocytes in subcutaneous and visceral adipose tissue. By stimulation of adrenergic signaling, some of these white adipocytes can be transformed into brown adipocytes defused in the white adipose tissue. On the other hand, discrete brown adipocytes are concentrated in brown adipose tissue depots such as in the neck and supraclavicular, paravertebral, and suprarenal regions. The recently discovered brown adipocyte tissue regulator PRDM16167 is responsible, at least in rodents, only for the generation of discrete brown adipose tissue.
Although the regulator PRDM16 has provided important insights into the developmental origins of discrete brown fat depots, the next important step will be to determine the origin(s) of diffusely localized brown adipocytes in white fat depots at least in rodents. Diffuse BAT adipogenesis is more closely related to increased thermogenesis and reduced obesity.127 Enthusiasm for the promise of PRDM16 as a drug target needs to be tempered by the caveat that mice with an inactivated PRDM16 gene die at birth, suggesting that PRDM16 is a transcription factor with additional unknown functions in mammalian development. It has long been known that chronic increases in circulating catecholamines in patients with pheochromocytoma lead to large brown fat depots.169 These historical data, together with recent findings of discrete brown fat depots uncovered by PET technologies,162 should stimulate a renewed effort to find strategies to induce an increase in brown adipocytes, and to ask why the many previous studies with β3-agonists failed to significantly stimulate thermogenesis in humans. Maybe the lack of β3-adrenergic receptors in human white adipocytes is something that needs to be overcome to facilitate conversion of white to brown adipose tissue and to stimulate thermogenesis. It is also important to evaluate the effects of BMP7 on stimulating the enhanced expression of brown adipocytes, as recently shown by Tseng et al.170 The discovery of previously uncovered brown adipose tissue/cells in adult humans and its potential physiologic significance in cold- and dietary-induced thermogenesis should help in revamping our effort to target the molecular development of brown adipogenesis for the treatment of obesity.170a–170c
Integrative Biology of the Adipose Tissue
Appreciation of the importance of the vasculature to the proper functioning of the adipose tissue is increasing. Nutrients such as glucose, fatty acids, and proteins are supplied from the vasculature and are critical to the growth and maintenance of adipose tissue. Recent studies have focused on the supply of oxygen for oxidative metabolism in adipocytes. Current data suggest that the delivery of oxygen may be limiting in adipose tissue of obese mice. The consequences of the hypoxia are unclear, but in vitro data52 support the in vivo data,56 suggesting that hypoxia leads to chemotaxis of macrophages and inflammation. These findings were recapitulated in human adipose tissue.59 Under these circumstances, hypoxia should turn on the transcription factor HIF-1, leading to angiogenesis and a reversal of the hypoxia. This does not appear to be the case in mature adipose tissue,171,172 in which vascular endothelial growth factor (VEGF), a primary downstream transcriptional target of the HIF-1 pO2 sensing system, is not activated. Anatomically, good evidence suggests that the new blood vessels sprout from existing endothelial cells,173 and this has been co-opted in the development of ex vivo assays to clearly demonstrate that human adipose tissue is capable of sprouting/angiogenesis.174 Why the angiogenic signals are not increased when pO2 is decreased is a paradox that needs to be investigated.
In murine adipose tissue development, angiogenesis, adipogenesis, and the stromal cells interact in a way that is coordinated175,176 and relies on VEGF.177 This is different from the situation in mature hypoxic adipose tissue, highlighting the differences in mechanisms and the relative importance of growth factors in growth and development as opposed to the events that occur in mature adipose tissue. Adiponectin, secreted by small but not hypertrophic inflammatory adipocytes, stimulates angiogenesis, highlighting the interplay of adipokines, which we typically consider metabolic hormones working in concert with the growth factors classically implicated in angiogenesis.178
Endocrine Signals
Glucocorticoids: Glucocorticoid treatment of laboratory animals results in the development of obesity. Animal models of obesity invariably have increased levels of corticosterone. Adrenalectomy results in the reversal or prevention of obesity. Activation of the glucocorticoid receptor results in differentiation of preadipocyte precursors133–135
[/not-level-membership-for-endocrinology-diabetes-and-metabolism-category]
