[level-membership-for-anesthesiology-category]
Chapter 79 Pharmacokinetics, pharmacodynamics and drug monitoring in critical illness
Pharmacokinetics (PK) is the study of the absorption, distribution, metabolism and elimination (ADME) of drugs, usually by measurement of drug concentrations in blood or plasma. Pharmacodynamics (PD) is the study of the effects of a drug on the body. The pharmacokinetics of a drug is one determinant of its pharmacodynamics. Pharmacokinetic-pharmacodynamic (PK-PD) analysis seeks to summarise the behaviour of a drug in the body, to understand the sources of variability in this behaviour, and to use this knowledge to design rational, and ideally individualised, dosing regimens. The aim of this chapter is to review some basic PK and PD principles, to introduce the concepts that an intensive care physician may encounter when reading a contemporary PK-PD paper, and to consider the influence of critical illness on the pharmacokinetics and pharmacodynamics of drugs used in intensive care.
DOSE–RESPONSE RELATIONSHIPS
Most drugs exert their effects by binding to receptors1 such as an enzyme or membrane ion channel. The binding to the receptor directly or indirectly triggers a chain of biological events leading to the observable effects of the drug. The magnitude of effect is a function of:
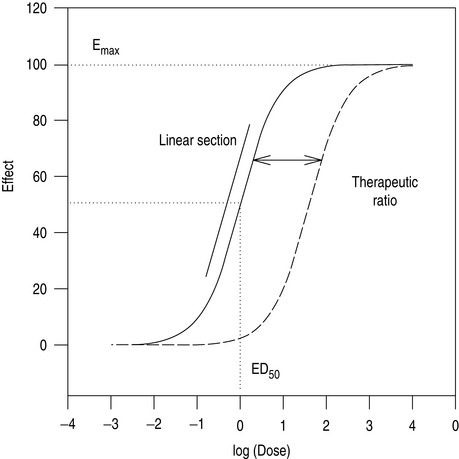
As the number of receptors present is finite, drugs have a maximum achievable effect. Classically, a plot of drug effect versus the logarithm of a wide range of doses will be described by a sigmoid-shaped dose–response curve (Figure 79.1). In practice, the range of doses used in patients is often narrower, and is confined to a smaller section of the dose–response curve.
TITRATION
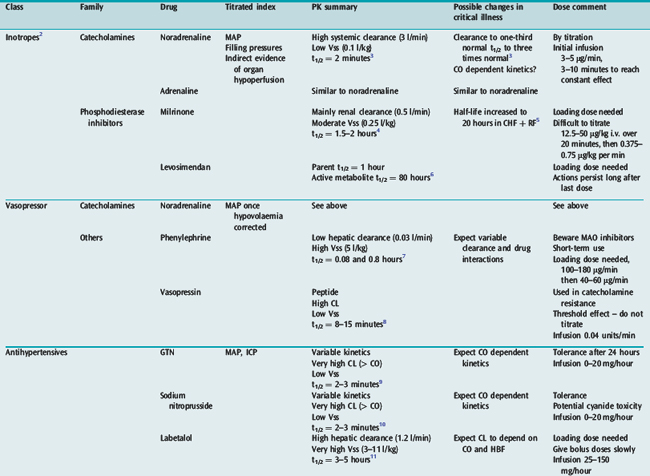
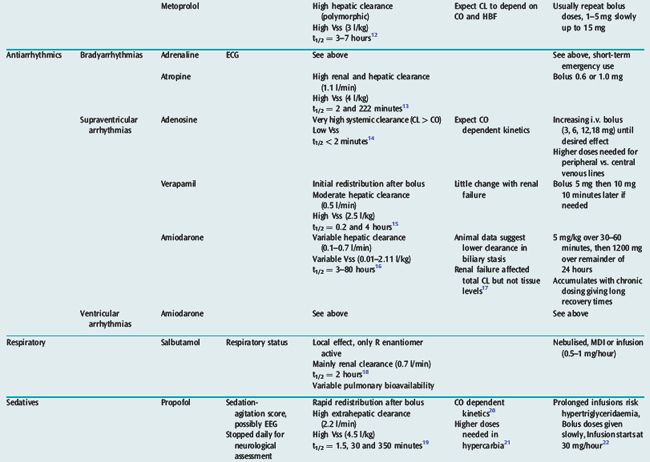
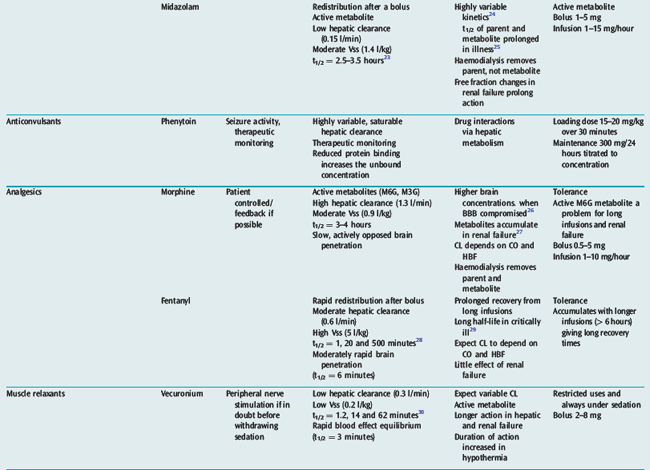
Many drugs used in intensive care have a relatively rapid onset of a directly measurable physiological effect (Table 79.1). They can therefore be used by a process of titration of dose versus effect to achieve the desired therapeutic outcome. While titration can be an empirical process, efficient titration strategies are guided by an understanding of the kinetics and dynamics of a drug. Important issues include an understanding of:

PHARMACOKINETICS
VOLUME OF DISTRIBUTION IN AN ORGAN
A drug administered to a patient will directly or indirectly enter the blood and be distributed by the blood circulation around the body. Drug enters the organs of the body via the afferent arterial blood supply. Any given molecule can then either diffuse into the organ or leave via the efferent venous blood (Figure 79.2). At steady state (when the arterial concentrations are constant and the net rates of diffusion into and out of the organ are equal), the total amount of drug in the organ (A) will often be a fixed ratio of the afferent arterial concentration (C). This ratio is known as an apparent volume of distribution (V):
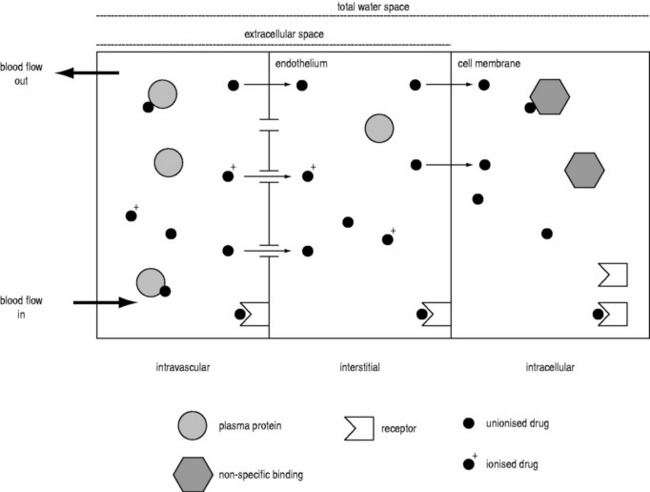

A given organ is characterised by the size of defined ‘physiological’ spaces and its relative proportions of water, lipids and drug-binding sites (Figure 79.2). The important physiological spaces are:
A drug may act on receptors in any of these spaces. The physicochemical properties of a drug dictate which physiological spaces are accessible to the drug. A drug can exist in blood in several forms: ionised or unionised (governed by the local pH and the pKa of the drug), and bound or unbound to plasma proteins.
Consequently, drugs that are highly bound or highly ionised in blood generally have smaller distribution volumes in an organ. For example, the distribution volume of propofol in the brain is less than expected based on its high lipophilicity because it is highly bound in plasma. Paradoxically, highly lipophilic drugs in general do not penetrate tissues as extensively as moderately lipophilic compounds, as high lipophilicity is correlated with high binding in plasma.33

When the diffusion rate across the endothelium and cell membranes is significantly less than organ blood flow (Q), the uptake into the organ is ‘membrane-limited’ and less affected by changes in organ blood flow. Morphine shows membrane-limited uptake into the brain.34
THE SPECIAL CASE OF THE BRAIN
Drug penetration into the brain is further restricted compared to that of other organs because of passive and active defence mechanisms collectively known as the blood–brain barrier (BBB). The passive component is the tight junctions of endothelial cells in the brain, which means that passage across the endothelium is solely by the transcellular route, and therefore restricted to lipophilic compounds. The active component is a range of transmembrane transporters. Some of these allow the uptake of endogenous compounds (e.g. amino acids and glucose). Of more pharmacological importance are a range of efflux transporters that actively pump drugs from the brain to the blood.35 The clinical significance of these transporters is currently being defined, but may be particularly important for some drugs. For example, loperamide is a potent opioid, but has no central effects at normal doses because it is excluded from the brain by P-glycoprotein.36 Similarly, the concentration of morphine in the brain is kept low by active transport. When the BBB is damaged, morphine concentrations in the brain are found to be higher.26
CLEARANCE IN AN ORGAN

HEPATIC DRUG CLEARANCE
HALF-LIFE IN THE BODY
For a given drug, each organ of the body has characteristic rates of distribution (equilibration half-life) or clearance (extraction). When these complex processes are summed together, however, the sum appears to reduce to changes in blood concentrations that can be described by one, two or three exponential functions, each with an associated half-life term. Half-lives can describe the rate of decline of the blood drug concentration following a dose, or the rate of increase in concentration during an infusion. Half-life is defined as the time taken for the drug concentration in the blood to decrease (or increase) by 50%, and when only one half-life is evident it is related to distribution volume and clearance as follows:


The distribution volume can sometimes provide information about the location of a drug in the body:38 a drug that distributes only in the intravascular space (e.g. one that is tightly bound to plasma proteins, such as indocyanine green) will have a distribution volume of about 0.075 l/kg; a drug that distributes into the extracellular space (e.g. one that is charged and cannot cross cell membrane, such as furosemide) will have a distribution volume of about 0.21 l/kg; and a drug that distributes into the total water space (e.g. one that is uncharged, lipophilic but does not bind to proteins, such as antipyrine) will have a distribution volume of about 0.6 l/kg. Drugs with higher distribution volumes can be assumed to be bound in blood and/or tissues.
PHARMACOKINETIC MODELS
There are three basic forms of pharmacokinetic models:
In a traditional pharmacokinetic analysis, the model is fitted to pooled data from a group of patients to estimate, for example, the mean clearance for the group (e.g. CL = 1.8 l/min). In contrast, the population approach is a type of modelling that fits data from individual patients simultaneously.40 It is possible to estimate not only the mean value of clearance but also its variability in the population (e.g. CL = 1.8 ± 0.2 l/min). The population pharmacokinetic approach is of particular relevance to intensive care, as it can accommodate wide inter- and intra-patient variability and does not require that all patients in a study have the same dose or blood sampling schedule.
PRACTICAL APPLICATIONS
BOLUS INJECTION RATE
Dose regimens specifying an intravenous bolus injection often do not state the time over which the bolus should be administered, and often subjective and highly variable descriptions such as ‘slow’ are used. However, the rate of injection of a bolus is often crucial in determining the magnitude of transient toxic effects. This is because rapid injections cause disproportionately high transient ‘first-pass’ concentrations in arterial blood and target organs. For example, if the peak arterial concentration after 100 mg of propofol injected over 20 seconds is 60 mg/l, it will be only 10 mg/l if it is injected over 2 minutes.39 High arterial propofol concentrations are associated with adverse haemodynamic effects.41Figure 79.3 shows a conceptual hydraulic model which illustrates ways that rapid injections transiently ‘load’ the blood and target organs with drug.
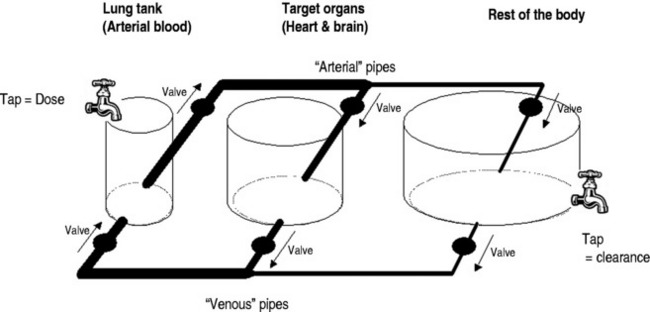
The high ‘first-pass’ concentrations achieved after a bolus injection are also inversely affected by cardiac output,39 and particular caution is required in low cardiac output states. For example, if an injection of propofol over 20 seconds into a cardiac output of 5 l/min gave a peak arterial concentration of 60 mg/l, then for a cardiac output of 10 l/min the peak concentration would be 30 mg/l, and for 2 l/min it would be 150 mg/l. The conceptual hydraulic model in Figure 79.3 can also be used to develop a mental picture of how cardiac output affects bolus kinetics. There are very few drugs for which intravenous injection over less than 2 minutes is indicated.
LOADING DOSES
Drugs with relatively long half-lives (due to large distribution volumes and/or low clearance) can take a considerable amount of time (five times the half-life) to reach steady state once a constant rate infusion is initiated. A loading dose (either a bolus or a short period of higher infusion rate) can decrease the time required to reach steady state by adding additional drug that can compensate for the drug initially being ‘lost’ from the blood into peripheral distribution volumes (see Table 79.1 for drug-specific information on loading doses).
MAINTENANCE DOSE
Once steady state has been achieved, it is traditionally taught that the steady-state blood concentrations are a function only of dose rate and drug clearance (Eq 6). However, intensivists should be aware that haemodynamic status can also significantly affect the steady-state blood concentration due to the key role of cardiac output (Figure 79.3) and blood flow-dependent clearance.37 For example, administering catecholamines during a constant rate infusion of propofol could rapidly increase the cardiac output and lower the propofol concentrations in the blood and brain sufficiently to cause emergence from anaesthesia.42 This behaviour is particularly evident for high clearance drugs.39
OFFSET TIMES
It should be appreciated that the half-life for some drugs depends on the duration of the infusion. This is particularly evident for drugs with high distribution volumes and whose bolus kinetics are governed significantly by redistribution rather than clearance (e.g. fentanyl). For short infusions, the plasma half-life after the infusion will be less than the terminal elimination half-life. However, as the duration of infusion becomes sufficient to achieve steady state, the half-life upon stopping the infusion will increase until it equals the terminal elimination half-life.43
ROUTES OF DRUG ADMINISTRATION
ORAL
However, there is an increasing trend to resume premorbid oral medications as soon as possible after the intercurrent illness has resolved or vital organ function has stabilised. Furthermore, some commonly used drugs have no suitable parenteral equivalents (e.g. statins, angiotensin-converting enzyme inhibitors, angiotensin II inhibitors, aspirin, digoxin, oral anticoagulants and some antibiotics such as fusidic acid and rifampicin). Consequently, the use of the oral route is becoming more common. One confounding issue is that critically ill patients are increasingly also fed via the enteral route.44 Enteral feeding may reduce drug availability due to absorption of drug onto enteral feed components, nasogastric tubing or by reduced absorption due to the pH of the feed. Conversely, the administered drug has the potential to block the feeding tube.
INTRAVENOUS
The i.v. route is used for speed, convenience, reliability, titratability and lack of enteral formulations of some drugs. Intravenous apparatus including glass, plastics and rubber may absorb drugs, decreasing the dose delivered (e.g. insulin, heparin, amiodarone). When several drugs are delivered through the same i.v. line, chemical incompatibility may also occur. This may be a result of pH effects altering solubility, solvent effects (e.g. precipitation of the propylene glycol used to dissolve some preparations of diazepam when diluted excessively) and cation–anion interactions causing precipitation or formation of less active, yet soluble complexes (e.g. thiopentone or calcium in combination with most other drugs). Although precipitation can be detected by visual inspection, lack of visual changes does not mean there has not been loss of potency (e.g. heparin and dopamine, insulin and total parenteral nutrition).45
PK-PD CHANGES IN CRITICAL ILLNESS
Critically ill patients often have multiple organ dysfunction, causing alterations in drug handling and effect in the body at all levels. The net effect of these multiple changes is difficult to predict. Frequently, the main effect is to increase inter-patient variability in response, even if typical patient response is altered little. Intra-patient variability also occurs over brief periods of time in response to changes in a patient’s condition.
CIRCULATORY FAILURE
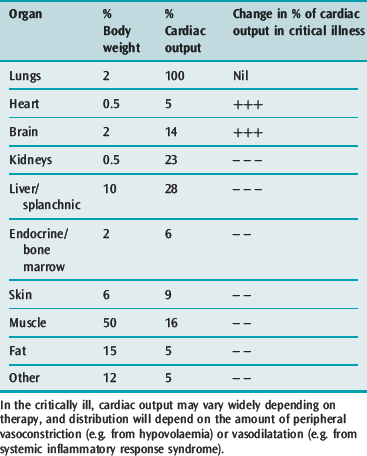
Circulatory failure causes a greater percentage of cardiac output to go to essential organs (e.g. heart and brain) and decreased blood flow to peripheral tissues (Table 79.2). The net effects are:
HEPATIC FAILURE
Hepatic failure may increase or decrease volume of distribution and total body clearance, and increase excretion half-life of hepatically metabolised drugs. Loading doses are often not greatly affected. In the critically ill, there is usually a decrease in liver blood flow and therefore the rate at which drugs are delivered to the liver for metabolism. Flow-dependent drugs include morphine, propofol, labetalol, metoprolol and atropine (Table 79.1). Vasopressors do not usually decrease liver blood flow because of increases in cardiac output.
There is a poor correlation between derangement of conventional tests of liver function and the degree of impairment of drug metabolism. In addition, the degree of impairment may vary widely over short periods of time. In the critically ill, metabolism of some drugs will almost cease, as indicated by a lack of formation of metabolites and very high plasma concentrations (e.g. midazolam46).
RENAL FAILURE
Creatinine clearance is usually a poor guide to renal function in the critically ill because there may be alterations in the rate of formation of creatinine as well as its excretion by the kidneys. Algorithms for drug dose based on creatinine clearance may be similarly unreliable, particularly in critically ill patients. Accumulation of metabolic products may cause decreases in protein binding of drugs. For example, uraemia decreases binding of penicillins, sulphonamides and cephalosporins and in the case of phenytoin excretion is increased.
Renal replacement therapy drastically alters volumes and clearances of drugs. Effects vary with the mode of dialysis, the type of membrane in use and the drugs in question. For most modern membranes little information is available, but what is known has been reviewed.47
SYSTEMIC INFLAMMATORY RESPONSE SYNDROME
In acute severe illness, such as sepsis and multiple organ failure, there is an increase in capillary permeability and total body water secondary to the increased capillary permeability and hypoalbuminaemia. This increases the volume of distribution of drugs, so that increased loading doses may be required to attain a satisfactory therapeutic concentration. Similar changes occur in patients with major burns, and this may be due to circulating cytokines. The volume of distribution may also change over short periods of time. When patients start to recover, serum concentrations may increase because of the decreasing volume of distribution of the drug (e.g. vancomycin48) as well as decrease because of resumption of normal metabolism and clearance (e.g. midazolam46). Circulatory, hepatic and renal failure may also add the characteristic changes already described, of decreased clearance or metabolism and accumulation of active metabolites.
PROTEIN BINDING
For most drugs, it is the free (unbound) drug that can enter an organ and bind to receptors, be metabolised or be eliminated (Figure 79.2). Albumin is the dominant binding protein in plasma, and the extent of binding is related in a non-linear manner to the concentration of albumin.49 In most cases, the number of drug-binding sites available on albumin greatly exceeds the number of drug molecules, and the free drug concentration is proportional to the total drug concentration. Most acidic drugs, including all antibiotics, bind to albumin. Basic drugs, such as phenytoin and propranolol, bind mainly to α1-acid glycoprotein. During acute illness, α1-acid glycoprotein concentrations increase, with increased drug binding. Lipoproteins can bind highly lipophilic drugs such as propofol. It is also important to consider the dissociation rate of the drug–protein complex.50 When this is slow, the binding is ‘restrictive’ (e.g. warfarin) and free drug concentrations are very important. When dissociation is fast, the binding is ‘permissive’ (e.g. propranolol) and free drug concentrations are less important for processes such as hepatic clearance where rapid dissociation from protein can supply drug to liver enzymes within one pass through the liver.
Changes in protein binding in critical illness can occur due to drug interactions at the protein binding site50 or changes in the concentrations of binding protein. However, the net effect is drug dependent, and can be negligible if the free concentration determines both drug effect and drug clearance. Changes can be significant in some contexts. Midazolam (usually 96% protein bound) increases its effect in renal failure despite increased clearance, due to reduced protein binding.51 Similarly, the anaesthetic effect of propofol increases during haemodilution due to increases in free propofol concentration, even though the total concentration is unchanged.52
DRUG MONITORING
If no alternative is available, it may be necessary to use a drug with a narrow therapeutic index. When no direct clinical measure of clinical response is possible, plasma drug concentrations may be measured if there is a relationship between this concentration and pharmacological effects (efficacy and/or toxicity). Toxicity may be associated with peak drug concentration (e.g. seizures and arrhythmias from theophyllines) or with mean concentration (e.g. ototoxicity from aminoglycosides). Some drugs for which there are accepted therapeutic and/or toxic concentrations are shown in Table 79.3.
Table 79.3 Therapeutic drug monitoring in the critically ill
| Drug | Therapeutic concentrations | Toxic effects and guidelines to dosage |
|---|---|---|
| Antiarrhythmics | ||
| Digoxin | 0.5–0.8 ng/ml in CHF patients53 | Monitor ECG – dysrhythmia/conduction defects |
| Antibiotics | ||
| Gentamicin | Peak 5–10 μg/ml, trough < 2 | Renal and ototoxicity |
| Once daily high dose | ||
| Check trough (or extended dosing interval use trough < 0.5 μg/ml) | ||
| Amikacin | Peak 8–16 μg/ml, trough < 4 | As above |
| Vancomycin | Peak 20–40 μg/ml, trough < 10 | |
| Anticonvulsants | ||
| Phenytoin | 10–20 mg/l | Arrhythmias |
| Check free concentration if uraemia/low albumin | ||
| Theophyllines | ||
| Aminophylline | 10–20 mg/l | > 25 mg/l |
Drug assays usually measure total plasma concentration of the drug; however, it is the fraction not bound to proteins in plasma that is responsible for the pharmacological effect(s). These plasma protein levels do change during critical illness and so the unbound fraction can be different from that in relatively healthy persons, thus modifying the relationship between measured drug concentration and clinical effect. Regardless of measured concentration, evidence of clinical efficacy or toxicity must be monitored regularly and the drug concentration used as a part of the clinical decision process with the view to individualising the patient’s dosage to optimise beneficial response(s). Given these considerations, the relatively small expense of therapeutic drug monitoring must be weighed against the risks of toxicity or treatment failure.
DRUG BY DRUG SUMMARY
Table 79.1 summarises the kinetic properties of some drugs commonly used in intensive care. The reader is referred to other chapters in this book for detailed commentary on the use of specific drugs.
ACKNOWLEDGEMENTS
Updated and modified from the chapter in the previous edition by T G Short and G C Hood. Dose regimens in Table 79.1 are modified from the ICU Handbooks of the Royal Adelaide Hospital (2003) and Waikato Hospital (2004). Dose regimens are for illustration only and local guidelines should be consulted.
1 Alexander SP, Mathie A, Peters JA. Guide to receptors and channels, 2nd edn. Br J Pharmacol. 2006;147(Suppl 3):S1-168.
2 Lehtonen LA, Antila S, Pentikainen PJ. Pharmacokinetics and pharmacodynamics of intravenous inotropic agents. Clin Pharmacokinet. 2004;43:187-203.
3 Beloeil H, Mazoit JX, Benhamou D, et al. Norepinephrine kinetics and dynamics in septic shock and trauma patients. Br J Anaesth. 2005;95:782-788.
4 Hilleman DE, Forbes WP. Role of milrinone in the management of congestive heart failure. DICP. 1989;23:357-362.
5 Taniguchi T, Shibata K, Saito S, et al. Pharmacokinetics of milrinone in patients with congestive heart failure during continuous venovenous hemofiltration. Intensive Care Med. 2000;26:1089-1093.
6 Hengstmann JH, Goronzy J. Pharmacokinetics of 3H-phenylephrine in man. Eur J Clin Pharmacol. 1982;21:335-341.
7 Stroshane RM, Koss RF, Biddlecome CE, et al. Oral and intravenous pharmacokinetics of milrinone in human volunteers. J Pharm Sci. 1984;73:1438-1441.
8 Dunser MW, Wenzel V, Mayr AJ, et al. Management of vasodilatory shock: defining the role of arginine vasopressin. Drugs. 2003;63:237-256.
9 Bogaert MG. Clinical pharmacokinetics of nitrates. Cardiovasc Drugs Ther. 1994;8:693-699.
10 Schulz V. Clinical pharmacokinetics of nitroprusside, cyanide, thiosulphate and thiocyanate. Clin Pharmacokinet. 1984;9:239-251.
11 McNeil JJ, Louis WJ. Clinical pharmacokinetics of labetalol. Clin Pharmacokinet. 1984;9:157-167.
12 Mehvar R, Brocks DR. Stereospecific pharmacokinetics and pharmacodynamics of beta-adrenergic blockers in humans. J Pharm Pharm Sci. 2001;4:185-200.
13 Ali-Melkkila T, Kanto J, Iisalo E. Pharmacokinetics and related pharmacodynamics of anticholinergic drugs. Acta Anaesthesiol Scand. 1993;37:633-642.
14 Blardi P, Laghi Pasini F, Urso R, et al. Pharmacokinetics of exogenous adenosine in man after infusion. Eur J Clin Pharmacol. 1993;44:505-507.
15 Koike Y, Shimamura K, Shudo I, et al. Pharmacokinetics of verapamil in man. Res Commun Chem Pathol Pharmacol. 1979;24:37-47.
16 Latini R, Tognoni G, Kates RE. Clinical pharmacokinetics of amiodarone. Clin Pharmacokinet. 1984;9:136-156.
17 Fruncillo RJ, Swanson BN, Bernhard R, et al. Effect of renal failure or biliary stasis on the pharmacokinetics of amiodarone in the rat. J Pharm Sci. 1986;75:150-154.
18 Boulton DW, Fawcett JP. Enantioselective disposition of salbutamol in man following oral and intravenous administration. Br J Clin Pharmacol. 1996;41:35-40.
19 Schuttler J, Ihmsen H. Population pharmacokinetics of propofol: a multicenter study. Anesthesiology. 2000;93:1557-1560.
20 Upton RN, Ludbrook GL. A physiologically based, recirculatory model of the kinetics and dynamics of propofol in man. Anesthesiology. 2005;103:344-352.
21 Vinayak AG, Gehlbach B, Pohlman AS, et al. The relationship between sedative infusion requirements and permissive hypercapnia in critically ill, mechanically ventilated patients. Crit Care Med. 2006;34:1668-1673.
22 Barr J, Egan TD, Sandoval NF, et al. Propofol dosing regimens for ICU sedation based upon an integrated pharmacokinetic–pharmacodynamic model. Anesthesiology. 2001;95:324-333.
23 Bjorkman S. Prediction of drug disposition in infants and children by means of physiologically based pharmacokinetic (PBPK) modelling: theophylline and midazolam as model drugs. Br J Clin Pharmacol. 2005;59:691-704.
24 Swart EL, Zuideveld KP, de Jongh J, et al. Comparative population pharmacokinetics of lorazepam and midazolam during long-term continuous infusion in critically ill patients. Br J Clin Pharmacol. 2004;57:135-145.
25 Boulieu R, Lehmann B, Salord F, et al. Pharmacokinetics of midazolam and its main metabolite 1–hydroxymidazolam in intensive care patients. Eur J Drug Metab Pharmacokinet. 1998;23:255-258.
26 Ederoth P, Tunblad K, Bouw R, et al. Blood–brain barrier transport of morphine in patients with severe brain trauma. Br J Clin Pharmacol. 2004;57:427-435.
27 Lotsch J. Opioid metabolites. J Pain Symptom Manage. 29, 2005.
28 Shafer SL, Varvel JR. Pharmacokinetics, pharmacodynamics, and rational opioid selection. Anesthesiology. 1991;74:53-63.
29 Murphy EJ. Acute pain management pharmacology for the patient with concurrent renal or hepatic disease. Anaesth Intensive Care. 2005;33:311-322.
30 Caldwell JE, Heier T, Wright PM, et al. Temperature-dependent pharmacokinetics and pharmacodynamics of vecuronium. Anesthesiology. 2000;92:84-93.
31 Vree TB, van der Ven AJ. Clinical consequences of the biphasic elimination kinetics for the diuretic effect of furosemide and its acyl glucuronide in humans. J Pharm Pharmacol. 1999;51:239-248.
32 Roberts JA, Lipman J. Antibacterial dosing in intensive care: pharmacokinetics, degree of disease and pharmacodynamics of sepsis. Clin Pharmacokinet. 2006;45:755-773.
33 van de Waterbeemd H, Smith DA, Jones BC. Lipophilicity in PK design: methyl, ethyl, futile. J Comput Aided Mol Des. 2001;15:273-286.
34 Upton RN, Ludbrook GL, Martinez AM, et al. Cerebral and lung kinetics of morphine in conscious sheep after short intravenous infusions. Br J Anaesth. 2003;90:750-758.
35 de Boer AG, van der Sandt ICJ, Gaillard PJ. The role of drug transporters at the blood–brain barrier. Annu Rev Pharmacol Toxicol. 2003;43:629-656.
36 Sadeque AJ, Wandel C, He H, et al. Increased drug delivery to the brain by P-glycoprotein inhibition. Clin Pharmacol Ther. 2000;68:231-237.
37 Stenson RE, Constantino RT, Harrison DC. Interrelationships of hepatic blood flow, cardiac output, and blood levels of lidocaine in man. Circulation. 1971;43:205-211.
38 Rowland M, Tozer TN. Clinical Pharmacokinetics, 2nd edn. Philadelphia: Lea and Febiger, 1989.
39 Upton RN. The two-compartment recirculatory model – an introduction to recirculatory pharmacokinetic concepts. Br J Anaesth. 2004;92:475-484.
40 Csajka C, Verotta D. Pharmacokinetic–pharmacodynamic modelling: history and perspectives. J Pharmacokinet Pharmacodyn. 2006;33:227-279.
41 Zheng D, Upton RN, Martinez AM, et al. The influence of the bolus injection rate of propofol on its cardiovascular effects and peak blood concentrations in sheep. Anesth Analg. 1998;86:1109-1115.
42 Myburgh JA, Upton RN, Grant C, et al. Epinephrine, norepinephrine and dopamine infusions decrease propofol concentrations during continuous propofol infusion in an ovine model. Intensive Care Med. 2001;27:276-282.
43 Bailey JM. Context-sensitive half-times: what are they and how valuable are they in anaesthesiology? Clin Pharmacokinet. 2002;41:793-799.
44 Magnuson BL, Clifford TM, Hoskins LA, et al. Enteral nutrition and drug administration, interactions, and complications. Nutr Clin Pract. 2005;20:618-624.
45 Florence AT, Attwood D. Physicochemical Principles of Pharmacy, 4th edn. London: Pharmaceutical Press, 2005.
46 Shelly MP, Mendel L, Park GR. Failure of critically ill patients to metabolise midazolam. Anaesthesia. 1987;42:619-626.
47 Bohler J, Donauer J, Keller F. Pharmacokinetic principles during continuous renal replacement therapy: drugs and dosage. Kidney Int Suppl. 1999:S24-8.
48 Gous AG, Dance MD, Lipman J, et al. Changes in vancomycin pharmacokinetics in critically ill infants. Anaesth Intensive Care. 1995;23:678-682.
49 Wilkinson GR. Plasma and tissue binding considerations in drug disposition. Drug Metab Rev. 1983;14:427-465.
50 Colmenarejo G. In silico prediction of drug-binding strengths to human serum albumin. Med Res Rev. 2003;23:275-301.
51 Vinik HR, Reves JG, Greenblatt DJ, et al. The pharmacokinetics of midazolam in chronic renal failure patients. Anesthesiology. 1983;59:390-394.
52 Takizawa E, Takizawa D, Hiraoka H, et al. Disposition and pharmacodynamics of propofol during isovolaemic haemorrhage followed by crystalloid resuscitation in humans. Br J Clin Pharmacol. 2006;61:256-261.
53 Rathore SS, Curtis JP, Wang Y, et al. Association of serum digoxin concentration and outcomes in patients with heart failure. JAMA. 2003;289:871-878.
[/level-membership-for-anesthesiology-category][not-level-membership-for-anesthesiology-category]
Chapter 79 Pharmacokinetics, pharmacodynamics and drug monitoring in critical illness
Pharmacokinetics (PK) is the study of the absorption, distribution, metabolism and elimination (ADME) of drugs, usually by measurement of drug concentrations in blood or plasma. Pharmacodynamics (PD) is the study of the effects of a drug on the body. The pharmacokinetics of a drug is one determinant of its pharmacodynamics. Pharmacokinetic-pharmacodynamic (PK-PD) analysis seeks to summarise the behaviour of a drug in the body, to understand the sources of variability in this behaviour, and to use this knowledge to design rational, and ideally individualised, dosing regimens. The aim of this chapter is to review some basic PK and PD principles, to introduce the concepts that an intensive care physician may encounter when reading a contemporary PK-PD paper, and to consider the influence of critical illness on the pharmacokinetics and pharmacodynamics of drugs used in intensive care.
DOSE–RESPONSE RELATIONSHIPS
Most drugs exert their effects by binding to receptors1 such as an enzyme or membrane ion channel. The binding to the receptor directly or indirectly triggers a chain of biological events leading to the observable effects of the drug. The magnitude of effect is a function of:
As the number of receptors present is finite, drugs have a maximum achievable effect. Classically, a plot of drug effect versus the logarithm of a wide range of doses will be described by a sigmoid-shaped dose–response curve (Figure 79.1). In practice, the range of doses used in patients is often narrower, and is confined to a smaller section of the dose–response curve.
TITRATION
Many drugs used in intensive care have a relatively rapid onset of a directly measurable physiological effect (Table 79.1). They can therefore be used by a process of titration of dose versus effect to achieve the desired therapeutic outcome. While titration can be an empirical process, efficient titration strategies are guided by an understanding of the kinetics and dynamics of a drug. Important issues include an understanding of:
PHARMACOKINETICS
VOLUME OF DISTRIBUTION IN AN ORGAN
A drug administered to a patient will directly or indirectly enter the blood and be distributed by the blood circulation around the body. Drug enters the organs of the body via the afferent arterial blood supply. Any given molecule can then either diffuse into the organ or leave via the efferent venous blood (Figure 79.2). At steady state (when the arterial concentrations are constant and the net rates of diffusion into and out of the organ are equal), the total amount of drug in the organ (A) will often be a fixed ratio of the afferent arterial concentration (C). This ratio is known as an apparent volume of distribution (V):
A given organ is characterised by the size of defined ‘physiological’ spaces and its relative proportions of water, lipids and drug-binding sites (Figure 79.2). The important physiological spaces are:
A drug may act on receptors in any of these spaces. The physicochemical properties of a drug dictate which physiological spaces are accessible to the drug. A drug can exist in blood in several forms: ionised or unionised (governed by the local pH and the pKa of the drug), and bound or unbound to plasma proteins.
Consequently, drugs that are highly bound or highly ionised in blood generally have smaller distribution volumes in an organ. For example, the distribution volume of propofol in the brain is less than expected based on its high lipophilicity because it is highly bound in plasma. Paradoxically, highly lipophilic drugs in general do not penetrate tissues as extensively as moderately lipophilic compounds, as high lipophilicity is correlated with high binding in plasma.33
When the diffusion rate across the endothelium and cell membranes is significantly less than organ blood flow (Q), the uptake into the organ is ‘membrane-limited’ and less affected by changes in organ blood flow. Morphine shows membrane-limited uptake into the brain.34
THE SPECIAL CASE OF THE BRAIN
Drug penetration into the brain is further restricted compared to that of other organs because of passive and active defence mechanisms collectively known as the blood–brain barrier (BBB). The passive component is the tight junctions of endothelial cells in the brain, which means that passage across the endothelium is solely by the transcellular route, and therefore restricted to lipophilic compounds. The active component is a range of transmembrane transporters. Some of these allow the uptake of endogenous compounds (e.g. amino acids and glucose). Of more pharmacological importance are a range of efflux transporters that actively pump drugs from the brain to the blood.35 The clinical significance of these transporters is currently being defined, but may be particularly important for some drugs. For example, loperamide is a potent opioid, but has no central effects at normal doses because it is excluded from the brain by P-glycoprotein.36 Similarly, the concentration of morphine in the brain is kept low by active transport. When the BBB is damaged, morphine concentrations in the brain are found to be higher.26
CLEARANCE IN AN ORGAN
HEPATIC DRUG CLEARANCE
HALF-LIFE IN THE BODY
For a given drug, each organ of the body has characteristic rates of distribution (equilibration half-life) or clearance (extraction). When these complex processes are summed together, however, the sum appears to reduce to changes in blood concentrations that can be described by one, two or three exponential functions, each with an associated half-life term. Half-lives can describe the rate of decline of the blood drug concentration following a dose, or the rate of increase in concentration during an infusion. Half-life is defined as the time taken for the drug concentration in the blood to decrease (or increase) by 50%, and when only one half-life is evident it is related to distribution volume and clearance as follows:
The distribution volume can sometimes provide information about the location of a drug in the body:38 a drug that distributes only in the intravascular space (e.g. one that is tightly bound to plasma proteins, such as indocyanine green) will have a distribution volume of about 0.075 l/kg; a drug that distributes into the extracellular space
[/not-level-membership-for-anesthesiology-category]
