[level-membership-for-neurology-category]
Chapter 12 Pediatric Neurophysiologic Evaluation
Pediatric neurophysiologic studies are an integral part of the diagnostic evaluation of the infant or child with suspected brain dysfunction; electroencephalography (EEG), polysomnography, evoked responses, and computerized neurophysiological analyses comprise four general diagnostic modalities. Pediatric neurologists must apply proper instrumentation and recording techniques to obtain reliable pediatric neurophysiologic studies in an EEG laboratory or at a child’s bedside. With proper knowledge of these techniques, the clinician can better appreciate the clinical relevance of these studies. Neurophysiological evaluations take on heightened diagnostic and prognostic significance when compared with neuroimaging studies. As a research tool, neurophysiological studies constitute a powerful measure of functional neuronal organization and maturation, particularly when applying quantitative measures during resting, stressful, or disease states. Functional-structural comparisons between neurophysiology and neuroimaging yield far greater information about neurologic health and disease. Genotype-phenotype comparisons are now being investigated that will redefine neurophysiological studies as endophenotypes to study gene–environment interactions [Scher and Loparo, 2009].
In the first section of this chapter, recording techniques unique to children are introduced. As outlined in the second section, maturational changes in arousal states of children are emphasized in considering normal or age-specific patterns. Third, abnormal EEG patterns are discussed in the context of common pediatric neurologic disorders [Blume, 2002; Ebersole and Pedley, 2003; Niedermeyer and Lopes da Silva, 2005]. A fourth section is devoted to computer applications of neurophysiological studies for clinical and research purposes.
The neurologist should consistently follow analytic steps in the interpretation of neurophysiologic studies. Proper interpretative skills ultimately require two essential didactic elements that are beyond the scope of this discussion: presentation of multiple examples of the same neurophysiologic phenomena, and use of typical and atypical clinical situations in which common and complex neurophysiologic patterns are observed. Several excellent reviews supplement this discussion and can assist the physician with the evaluation of children who exhibit these phenomena [Binnie, 2003; Blume, 2002; Cracco and Cracco, 1986; Daube, 2002; Ebersole and Pedley, 2003; Mizrahi and Kellaway, 2003; Niedermeyer and Lopes da Silva, 2005; Scher, 2005a; Spehlmann, 2001].
Utility of Pediatric Neurophysiological Studies
Neurophysiological interpretation can assist in the diagnosis and prognosis of specific neurologic conditions. Recognizing specific situations in which the EEG findings are helpful allows efficient and effective use of this comparatively low-cost and safe tool [Drazkowski, 2003]. However, there is little advanced evidence-based medicine in the literature on the subject of pediatric clinical neurophysiology. In a review published by Medline and Cochrane [Fowle and Binnie, 2000], there is a lack of evidence-based medicine concerning the efficacy of EEG interpretation, as well as the standardization of pediatric neurophysiological training. Only retrospective studies have assessed the efficacy of EEG results in the evaluation of neurologic conditions for children, uniformly reporting that interictal EEG findings may be overused during the evaluation of various pediatric brain disorders [Aydin et al., 2003], whereas normal EEG findings are highly predictable in children with nonepileptic conditions [Jan, 2002]. Although the physician should not ignore multivariable analyses in which EEG is used to differentiate risks, diagnostic decision-making still rests on clinical effectiveness data, rather than EEG diagnoses [Gilbert and Buncher, 2000]. The clinician must consider the clinical settings of the outpatient clinic, emergency department, or intensive care unit in which the indications and diagnostic yield of the EEG will vary [Alehan et al., 2001; Varelas et al., 2003], based on the selection bias of the pediatric groups chosen for study. EEG can also be useful as an independent prognostic indicator of outcome for a general patient population, conveying information about the general level of illness and the cost of caring for patients.
The standard of the EEG services and the accuracy of the EEG interpretation must not be overlooked when recommendations and management of pediatric neurological problems are being developed. The inappropriate use or incorrect interpretation of the EEG, or both, is the most common reason for misdiagnosing common conditions such as epilepsy [Tan et al., 2008].
Training in Clinical Neurophysiology
Although the neurology trainee receives basic clinical neurophysiology instruction during residency, it is recognized that neurologists with more training and experience in clinical neurophysiology are also needed, in part because of the increased complexity of the specialty and the demand for high-quality care for people with complex neurologic diseases. Accredited training programs in clinical neurophysiology and individual certification in the subspecialty of clinical neurophysiology have been available since 1993 [Burns et al., 2000]. Standards of practice in clinical electroencephalopathy have been published regarding recommendations for qualifications of both electroencephalographers and technologists, laboratory organization, and appropriate instrumentation. An adequate duration of training with appropriate curriculum requirements has been described. Future opportunities for the clinical neurophysiology subspecialist will lead to concentrations in specific areas of neurophysiology, such as for epilepsy, sleep medicine, and neurointensive care. Pediatric neurologists must also satisfy these training requirements, with special emphasis on the unique aspects of developmental clinical neurophysiology for office and hospital settings, including neonatal and pediatric intensive care units and pediatric epilepsy monitoring units. In addition to the more thorough training requirements for pediatric neurologists, practice parameters have been more rigorously enumerated to develop strategies for patient management that are based on evidence-based medicine. Suggested parameters include the use of EEG more selectively, such as for children with specific neurologic conditions such as development delay, cerebral palsy, or headache [Ashwal et al., 2004; Lewis et al., 2002; Shevell et al., 2003], or in specific clinical settings such as intraoperative monitoring [Husain, 2009]. Revised guidelines require re-evaluations to improve the use of EEG methodology and training across disciplines, such as for the diagnosis of epilepsy [Flink et al., 2002; Tan et al., 2008].
Instrumentation and Recording Techniques
Each EEG channel measures the electropotential difference between two points on the scalp under the assigned electrodes. Ten electrodes are required as a minimum number for adequate EEG recordings [AES, 1986]. A greater area of cerebral activity can be measured with more EEG channels. EEG laboratories devoted to pediatric studies should use 16–24 channels. In the neonate, it may be more practical to apply fewer electrodes, as discussed later in this chapter. The International 10-20 System of electrode placement is the standard method of electrode application, and it routinely requires the placement of 22 electrodes on the head. The basis of the 10-20 system is the measurement of four standard points on the head: nasion, inion, and left and right preauricular points [Holmes, 1987; Niedermeyer and Lopes da Silva, 2005]. Electrodes are spaced at 10 or 20 percent of the total distance between pairs of skull landmarks; scalp locations correspond to anatomic landmarks. Electrode names correspond to the underlying brain regions over which they are positioned. Electrodes with odd numbers correspond to regions in the left hemisphere, and even numbers refer to areas in the right hemisphere. Midline electrodes have a zero (z) as a suffix. Additional electrodes may be used to localize electrical activity. Readjustment of the electrode placements may be required for preterm neonates and for patients with skull deformities.
Polarity Localization
Proper electrode placement and montage choices allow accurate comparisons between homologous brain regions. In this way, the neurologist can localize EEG data on an anatomic basis and can standardize regional or hemispheric findings over multiple EEG recordings. An understanding of the principles of polarity is essential in using the localization technique [Ebersole and Pedley, 2003].
Inputs for two electrodes for one EEG channel are generated by two differential amplifiers, called input terminal one and input terminal two. With a differential amplifier, the output is proportional to the voltage difference between these two input terminals. The direction of the pen deflection depends on differences in polarity of this voltage difference. By convention, when input terminal one is relatively more negative, there is an upward deflection. Other possibilities include a downward deflection if input terminal one is relatively more positive. The reverse situation pertains to input terminal two; when input terminal two is relatively more negative, there is a downward deflection [Cooper et al., 1980].
Instrumental Control Settings
Filter Settings
High- and low-frequency filters are required to facilitate accurate representation of the appropriate range of frequency-specific waveforms of cerebral origin. Adjustment of these filters should be made judiciously so that genuine brain-generated activities are not eliminated along with undesirable, noncerebral artifactual signals. High-frequency filters are set at a standard 70 Hz so as not to blunt the appearance of fast frequencies, including abnormal spikes and sharp waves. Occasionally, lower settings may be needed when excessive fast-frequency artifacts exist, such as 60-cycle interference from other electrical devices. Low-frequency limits, commonly referred to as time constants, routinely vary between 0.3 and 0.1 seconds. For situations when slow-frequency waveforms need to be analyzed or eliminated, longer or shorter time constants, respectively, can be chosen. This procedure is particularly important in EEG recordings of neonates and young infants in whom slower frequency activities need to be clearly represented. The use of DC recordings has also been advocated to study both maturation and disease states [Vanhatalo et al., 2005]. Conversely, high-frequency oscillations also have been studied to improve prediction of cognitive function, maturation, and brain pathology [Ben-Ari et al., 2007; Herrmann et al., 2009].
Artifact Recognition
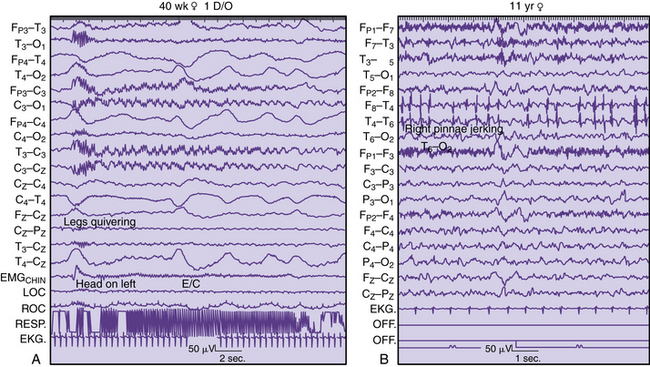
As with adults [Richey, 1976], physiologic and nonphysiologic artifacts must be properly identified in pediatric recordings because either may interfere with the interpretation of cerebral activity. Three basic forms of artifacts have been classified: instrumental, external, and physiologic. Accurate descriptions by the technologist can assist the neurologist in the diagnosis of a neurologic disorder in adults [Klass and Reiher, 1968], children [Blume, 2002], and neonates [Scher, 1985] (Figure 12-1). Such artifacts may help define normal and abnormal sleep and waking behaviors. The technologist should try to identify the source of any artifacts, initially to reproduce them and subsequently to eliminate artifacts that were identified during the recording.
Recording Setting
A minority of children may require sedation. The need for sedation can be substantially reduced by adequate preparation of the child, including the creation of a less-threatening environment in which to perform the study. One report described a decreased proportion (32 to 2 percent) of 513 children who needed sedation over a 4-year period when appropriate preparation was provided [Olson et al., 2001]. Chloral hydrate (50–80 mg/kg; maximum dose, 2 g) has historically been the most commonly used sedative, but should be administered only to a child who has not been recently fed and cannot tolerate the study in the natural state. Rectal administration may be advantageous for the encephalopathic or extremely uncooperative child who requires the study [Thoresen et al., 1997]. Psychotropic or sedative drugs should be avoided because they produce more profound behavioral and EEG effects. Infant recordings should be obtained around a scheduled feeding or nap. At least 90 minutes should be scheduled for electrode application, EEG recording, and clean-up. With some exceptions, the parents’ presence during the recording session should be discouraged. A child-life specialist or similarly trained individual can provide developmentally appropriate and child-friendly support. The technologist should accurately record the pertinent clinical evaluation of the child that explains the reason for obtaining the EEG study. Information from parents or the medical record should include the child’s age; gestational and postconceptional ages should be included for neonates. The ordering physician should be identified, and the written request for an EEG study should clearly state the clinical problem that prompted the EEG request.
Neurophysiological Basis for Electroencephalography
Electrical activity generated by the brain can be classified into three broad categories. Spontaneous and evoked electrical activity detected on the scalp as oscillatory potentials is discussed primarily in this section. Electrical potentials generated by single neurons recorded by microelectrodes are a third type that is briefly mentioned in the context of the neurophysiologic basis of EEG studies. Informative reviews of the neurophysics of cerebral electrical fields are available in other sources [Ebersole and Pedley, 2003; Niedermeyer and Lopes Silva, 2005; Nunez, 1981; Olejniczak, 2006].
Depolarization, represented by an action potential, travels down the axon to synaptic clefts, where chemical transmitters are released. Presynaptic membrane release of neurotransmitters begins the process of cell-to-cell communication, with activation of the postsynaptic membrane by depolarization or hyperpolarization. Depolarization by specific neurotransmitters causes an inward flux of sodium, creating a voltage gradient that is called the excitatory postsynaptic potential. Hyperpolarization by other neurotransmitters causes an outward flow of sodium, contributing to an inhibitory postsynaptic potential. Summation of excitatory postsynaptic potentials and inhibitory postsynaptic potentials within a region involving a number of synapses determines the degree of postsynaptic membrane depolarization or hyperpolarization. If excitatory postsynaptic potentials predominate, depolarization will lead to an action potential. If inhibitory postsynaptic potentials predominate, hyperpolarization will follow, preventing the occurrence of an action potential. Although synaptic potentials are of lower voltage than action potentials, their longer time course and larger membrane surface area contribute primarily to scalp-detected EEG activity. Figure 12-2 illustrates the generation of extracellular voltage fields from graded synaptic activity, depicting the relationship between polarity of surface potentials and the site of dendritic postsynaptic potentials [Ebersole and Pedley, 2003]. EEG fields are primarily generated by the large, vertically oriented pyramidal neurons located in cortical layers III, V, and VI. Because of the attenuating properties of the skull, spatial summation of cortical activity is critical for producing a voltage field recordable from the scalp (Figure 12-3).
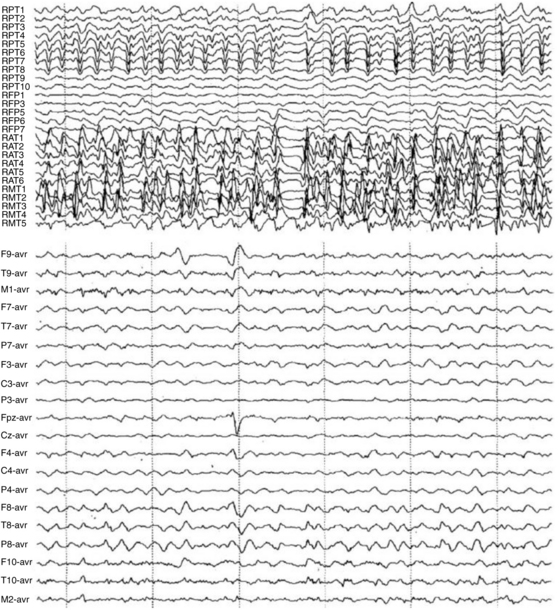
Fig. 12-2 Simultaneous intracranial and scalp EEG recording of a temporal lobe seizure.
(From Olejniczak P, Neurophysiologic basis of EEG. J Clin Neurophysiol 2006;23(3):187.)
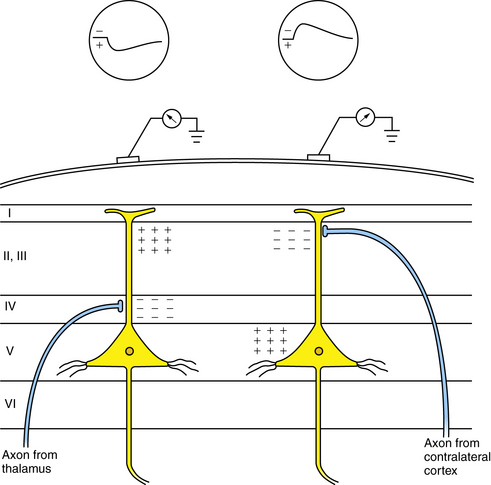
Fig. 12-3 Generation of extracellular voltage fields from graded synaptic activity.
Relationship between polarity of surface potentials and site of dendritic postsynaptic potentials.
(From Olejniczak P, Neurophysiologic basis of EEG. J Clin Neurophysiol 2006;23(3):188.)
Figure 12-4 depicts a schematic cross-section of a brain, illustrating four representative cortical EEG sources. Certain radial fields are negative since the negative maximum voltage is maximal directly above them. Alternatively, tangential fields produce both positive and negative voltage maxima [Ebersole and Pedley, 2003]. During the excitatory postsynaptic potential or inhibitory postsynaptic potential, there is a current flow in a loop orientation with opposite polarities at each end of the cell’s axonal or dendritic processes. Because most neurons are oriented radially to the cortical surface, these current flows follow a radial direction in and out, as detected by surface electrodes. The polarity, as recorded on the surface, reflects an excitatory or inhibitory current flow, depending on the nature of the summated synaptic potentials and on the site of the synapse. Virtually all electrical activity recorded on the scalp is generated by current flow across the synaptic membranes of cortical neurons.
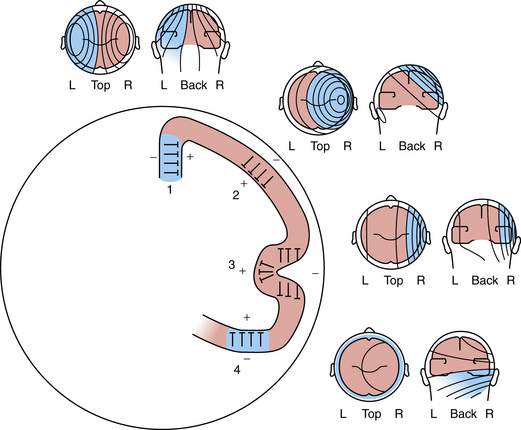
Fig. 12-4 Schematic of a brain cross-section, illustrating four representative cortical EEG sources.
(From Olejniczak P, Neurophysiologic basis of EEG. J Clin Neurophysiol 2006;23(3):188.)
The main sources of EEG derive from the cerebral cortex and form three-dimensional potential fields, which can be recorded as two-dimensional potential fields in the function of voltage versus time. It takes a combined synchronous electrical activity of approximately 108 neurons and their synaptic connections in a cortical area of 6 cm2 to create visible EEG. The area of cortex required for the generation of interictal spikes may be as large as 20 cm2 [Olejniczak, 2006].
Subcortical activity does not substantially contribute to the generation of current flow and electric fields. Instead, diencephalic structures, such as the thalamus, exert a modulatory effect on cortical rhythms. The dorsal thalamus is considered the chief subcortical EEG rhythm generator, synchronizing populations of neocortical neurons as voltage generators. In normal conditions both thalamic and cortical regions interact to produce synchrony of cortical postsynaptic potentials during wakefulness and sleep. The facultative pacemaker theory assumes that the thalamocortical relay neurons send fibers to the cortex, as well as giving off branches that turn back and end on thalamic inhibitory interneurons (biofeedback servomechanism). The nucleus reticularis hypothesis attributes the cells of the nucleus reticularis thalami to release the inhibitory neurotransmitter gamma-aminobutyric acid (GABA) in rhythmic bursts of depolarization directed to the neurons of the dorsal thalamus and rostral brainstem (Figure 12-5) [Olejniczak, 2006].
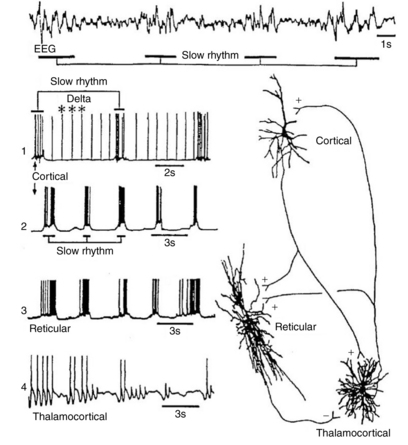
Fig. 12-5 Relationship between EEG slow waves and thalamic intracellular potentials.
(From Olejniczak P, Neurophysiologic basis of EEG. J Clin Neurophysiol 2006;23(3):188.)
Unlike sleep spindles, which require synaptic activities to establish the rhythmic oscillations, delta oscillation is an intrinsic rhythm that depends on potassium fluxes at voltage-dependent ion channels of cortical and thalamic neurons. Desynchronization of the EEG is the interruption of its rhythmical activity. It occurs with activation of ascending cholinergic projections of the basal forebrain and brainstem projections from the raphe nuclei and locus ceruleus. Rhythmic activity is interrupted both by direct effects on cortical neurons and indirectly by thalamic neurons. At the cellular level, desynchronization is accompanied by a transition from a burst firing pattern to a more continuous or single spike pattern. Desynchronization is enhanced by behavioral arousal and suppressed by non-rapid eye movement (REM) sleep. Certain abnormal synchronous patterns, such as alpha coma, occur in the setting of widespread injury to the ascending neuronal networks that otherwise produce arousal and desynchronization [Olejniczak, 2006].
Glial cells consist of a soma and fibers. Glial cells intermingle with the neuronal structures and are electrically coupled, building up an extended functional network. Glial cells also exhibit a membrane potential. Unlike neurons, glial cells do not generate postsynaptic action potentials. Their resting potential is exclusively based on potassium-outward current through leakage channels. The membrane potential value is close to the potassium equilibrium potential. With a decrease in extracellular potassium concentration, glial cells depolarize and repolarize, respectively. Glial cells are functionally linked by way of the extracellular potassium concentration. Neuronal action potentials are associated with an outflow of potassium ions. With an increase in the repetition rate of neuronal action potentials, extracellular potassium concentration increases, resulting in depolarization of glial cells adjacent to active neurons [Somjen and Trachtenbers, 1979].
Potential Fields and Neuronal Networks
Each neuronal arrangement generates opened and closed fields. In open fields, one electrode largely integrates potentials of the neuronal population, whereas the other electrode sees only the positive or negative field, permitting the recording of the field potential. In a closed field, external electrodes do not appear to see potential differences because currents within the pool compensate for each other [Niedermeyer and Lopes da Silva, 2005]. Several types of field potentials can be differentiated, depending on the time constant of the amplifying recording device. Amplified EEG recordings at a time constant of 1 second or less can be contrasted with an infinite time constant using a direct current (DC) amplifier, permitting additional recording of baseline shifts and wavelike potentials without filtering of slow-frequency activities.
Neurophysiologic Basis of Abnormal Electrical Patterns
Interictal spike discharges, the hallmark of the epileptic neuron in experimental models of epilepsy, involve a specific type of membrane depolarization, referred to as a paroxysmal depolarization shift. There are general similarities between the neuronal events underlying this interictal epileptogenic process [Jeffreys, 1990]. In hippocampal and neocortical slice recordings taken after penicillin application [Ayala et al., 1973], high-voltage discharges appear in the EEG recording and are associated with an intracellularly recorded paroxysmal depolarization shift. These phenomena appear in intracellular recordings of experimental animals and human cortices. The depolarization is of relatively high voltage (10–15 μV) and long duration (100–200 msec), and it is associated with a burst of spike discharges. The event produces a train of action potentials that conduct away from the neuron along the axon. The interictal paroxysmal depolarization shift is followed by a period of hyperpolarization. Over time, this depolarization can summate to form a prolonged depolarization with a persistent loss of hyperpolarization, which is recorded on the surface as continuous spike discharges coinciding with the tonic phase of a generated tonic-clonic seizure. Subsequently, large inhibitory potentials alternate with recurrent rhythmic depolarization, which coincides with the clonic phase of the seizure. Despite the higher threshold necessary to achieve depolarization and the longer refractory period observed in immature animals [Prince and Gutnick, 1972], an understanding of paroxysmal depolarization shift is crucial to an appreciation of maturational aspects of epileptogenesis.
Based on these experimental observations, several hypotheses have been advanced to explain the mechanism by which normal neuronal activities convert to those of abnormal interictal discharges [Prince, 1985]. One mechanism involves intrinsic membrane abnormalities that promote burst-generating properties in individual neurons by an imbalance of calcium and sodium ion movements [Schwartzkroin and Prince, 1978]. Another mechanism involves the loss of inhibition by a group of neurons because of the absence of the inhibitory neurotransmitter, GABA [Prince, 1985]. A third mechanism of summated excitatory postsynaptic potentials helps explain how large groups of neurons generate depolarization shifts [Prince, 1978].
Although overshadowed by factors influencing seizure initiation, seizure termination is a critical step in the return to the interictal state [Lado and Moshe, 2008]. Understanding the mechanisms contributing to seizure termination could potentially identify novel anti-ictal and antiepileptogenic drugs, as well as highlighting the pathophysiology contributing to both seizure initiation and termination.
Proposed mechanisms unfortunately do not yet fully explain the transformation from an interictal to an ictal event. Other mechanisms have been proposed based on additional experimental studies, including changes in the ionic microenvironment that result in enhanced neuronal excitability, axonal burst generation, and cholinergic alteration of neuronal properties [Prince, 1985]. A systems biology approach from membranes to synapses to networks and finally circuits may better elucidate pathways to normal or abnormal neurobehavior [Grillner et al., 2005].
Metabolic factors related to glucose or electrolyte imbalance or noncerebral factors, such as trauma or fever, also facilitate the onset of seizures, particularly in children. Additional biochemical and anatomic alterations within a seizure focus may further promote seizure generation by neuronal destruction or glial proliferation [Aird et al., 1984].
Abnormal Suppression or Slowing of Electroencephalographic Activity
In addition to the presence of spike or sharp-wave discharges for the diagnosis of seizure disorders, other types of abnormal EEG patterns coincide with different neuropathologic substrates [Ebersole and Pedley, 2003]. Unfortunately, little information exists that correlates altered neuronal properties, such as the mechanisms discussed for epileptogenesis, with specific neuropathologic entities. Instead, clinical interpretations of the following EEG patterns are empirically based on correlative neuropathology.
Local suppression or absence of background rhythmic activity is a strong indication of brain dysfunction, irrespective of age or location in the brain. Complete absence of activity usually implies cortical necrosis that is close to the surface [Goldensohn, 1979a; Goldensohn, 1979b]. However, incomplete depression of background activity is the more common situation. The presence of symmetric suppression of frontal beta activity, central rhythms, dominant alpha activity, or sleep spindles in association with polymorphic delta waves strongly indicates a destructive process in the brain underlying those electrodes (Figure 12-6A) [Arfel and Fischgold, 1961]. EEG recordings of neonates showing asymmetric background activities usually suggest that the brain lesion is in the attenuated location [Scher, 1982].
Continuous polymorphic delta waves constitute a category of EEG abnormality that may suggest a structural brain lesion on an acquired or congenital basis (see Figure 12-6B). Irregular delta waves between 0.5 and 2.5 Hz do not react to eye opening, arousal, or sleep. Correlations with brain lesions in animals [Gloor et al., 1968] and in humans at postmortem examination have been described [Rhee et al., 1975]. Focal slowing may imply focal destructive lesions of white matter by a congenital, vascular, neoplastic, or infectious process. Polymorphic delta waves can commonly appear immediately after a seizure of focal onset and with reversible conditions, such as migraine [Hockaday and Whitty, 1969]; both are common occurrences in children. The combination of bilateral, synchronous rhythmic discharges and polymorphic delta waves occurs in diffuse encephalopathies involving white and gray matter. Certain brain regions, such as the frontal, temporal, and occipital areas, are more likely to express polymorphic delta waves. The association of background rhythm depression and polymorphic delta waves increases the likelihood of destructive lesions, especially tumors. Parasagittal and parietal lesions often are associated with attenuation of rhythms or prominent theta rhythms.
Intermittent rhythmic delta activity is another category of nonepileptiform abnormality with a variety of neuropathologic correlates. Runs of sinusoidal 2.5 Hz are generally reactive to eye opening, hyperventilation, or arousal. Two distinct distributions of rhythmic delta activity over the scalp have been identified. Frontal intermittent delta activity (Figure 12-7A) and occipital rhythmic delta activity (see Figure 12-7B) generally indicate modification of cortically generated EEG activity by midline subcortical structures. The thalamus, reticular activating system, and midbrain can contribute to the dysfunction between subcortical gray matter and cortical neurons [Daly, 1974]. These two types of rhythmic delta activity are largely age-related. Frontal intermittent delta activity usually occurs in adult patients, whereas occipital rhythmic delta activity is found mainly in children. Intermittent rhythmic delta activity does not necessarily indicate that the major pathologic condition is in that region. Occipital rhythmic delta activity and frontal intermittent delta activity have been documented in 53 percent of 145 children with posterior fossa tumors [Martinius et al., 1968]. As a rule, it has little localizing value for supratentorial masses, although it may be accentuated on the side of the tumor [Hess, 1975]. Intermittent rhythmic delta activity is nonspecific and may be observed with systemic metabolic disorders, increased intracranial pressure, encephalitis, and trauma. However, a subsequent report concerning frontal intermittent delta activity described this pattern as rare for children, observed in only 20 of 1500 EEG studies of children between 18 months and 17 years of age. Most patients were awake and showed no encephalopathic signs, but were cognitively impaired. Another 50 percent had a history of epilepsy, with epileptiform activity occurring in 55 percent of the cohort [Watemberg et al., 2003].
Epileptiform discharges can be found in combination with slowing as an indication of a structural abnormality. Focal discharges during a seizure have better localizing value than interictal spikes [Hess, 1975]. In general, slow-growing neoplasms, such as oligodendrogliomas or astrocytomas, produce more epileptiform activity than rapidly growing tumors [Kershman et al., 1949]. Spike discharges are more common after surgery, such as for meningiomas, but neurologists are advised to exercise extreme caution concerning spike discharges as reliable guides to localization of destructive lesions. Imaging studies are far more reliable diagnostic guides for structural abnormalities.
Significance of Normal Variation in Electroencephalography: Maturational Patterns
Guidelines for Interpretation
EEG analysis requires a systematic, orderly process in which a series of steps are followed to reach a proper interpretation [Ebersole and Pedley, 2003]. The rhythmicity of spontaneous EEG signals gives a continuous admixture of scalp-generated oscillatory potentials. EEG frequencies used for clinical studies are classified in four band ranges. Delta activity is less than 4 Hz; theta activity is 4–8 Hz; alpha activity is 8–13 Hz; and beta activity is greater than 13 Hz. While DC (usually below 3 Hz) and gamma-frequencies (above 30 Hz) can be recorded with appropriate filter settings, these rhythms are currently applied only to research recordings. In general, the amplitude of EEG activity is inversely proportional to frequency.
For pediatric EEG studies, the amount of slow activity decreases with increasing age, and the persistence and frequency of slow activity vary in different brain regions. It is important to appreciate the presence and degree of expression of frequencies in various regions at different ages, and other parameters, such as waveform, manner of occurrence (e.g., random, continuous), and amplitude, are essential to visual analysis. By means of this cumulative analysis, using a list of parameters of EEG activity [Ebersole and Pedley, 2003; Kellaway and Crawley, 1964; Lombroso, 1980], the neurologist can attempt to assign normal or abnormal clinical significance to the EEG pattern. Critical information regarding age and state of the patient affects the ability of the neurologist to judge normality in the EEG record. It may require several EEG recordings and the persistence or resolution of abnormal electrical activity relative to the state of the patient to assess normality properly. Several recordings allow an appreciation of the ontogeny, or evolution, of significant age-specific EEG patterns. These guidelines must be repeatedly emphasized as the pediatric neurologist acquires an appreciation of the rich diversity of normal maturational patterns.
Newborn Electroencephalographic Patterns
Neonatal EEG studies have been reported for more than 60 years [Okamato and Kirikae, 1951]. Pioneering investigations by several independent researchers have all contributed information concerning the developmental neurophysiology of the immature brain. Some of these studies predate the development of the tertiary-care neonatal intensive care unit, and the neurologist using EEG recordings had an understandably limited role in the diagnostic assessment and clinical care of the sick neonate.
Improvements in recording equipment and standardization of the recording techniques are available in modern neonatal intensive care units. An internationally accepted system of electrode placement, adapted for the neonate and young infant, permits standardization of recordings between laboratories [AES, 1986]. Development of 16- and 21-channel EEG machines with improved filtering systems and electrode construction minimizes environmental and physiologic sources of artifacts. Synchronized video-EEG studies permit more accurate comparison between electrographic and behavioral changes in the assessment of seizures, movement disorders, and sleep cycles [Dyken et al., 1997; Scher, 2008; Scher and Barmada, 1987a].
Several fundamental principles for neonatal EEG studies serve as an introduction to an understanding of its chief clinical application [Scher, 2005a; Scher, 2008]. There are expected changes in the scalp-generated EEG patterns for neonates of different gestational ages. The experienced encephalographer can approximate the electrical maturity within 2 weeks of the gestational age. Changing electrical patterns reflect the postconceptional age of the neonate independent of birth weight. Maturation of the neonate’s sleep–wake behavior follows maturation of the CNS and is independent of the birth weight. Preterm neonates, when corrected to term postconceptional age, should have EEG patterns and sleep behavior similar to those of term, appropriate-for-gestational-age newborns.
Detailed electrographic and anatomic correlations that compare sulcal-gyral development with evolving electrical patterns have been correlated with clinical information concerning gestational maturity [Scher and Barmada, 1987a] (Figure 12-8 and Figure 12-9). Of 25 infants, 23 had maturational agreement within 2 weeks between electrical patterns and sulcal-gyral measurements of the inferior frontal, superior temporal, and calcarine gyri, and between the cytoarchitecture of various brain regions.
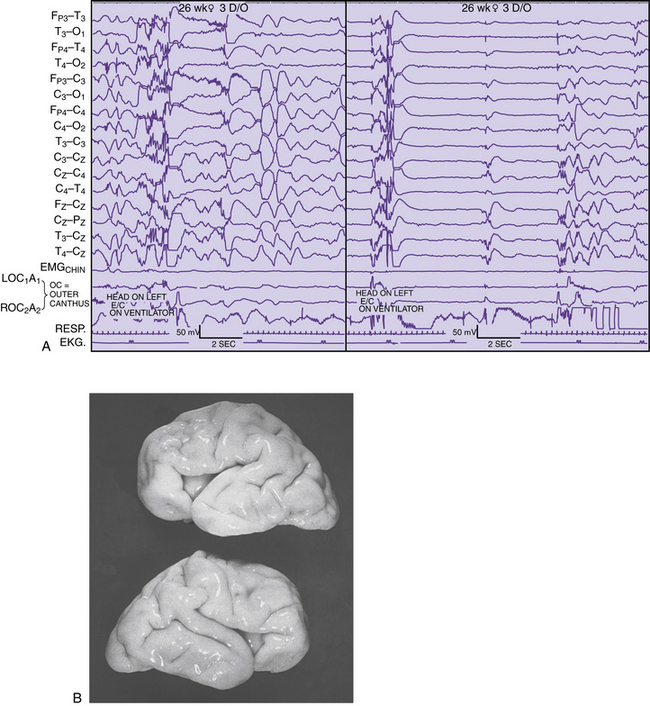
Fig. 12-8 Correlation of EEG and anatomical development in a 26-week-gestation preterm neonate.
(From Scher MS, Ahdab-Barmada M. Gestational age by electrographic, clinical and anatomical criteria. Pediatr Neurol 1987;3:256.)
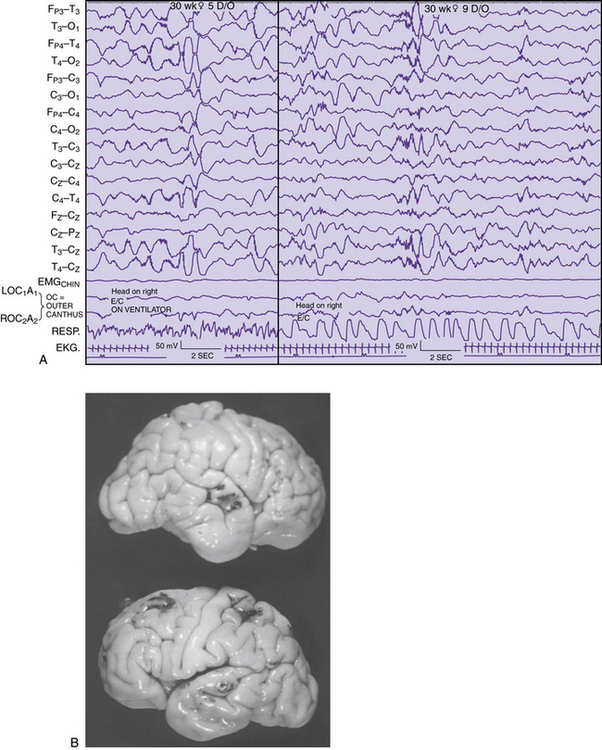
Fig. 12-9. Correlation of EEG and anatomical development in a 30 week-gestation preterm neonate.
(From Scher MS, Ahdab-Barmada M. Gestational age by electrographic, clinical and anatomical criteria. Pediatr Neurol 1987;3:256.)
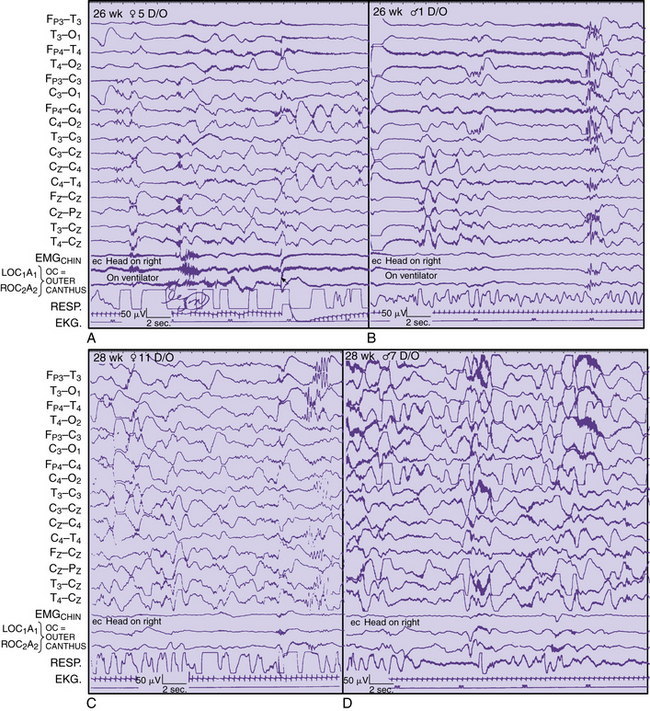
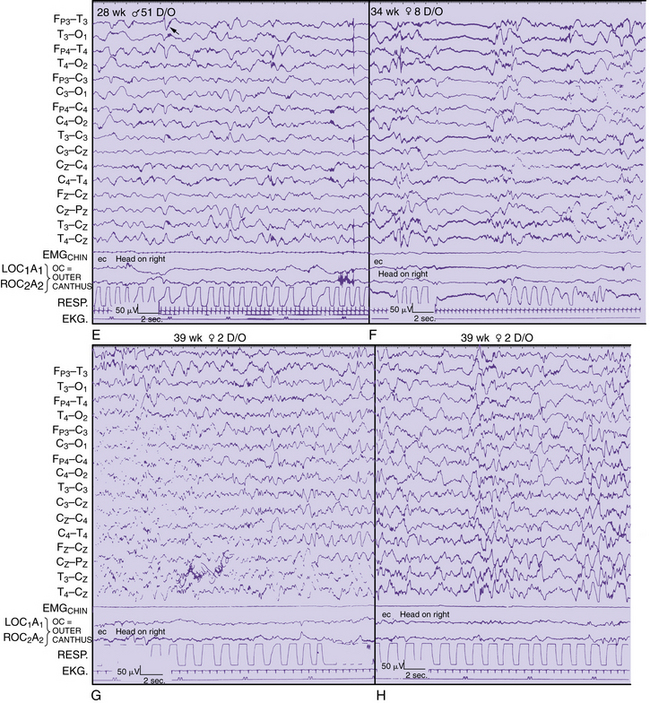
Regional changes in electrical activity clearly occur in the EEG of the premature neonate when recordings are obtained after 24–25 weeks’ estimated gestational age and at weekly intervals [Dreyfus-Brisac, 1979; Mizrahi and Kellaway, 2003; Scher, 2005a; Scher et al., 2003a; Tharp et al., 1981; Torres and Anderson, 1985] (Figure 12-10). Sleep–wake behavior cannot be distinguished for patients younger than 30 weeks of age, but other hemispheric or regional patterns demonstrate predictable, evolving characteristics.
Ontogeny of Electroencephalographic Features
The evolving EEG sleep patterns in the asymptomatic, presumably healthy preterm infant has been the subject of many excellent reviews [Ebersole and Pedley, 2003; Lombroso, 1985; Pope et al., 1992; Scher, 1993a; Scher, 1993b; Torres and Anderson, 1985]. Improvements in neonatal intensive care, however, require periodic revisions to include more preterm infants [Mizrahi and Kellaway, 2003; Scher, 2005a, 2008]. These revisions are particularly relevant for preterm infants younger than 32 weeks’ gestation, for whom substantial improvement in survival rates has occurred over the past decade. However, there is a greater prevalence of late preterm infants (34–37 weeks estimated gestational age [EGA]) who also remain at increased risk for neurodevelopmental deficits [Ramachandrappa and Jain, 2009]. Applying the principles of functional brain maturation using EEG is therefore relevant across the gestational age spectrum. It will always be important to verify which EEG-sleep patterns are within the range of normal by systematic neurodevelopmental assessment of such children at increasing postnatal ages.
In the following sections, regional and hemispheric EEG patterns for preterm and term neonates are arbitrarily assigned within specific gestational age ranges. Temporal, spatial, and state organization of the EEG recordings of cerebral activity during each age range is highlighted with appropriate illustrations. Greater details can be found in recent reviews [Scher, 2008; Scher and Loparo, 2009].
Gestational Age of Younger than 28 Weeks
A pattern of alternating active and sleep periods in preterm infants is characterized as discontinuity, or tracé discontinuity [Ellingson, 1964; Tharp et al., 1981], with alternating longer periods of quiescence and shorter periods of EEG activity. In fact, a 1-hour cyclic rhythm between burst and interburst intervals is present as early as 25–30 weeks EGA and persists up to a term age [Scher et al., 2005c]. None the less, Anderson and colleagues found that 60 percent of EEG recordings consisted of discontinuity [Anderson et al., 1985]. These same investigators found that the average interburst interval for this age range was 8–16 seconds, with the longest interburst intervals occurring between 15 and 88 seconds. Similar ranges for the duration of interburst intervals have been found by other investigators [Benda et al., 1989; Connell et al., 1987; Eyre et al., 1988; Hughes et al., 1983a; Hughes et al., 1983b; Hughes et al., 1987]. This finding sharply contrasts with earlier descriptions of interburst intervals as long as 2 minutes [Lombroso, 1985]. Such differences may be related to the medical condition of the neonate at the time of the recording or the lack of information concerning long-term follow-up. In this age group, EEG activity predominates in the vertex, central, and occipital regions. Bitemporal attenuation is common and may reflect intrahemispheric asynchrony [Scher and Barmada, 1987a]. Underdevelopment of the inferior frontal and superior temporal gyri may also help explain the relative quiescence of activity in this brain region.
EEG activity consists of mixed frequencies, dominated by delta activity in the parasagittal and occipital regions. Occipital delta activity is isolated to one or two waveforms and rarely lasts longer than 5–6 seconds. Faster frequencies in the theta, alpha, and beta ranges are intermixed in multiple brain regions. Diffuse theta bursts are common during continuous or discontinuous periods. Beta/delta complexes are transient patterns that identify preterm infants of various conceptional ages. Random or briefly rhythmic 0.3- to 1.5-Hz delta activity of 50–250 μV has superimposed bursts of low to moderate amplitude, and faster frequencies, with a frequency range of 10–20 Hz [Ebersole and Pedley, 2003]. The amplitude of such activity on bipolar recordings rarely exceeds 60–75 μV. Historically, various terms have been applied to such complexes, including spindle delta bursts, brushes, spindle-like fast waves, and ripples of prematurity. These complexes can be seen as early as 24–26 weeks, largely in the central and midline regions, as well as in the occipital regions.
Runs of monorhythmic alpha or theta activities are independent of delta brushes principally occurring in the occipital regions in the neonate younger than 28 weeks’ gestation. This transient pattern has been described in more detail and can last for 6–10 seconds in an asynchronous or asymmetric manner [Hughes et al., 1990]. Such activity should be distinguished from the more diffuse bursts of moderate- to high-amplitude theta activity that commonly exists at this degree of prematurity (see Figure 12-10A and B).
Intrahemispheric synchrony and interhemispheric synchrony have been variably described by different investigators. Lombroso described synchronous bursts as morphologically similar bursts of activity appearing within 1.5 seconds. He estimated that synchronous periods ranged from only 50 percent of all periods of activity at 31–32 weeks’ postconceptional age to 100 percent at 40–43 weeks’ postconceptional age, with a midpoint of 70–85 percent at 35–36 weeks’ postconceptional age [Lombroso, 1989, 1985]. This finding is in sharp contrast to Anderson’s observations that interhemispheric synchrony had a mean of 93 percent for 1-minute epochs at 27 weeks’ postconceptional age, with a mean of 94 percent at 29–32 weeks’ postconceptional age [Anderson et al., 1985]. A high degree of intrahemispheric synchrony already exists in the preterm infant younger than 30 weeks’ gestation. However, it is also reasonable to consider that more epochs of asynchrony occur as the distance from the midline increases, given the rapid brain growth beyond 30 weeks’ postconceptional age. Rapid growth of temporal and parietal structures in particular may contribute to more frequent episodes of asynchrony [Scher, 2005a]. Measures of asynchrony must include information about postconceptional age and about the EEG state. Asynchrony should be assessed for all background rhythms[Scher, 2008], not just for bursts during discontinuous epochs [Anderson et al., 1985; Lombroso, 1985].
Gestational Age of 28–31 Weeks
Cyclic organization of state remains visually undifferentiated in infants with a gestational age of 28–31 weeks [Lombroso, 1989; Lombroso, 1985], although a rudimentary ultradian rhythm of approximately 1 hour can be discerned with polysomnographic analysis [Scher et al., 2005c]. Also, periods of body and eye movements are more distinctively associated with irregular respirations during continuous periods of EEG activity. Discontinuous epochs still predominate but decrease in duration compared with the premature neonate younger than 28 weeks’ postconceptional age. Interbursts become progressively briefer with a dramatic increase in low to moderate-amplitude faster rhythms primarily in the theta range. By 32 weeks’ postconceptional age, the degree of discontinuity has decreased to 45 percent of the record [Anderson et al., 1985]. Dreyfus-Brisac found an alternating pattern in 24 percent of records at 32–34 weeks’ gestation [Dreyfus-Brisac, 1970]. The average interburst intervals at 29–31 weeks’ postconceptional age ranged between 5 and 14 and between 4 and 11 seconds, respectively, with means of 9 and 7 seconds; whereas the longest interburst periods for these two postconceptional age groups were found to be between 16–57 and 6–41 seconds with means of 36 and 20 seconds, respectively.
Monorhythmic occipital delta patterns with durations of more than 30 seconds are quite abundant at 28–31 weeks. Delta brush patterns continue to be abundant, involving the vertex and central regions along with the occipital and temporal regions [Watanabe et al., 1972]. Sometimes, it may be difficult to differentiate delta brushes in the temporal region, particularly because of superimposition with temporal theta bursts.
Another useful developmental marker is the appearance of rhythmic, 4.5- to 6-Hz activity occurring independently and synchronously in each midtemporal region. Although this activity is occasionally observed in neonates younger than 28 weeks’ postconceptional age, it is expressed maximally between 28 and 32 weeks. In the past, this feature has been described as “temporal sawtooth waves” [Scher, 2005a]. Amplitudes range from about 20 to 200 μV; with maturation, these bursts may reach the alpha frequency. In a study of 436 infants, a parabolic polynomial function described the age incidence of temporal theta activity, strongly reflecting the pattern as a maturational landmark [Hughes et al., 1987]. Temporal theta activity can obtain a maximum incidence of 36 percent at 29–30 weeks, after which it diminishes rapidly. At 32 weeks, only 12 percent of the record exhibits this pattern [Anderson et al., 1985]. This rhythmic theta activity should be distinguished from repetitive, sharp activity in the theta range seen at near-term and term ages in the midline and rolandic regions, particularly during quiet sleep.
The clinical significance of sharp-wave transients in healthy, preterm infants has been poorly documented at early preterm ages. Regional patterns associated with maturation must be considered before assigning spike or sharp-wave criteria to a transient waveform. Sharply contoured delta brushes and temporal or occipital theta bursts may appear epileptiform without clearly satisfying morphologic criteria of an epileptiform discharge (see Figure 12-10C and D).
Sporadic multifocal spikes and sharp waves can be seen at any gestational age [Ellingson, 1964; Harris and Tizard, 1960; Parmelee et al., 1968; Samson-Dollfus, 1955; Scher, 2005a; Thoresen et al., 1997], but few studies include preterm infants younger than 32 weeks’ estimated gestational age. Anderson and associates studied the incidence and location of spikes and sharp waves in 33 preterm infants of 27–32 weeks’ EGA [Anderson et al., 1985]. Both features were uncommon, with spikes less common than sharp waves. Both morphologies were most abundant in frontal and temporal regions, with the frequency increasing from 27 to 32 weeks. Central sharp waves decreased in number over this period, whereas occipital and vertex discharges had the lowest incidence. Unfortunately, only 55 percent of infants were verified as normal on follow-up at 6–8 months of age. Larger preterm populations with longer periods of neurodevelopmental follow-up are needed before assigning clinical significance to sharp waves in asymptomatic preterm infants.
Gestational Age of 32–34 Weeks
At a gestational age of 32–34 weeks, body and eye movements take on a more phasic than random pattern, having greater coincidence with continuous EEG segments than quiet or non-REM sleep. Fewer movements, such as buccolingual movements and occasional myoclonic jerks [Curzi-Dascalova et al., 1988], occur during the more discontinuous segments. Variable respirations persist, but short periods of regular respirations are expressed during discontinuous portions of the recording.
Sharply contoured activities predominate in the temporal and central regions, with positive temporal sharp waves frequently occurring synchronously or independently. Sharp activities in the central regions of negative polarity are distinguished from physiologic artifacts resulting from fontanel pulsations or ventilatory excursions. Positive temporal sharp waves need to be differentiated from rolandic and vertex positive sharp waves; the latter are observed in the sick neonate with intraventricular hemorrhage or periventricular leukomalacia [Scher, 1991].
Reactivity to photic stimulation has been systematically studied [Anderson et al., 1985]. Responses to photic stimulation are seen clearly in the EEG of the early preterm infant [Ellingson, 1958]. Responses to isolated flashes have a prominent negative wave component. Ellingson described a later-occurring positive component at older ages, with decreasing latency in proportion to increasing postconceptional age [Ellingson, 1958, 1960]. In contrast to isolated flashes, repetitive flashes or photic driving have been investigated by several investigators, but such responses are difficult to detect in the EEG of the neonate [Ellingson, 1960; Ellingson, 1964]. About 5 percent of preterm and term infants exhibit photic driving with a wide range of flicker frequencies. Anderson and colleagues found that preterm infants between 27 and 32 weeks’ gestation may exhibit driving responses [Anderson et al., 1985]; 64 percent of 34 neonates showed this response with frequencies limited to 2–10 flashes per second. Some investigators have claimed that these driving responses are more readily seen in the preterm infant because of the more continuous, higher-amplitude mixture of background frequencies [Monod and Tharp, 1977].
Responses to auditory or painful stimulation have been the subject of less attention in the preterm and term infant. Monod and Garma investigated behavioral and physiologic responses to auditory clicks and found vertex spikes in response to auditory clicks in neonates at 32–34 weeks’ postconceptional age, which contrasts with the less distinctive response seen in older infants [Monod and Garma, 1971]. Sudden, loud auditory stimuli more effectively produce EEG changes than visual [Ellingson, 1958] or tactile [Dreyfus-Brisac et al., 1957] stimuli. Such periods of desynchronization are thought to be associated with habituation and may represent electrographic representation of perceptual memory and discriminatory functions of the neonate [Anderson et al., 1985].
Gestational Age of 34–37 Weeks
Frontal sharp transients of 50–150 μV are observed at 34–35 weeks’ gestation but may be seen earlier. Historically, these waveforms were called encoches pointes frontales [Monod et al., 1960], and were popularly identified as frontal sharp transients [Hrachovy et al., 1990] and pointes lentes diphasiques frontales [Arfel et al., 1977; Monod et al., 1960]. These sharp waves usually have an initial surface positive component followed by a negative component, but are also associated with rhythmic, sharply contoured, frontal delta activity and can occasionally be high-amplitude (250 μV] [Goldie et al., 1971]. In contrast, fewer multifocal sharp transients occur and are sometimes difficult to distinguish from the intermixed theta or beta background frequencies, as with more preterm neonates.
The discontinuous quality of the sleep tracing during this postconceptional age range indicates the appearance of a tracé alternant rather than a tracé discontinu pattern seen in younger infants. Quiescent periods consist of more activity that exceeds 15 μV, with a greater mixture of low-amplitude, faster rhythms (see Figure 12-10E and F).
Gestational Age of 38–42 Weeks
Although conventional wisdom dictates that only term and near-term infants possess such an organized EEG sleep cycle, concordance among specific EEG and polygraphic parameters has been described in the preterm infant as early as 30 weeks’ gestation [Curzi-Dascalova et al., 1988]. A developmental match between cerebral and noncerebral physiologic parameters fundamentally reflects the coordination of specific neural and non-neural systems. There may be a more established order of state in the premature infant that has not been readily recognized by visual analysis techniques. A rudimentary cycle may be more easily detected in the premature neonate by more quantitative techniques.
The EEG sleep organization of the term neonate has traditionally been considered similar to that of a premature infant who has matured to term and to that of the appropriate-for-gestational-age term neonate. Two active sleep segments occupy 50 percent of the sleep time of the term infant, and are composed of a mixed-frequency pattern and a low-voltage irregular pattern that begin and end the sleep cycle. Quiet sleep segments are situated in between, consist of high-voltage slow and tracé alternant segments, and make up 35–40 percent of the cycle (see Figure 12-10G and H). Transitional or indeterminate segments, during which discordance between EEG and polygraphic criteria of sleep state is defined, make up 10–15 percent of the cycle. The mixed-frequency active sleep pattern comprises moderate-amplitude delta and lower-amplitude theta, alpha, and beta activities. This EEG background also can be identified in the waking neonate.
The low-voltage irregular pattern is characterized by continuous, low-amplitude admixture of frequencies (15–30 μV), mostly in the theta and beta ranges. Considerable alpha activity is intermixed posteriorly and anteriorly. This pattern can be seen during wakefulness and active sleep. Two quiet sleep segments, high-voltage slow and tracé alternant, occupy the second and third positions in this idealized EEG sleep cycle. The high-voltage slow pattern comprises diffuse, continuous, high-amplitude, 50- to 150-μV delta activity intermixed with theta- and beta-range activity of lower amplitude. The high-voltage slow segment is quite brief (4–6 percent of the cycle) and is rapidly replaced by the tracé alternant pattern. The tracé alternant segment comprises a discontinuous tracing of high-amplitude bursts of slow activity in the delta and theta ranges, alternating with lower-amplitude, faster frequencies and sharp waves seen synchronously over both hemispheres. Sexual dimorphism in electrocortical activity may be expressed in term infants. During sleep, the mean amount of infraslow activity was 27 percent greater in males, while during wakefulness the average amount of higher frequencies was 17 percent greater in girls. Both these differences indicate an earlier maturation of cortical function in females than in males [Thordstein et al., 2006].
Frontal sharp waves may be abundant, especially during quiet sleep. These waveforms are bilateral and synchronous, but also can be asymmetric. Frontal sharp waves occur less often during active and indeterminate sleep segments, and are least likely to occur during low-voltage irregular active sleep [Arfel et al., 1977; Statz et al., 1982]. During sleep, frontal sharp transients are observed until the beginning of the second month of life [Ellingson and Peters, 1980; Weiner et al., 1991].
As with preterm infants, the clinical significance of spikes and sharp waves in asymptomatic term neonatal populations remains controversial. Most studies do not have adequate follow-up, or entry criteria were based on a clinical rather than an EEG diagnosis. Clancy and associates identified 69 healthy infants who had acute, life-threatening events (i.e., near-miss sudden infant death syndrome) [Clancy et al., 1985]. Analyses of 10 minutes of active sleep documented more frequent sharp waves in near-term than in term infants. Temporal sharp waves were more abundant than centrally located discharges, persisting until 45 weeks’ postconceptional age and disappearing by 50 weeks’ postconceptional age. Karbowski and Nencka studied 1-hour sleep recordings in 82 term, healthy newborns without subsequent follow-up [Karbowski and Nencka, 1980]. They found that 81 percent had predominantly right centrotemporal sharp waves, with an average interval of 3 minutes and 47 seconds. Only 12 percent had predominately left central waves, with an average interval of 15 minutes. All discharges were evident primarily in indeterminate sleep. Statz and colleagues evaluated 24 term, healthy infants 9–12 months of age after obtaining a neonatal sleep recording [Statz et al., 1982]. They observed sporadic, multifocal, nonrepetitive discharges during quiet sleep in all infants; only 25 percent of infants had discharges during active sleep. The parietal region had the most abundant discharges, with intervals between 38 seconds and 25 minutes.
The clinical significance of spikes and sharp waves that appear in preterm and term neonatal recordings needs further investigation. Sporadic sharp waves may be normal or abnormal, depending on the clinical context, the EEG background activity, location, morphology, and postconceptional age emphasized [Karbowski and Nencka, 1980]. Unless discharges are repetitive, periodic, or positive in polarity, pathologic significance should be cautiously assigned. Central sharp-wave transients and rhythmic, sharply contoured theta are found in the parasagittal and vertex regions. This midline pattern is rhythmic and has a spindle-like appearance [Hayakawa et al., 1987]. It is unknown whether this rhythmic activity is rudimentary sleep-spindle activity that will appear at 2–4 months of age. Delta brush patterns are occasionally observed during the quiet sleep segment, but they are rare and isolated primarily to the temporal and occipital regions.
Synchrony should be 100 percent during sleep of the term neonate. Transient asymmetries, mainly in the temporal regions, can be observed, particularly during the initial minutes of quiet sleep [Challamel et al., 1984; O’Brien et al., 1987]. Ontogeny of EEG sleep by the end of the neonatal period (i.e., 28 days after a term birth) has been systematically investigated by a handful of researchers [Beckwith and Parmelee, 1986; Ellingson and Peters, 1980; Lombroso, 1979; Scher, 2008]. Gradual disappearance of tracé alternant by 3–6 weeks after a term birth has been described. Change from active sleep to quiet sleep onset on falling asleep has also been described. Sleep spindles commonly observed at 2–4 months of age also may be seen as early as 4–6 weeks of age. Frontal sharp waves persist for up to 3–4 weeks after birth.
Although no significant differences can be distinguished between the maturational criteria at 1 month in preterm compared with term infants, some subtle differences have been observed in the elements of sleep architecture. Longer bursts during tracé alternant, early sleep-spindle appearance, more immature patterns at term, better phase stability, and specific frequency bands are described [Joseph et al., 1976]. Behavioral criteria of sleep are also different between the two groups, suggesting that sleep organization of the preterm neonate to term and beyond is not entirely equivalent to the term newborn [Watt and Strongman, 1985]. On polygraphic recordings, differences between preterm and term cohorts at matched postconceptional term ages have been described. The sleep cycle in the preterm at postconceptional term age is one-third longer than that of the term infant and has a greater percentage of quiet sleep. These neonates had fewer movements, fewer and shorter arousals, higher mean rectal temperatures, less cardiorespiratory regularity during quiet sleep, and lower spectral EEG energies during specific sleep-state segments than term infants. Although subtle, each of these differences reflects conditions of prematurity on brain maturation for a specific neuronal system that subserves sleep. Adaptation of brain function of the preterm infant as expressed on EEG sleep studies may reflect physiologic dysmaturity to biologic and environmental stresses that may occur by intrauterine and extrauterine factors [Amiel-Tison and Pettigrew, 1991; Scher et al., 1996; Scher et al., 1994a; Scher et al., 1994b; Scher et al., 2003c; Scher et al., 1992; Scher et al., 1994c].
Normal Electroencephalographic Patterns in Infancy through Adolescence
Waking Patterns
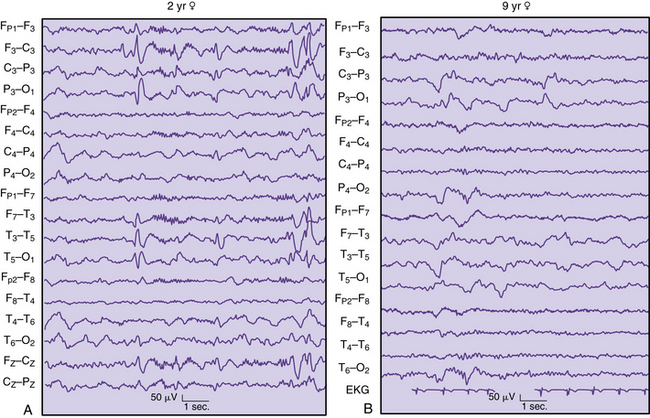
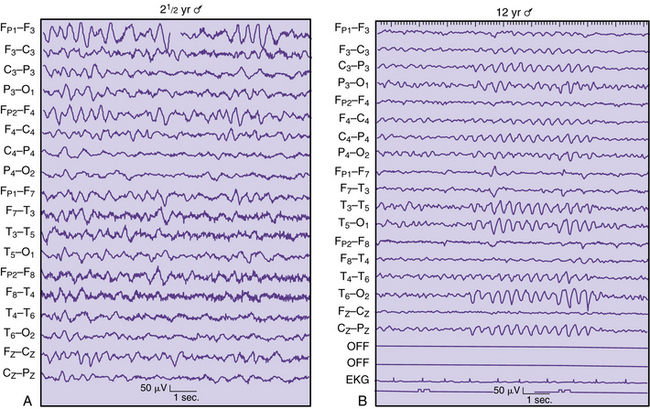
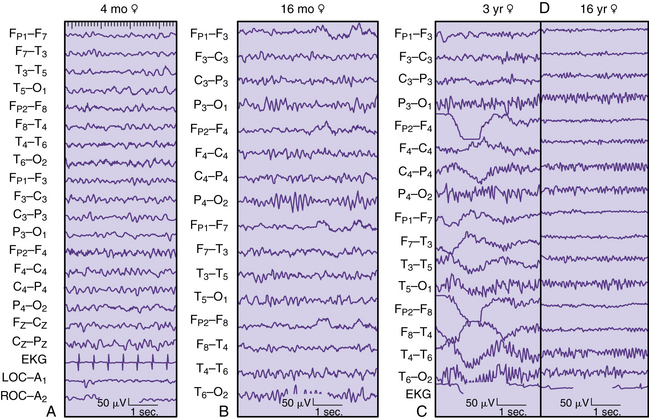
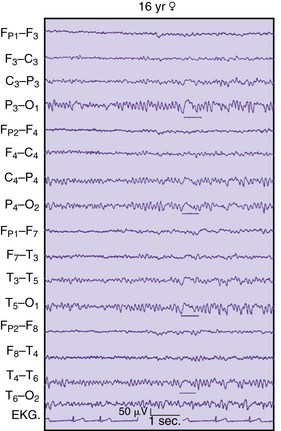
One of the fundamental characteristics of the waking EEG pattern is the dominant background activity. Berger initially described how the dominant frequency increased as ages advanced during childhood [Berger, 1931]. By 3–4 months of age, a discernible occipitoparietal rhythm of 3–4 Hz is observed (Figure 12-11A). The activity approximates 5 Hz by 6 months, and increases to 6–7 Hz by 9–18 months of age (see Figure 12-11B). The 6- to 7-Hz frequency remains fairly stable until 2 years of age, when it varies between 7 and 8 Hz. By 3 years of age, the dominant waking rhythm of childhood is within the alpha range in 82 percent of children [Eeg-Olofsson, 1971; Petersen and Eeg-Olofsson, 1971] (see Figure 12-11C). The mean frequency is 9 Hz by 7 years of age and 10 Hz by 15 years of age (see Figure 12-11D). Quantitative analysis of the EEG posterior-dominant rhythms in healthy adolescents has documented that the maturation of the posterior dominant rhythm is nearly complete by age 16. Further, the frequency range of this rhythm is substantially narrower than the alpha range [Marcuse et al., 2008].
Certain modifications in the waking dominant activity have been observed under different conditions. Passive eye closure causes the dominant rhythm to become better developed, whereas eye opening clearly attenuates the activity. This phenomenon becomes initially apparent at 5–6 months of age [Kellaway and Petersen, 1964]. The dominant rhythm may slow by 1–2 Hz during the drowsy state, sometimes accompanied by a lessening of associated muscle artifact.
The amplitude, asymmetry, and locus of the dominant rhythm also change with increasing age. Higher amplitudes are seen at younger ages, with maximum amplitudes at 6–9 years that subsequently decline during adolescence. Asymmetries of this activity can be expected, with higher amplitude on the right in 20 percent of children, although differences of 50 percent or greater must be considered with suspicion. No correlation to hand dominance has been demonstrated. About 70 percent of adults and 95 percent of children have an occipital location to the dominant rhythm, but at least three independent alpha rhythms can be recorded over the scalp – occipital, temporal, and central regions – which may differ in frequency as much as 2 Hz [Kellaway, 1979]. More anterior expression of the dominant rhythm becomes evident during adulthood.
The importance of eye-opening versus eye closure resting conditions has been demonstrated more recently in children using electrodermal activity and EEG. Eye-closed resting skin conductance levels were negatively correlated with mean alpha level only. Eye-open conditions had higher skin conductance levels, and reduced across sites for mean activity in the delta, theta, alpha, and beta bands, compared to the eyes-closed condition [Barry et al., 2009].
Beta Activity
Three distinctive band ranges are described for beta frequencies in waking EEG recordings of children [Ebersole and Pedley, 2003]. Limited diagnostic use can be applied to the overall description of fast activity. Beta activity in the range of 18–25 Hz is most commonly encountered, with ranges of 14–16 Hz and 35–40 Hz observed less frequently. Symmetric distribution over each anterior head region is usually observed. Asymmetries of as much as 30–40 percent can be encountered without the presence of a structural lesion. Important diagnostic conclusions can be assigned if beta activity is reduced by more than 50 percent, especially when associated with delta or theta slowing in the same head region. Prominent scalp edema can also attenuate the high-frequency EEG signals in the absence of cerebral pathologic conditions. Symmetric prominence of beta activity is commonly encountered with the administration of certain sedative medications, especially barbiturates or benzodiazepines. Skull defects can contribute to an asymmetric exaggeration of beta activity over the bony defect, although it usually has little clinical relevance [Cobb et al., 1979].
Theta and Delta Slowing
Theta rhythms are commonly encountered in the frontocentral regions and are usually related to drowsiness or heightened emotional states. In the past, theta rhythms were associated with a variety of clinical conditions, including epilepsy, but their common occurrence is now better appreciated as a normal variant [Hrachovy et al., 1990].
Posterior slow waves located in the parieto-occipital regions, commonly referred to as posterior slow waves of youth, constitute the most frequently observed normal delta slow activity in the waking EEG record of children (Figure 12-12). Commonly located in the occipitoparietal or occipitotemporal regions is a 2.5- to 4.5-Hz monorhythmic or polymorphic delta wave with an amplitude of less than 100 μV [Aird and Gastaut, 1959]. Superimposed alpha activities are also observed with these delta waves, which can have symmetric or asymmetric occurrences. The neurologist should view an asymmetry of greater than 50 percent between regions with suspicion. It will block with eye opening and disappear with the alpha rhythm during drowsiness. Rarely seen before 2 years of age, it has maximum expression between 8 and 14 years, especially in females. Approximately 25 percent of normal children have this pattern [Eeg-Olofsson, 1971]. The distinction between this pattern and other abnormal slow-wave activity should be based on complexity of the waveform, persistence, symmetry, and amplitude, all in the context of closed-head injury, hypoxia, or other encephalitides.
Lambda Waves
Lambda waves can be observed in normal patients while they are viewing a well-illuminated picture of complex design. Sharply contoured occipital transients with a prominent surface-positive phase lasting 75–150 msec are described, although an extremely sharp appearance may cause suspicion of an abnormality. Eye closure or darkening of the room eliminates lambda waves, whereas occipital spike discharges persist. These transients are observed in young infants and can be seen occasionally in neonates [Tharp, 1986].
Hyperventilatory Response
In the past, a response to hyperventilation was considered evidence of a brain abnormality in children [Lindsley and Cutts, 1940]. However, it has become commonplace to observe prominent high-amplitude slowing in normal children, with maximum expression between 8 and 12 years that persists as a less significant electrographic change into adulthood [Petersen and Eeg-Olofsson, 1971]. A greater degree of response has been associated with lower blood glucose or carbon dioxide concentrations [Konishi, 1987b]. Standardization of hyperventilation is necessary for the clinician to best judge the EEG slowing relative to age differences reported for children [Konishi, 1987a, 1987b].
Proper testing procedure requires 3–5 minutes of overbreathing by the child to elicit the response. Careful notation of artifact and an anticipation of spikelike, high-amplitude sharp waves are emphasized [Ebersole and Pedley, 2003]. Superimposed faster frequencies that may appear to be spike discharges are followed by slow waves during hyperventilation and are commonly overinterpreted as an abnormal finding (Figure 12-13A). Only the appearance of clearly defined generalized or focal spike complexes or focal, lateralizing slow waves is to be potentially interpreted as abnormal. Studies are needed that incorporate analysis of evidence to ascertain the role of hyperventilation in routine clinical EEG studies in children. Although this activating maneuver frequently assists in temporally correlating interictal or ictal spike-and-wave discharges of generalized or focal distribution for specific populations of children with absence of localization-related epilepsies, nonepileptic automatisms are common in children exhibiting hyperventilation-induced, high-amplitude rhythmic slowing and absence seizures. Yawning, smiling, fidgeting, and, less often, eye opening and fluttering mimic seizures, and can be distinguished reliably only by EEG or preferably by synchronized video-EEG [Lum et al., 2002]. In a study of an epileptic population (92 percent were older than 18 years), patients with localization-related or generalized epilepsies were relatively resistant to routine hyperventilation. Only 21 of 433 patients had interictal discharges or rarely seizures during the procedure [Holmes et al., 2004]. A recent report has questioned the efficacy of performing hyperventilation during routine clinical EEG studies, even in children with generalized epilepsy [Raybarman, 2009]. Pediatric guidelines need to be developed that are evidence-based for both routine studies and prolonged recordings in pediatric epilepsy monitoring units.
Photic Stimulation
Taking these possible sources of artifact into consideration, the normal phenomenon is a sharp surface-positive waveform, maximal in the parietal and occipital electrodes, which matches the flash frequency (Figure 12-14A). Photic stimulation might induce drowsiness, including a normal sharp-wave phenomenon known as posterior occipital sharp transients (see Figure 12-16C below). Slower flash frequencies result in more prominent responses in younger children. However, the spike discharges in these posterior leads can be diffusely distinguished by their waveform, field, symmetry, and persistence relative to the start and end of the flash of light. The abnormal photoparoxysmal response (see Figure 12-14B and C) is discussed in a subsequent section, including its relationship to epilepsy and withdrawal states.
Fig. 12-14 Types of EEG photic responses.
(A, Courtesy of Dr. P Crumrine, Children’s Hospital, Pittsburgh.)
Drowsy Patterns
A drowsy state represents a transition from wakefulness associated with the disappearance of the occipital alpha rhythm and the emergence of central-parietal theta activities. Pendular eye movements may be detected in the anterior, temporal, or frontopolar channels. EEG changes may precede behavioral evidence of sleepiness, especially in the younger child. This period of successively greater amounts of rhythmic and paroxysmal slow activity has been called hypnagogic hypersynchrony and may be overinterpreted by the inexperienced clinician [Kellaway, 1952]. Similar to the notched, sharp-wave activity during hyperventilation, superimposed activity may be seen during drowsiness and misinterpreted as abnormal spike or sharp-wave discharges (see Figure 12-13B).
Sleep-Activation Procedures
Based on an extensive review of the subject of sleep and sleep deprivation [Bechinger and Kornhuber, 1976; Ellingson et al., 1984], there is general agreement that sleep and sleep deprivation have a substantial activating effect on the occurrence of interictal epileptiform discharges. Recent updates addressed the activating effect of sleep deprivation over and above the effect of only sleep [DeRoos et al., 2009; Mendez and Radtke, 2001]. Most published guidelines do not recommend sleep deprivation for the initial study because of the burden to the patient [Glick, 2002]. However, sleep deprivation has been considered superior to sleep alone in one study [DeRoos et al., 2009], although other investigators suggest that sleep state can be better achieved during routine EEGs by simply ordering the sequence of activation procedures [Kaleyias et al., 2006]. By performing hyperventilation first with photic stimulation at the end of the study the neurophysiologist can maximize the yield of attaining sleep during a routine recording. The pediatric patient presents specific challenges to obtaining the optimal EEG study, particularly when the parents are asked to sleep-deprive themselves while attempting to maintain wakefulness for their child in order to guarantee sleep initiation better. The complementary value of sleep-deprived EEG in specific pediatric groups, such as those with childhood epilepsy, is advocated by some authors [Shahar et al., 2009] to assess for epilepsy risk. The inclusion of sleep as part of the child’s study ensures a greater likelihood for the activation of specific epileptiform features associated with specific epileptic syndromes such as benign rolandic epilepsy of childhood, Landau–Kleffner syndrome, and electrical status during slow-wave sleep. Children with generalized or localization-related epilepsies may have different diagnostic yields by obtaining sleep with or without sleep deprivation. Similar to the situation for adults, evidence-based medicine does yet not meet the standards for children. One study assessed the value of partial sleep deprivation as a routine measure in pediatric EEG and reported that the procedure was well tolerated, with a greater proportion of children achieving sleep without deprivation [Liamsuwan et al., 2000]. However, diagnostic efficacy among clinical groups has not been evaluated. Future studies must delineate the subgroup of epilepsies that have significant sensitivity to sleep and sleep-deprivation effects.
Apart from the previously mentioned controversy, pediatric neurologists must recognize the reciprocal relationships between sleep and epilepsy and the management of sleep complaints in the patient with epilepsy [Vaughn and D’Cruz, 2004]. There can be the disruption of sleep brought on by seizures because of disruption of the sleep–wake cycle. The physician must anticipate the effects of antiepileptic medications on sleep, including vagal nerve stimulator effects. Patients with epilepsy have a greater prevalence for sleep disturbances than normal subjects, exemplified by specific sleep disorders such as obstructive sleep apnea, restless legs syndrome, and periodic limb movement syndrome. Sleep complaints centering on excessive daytime sleepiness or difficulties initiating or maintaining sleep must also be addressed.
Sleep Patterns
Electroencephalographic Neonatal Sleep as an Ultradian Rhythm
During the last several decades, extensive information has been published with respect to the existence and functional significance of ultradian rhythms (i.e., any rhythm less than 24 hours) in humans [Schulz and Labie, 1985]. Durations of ultradian rhythms between 30 minutes and 24 hours may represent an important portion of the spectrum of human biologic rhythms [Hildebrandt, 1986]. The human sleep cycle fits into a longer ultradian period of 75–90 minutes; individual EEG frequencies that are composed of oscillatory activity with much shorter periods last only milliseconds.
Two biorhythmic processes define the temporal organization of sleep in the neonate: a weak circadian sleep–wake rhythm and a stronger ultradian REM–non-REM rhythm [Glotzbach et al., 1995]. Both biorhythms evolve over increasing ages. Internal “biologic clocks” become better organized around environmental cues, such as the light–dark cycle, temperature, noise, and social interaction [Anders et al., 1995]. In normal term newborns, sleep alternates with waking states over a 3- to 4-hour cycle at night and during the day. Within the first month or two of life after birth for the term infant, sleep–wake state organization begins to adapt to the light and dark cycles, as well as regularly recurring social cues. Circadian rhythmicity of body temperature and heart rate occurs in approximately 50 percent of preterm infants at 29–35 weeks’ conceptional age [Mirmiran and Kok, 1991]. However, longer-run ultradian rhythms of 3–4 hours’ duration correspond to feeding and social interventions [Glotzbach et al., 1995]. Increases in body movement activity and heart rate, and decreases in rectal skin temperature, are present during interventions, reflecting changes in the infant’s microenvironment and the infant–caretaker interactions. Even the ultradian EEG sleep cycle length of the preterm infant, as defined by changes in EEG discontinuity, shows a positive correlation of cycle length and increasing postconceptional age. By postconceptional term age, the ultradian EEG sleep cycle is longer for the preterm than for the term infant [Scher et al., 1992]. Regardless of the cycle length, the architecture remains the same between preterm and term groups, and is composed of active sleep segments interrupted by transitional or indeterminate sleep segments. Reactivity or arousal periods punctuate within and between sleep segments. Indeterminate sleep and arousal phenomena represent important expressions of sleep continuity.
The neonatal ultradian EEG sleep cycle is approximately 30–70 minutes [Dreyfus-Brisac, 1970; Parmelee et al., 1969; Weiner et al., 1991]. The sleep segments that constitute this cycle include two active and two quiet sleep segments, usually beginning as an active sleep portion on falling asleep. Transitional sleep segments within and between active sleep segments are commonly called indeterminate sleep segments. Reactivity or arousal periods also punctuate within and between sleep segments. Indeterminate sleep and arousal phenomena represent important expressions of sleep continuity.
Mathematical relationships among sleep components better define the development of this ultradian neonatal sleep cycle in the infant [Harper et al., 1981]. Sleep parameters, including EEG sleep state, motility, REM, and arousal, can be better expressed quantitatively in terms of period length, amplitude, and phase. For a particular gestational age range, specific period, phase, and amplitude, relationships may better define ontogeny of the EEG sleep cycle. With maturation of the CNS, relationships solidify among these parameters.
Longitudinal studies of the EEG sleep cycle of the preterm infant maturing to term explore how this ultradian rhythm develops within the neonatal intensive care unit environment. Comparisons of EEG sleep organization in the preterm infant at a corrected term age with term infants can then highlight how preterm infants adapt to this extrauterine environment, reflecting brain altered maturation [Scher, 2005a; Scher et al., 2003c]. It then follows that comparisons of preterm sleep patterns can also be made with fetal state patterns. Differences between intrauterine- and extrauterine-reared groups reflect differences in CNS maturation and developmental neuroplasticity. Maternal circadian effect, as well as placental function, influences fetal brain development, which is replaced by extrauterine effects from environmental stimulation or disease states in children born prematurely.
Although ontogenetic studies of ultradian physiologic rhythms in the term neonate and young infant were studied decades ago [Dittrichova et al., 1972; Parmelee, 1967; Stratton, 1982], specific studies of preterm EEG sleep parameters involving quantitative techniques have only recently been compared with term infant data. There may be interesting EEG interrelationships among sleep, REM, arousals and motility patterns with maturation across increasing gestational ages. Although circadian influence may not be established until sometime after birth [Hellbrugge, 1960, 1968], important periodic, phasic, and amplitude relationships may exist as ultradian rhythms during the preterm neonatal or fetal periods.
A brief discussion of specific noncerebral components within the EEG sleep rhythm highlights the importance of correlating such parameters with the electrographic portion of the sleep rhythm during maturation. Rapid eye movement represents one of the principal features of active sleep. Active sleep constitutes about 50 percent of the neonatal sleep cycle at term; however, REM appears to be time-locked to continuous EEG activity as early as 31–32 weeks’ gestation [Curzi-Dascalova et al., 1988]. REM activity is not a random rhythm [Prechtl and Lenard, 1967], and may have predictable intervals of occurrence [Dittrichova et al., 1972]. Different classes of REM may exist at different times of the sleep cycle, and the numbers and types of REM increase with maturation [Evsyukova, 1980; Lynch and Aserinsky, 1986]. This feature also can be measured during fetal life and is associated with continuous EEG activity in preterm neonates as early as 30 weeks’ estimated gestational age [Prechtl et al., 1979]. Closer identification of REM occurrence, as well as quantification during different EEG states, is needed to understand this important developing ultradian rhythm better. REM occurrence during active sleep segments constitutes an important maturational milestone of the immature brain; it may have significance as a biologic marker, and it may be assessed in clinical situations.
Motility patterns are an integral part of the neonatal sleep cycle [Anders et al., 1971]. Different motility patterns appear at successively older neonatal ages up to the term infant. Their ontogenetic patterns are seen in extrauterine-reared neonates and fetuses [Robertson, 1982; Robertson, 1987]. Myoclonic and entire body movements predominate in the preterm infant [Fukumoto et al., 1981; Prechtl et al., 1979], whereas smaller, slower body movements are seen in the term neonate. Attention to specific segments of the EEG sleep cycle of the neonate is important because motility patterns may differ during different segments of the cycle [Hayakawa et al., 1987]. Although similar motility patterns in the fetus reflect in utero maturational changes in motor pathways, as documented by fetal ultrasonography [Prechtl, 1984; Robertson, 1982; Robertson, 1987], differences in motility behavior in preterm infants may signify altered brain development in an extrauterine environment.
Maturational trends in cardiorespiratory behavior have also been studied in preterm infants using spectral analyses. Decreased variability of cardiorespiratory behavior is seen with increasing postconceptional age [Scher et al., 1995]. However, spectral EEG measures appear to be stronger indicators of functional brain maturity compared with noncerebral measures, such as cardiorespiratory behavior. Periodic breathing and respiratory pauses are physiologic events that commonly occur in preterm infants [Glotzbach et al., 1989; Martin et al., 1986]. Cardiorespiratory measures and motility and temperature changes do not correlate with changes in EEG continuity, REM, or spectral EEG energies of the preterm infant or at any specific postconceptional age [Scher et al., 1997b].
Vertex Waves and Sleep Spindles
The transitional state of drowsiness is sometimes referred to as stage 1 of sleep and may include sharp-wave discharges that are maximal in amplitude over the vertex and central regions. Commonly, symmetric central diphasic waveforms become better expressed and more abundant during stage 2 sleep, which coincides with the appearance of sleep spindles. These waveforms usually have an initial surface-negative wave, followed by a surface-positive phase. The onset of vertex waves can be between 2 and 5 months of age and can appear asymmetric, particularly at younger ages. If this asymmetry exceeds 20 percent, the neurologist must consider the presence of a lesion on the attenuated side (see Figure 12-6A). Excessively asynchronous appearance of vertex waves has been associated with increased intracranial pressure or structural midline defects, such as agenesis of the corpus callosum [Kellaway, 1979].
Sleep spindles primarily define stage 2 of sleep and are not clearly expressed until 3–4 months of age. Synchrony is gradually achieved with increasing age, and most spindles are bilaterally synchronous by 18 months (Figure 12-15). The waveform morphology of sleep spindles in infants differs from that of older patients. The duration of spindles is 1.5–1.8 seconds at 4–6 months. At this age, they frequently reach 4–6 seconds, which subsequently shortens to 0.5 second by 25–54 months [Tanguay et al., 1975].
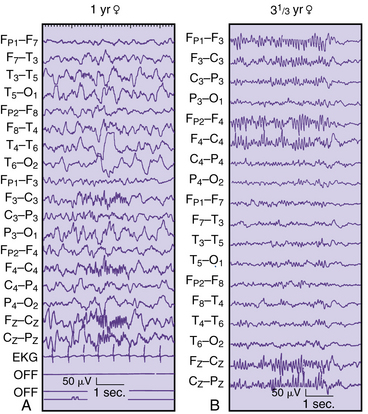
Spindles lasting as long as 4–6 seconds are frequently observed in infants younger than 1 year, but “extreme” spindles have been described in neurologically abnormal children of older ages (see Figure 12-15B). The common frequency range is 13–14 Hz, but slower spindle frequencies of 10–12 Hz are also documented in about 5 percent of children older than 5 years. Spindle density is highest at 3–9 months and at a minimum at 27–54 months [Kellaway and Fox, 1952]. Faster bursts of 18–22 Hz may resemble spindles but are usually associated with medications, such as benzodiazepines and barbiturates. Sleep spindle evolution from infancy to adolescence has been described [Scholle et al., 2007]. Sleep spindle activity changes with maturation in terms of length and density. The establishment of age-related normative data of sleep spindle activity will improve the identification of non-REM 2 in infancy, childhood, and adolescence, and enable detection of delayed neuronal maturation and/or sleep stability.
General characteristics of sleep development in children include both subjective and objective aspects of this unique state of consciousness [McLaughlin Crabtree and Williams, 2009]. Notably, sleep duration decreases substantially from infancy through adolescence with increased consolidation of sleep to the night-time period only. It has been postulated that the development of non-REM sleep instability-continuity defined as the cyclic alternating pattern emerges from 1–4 months of age, after the disappearance of the neonatal quiet sleep segment termed tracé alternant. It has been postulated that this specific ultradian rhythm appears coincident with the development of spindles and slow-wave delta waves mixed with theta frequencies [Miano et al., 2009]. Sleep architecture exhibits a variety of developmental changes, such as decreases in slow-wave sleep and increases in stage 2 sleep from childhood to adolescence. There is an adolescent decline in non-REM delta as an indicator of brain maturation, linked to age and gender but not pubertal stage [Feinberg et al., 2006]. Although the developmental changes noted during sleep are dramatic and comparatively rapid during the first several decades of life, changes occur across the life span as a reflection of both the aging process and continual environmental effects and disease occurrence.
Occipital Sharp Transients
Two types of sharp transients can occur in the occipital region during sleep. Posterior sharp transients of sleep are surface-positive, checkmark-like waveforms, which usually occur in runs of 4–5 Hz but may occur singly. Although appearing asymmetrically, these waveforms are bilaterally synchronous. Although posterior sharp transients of sleep can appear between 4 and 5 years of age, they are most commonly encountered during the early sleep of young adults 15–35 years of age (Figure 12-16C) [Vignaendra et al., 1974]. The other form of occipital transients in children also appears during drowsiness. It has a cone-shaped configuration or a diphasic sharp wave resembling a vertex transient [Kellaway, 1979].
Frequency Distribution during Sleep
More pronounced beta activity can accompany drowsiness. As stage 2 sleep emerges, a definite frequency and amplitude gradient can be appreciated between the anterior and posterior head regions. Higher-frequency, lower-amplitude activity predominates in anterior head regions, with the converse situation occurring in posterior head regions. With deeper sleep, this gradient is less well defined. Its absence or poor organization has been observed in children with developmental delays [Slater and Torres, 1979].
Arousal Patterns
Infants younger than 2 months of age have only a diminution of background amplitude with arousal. By 2–3 months of age, diphasic slow waves accompany this desynchronization and may merge with delta waves by 5 months of age. With further arousal, 4- to 8-Hz rhythmic waveforms appear diffusely or in the frontocentral regions, last for several seconds, and disappear by 4 years of age. More monorhythmic 4- to 5-Hz activity may persist into young adulthood and can be seen in 40 percent of children 10–14 years old [Gibbs and Gibbs, 1950]. Postarousal hypersynchrony of 2.5–3.5 Hz generally appears frontally but may also be expressed posteriorly with further arousals. Such electrographic changes cease at any time, with the recording reverting back to the previous sleep pattern.
More recent guidelines for spontaneous arousals in healthy infants have been presented that distinguish cortical from subcortical arousals based on both electroencephalographic and polysomnographic criteria [International Pediatric Group, 2005]. The maturational process was different between cortical arousals and subcortical activation, suggesting a different maturational sequence of the different brain centers regulating arousals [Montemitro et al., 2008].
Patterns of Uncertain Significance
The most commonly encountered pattern is the 14- and 6-positive spike discharge (see Figure 12-16A). Although initially assigned clinical significance, this pattern subsequently has been identified in several control populations [Lombroso et al., 1966]. These surface-positive waveforms appear in the posterotemporal regions or adjacent areas during sleep, with a 60- to 70-μV, comb-shaped configuration that may last as long as 3 seconds. It is best demonstrated with a referential montage and has a peak incidence during adolescence.
The 6-Hz spike-wave complexes are less common waveforms, having maximal amplitude in the centroparietal regions. Historically considered clinically important in patients with headache and autonomic symptoms, they can be seen in normal control subjects, especially adolescents [Gibbs and Gibbs, 1964]. These complexes can be induced by diphenhydramine in 30 percent of normal volunteers (see Figure 12-16B) [Tharp, 1966]. Small, sharp spikes and psychomotor variants are uncommonly observed in young children but rarely have a relationship with clinical syndromes. Small, sharp spikes occur more frequently in a normal rather than a patient population [Gibbs et al., 1963; White et al., 1977]. Psychomotor variant patterns also are described in as many normal, asymptomatic individuals as in study patients.
Abnormal Electroencephalographic Patterns
Abnormal Neonatal Electroencephalographic Patterns
Numerous medical complications can contribute to an encephalopathic state in the sick neonate, consisting of diffuse, multifocal, or focal brain dysfunction [Mizrahi and Kellaway, 2003; Scher, 2005a]. Many times, focal and diffuse processes exist simultaneously, creating a more difficult interpretative situation. EEG findings can substantially add to clinical assessments, given the limited clinical repertoire of the immature infant and the practical limitations of a sick neonate who is confined by catheters, intubation, pharmacologic paralysis, and an isolette. Visual and computerized analyses of EEG patterns will assume greater significance as outcome measures are developed that will assess the efficacy of neuroprotective interventions. Comparison of the neonate’s EEG background activity with that expected for a particular gestational or postconceptional age can rapidly estimate the severity of a neonatal encephalopathy.
Four general guidelines must be recognized before applying EEG analysis to the assessment of the newborn with suspected CNS dysfunction. First, neonatal EEG abnormalities are nonspecific with respect to etiology; a specific diagnosis is only infrequently associated with a particular EEG pattern. Second, it is difficult to determine by only a single EEG study if the observed EEG abnormalities are reflective of a transient or more permanent encephalopathy, unless serial studies are obtained. Third, EEG abnormalities alone cannot be interpreted by the clinician with respect to the timing of the brain insult. Fourth, despite the degree of severity regarding EEG patterns, abnormalities usually disappear rapidly over time. This “normalization” of EEG disturbances can occur even in infants who will later suffer severe neurologic sequelae [Lombroso, 1985; Tharp et al., 1981]. Obtaining several EEG studies is recommended for all high-risk infants, beginning during the acute phase of the illness and repeated judiciously over the first days of life into the second week until normal studies are obtained, or alternatively, electrographic abnormalities are noted to persist.
Assessment of Prognosis
Serial EEG studies during the neonatal period offer more information than can be obtained from an isolated recording. None the less, some reports emphasize the prognostic significance of single recordings with severely abnormal features [Harris and Tizard, 1960; Watanabe et al., 1980], whereas other reports suggest that serial studies provide the clinician with a sensitive prognostic indication of neurodevelopmental outcome [Monod et al., 1972; Tharp et al., 1981]. Monod and colleagues [Monod et al., 1972] analyzed 691 neonatal EEG studies of 270 children whose clinical conditions were documented from 3 to 14 years. Certain EEG abnormalities were related to neurologic sequelae. Examples of suppression-burst (paroxysmal), isoelectric, multifocal sharp-wave patterns, and an invariant pattern are shown in Figures 12-17 to 12-20. Tharp and colleagues subsequently adapted these abnormalities to preterm neonates [Tharp et al., 1981]. From a retrospective analysis of 184 neonatal EEG studies of 81 infants born at or before 36 weeks’ gestation, and subsequent clinical assessment of 64 survivors, a severely abnormal pattern was of prognostic value. Table 12-1 summarizes the major EEG abnormalities discussed in these two studies. Severe EEG disturbances help establish a reference point for the neonatologist. Improving or worsening trends may have important prognostic implications in the context of the neonate’s evolving clinical condition. Further descriptions of various diffuse encephalopathic abnormalities in preterm and term neonates are available [Barabas et al., 1993; Scher, 1993a, 1993b].
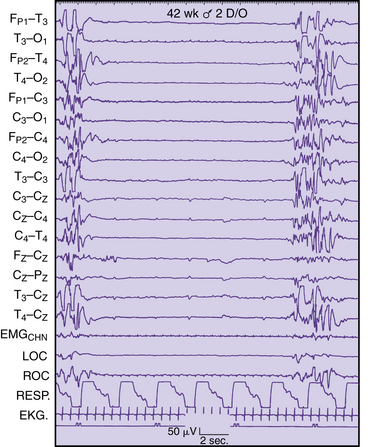
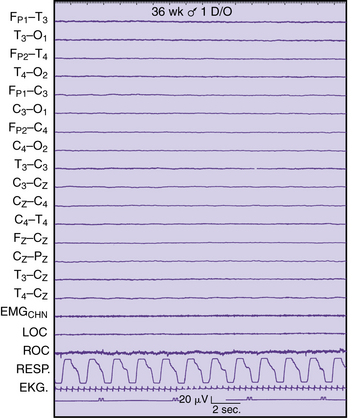
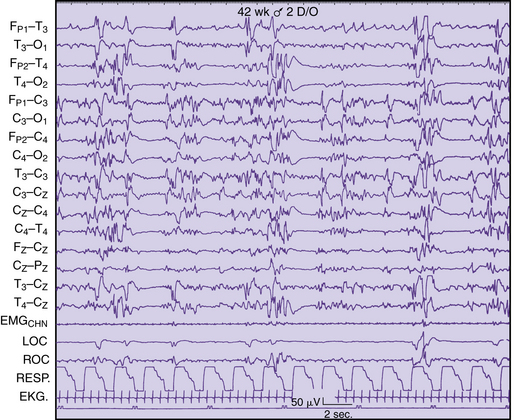
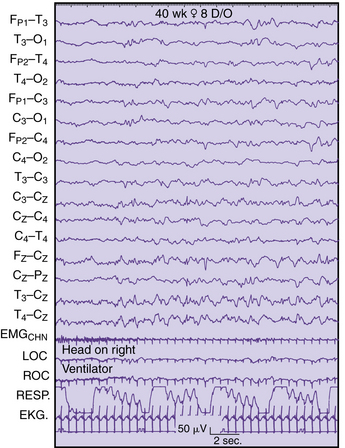
| Abnormalities | Near-term and Term Infants* (36–41+ weeks) |
Preterm Infants† (30–36 weeks) |
|---|---|---|
| Inactive‡ | X | X |
| Burst suppression | X | X |
| Slow | X | X |
| Low voltage§ | X | |
| Monorhythmic | X | |
| No spatial/temporal organization | X | |
| Asymmetry | X | X (>5%) |
| Interhemispheric asynchrony | X | X |
| Abnormal superimposed patterns | X | |
| Focal spikes | X | X |
| Seizures | X | X |
* Data from Monod N, Pajot N, Guidasci S. The neonatal EEG. Statistical studies and prognostic value in full-term and preterm babies. Electroencephalogr Clin Neurophysiol 1972;32:529.
† Data from Tharp BR, Cukier F, Monod N. The prognostic value of the electroencephalogram in premature infants. Electroencephalogr Clin Neurophysiol 1981;51:219.
‡ Below 5 mV or isoelectric, 0.5–1 Hz.
(Adapted from Scher MS. Cerebral neurophysiological assessment of the high-risk neonate. In: Guthrie RD, ed. Recent Advances in Neonatal Care. Clinics in Critical Care Medicine. New York: Churchill Livingstone, 1987.)
Focal Abnormalities
Neonatal EEG patterns have only recently been shown to be helpful in the evaluation of focal, regional, or hemispheric brain abnormalities [Aso et al., 1989; Mizrahi and Kellaway, 2003; Scher, 2005a]. Parasagittal and lateralized EEG abnormalities (central or midline regions) have been correlated with a variety of brain lesions. In a population of 60 neonates with midline EEG abnormalities and cerebral lesions identified with neuroimaging or neuropathologic studies, intraventricular hemorrhage was the most common hemorrhagic lesion, whereas periventricular leukomalacia and cerebral infarction were the most common ischemic lesions associated with parasagittal abnormal patterns [Scher and Barmada, 1987a]. Midline EEG abnormalities include amplitude attenuation, positive sharp waves, seizures, and discharges associated with myoclonus. Other studies have also demonstrated the association of positive vertex sharp waves with intraventricular hemorrhage [Clancy and Tharp, 1984; Cukier et al., 1972; Lombroso, 1981] (Figure 12-21) or periventricular leukomalacia [Novotny, 1986], and the association of midline electrographic seizures with infarction [Clancy and Fischer, 1984; Scher, 1987b]. Late chronologic changes in neonatal EEG findings with periventricular leukomalacia have also been described, after positive sharp waves and other midline or rolandic abnormalities have been noted in the acute time period. Chronic stage changes consist of persistent amplitude and frequency suppression of varying degrees of severity, emphasizing the greater efficacy of serial recordings [Kidokoro et al., 2009].
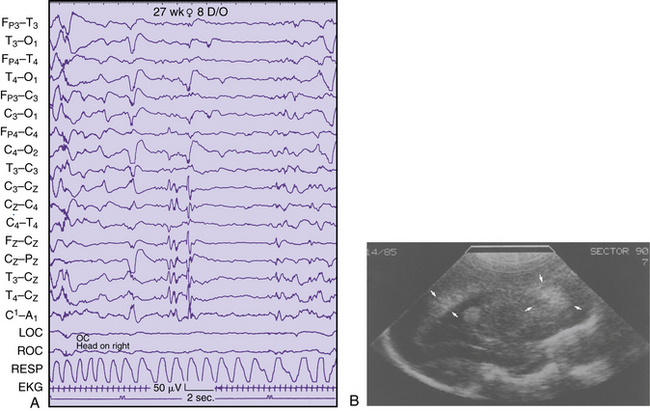
Fig. 12-21 Positive vertex sharp waves seen with intraventricular hemorrhage.
(From Scher MS. Midline electrographic abnormalities and cerebral lesions in the newborn brain. J Child Neurol 1988;3:135.)
Lateralized EEG abnormalities, including neonatal seizures, have been associated with congenital or acquired brain lesions (Figure 12-22). After the seizure, the prominent abnormality is an attenuation of background frequencies or amplitude. In one report describing 271 EEG studies of 58 neonates (28 preterm, 30 term), almost 90 percent of infants with hemorrhage or infarction had the maximum EEG abnormality on the side of the injury [Scher, 1982]. The attenuation disappeared in 20 percent of these EEG recordings within 3 weeks, without asymmetry in subsequent records, whereas increased slowing of the background developed in the same region or hemisphere on subsequent records for other patients. Because of the association of cerebral lesions with these lateralized or parasagittal EEG abnormalities, the clinician is advised to obtain cranial imaging studies for accurate anatomic localization. Aso and associates found that hemispheric asymmetry or focal attenuation was associated with significant brain pathology in term and preterm patients [Aso et al., 1989].
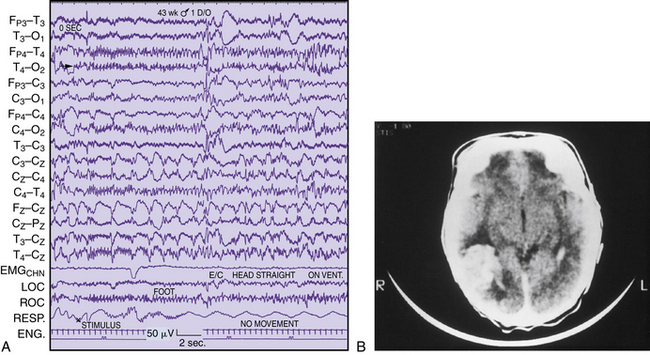
Neonatal Seizures
Despite the need to diagnose neonatal seizures promptly, unique clinical and electrographic features may delay timely recognition and treatment. The varied and less organized clinical expression of neonatal seizures makes the diagnosis more difficult [Harris and Tizard, 1960; Rose and Lombroso, 1970; Volpe, 2001]. Accepted clinical criteria may not always distinguish seizure movements from pathologic nonseizure movements [Volpe, 2001]. Classifications have been developed that have improved the clinical accuracy of the observer [Mizrahi and Kellaway, 1984b]. Technologies using prolonged EEG or synchronized video EEG-monitoring sessions will likely prove more valuable in diagnosing clinical and electrographic seizures [Mizrahi and Kellaway, 1984b; Mizrahi and Kellaway, 1998]. Computer-assisted and automated detection systems continue to be presented with varying degrees of specificity and sensitivity for seizure detection, as exemplified by several reports [Abend et al., 2008; Mitra et al., 2009; Stevenson et al., 2008]. Amplitude-integrated EEG in neonates has also been compared with conventional EEG for a variety of neonatal diagnostic and prognostic purposes. This simplified technology will need to be combined with more extensive neurophysiological monitoring paradigms; several proposed classification schemes have been discussed [El-Dib et al., 2009].
Neonates may have seizures that are not detected unless an EEG is performed. Some of these patients are pharmacologically paralyzed for ventilatory care [Tharp and Laboyrie, 1983], whereas others fail to demonstrate clinical seizures despite the appearance of electrographic seizures in the absence of a paralytic agent [Coen et al., 1982]. Electroclinical uncoupling after antiepileptic use can suppress clinical signs associated with seizures [Scher et al., 2003a]. EEG seizures are recognized by the electroencephalographer based on the evolution of discharges that can be clearly distinguished from the background and are not related to artifact. The frequency of these discharges is usually in the slow range, with a variety of waveforms. The evolution of discharges implies a gradual change in the location, amplitude, waveform, or distribution. The arbitrary definition for the minimum duration of a seizure is 10 seconds, with the average duration being –5 minutes for term or preterm neonates, unless status epilepticus occurs [Clancy and Legido, 1987; Scher, 1993b]. Clinical ictal activity may accompany the electrical seizure (Figure 12-23A and B). Only a few patterns are associated with a particular clinical presentation. For example, alpha-range rhythms have been associated with respiratory disturbances, such as apnea, as the clinical correlate appearing with an electrographic seizure [Watanabe et al., 1977].
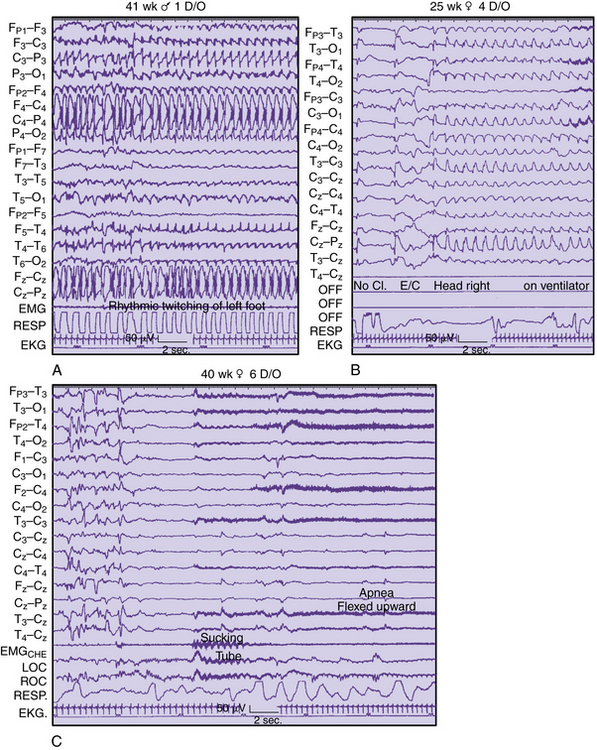
Five categories of clinical seizure types have been historically described and may be associated with any number of EEG seizure patterns [Volpe, 2001]. These five categories are subtle, focal clonic, multifocal clonic, tonic, and myoclonic. Focal or multifocal EEG seizures can be observed, and generalized discharges are seen rarely. The infrequent occurrence of a clinical seizure without a coincident EEG accompaniment has been described (see Figure 12-23C) [Watanabe et al., 1977]. Although one explanation is that this is a nonseizure movement disorder originating from a subcortical location [Mizrahi and Kellaway, 1984a; Mizrahi and Kellaway, 1998; Mizrahi and Kellaway, 2003; Scher, 2005a], the possibility of a subcortical seizure focus may also exist [Weiner et al., 1991].
The incidence of neonatal seizures and the prognostic implications of this condition have been described. The incidence of clinical seizures is suggested to be 1–1.2 percent of live births [Keen and Lee, 1973]. Similarly, the incidence of electrographic seizures has been estimated to be 0.2 percent of live births [Scher, 1987b]. These figures may be higher for preterm or outborn infants after a seizure disorder has been diagnosed; however, the interictal EEG patterns can better access prognostic risk [Tharp et al., 1981]. A worse prognosis is likely for patients demonstrating isoelectric, paroxysmal, multifocal spike discharges, or unresponsive, slow background patterns [Lombroso, 1979; Monod et al., 1972; Scher, 2005a].
An EEG diagnosis of seizures correlates significantly with high morbidity and mortality rates, based partly on the cause of the underlying brain injury [Scher, 2003b]. Of neonates with seizures in one center over a 3-year period, 90 percent had brain lesions documented by cranial computed tomography (CT) or neuropathologic analysis [Scher, 1993a; Scher, 1993b; Scher et al., 1989]. Cerebral infarction is associated with a significant proportion of patients with seizures [Clancy et al., 1985; Levy et al., 1985; Scher, 1987b].
High mortality rates have been reported for neonates with seizures, especially those who are preterm [Ment et al., 1982; Scher et al., 1989]. Close neurodevelopmental follow-up is necessary because of the risk of neurologic sequelae in many survivors. Subsequent estimates for the risk of epilepsy range from 20 to 56 percent [Ment et al., 1982; Scher et al., 1992]. Prenatal contributions to neonatal seizure occurrence must consider acquired maternal, placental, and fetal factors, possibly superimposed with gene tic vulnerabilities or disease states [Scher, 2006].
Focal Periodic Patterns
Focal and multifocal periodic abnormalities have been described in neonatal recordings. These discharges do not have an acceptable evolution in EEG features to be identified as an electrographic seizure. Instead, stereotypic, repetitive discharges at slow frequencies are observed, and they are usually brief (Figure 12-24). More prolonged and lateralized periodic discharges have also been described, specifically for neonates with asphyxia [McCutchen et al., 1985] and herpes encephalitis [Mizrahi and Tharp, 1982]. Short runs of periodic discharges are more commonly observed [Scher, 1986a]. Parasagittal discharges occur in preterm and temporal patterns in term neonates, and they are associated with EEG seizures and brain lesions, such as infarction [Scher, 1993b]. This association of periodic patterns with brain lesions is reminiscent of the association between periodic lateralized discharges and brain lesions in adults and children [Chatrian et al., 1964; PeBenito and Cracco, 1979]. Repetitive EEG patterns, such as periodic discharges, do not satisfy arbitrarily defined descriptions of electrographic seizures but may have important relationships to clinically observed seizures [Shewmon, 1990].
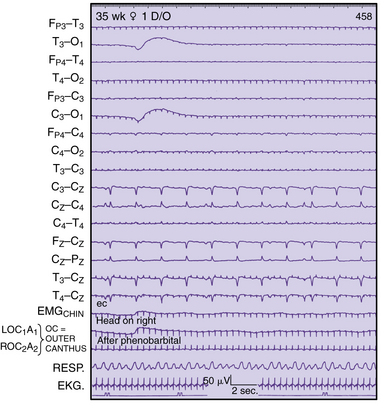
Spikes and Sharp Waves
In most situations, the electroencephalographer has difficulty assigning clinical significance to sporadic epileptiform features on neonatal recordings. These epileptiform characteristics may be seen in asymptomatic, apparently healthy infants. Several features, however, may help distinguish normal from abnormal spike or sharp waves. Epileptiform discharges that are frequent and multifocal and persistently occur throughout sleep may have pathologic significance. Several investigators have proposed that five spike or sharp-wave discharges per hour suggest an abnormality [Rowe et al., 1985; Weiner et al., 1991]. Other features, such as positive sharp waves, periodic discharges, and midline discharges, commonly reflect CNS insults [Scher, 1991].
Spike and sharp-wave discharges have been described in specific neonatal populations based on serious medical disorders, principally seizures. Hughes and colleagues [Hughes et al., 1983a, 1983b] described spike and sharp-wave discharges in 236 neonates whose postconceptional age ranged from 24 to 48 weeks. Approximately 55 percent had recordings because of a clinical suspicion of neonatal seizures. Sporadic sharp waves, more frequent in the right hemisphere, were found primarily in the centrotemporal regions in 85 percent of the total population. An additional 15 percent had positive sharp waves or repetitive sharp waves. No control group in which epileptiform discharges were observed was included nor was follow-up reported. Rowe and associates documented sharp-wave discharges in 51 percent of 74 neonates [Rowe et al., 1985]. These infants were followed up to 33 months of age and the presence of sharp waves on the neonatal EEG correlated with early developmental outcome. However, the investigators stress that EEG background abnormalities were more predictive than isolated epileptiform features. Spike discharges rarely occur in the neonate at any gestational age [Scher, 1993a]. Sharp-wave discharges are, however, common in frontopolar, right temporal, and left central regions in otherwise asymptomatic neonates. Sharp waves in occipital or midline locations are rarely seen in healthy neonates and may have greater clinical significance [Scher, 1993a].
Epileptiform Abnormalities
EEG remains the principal investigation for children with epilepsy. However, the technique has been historically accepted, without strict reliability assessments [Camfield et al., 1995]. The clinician’s classification of a child’s seizure disorder, as well as possible diagnostic and therapeutic decisions, is based on interictal EEG results. The neurologist relies on interictal EEG recordings performed particularly close in time to the occurrence of the seizure event. However, demonstration of epileptiform abnormalities in the EEG patterns of patients with seizures does not occur in approximately 50 percent of the first routine interictal EEG recording [Shinnar et al., 1994]. Repeated EEG recordings may increase the diagnostic yield. A retrospective study of adults with the diagnosis of epilepsy found the chance of detecting interictal epileptiform activities to be approximately 20 percent for the second EEG and less than 10 percent after the fourth negative repeat EEG recording [Salinsky et al., 1987]. In a study of children between the ages of 1 month and 16 years, with one or more idiopathic or symptomatic newly diagnosed seizures, a repeat EEG was obtained in children who expressed no epileptiform activity on their initial EEG recording. Of 552 children studied, 56 percent had epileptiform activity on the initial EEG; for the overall group who had a repeat EEG recording, 30 percent had epileptiform activity when the initial EEG pattern was normal. Epileptiform activities were more likely if the repeat EEG included sleep [Carpay et al., 1997]. These findings are in accord with earlier reports in the literature on repeat EEG recordings after sleep deprivation in children with suspected epilepsy; between 32 and 75 percent of children had epileptiform activity on repeat EEGs after sleep deprivation [Degen, 1980; Ellingson et al., 1984; Geller et al., 1969]. Other reports warn against obtaining a repeat EEG, which may yield different and sometimes conflicting information for the clinician in children with absence seizures or generalized motor seizures [Camfield et al., 1995]. These investigators describe repeat EEG recordings in 159 infants, with a 40–70 percent discordance for the type of abnormality on the second EEG compared with the first.
Among a variety of abnormal EEG patterns, certain features have been associated in patients with seizure disorders and are commonly referred to as epileptiform [Zivin and Marsan, 1968]. Epileptiform waveforms include spikes, sharp waves, spikes and waves, sharp and slow waves, and multiple spikes. The sharp wave has a waveform that is characteristically negative in polarity, with a duration of 70–200 msec. This finding is contrasted with the spike morphology, which is of shorter duration (20–70 msec) and sharper morphology. The slow-wave complex that may accompany either waveform generally is between 1 and 5 Hz (i.e., 200–1000 msec] [Kooi, 1966; Maulsby, 1971].
Epileptiform features are not necessarily associated with clinical seizures. One study found that 2.7 percent of 743 normal children had epileptiform EEG activity. This percentage increased to 8.7 percent during sleep [Eeg-Olofsson, 1971]. In certain forms of genetic epilepsy, family members are asymptomatic but have abnormal EEG discharges [Doose et al., 1969]. Conversely, patients with well-documented seizures may have normal EEG studies, particularly children younger than 2 years [Scher, 1986a]. Only 56 percent of patients with seizures in one study had epileptiform activity on the first EEG recording [Marsan and Zivin, 1970].
Epileptiform discharges not accompanied by obvious clinical events usually are regarded as subclinical or interictal. However, careful observation with psychometric testing can reveal brief episodes of impaired cognitive function during such discharges. This feature has been observed in 50 percent of patients who exhibit discharges during testing, and it may contribute to behavioral and cognitive deficits. Limited evidence-based analyses suggest that suppression of discharges is associated with improved psychosocial function [Binnie, 2003]. Specific pediatric epileptic syndromes may have a greater association with such deficits [Aldenkamp and Arends, 2004].
After a patient with recurrent epileptic seizures is treated with antiepileptic medication and becomes seizure-free for some period, the clinician is eventually challenged with the decision about whether treatment should be continued. In making this decision, the neurologist must weigh the risk of side effects of antiepileptic drugs against the risk of seizure relapse. Certain indicators of prognosis continue to be of important clinical value. The EEG study has remained one predictor of outcome after withdrawal of treatment, but many children who become seizure-free during drug treatment continue to manifest epileptiform activity in their EEG recordings. Correlations between EEG findings and clinical outcome after discontinuation of treatment have been reported in many studies, as reviewed by Andersson and colleagues, but there is a lack of unanimity, given the fact that different EEG variables have been assigned prognostic importance [Andersson et al., 1997]. Children whose last EEG before discontinuation of treatment displays generalized irregular spike-and-wave activity relapse more often than other children; 67 percent of children with such activity in their final EEG studies relapsed, compared with a relapse rate of 33 percent for children without epileptiform activity or with other epileptiform abnormalities. Children who were treated for only 1 year and in whom irregular, generalized spike-and-wave activities were present in one or more recordings had a high relapse rate. Apart from treatment of children with irregular, generalized spike-and-wave activity, most physicians discontinue treatment after 6 months to 2 years of seizure control. The presence of epileptiform activity does not necessarily influence the prognosis for the recurrence of seizures, with the exception of certain types of abnormal epileptiform activity or patient groups. For example, in a cohort of children with cryptogenic localization-related epilepsy who were followed for more than 5 years after drug withdrawal, 8 (9.8 percent) of 82 experienced seizure recurrence. Two independent risk factors were 6 years of age or older at seizure onset and 5 years or more from the start of drug therapy [Ohta et al., 2004]. Another report of children with cryptogenic partial epilepsy recommended EEG studies during drug withdrawal, even with a previously normal EEG study, because the presence of EEG abnormalities was associated with a high probability of seizures [Verrotti et al., 2000].
Generalized Epileptiform Patterns
Spike-and-wave patterns
The most frequently encountered spike-and-wave pattern is a bilaterally synchronous, single or polyspike discharge, followed in frequency by rhythmic slow waves (Figure 12-25A). Both features are surface-negative, and these discharges can be 100–200 msec long. Discharges in certain regions (e.g., frontal) appear slightly before the generalized burst or are maximally expressed in one particular location. The examiner may see fragments of the spike-and-wave pattern, depending on the montage or sensitivity setting, because of cancellation effects of bipolar recordings or the low amplitude of the complexes. The fastest frequency of the discharges (3–6 Hz) is at the onset of seizures, with slowing to 2.5–4 Hz during the electrographic seizure. Augmentation of the discharges can be seen with hyperventilation [Dalby MA, 1969] or non-REM sleep, although the spike-and-wave pattern can become slower and more complex in morphology during sleep. Two nonspecific phenomena are often associated with a generalized spike-and-wave pattern and consist of bursts of 2- to 4-Hz, rhythmic slow waves or a more monorhythmic, occipital delta activity.
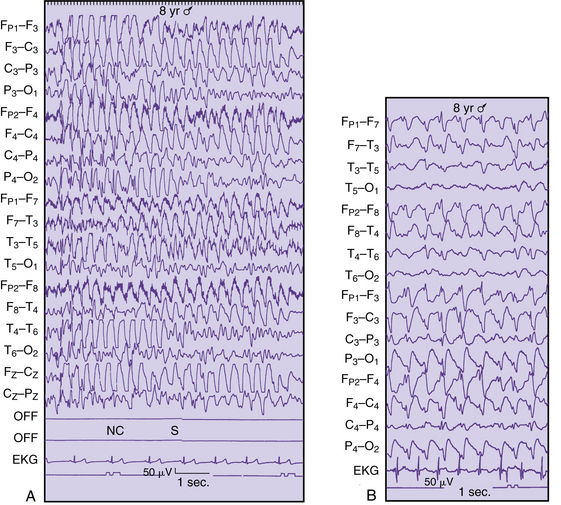
The most significant clinical correlation is that patients with this pattern have a strong association with a generalized seizure disorder. Although this pattern can be observed in patients without clinical seizures, most patients demonstrate a history of generalized motor or absence seizures. Generalized, 3-Hz, spike-and-wave discharges with absence seizures account for 10 percent of all patients with clinical absence spells [Penry et al., 1975]. A motor accompaniment is identified in 90 percent of patients [Doose et al., 1973; Penry et al., 1975], and 14 percent have myoclonic seizures [Dalby, 1969]. The reaction time to an auditory stimulus is slowed during the occurrence of the spike-and-wave complex [Browne et al., 1974].
Patients can “outgrow” these discharges, as evidenced by longitudinal studies between 5 and 14 years that suggest age penetrance of the clinical seizure with or without the EEG abnormality [Metrakos and Metrakos, 1974]. Up to 50 percent of adolescents with the 3-Hz, spike and slow-wave pattern develop generalized motor seizures. If spike-and-wave discharge is the only abnormality on the EEG, the incidence of other neurologic deficits is low.
Photic stimulation may elicit a spike-and-wave discharge (see Figure 12-14B) but can only support the evidence for seizures suggested by the clinical evaluation. This pattern also appears in 3.4 percent of normal control subjects [Doose et al., 1969], and in 20 percent of siblings of patients with photoparoxysmal seizures who have never had clinical seizures. Only 10 percent of these siblings had clinical seizures. A prolonged response that outlasts the stimulus may be a stronger indication that a seizure disorder is present [Reilly and Peters, 1973], but there is also an age-dependent expression of this abnormal pattern between 5 and 15 years. Even self-limited photoparoxysmal responses that do not outlast the stimulus can be highly correlated with epilepsy [Nagarajan et al., 2003]. This pattern is most easily elicited with a frequency of 10–16 flashes per second. Clinicians must anticipate that children with photosensitive epilepsy can still have an excellent prognosis that is independent of the persistence or disappearance of photosensitivity on the EEG study [Verrotti et al., 2004].
Patients on dialysis, with electrolyte disturbances, or exhibiting withdrawal from drugs such as barbiturates and alcohol are more susceptible to photoparoxysmal responses with or without clinical accompaniment. Even for the nonepileptic pediatric patient, photoparoxysmal responses may be present in the absence of acute encephalopathies, with persistence for as long as 6 years after the initial documentation [Verrotti et al., 2002]. Suppression of photic driving responses may also occur in the presence of structural nervous system disorders (see Figure 12.14C).
Sharp-wave and slow-wave complexes
The sharp-wave and slow-wave complex pattern consists of a sharp wave of negative polarity lasting 100–200 msec and slow waves lasting 350–400 msec at a frequency of 1–2 Hz (see Figure 12-25B). Although diffusely distributed over the scalp in most patients, it may be asymmetric or confined to anterior or posterior quadrants. This waveform is augmented only during sleep and can be associated with sudden desynchronization of the record, which is associated with a burst of beta activity called an electrodecremental response. Although the highest incidence of sharp-wave and slow-wave complexes occurs between 1 and 5 years of age, they are also evident well into adulthood. Hypsarrhythmia can precede the sharp-wave and slow-wave complex during the first year of life.
Of clinical seizures with sharp-wave and slow-wave complexes, 90 percent are tonic [Blume et al., 1973], and these seizures are resistant to therapy, persisting at least 15 years after beginning treatment [Markand, 1977]. Other types of clinical seizures can also occur, depending on the age of onset: tonic seizures at 16 months, absence seizures at 32 months, myoclonic seizures at 39 months, and tonic-clonic seizures after 43 months [Chevrie and Aicardi, 1972].
Hypsarrhythmia
Hypsarrhythmia is the most common interictal EEG pattern associated with infantile spasms. The most common clinical description is a sudden, symmetric, tonic muscle contraction producing flexion/extension of the trunk and extremities, although a variety of movement patterns have been described [Hrachovy et al., 1990]. The EEG pattern is a chaotic mixture of high-amplitude slow waves, multifocal spikes, and intrahemispheric-interhemispheric asynchrony (Figure 12-26). This EEG pattern usually is observed in children 3 months to 5 years old, and it can be preceded by a burst-suppression or low-voltage invariant pattern in the newborn period. Hypsarrhythmia can also be preceded by a normal EEG pattern [Jeavons and Bower, 1974]. During a spasm, an electrodecremental response interrupts the high-amplitude slowing by a sudden diminution of all activity with a duration of 1 second to 1 minute. The role of EEG is limited to diagnosis only, with no reliable correlation with cause, course, or prognosis, including mental development.
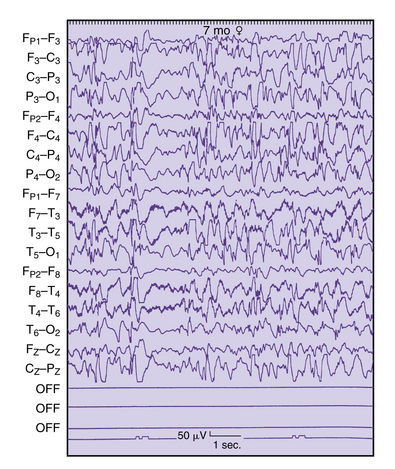
Generalized periodic discharges
The periodic complexes in subacute sclerosing panencephalitis appear at 1- to 3-second intervals but have no relation with the clinical progression of the disease [Celesia, 1973]. Similarly, there is no relation between the myoclonic movements and these discharges. The periodic discharges may first arise from a normal background and may initially be observed only during sleep.
Secondary bilateral synchrony
Penfield and Jasper originally described bilateral discharges that resulted from the initial excitation of postulated subcortical or unilateral discharges [Penfield and Jasper, 1946]. This concept has been adopted in the diagnostic procedures related to evaluation for the surgical treatment of epilepsies. Such an approach attempts to excise the principal epileptic focus in a patient refractory to antiepileptic drug therapy alone. The Amytal or Metrazol test may abolish bilateral discharges if a carotid injection is performed into the hemisphere responsible for generating the primary discharge [Gloor et al., 1976]. In children an intravenous pentobarbital injection has been suggested as an alternative [Lombroso and Erba, 1970]. Surgical excision of this abnormal tissue will presumably abolish most or all of the bilateral discharges and allow improved or complete control with antiepileptic drugs.
Focal Epileptiform Patterns
The incidence of focal-spike discharges in the normal population (1.5 percent of 1000 children) has been previously estimated [Petersen and Eeg-Olofsson, 1971]. More recently, an overall prevalence of 6.5 percent was detected in 383 healthy children 6–13 years of age; 4 showed generalized or bifrontal spikes, 12 showed constant focal localized discharges, and 9 showed multifocal discharges [Borusiak et al., 2009]. Spike discharges in symptomatic patients should be correlated with the clinical context in which the discharges are observed. Focal spikes are identified in children with cerebral palsy in the absence of clinical seizures; however, the presence of focal spikes in children younger than 2 years of age implies severe neurologic impairment. Spike foci on a single EEG examination are not a reliable indicator of structural brain lesions because the location of the spike discharges on subsequent EEG studies may be shifted to different foci [Trojaborg, 1968]. However, the absence or rare occurrence of a spike discharge on a routine EEG usually predicts better outcome, compared with more frequent spikes in any head region associated with EEG background slowing [Hughes et al., 2004]. With these caveats in mind, the neurologist should consider certain electroclinical syndromes associated with focal or multifocal spike foci in children. These have been reviewed [Duchowny and Harvey, 1996], and are discussed in more detail in the chapters on epilepsy.
Rolandic spikes
Rolandic spikes are associated with the most common genetic epilepsy of childhood. High-amplitude spike and slow waves are prominently observed singly or in runs in the central and midtemporal regions (Figure 12-27A). Shifting laterality occurs in the same or subsequent EEG studies, and these focal discharges may be associated with generalized spike-and-wave discharges in 5 percent of children. The EEG background activity is otherwise normal, and certain patients have rolandic spikes that appear only during sleep, commonly during non-REM sleep [Beaumanoir et al., 1974]. An unusual polarity relationship is associated with the discharges, consisting of a simultaneous negative and positive phase-reversal in two different locations of the spike discharge. This polarity may represent a horizontal rather than the more common vertical dipole, and is associated with abnormal EEG activity.
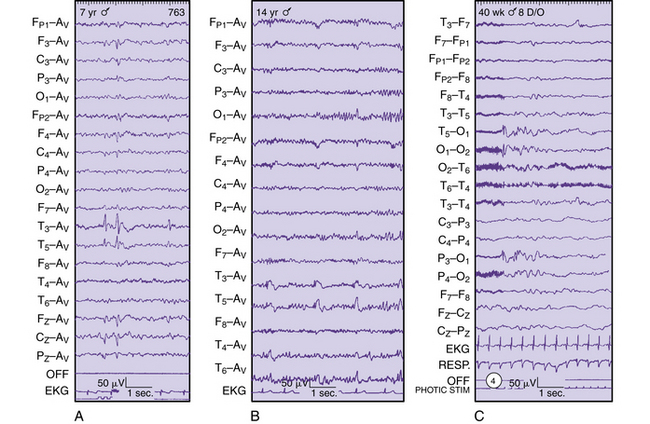
This genetic epilepsy is clinically expressed in an age-dependent manner between 3 and 14 years of age; it rarely occurs beyond adolescence. Commonly, a nocturnal seizure is observed, with focal motor phenomena, usually involving the face; buccolingual involvement and salivation are evident. Generalized seizures also frequently occur. An interesting feature of this genetic epilepsy is that 13 percent of family members demonstrated rolandic spikes without clinical seizures [Heijbel et al., 1975]. A proportion of children with typical benign partial epilepsy demonstrated transitory cognitive impairments during the course of their epilepsy, probably related to the association with the paroxysmal EEG activity [Deonna et al., 2000].
Occipital spikes
Benign childhood epilepsy with occipital paroxysms (benign occipital epilepsy) typically presents between 4 and 12 years of age. One study by Panayiotopoulos suggests that this is a common form of epilepsy in children [Panayiotopoulos, 1989]. Of 94 patients, 18 (or 20 percent) fulfilled the criteria for benign epilepsy of childhood with occipital paroxysms. The clinical presentation may be emesis and visual phenomena in older children with simple or complex visual hallucinations or distortions with preservation of consciousness. In younger children, seizures are less frequent and are often nocturnal, but may be dramatic with periods of prolonged unresponsiveness. The EEG patterns for both clinical presentations are composed of repetitive occipital spike discharges on eye closure. It has been debated whether this syndrome is related to the reflex epilepsies in which generalized seizures and EEG abnormalities can be initiated by video games and other visual stimuli. However, the presence of occipital epileptiform EEG abnormalities may be associated with children with migraine headaches, with or without accompanying epilepsy. Specific electroclinical features help distinguish these two groups [Brinciotti et al., 2000].
Besides the benign occipital epilepsy syndrome, a greater proportion of children with occipital discharges have symptomatic epilepsy, although neonates may also reflect occipital spike discharges after as a result of brain disorders (see Figure 12-27C), and the EEG study can assist in predicting better outcome based on the presence of generalized spike-and-wave discharges or normal EEG background rhythms [Libenson et al., 1999].
Other Idiopathic Partial Epilepsies of Childhood
Some clinical entities are not universally recognized: benign frontal epilepsy; benign epilepsy with affective symptoms (i.e., benign psychomotor epilepsy); benign partial epilepsy of adolescence; benign partial epilepsy with midline spikes; and benign partial epilepsy with extreme somatosensory-evoked potentials. Because these clinical entities are best described under the general topic of partial epilepsies of childhood, they are discussed in Chapter 54.
Temporal Spikes and Sharp Waves
Although not associated with a distinctive epileptic syndrome, temporal spike discharges must be distinguished from the spikes associated with rolandic epilepsy. The electroencephalographer can ascertain a difference by determining whether there is a more limited temporal location to the spike discharge without expression of a dipole, as described previously (see Figure 12-27B). According to a study by Eeg-Oloffsson, temporal spikes are rarely seen in normal children (2 of 743 patients) [Eeg-Olofsson, 1971], but are frequently seen in epileptic patients (92 percent of 666), including children with complex partial seizures [Currie et al., 1971].
Multiple Independent Spike Foci
Patients with spike discharges in at least three noncontiguous electrode positions are considered to have multiple independent spike foci (Figure 12-28). No patients in a normal population have this pattern, whereas 63 of 1500 patients with seizures and EEG recordings demonstrate this pattern [Blume, 1978; Eeg-Olofsson, 1971]. Of patients with multiple independent spike foci, 90 percent had clinical seizures, most of which were generalized motor seizures. Although 66 percent of patients had subnormal intelligence, normal cognitive abilities were more likely if there were few spike discharges and a normal EEG background. Sleep can augment spikes and activate new foci, but hyperventilation or photic stimulation cannot. Of these patients, 25 percent had previous EEG studies with hypsarrhythmia or sharp-wave and slow-wave complexes. Etiologic possibilities for this pattern include perinatal insults, CNS infections, neurocutaneous syndromes, degenerative diseases, trauma, and anoxia. In 29 percent of patients with multiple independent spikes a specific cause cannot be assigned [Noriega-Sanchez and Markand, 1976].
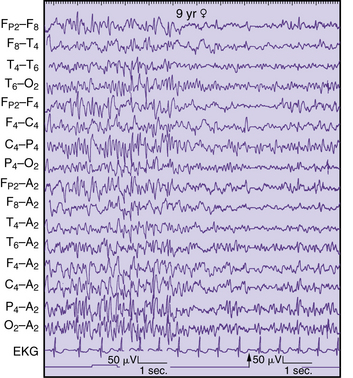
Spike Discharges Associated with Specific Neurologic Conditions
Three types of neurologic conditions are associated with spike foci: acquired aphasia of childhood, motor dysfunction, and visual perceptual difficulties. Temporal or centroparietal spike-and-wave discharges have been reported in some children with expressive and receptive aphasia. This condition develops in previously normal children between 3 and 8 years of age [Shoumaker et al., 1974; Worster-Drought, 1971]. The aphasia can precede the onset of seizures by several years [Landau and Kleffner, 1957]. Long-term follow-up studies have also documented resolution of the seizures and partial or complete resolution of the aphasia over a period of years in most patients [Mantovani and Landau, 1980]. Evaluation and treatment of this condition remain controversial and are further discussed in Chapter 55.
Some children have demonstrated evidence of motor difficulties with central spike discharges on EEG without clinical seizure manifestations [Lairy and Harrison, 1968]. Subsequent reports have corroborated and supplemented these earlier findings [Shewmon and Erwin, 1988]. Occipital spikes have been observed in children with visuoperceptual and oculomotor abnormalities [Kellaway et al., 1955] (see Figure 12-23C). Seizures have been reported in 54 percent of 318 children with occipital spikes [Smith, 1964]. Most seizures occurred before the age of 1 year. Generalized motor seizures are the most common type, and only 9 percent of studies reported ictal manifestations that were visual in nature. Only 34 percent of patients with ocular difficulties and occipital spikes have clinical seizures, but only 2 of 743 normal children have occipital foci [Eeg-Olofsson, 1971].
Periodic Discharges
Generalized periodic discharges and neonatal periodic patterns have already been discussed. The present description pertains to the EEG phenomenon that consists of repetitive stereotypic focal discharges that remain lateralized with a duration of at least 10 minutes, or 20 percent of the recording time. Waveform morphologies can be varied and are collectively referred to as periodic lateralized epileptiform discharges [Chatrian et al., 1964]. This phenomenon represents an acute or a subacute process in adults or children. Usually, a brain lesion, such as infarction, contusion, or cerebritis, can be identified. Periodic discharges in the temporal region may suggest an encephalitic process caused by a herpetic infection [Elian, 1975].
Biphasic or polyphasic discharges of 100–200 msec and 100–200 μV have a frequency of 1–2 Hz (Figure 12-29). These discharges persist for a limited number of days or weeks in adults and are replaced by focal polymorphic delta slowing. Multifocal periodic patterns can also occur [de la Paz and Brenner, 1981]. In children, more subacute or chronic processes have been associated with focal or multifocal periodic lateralized epileptiform discharges [PeBenito and Cracco, 1979]. Similar to adults, periodic lateralized epileptiform discharges can also be seen in acutely encephalopathic children from infection or toxin exposure, and are highly associated with seizures [Yoshikawa and Abe, 2003]. Stimulus-induced rhythmic, periodic, or ictal discharges can be documented in older patients undergoing continuous EEG monitoring in the intensive care setting, which need to be distinguished from spontaneous seizures [Hirsch et al., 2004]. Stimulus-evoked seizures have been described for neonates [Scher, 1997a], but older pediatric populations have not been systematically identified. In adults, 90 percent exhibit a depressed level of consciousness, whereas 70 percent demonstrate focal neurologic defects. Periodic discharges are commonly observed after a seizure, particularly if it is focal in onset; about 80 percent of these patients have frequent seizures [Sternberg et al., 1971]. An unusual seizure disorder in children has been described, consisting of agitation and confusion, in which periodic discharges in the frontal regions are observed when the patient is awake or asleep [Tharp, 1972].
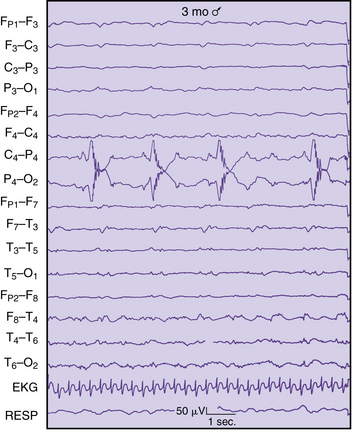
Role of Pediatric Electroencephalography in Specific Neurologic Situations
Febrile Seizures
Depending on the timing of the EEG relative to a seizure during a febrile illness, abnormalities can be recorded. These findings, however, are unlikely to have clinical value if observed within hours or days of the febrile seizure. Situations when an EEG can be useful during this early period include a suspected focal brain lesion or a continuing subclinical seizure in a patient who has failed to regain consciousness fully within an expected interval [Blume et al., 1982; Thorne, 1982].
In a sequential study of patients with uncomplicated febrile seizures, 33 percent have prominent delta activity diffusely or over the posterior head regions. This activity resolves within 2 weeks and has no prognostic significance [Frantzen et al., 1968]. Of 218 patients studied, documentation of 42 patients with bisynchronous spike-and-wave discharges and 19 patients with focal spikes also failed to predict recurrence of febrile seizures or occurrence of later nonfebrile seizures. Only crucial historical information of antecedent neurologic difficulties, such as a focal seizure, prolonged duration (i.e., greater than 15 minutes), abnormal examination findings, or family history of seizures, has predictive value for later epilepsy [Nelson and Ellenberg, 1983].
However, consensus opinion adopted by the American Academy of Pediatrics suggests that an EEG may have more predictive benefit when obtained beyond a month after the febrile seizure [AAP, 1996]. Even studies that included children with complex febrile seizures or those with pre-existing neurologic disease have not shown early EEG studies to be predictive of the development of epilepsy. Given the high rate of simple febrile seizures and the low rate of subsequent afebrile seizures, obtaining routine EEG studies would require a large number of tests to identify a small number of children who will later develop seizures [AAP, 1996, 2011]. In one report the risk of seizure recurrence in 170 children with initial normal-appearing EEG patterns compared with 99 children with initial paroxysmal EEG patterns was the same. Increase in recurrence risk was determined by younger age. The EEG did not add information regarding the likelihood of recurrence of febrile seizures [Kuturec et al., 1997]. While there are guidelines recommending against the use of EEG in the evaluation of simple febrile seizures, the role in febrile seizure status epilepticus is less well established. One review reported that 30–40 percent of EEGs obtained within 1 week of febrile seizure status epilepticus will contain abnormalities, including focal slowing, which appears to be associated with the development of a spike focus in the same location. Prospective studies are now under way to ascertain whether such abnormalities are associated with later development of epilepsy [Nordli et al., 2009].
Head Trauma
As with adults, the degree of EEG abnormalities in children after blunt head trauma is proportional to the severity of the insult. However, the magnitude of EEG abnormalities in children may exceed the clinical severity more often than in adults. The most striking acute change is in the posterior delta rhythm [Silverman, 1962]. Persistence of abnormalities, such as posterior slowing, may suggest subsequent functional difficulties [Mizrahi and Kellaway, 1984a].
Brain injury has become an increasing problem in the United States, with an estimated incidence of 2 million cases per year, of which almost 500,000 are admitted to the hospital [Hernandez and Naritoku, 1997]. Post-traumatic epilepsy and functional disability constitute the major sequelae and impose a high cost to society and individual survivors. Mild traumatic brain injury is generally not accompanied by significant EEG changes [DeVivo and Dodge, 1971]. At 1 year after injury, approximately 15 percent of patients with mild traumatic brain injury are persistently symptomatic with disabling symptoms [Alexander, 1995]. In patients with more severe head injury, EEG recordings have an important prognostic role. For example, 24 children were studied 8–36 months after severe head injury. EEG patterns recorded after the third day of trauma provided the most reliable information on brain damage-induced changes. A slow, monotonous EEG pattern in comatose patients indicated a poorer prognosis. Conversely, reactive patterns that were considered “prewake” predicted the onset of complete clinical awakening. Slow, monotonous EEG patterns also were associated with impaired long-term intellectual or motor recovery in 50 percent of patients, whereas other EEG patterns predicted a more satisfactory and normal recovery [Dusser et al., 1989]. Another study found that EEG reactivity alone was an excellent predictor of long-term outcome compared with somatosensory-evoked responses or the Glasgow Coma Scale [Gutling et al., 1995]. No comprehensive studies of closed-head injury in pediatric populations have used serial EEG recordings to assess prediction for post-traumatic epilepsy. A recent review discussed lessons learned from a recent randomized clinical trial of hypothermia therapy in severe traumatic brain injury in children, together with bedside neuromonitoring including EEG [Guerguerian et al., 2009]. Integrating the measurement of biomarkers into clinical care as surrogate endpoints and as potential prognostic markers will allow intensivists and consulting subspecialists to evaluate the effects of injury and clinical care in children earlier after traumatic brain injury. Several methods are more readily available to monitor cerebral physiology in children. These include indices evaluating the integrity of cerebral autoregulation from a variety of bedside devices. Other methods allow the continuous evaluation of altered states of arousal with various computerized schemes such as nonlinear analysis of EEG, together with the evaluation of cerebral metabolism and cell death pathways with biomarkers from serum, cerebrospinal fluid, and cerebral microdialysis. Also, the time to start antiepileptic therapy in persons with acute traumatic brain injury remains problematic. Therefore, prospective studies using serial EEG recordings combined with other monitoring modalities may identify subsets of patients who are at high risk for post-traumatic epilepsy.
Headaches
By comparison, clinical judgment is more reliable than EEG to determine the cause of a headache syndrome in children. However, a high percentage of EEG abnormalities in children with headache are associated with migraine syndromes [Prensky and Sommer, 1979] or seizure disorders. Focal delta waves have been described with complicated migraine and hemiplegia [Slatter, 1968]. Epileptiform abnormalities, together with headache complaints, occur in a substantial number of children with a prodromal or ictal headache component associated with a seizure disorder.
Prognosis after Hypoxic-Ischemic Insults
With hypoxia or ischemia, progressive EEG changes begin with slowing of the dominant rhythm, followed by emergence of theta and delta slowing and suppression of all background activity. This information can be useful, particularly when provided by serial studies in the comatose patient. Two early studies indicate how serial EEG evaluations can be an adjunct to clinical assessment. Pampiglione and Harden and Seshia and associates found that specific EEG findings help predict outcome [Pampiglione and Harden, 1968; Seshia et al., 1979]. Normal EEG activities suggest a favorable outlook, whereas delta slowing requires follow-up studies before prognostic statements can be affirmed. Low-voltage, invariant EEG background activity, suppression-burst activity, or electrocerebral silence suggests an unfavorable outcome.
Less frequently, diffusely distributed monorhythmic activities (i.e., alpha or spindle waveforms) also suggest poor prognosis for clinical recovery in patients with altered levels of consciousness. A reappraisal of rhythmic coma patterns more recently described prognostic significance [Ramachandran Nair et al., 2005]. Rhythmic coma patterns in comatose children are not uncommon. Etiology, reactivity, and outcome of individual patterns are similar, and this makes the rhythmic coma patterns distinct EEG signatures in comatose children. There was a clinically significant better outcome with reactive rhythmic coma patterns.
Determination of Brain Death
Unlike in adults, the current criteria for brain death do not easily apply to all ages of children. Published guidelines [TaskForce, 1987] suggest clinical and laboratory examination procedures for the child. As with adults, this report emphasizes clinical evaluation and physical examination criteria. Currently, these pediatric criteria are undergoing revision as to the circumstances in which ancillary testing is needed in neonates, infants, and children who are being evaluated for brain death. Several age-dependent observation periods are recommended, at which times clinical examination and EEG studies can be obtained. With complete absence of brainstem function, residual low-amplitude EEG activity may persist on rare occasions. Electrocortical silence more likely will result on subsequent EEG recordings, or the patient will deteriorate progressively and then die as a result of cardiopulmonary failure [Ashwal and Schneider, 1987]. Other ancillary studies evaluating cerebral blood flow may be helpful. These difficulties can be compounded by hypothermia or sedative medication, situations that can erroneously contribute to a low-amplitude or isoelectric tracing. In neonates, an isoelectric EEG pattern does not closely correlate with the absence of brainstem function [Scher et al., 1996], but it can be associated with acute and chronic brain insults [Scher, 1993b].
The neurologist must carefully adhere to the EEG guidelines for the confirmation of brain death [AES, 1986] to avoid potential interpretive error. A recent consensus report discussed the usefulness of combined interpretations using multimodality clinical neurophysiological tests in the intensive care unit [Guerit et al., 2009]. The combined interpretations of EEG, evoked potentials, and electroneuromyography can aid in the diagnosis and prognosis of reversible and irreversible altered states, including presumed brain death for encephalopathic children.
Central Nervous System Infections
For patients with primary CNS, continuous EEG monitoring in the intensive care unit can be a valuable diagnostic tool [Carrera et al., 2008]. This particular study documented electrographic seizures or periodic epileptiform discharges in 48 percent of the intensive care unit cohort. More than half the electrographic seizure group had no clinical correlate. Additional studies are needed to determine whether prevention or treatment of these electrographic findings improves outcome.
With an encephalitic process, EEG changes also consist of rhythmic or arrhythmic slowing, as well as electrographic seizures and interictal epileptiform activity [Fowle and Binnie, 2000; Misra and Kalita, 2009]. For herpes encephalitis or other encephalitides, focal or lateralizing findings may also be seen. EEG can also help monitor for seizures that are subtle or only electrographic. In general, EEG is always abnormal in viral encephalitis. During the acute phase a degree of slowing usually parallels the severity of clinical findings [Ebersole and Pedley, 2003]. The rate of EEG improvement also has some prognostic value. Normalization within 4–5 weeks indicates a more favorable outcome. In general, EEG changes in sporadic encephalitis caused by neurotropic viruses (such as equine, mumps, or St. Louis) are characteristically less severe than those resulting from postinfectious syndromes with demyelination (such as measles, rubella, and vaccinia, or after vaccination). Residual brain damage is often associated with persistent EEG abnormalities, including epileptiform discharges. Excessive slow activity also occurs during acute infection with measles, mumps, rubella, and scarlet fever, even without overt CNS involvement [Ebersole and Pedley, 2003]. The most striking EEG changes occur in herpes simplex encephalitis, as described by Upton and Gumpert [Upton and Gumpert, 1970]. Although not pathognomonic, focal or lateralized arrhythmic delta activity or pseudoperiodic complexes can appear 2–15 days after the onset of the illness. This pattern is to be contrasted with the typical EEG pattern seen in subacute sclerosing panencephalitis (SSPE), in which the EEG contains periodic complexes that are bilaterally symmetric and synchronous, and have high-voltage 250-μV bursts of polyphasic stereotypic delta waves [Binnie et al., 2003; Daube, 2002; Ebersole and Pedley, 2003]. Human immunodeficiency virus (HIV) may be associated with EEG findings that are usually nonspecific, with diffuse background slowing, often accompanied by loss of faster frequencies and reduced complexity of EEG patterns. Reports by Enzensberger and colleagues found that 50 percent of acquired immunodeficiency syndrome (AIDS) patients had nonspecific EEG changes without clinical neurologic deficits [Enzensberger et al., 1985]. Rasmussen’s encephalitis is a rare childhood syndrome of unilateral brain dysfunction and focal seizures. Unihemispheric dysfunction progresses relentlessly in severity of degree over months to decades, culminating in hemiparesis and dementia. Seizures occur that are refractory to antiepileptic medications. Neuroimaging reveals progressive atrophy of the affected hemisphere. Neuropathology characteristically demonstrates perivascular lymphocytic cuffing and proliferation of microglial nodules in the cortex of the affected hemisphere. Serial EEG studies in these patients may include interictal epileptiform activity that is localized to the affected hemisphere. As the disease progresses, increasingly frequent bilateral synchronous and contralateral epileptiform activity emerges [Andrews et al., 1997]. Autoantibodies to glutamate receptor GluR3 have been isolated in rabbit brains, as well as the sera of human subjects with this condition, implicating an autoimmune process in its pathogenesis [Rogers et al., 1994].
With meningitis, acute EEG changes resemble those occurring with encephalitis. Given the different neuropathologic complications of meningitis, such as subdural effusion, empyema, or cerebritis, EEG may suggest the presence of focal lesions with the appearance of lateralizing EEG findings. The value of neurophysiologic studies in the management of bacterial meningitis is not clear. In one study of 41 children with acute bacterial meningitis, neither electrophysiologic data using EEG, brainstem auditory-evoked responses, nor CT scans were better indicators of neurologic prognosis than the clinical examination [Pike et al., 1990]. EEG studies may reflect the pathophysiology of bacterial meningitis; neuronal injury may develop as a result of the release of vasoactive substances or alteration of blood–brain barrier permeability. Greater emphasis on the measurement of increased intracranial pressure and decreased cerebral perfusion pressure highlights neuroimaging changes that reflect pathologic lesions associated with children who suffer bacterial meningitis [Ashwal et al., 1992]. Further research is needed to understand the relation between local and regional cerebral blood flow changes that occur as a result of release of neurotoxic substances, as reflected on neuroimaging and electrophysiologic monitoring. Concern for children with bacterial meningitis should be contrasted with those who experience enteroviral meningitis. Although EEG recordings were not included in a particular study of 45 patients in whom enteroviral meningitis developed between 4 days and 12 months of age, the neurologic or psychologic language and academic outcome were favorable in the entire cohort; none of the survivors had major adverse neurologic sequelae [Bergman et al., 1987].
Degenerative Diseases
Most degenerative diseases diffusely affect cerebral function and cause generalized changes on EEG studies. EEG remains an important part of the diagnostic tool chest when evaluating a child with regression in abilities and associated clinical signs, suggesting either a group of neurodegenerative disorders, or alternatively a specific diagnostic entity [Sultan et al., 2006]. Various electrographic abnormalities may help narrow the diagnostic possibilities, given the child’s age, symptoms, course, and neurologic findings. In general, diseases affecting gray matter show bilaterally synchronous paroxysmal abnormalities, presumably referable to cortical or subcortical gray matter regions. White matter disease alternatively has been associated with diffuse, high-amplitude slowing in an intermittent or continuous pattern. Occasionally, the EEG abnormality may facilitate the suspicion of a diagnostic category of degenerative disease in an otherwise healthy patient [Blume, 1982].
In certain instances, specific EEG patterns are associated with various degenerative diseases. Patients with neuronal ceroid lipofuscinosis may first exhibit high-amplitude polyspikes over the posterior head region in response to slow rates of flash stimuli [Pampiglione and Harden, 1973], or alternatively a quasiperiodic EEG pattern during the early stages of the disease [Veneselli et al., 2001]. GM2 gangliosidosis in certain patients may be associated with stimulus-sensitive myoclonus with periodic or multifocal sharp waves [Morrell and Torres, 1960], as can be seen on EEG recordings of newborns with a variety of inherited metabolic diseases [Mises et al., 1977], such as glycine encephalopathy (Figure 12-30). Conditions in older patients, in which stimulus-sensitive myoclonus can be associated with EEG abnormalities, include familial myoclonic epilepsy [Blume, 1982] and cherry-red spot myoclonus syndrome [Engel et al., 1977]. EEG findings with subacute sclerosing panencephalitis have already been discussed. The classic clinical features of Rett’s syndrome and Angelman’s syndrome are not yet apparent during infancy. The most frequent EEG finding in Angelman’s syndrome was a 2- to 3-Hz rhythmic activity of high amplitude in the frontal areas, not influenced by eye closure or intermittent photic stimulation [Laan et al., 1998]. In contrast, females with Rett’s syndrome exhibited spike discharges in the central or centrotemporal regions. This may be helpful in situations where the biochemical marker for Rett’s syndrome was negative [Laan et al., 1998].
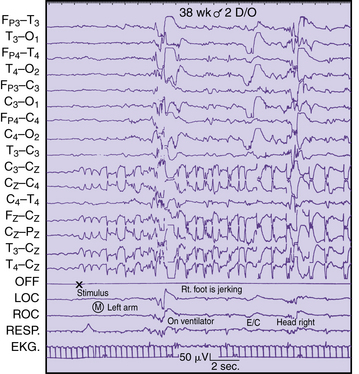
Reye’s Syndrome
Although deeper stages of coma in patients with Reye’s syndrome tend to correlate with worsening EEG abnormalities, some patients may improve while their EEG results remain abnormal [Aoki and Lombroso, 1973]. However, given the increasing use of pharmacologic paralysis for ventilatory care, EEG results remain useful as a guide to the level of encephalopathy related to increased intracranial pressure [Kindt et al., 1975] or to short-chain fatty acid levels [Trauner et al., 1977].
Nonepileptic Paroxysmal Disorders
Several clinical situations exemplify how the EEG can support this category of paroxysmal disorders of non-epileptic origin. One must always consider the efficacy of routine EEG studies compared with continuous EEG-video recordings. In one study using routine pediatric EEGs for the assessment of paroxysmal events, the EEG results correctly predicted non-epilepsy reasons 91 percent of the time, and nonepileptic paroxysmal events 96 percent of the time. Conversely, only 59 percent of instances of an epileptic disorder were correctly diagnosed [Camfield et al., 1995]. Adding an EEG-video recording increased the diagnostic yield over routine EEG in children with frequent paroxysmal events [Watemberg et al., 2003].
Syncope and, more specifically, breath-holding episodes may resemble clinical seizures. The absence of epileptiform activity while the episode is precipitated during a recording session supports this diagnosis. The associated electrocardiographic changes coincident with the episode may allow further subclassification of the type of episode [Gastaut, 1968]. Concerning daytime suspicious behaviors for seizures versus nonepileptic phenomena, video-EEG monitoring is frequently considered helpful [Paolicchi, 2002]. In one study of 143 patients 5 months to 43 years old, 79 patients exhibited staring with epileptiform findings. Forty-six patients had partial seizures, and 33 had atypical absence spells. Thirty-five had behavioral staring, 8 had psychogenic seizures, and 19 had migraine equivalent; in 20, no staring spells were recorded. Video-EEG monitoring can be used to adjust treatment or to exclude epileptic events in patients with refractory staring spells [Carmant et al., 1996].
Rhythmic movement disorders during sleep are difficult to diagnose by history alone. In one report, seven children 1–12 years old were evaluated for violent nocturnal behaviors, six of whom were suspected of seizures; 37 periods of dyssomnia were documented without epileptiform activity detected. Video-EEG monitoring during sleep can also help differentiate ictal from nonictal behaviors. Particular emphasis should be placed on the differentiation of nocturnal frontal lobe epilepsy from the non-REM arousal disorders and other parasomnias [Derry et al., 2006].
Psychogenic seizures should always be suspected if there is no diffuse slowing or alteration of background disturbances when the patient is either awake or asleep when an EEG is obtained within 24 hours of a suspected generalized motor seizure. The occurrence of repetitive behavioral changes in the absence of epileptiform activity strongly suggests (although it does not prove) that psychogenic seizures may be present, even in patients with a well-established seizure disorder. However, interictal EEG changes may be seen in patients with psychogenic nonepileptic seizures, given that many of these children also suffer from organic brain disease [Reuber et al., 2002]. Concomitant epilepsy with nonepileptic events can occur in preschool, school-age, and adolescent patients [Kotagal et al., 2002].
[/level-membership-for-neurology-category][not-level-membership-for-neurology-category]
Chapter 12 Pediatric Neurophysiologic Evaluation
Pediatric neurophysiologic studies are an integral part of the diagnostic evaluation of the infant or child with suspected brain dysfunction; electroencephalography (EEG), polysomnography, evoked responses, and computerized neurophysiological analyses comprise four general diagnostic modalities. Pediatric neurologists must apply proper instrumentation and recording techniques to obtain reliable pediatric neurophysiologic studies in an EEG laboratory or at a child’s bedside. With proper knowledge of these techniques, the clinician can better appreciate the clinical relevance of these studies. Neurophysiological evaluations take on heightened diagnostic and prognostic significance when compared with neuroimaging studies. As a research tool, neurophysiological studies constitute a powerful measure of functional neuronal organization and maturation, particularly when applying quantitative measures during resting, stressful, or disease states. Functional-structural comparisons between neurophysiology and neuroimaging yield far greater information about neurologic health and disease. Genotype-phenotype comparisons are now being investigated that will redefine neurophysiological studies as endophenotypes to study gene–environment interactions [Scher and Loparo, 2009].
In the first section of this chapter, recording techniques unique to children are introduced. As outlined in the second section, maturational changes in arousal states of children are emphasized in considering normal or age-specific patterns. Third, abnormal EEG patterns are discussed in the context of common pediatric neurologic disorders [Blume, 2002; Ebersole and Pedley, 2003; Niedermeyer and Lopes da Silva, 2005]. A fourth section is devoted to computer applications of neurophysiological studies for clinical and research purposes.
The neurologist should consistently follow analytic steps in the interpretation of neurophysiologic studies. Proper interpretative skills ultimately require two essential didactic elements that are beyond the scope of this discussion: presentation of multiple examples of the same neurophysiologic phenomena, and use of typical and atypical clinical situations in which common and complex neurophysiologic patterns are observed. Several excellent reviews supplement this discussion and can assist the physician with the evaluation of children who exhibit these phenomena [Binnie, 2003; Blume, 2002; Cracco and Cracco, 1986; Daube, 2002; Ebersole and Pedley, 2003; Mizrahi and Kellaway, 2003; Niedermeyer and Lopes da Silva, 2005; Scher, 2005a; Spehlmann, 2001].
Utility of Pediatric Neurophysiological Studies
Neurophysiological interpretation can assist in the diagnosis and prognosis of specific neurologic conditions. Recognizing specific situations in which the EEG findings are helpful allows efficient and effective use of this comparatively low-cost and safe tool [Drazkowski, 2003]. However, there is little advanced evidence-based medicine in the literature on the subject of pediatric clinical neurophysiology. In a review published by Medline and Cochrane [Fowle and Binnie, 2000], there is a lack of evidence-based medicine concerning the efficacy of EEG interpretation, as well as the standardization of pediatric neurophysiological training. Only retrospective studies have assessed the efficacy of EEG results in the evaluation of neurologic conditions for children, uniformly reporting that interictal EEG findings may be overused during the evaluation of various pediatric brain disorders [Aydin et al., 2003], whereas normal EEG findings are highly predictable in children with nonepileptic conditions [Jan, 2002]. Although the physician should not ignore multivariable analyses in which EEG is used to differentiate risks, diagnostic decision-making still rests on clinical effectiveness data, rather than EEG diagnoses [Gilbert and Buncher, 2000]. The clinician must consider the clinical settings of the outpatient clinic, emergency department, or intensive care unit in which the indications and diagnostic yield of the EEG will vary [Alehan et al., 2001; Varelas et al., 2003], based on the selection bias of the pediatric groups chosen for study. EEG can also be useful as an independent prognostic indicator of outcome for a general patient population, conveying information about the general level of illness and the cost of caring for patients.
The standard of the EEG services and the accuracy of the EEG interpretation must not be overlooked when recommendations and management of pediatric neurological problems are being developed. The inappropriate use or incorrect interpretation of the EEG, or both, is the most common reason for misdiagnosing common conditions such as epilepsy [Tan et al., 2008].
Training in Clinical Neurophysiology
Although the neurology trainee receives basic clinical neurophysiology instruction during residency, it is recognized that neurologists with more training and experience in clinical neurophysiology are also needed, in part because of the increased complexity of the specialty and the demand for high-quality care for people with complex neurologic diseases. Accredited training programs in clinical neurophysiology and individual certification in the subspecialty of clinical neurophysiology have been available since 1993 [Burns et al., 2000]. Standards of practice in clinical electroencephalopathy have been published regarding recommendations for qualifications of both electroencephalographers and technologists, laboratory organization, and appropriate instrumentation. An adequate duration of training with appropriate curriculum requirements has been described. Future opportunities for the clinical neurophysiology subspecialist will lead to concentrations in specific areas of neurophysiology, such as for epilepsy, sleep medicine, and neurointensive care. Pediatric neurologists must also satisfy these training requirements, with special emphasis on the unique aspects of developmental clinical neurophysiology for office and hospital settings, including neonatal and pediatric intensive care units and pediatric epilepsy monitoring units. In addition to the more thorough training requirements for pediatric neurologists, practice parameters have been more rigorously enumerated to develop strategies for patient management that are based on evidence-based medicine. Suggested parameters include the use of EEG more selectively, such as for children with specific neurologic conditions such as development delay, cerebral palsy, or headache [Ashwal et al., 2004; Lewis et al., 2002; Shevell et al., 2003], or in specific clinical settings such as intraoperative monitoring [Husain, 2009]. Revised guidelines require re-evaluations to improve the use of EEG methodology and training across disciplines, such as for the diagnosis of epilepsy [Flink et al., 2002; Tan et al., 2008].
Instrumentation and Recording Techniques
Each EEG channel measures the electropotential difference between two points on the scalp under the assigned electrodes. Ten electrodes are required as a minimum number for adequate EEG recordings [AES, 1986]. A greater area of cerebral activity can be measured with more EEG channels. EEG laboratories devoted to pediatric studies should use 16–24 channels. In the neonate, it may be more practical to apply fewer electrodes, as discussed later in this chapter. The International 10-20 System of electrode placement is the standard method of electrode application, and it routinely requires the placement of 22 electrodes on the head. The basis of the 10-20 system is the measurement of four standard points on the head: nasion, inion, and left and right preauricular points [Holmes, 1987; Niedermeyer and Lopes da Silva, 2005]. Electrodes are spaced at 10 or 20 percent of the total distance between pairs of skull landmarks; scalp locations correspond to anatomic landmarks. Electrode names correspond to the underlying brain regions over which they are positioned. Electrodes with odd numbers correspond to regions in the left hemisphere, and even numbers refer to areas in the right hemisphere. Midline electrodes have a zero (z) as a suffix. Additional electrodes may be used to localize electrical activity. Readjustment of the electrode placements may be required for preterm neonates and for patients with skull deformities.
Polarity Localization
Proper electrode placement and montage choices allow accurate comparisons between homologous brain regions. In this way, the neurologist can localize EEG data on an anatomic basis and can standardize regional or hemispheric findings over multiple EEG recordings. An understanding of the principles of polarity is essential in using the localization technique [Ebersole and Pedley, 2003].
Inputs for two electrodes for one EEG channel are generated by two differential amplifiers, called input terminal one and input terminal two. With a differential amplifier, the output is proportional to the voltage difference between these two input terminals. The direction of the pen deflection depends on differences in polarity of this voltage difference. By convention, when input terminal one is relatively more negative, there is an upward deflection. Other possibilities include a downward deflection if input terminal one is relatively more positive. The reverse situation pertains to input terminal two; when input terminal two is relatively more negative, there is a downward deflection [Cooper et al., 1980].
Instrumental Control Settings
Filter Settings
High- and low-frequency filters are required to facilitate accurate representation of the appropriate range of frequency-specific waveforms of cerebral origin. Adjustment of these filters should be made judiciously so that genuine brain-generated activities are not eliminated along with undesirable, noncerebral artifactual signals. High-frequency filters are set at a standard 70 Hz so as not to blunt the appearance of fast frequencies, including abnormal spikes and sharp waves. Occasionally, lower settings may be needed when excessive fast-frequency artifacts exist, such as 60-cycle interference from other electrical devices. Low-frequency limits, commonly referred to as time constants, routinely vary between 0.3 and 0.1 seconds. For situations when slow-frequency waveforms need to be analyzed or eliminated, longer or shorter time constants, respectively, can be chosen. This procedure is particularly important in EEG recordings of neonates and young infants in whom slower frequency activities need to be clearly represented. The use of DC recordings has also been advocated to study both maturation and disease states [Vanhatalo et al., 2005]. Conversely, high-frequency oscillations also have been studied to improve prediction of cognitive function, maturation, and brain pathology [Ben-Ari et al., 2007; Herrmann et al., 2009].
Artifact Recognition
As with adults [Richey, 1976], physiologic and nonphysiologic artifacts must be properly identified in pediatric recordings because either may interfere with the interpretation of cerebral activity. Three basic forms of artifacts have been classified: instrumental, external, and physiologic. Accurate descriptions by the technologist can assist the neurologist in the diagnosis of a neurologic disorder in adults [Klass and Reiher, 1968], children [Blume, 2002], and neonates [Scher, 1985] (Figure 12-1). Such artifacts may help define normal and abnormal sleep and waking behaviors. The technologist should try to identify the source of any artifacts, initially to reproduce them and subsequently to eliminate artifacts that were identified during the recording.
Recording Setting
A minority of children may require sedation. The need for sedation can be substantially reduced by adequate preparation of the child, including the creation of a less-threatening environment in which to perform the study. One report described a decreased proportion (32 to 2 percent) of 513 children who needed sedation over a 4-year period when appropriate preparation was provided [Olson et al., 2001]. Chloral hydrate (50–80 mg/kg; maximum dose, 2 g) has historically been the most commonly used sedative, but should be administered only to a child who has not been recently fed and cannot tolerate the study in the natural state. Rectal administration may be advantageous for the encephalopathic or extremely uncooperative child who requires the study [Thoresen et al., 1997]. Psychotropic or sedative drugs should be avoided because they produce more profound behavioral and EEG effects. Infant recordings should be obtained around a scheduled feeding or nap. At least 90 minutes should be scheduled for electrode application, EEG recording, and clean-up. With some exceptions, the parents’ presence during the recording session should be discouraged. A child-life specialist or similarly trained individual can provide developmentally appropriate and child-friendly support. The technologist should accurately record the pertinent clinical evaluation of the child that explains the reason for obtaining the EEG study. Information from parents or the medical record should include the child’s age; gestational and postconceptional ages should be included for neonates. The ordering physician should be identified, and the written request for an EEG study should clearly state the clinical problem that prompted the EEG request.
Neurophysiological Basis for Electroencephalography
Electrical activity generated by the brain can be classified into three broad categories. Spontaneous and evoked electrical activity detected on the scalp as oscillatory potentials is discussed primarily in this section. Electrical potentials generated by single neurons recorded by microelectrodes are a third type that is briefly mentioned in the context of the neurophysiologic basis of EEG studies. Informative reviews of the neurophysics of cerebral electrical fields are available in other sources [Ebersole and Pedley, 2003; Niedermeyer and Lopes Silva, 2005; Nunez, 1981; Olejniczak, 2006].
Depolarization, represented by an action potential, travels down the axon to synaptic clefts, where chemical transmitters are released. Presynaptic membrane release of neurotransmitters begins the process of cell-to-cell communication, with activation of the postsynaptic membrane by depolarization or hyperpolarization. Depolarization by specific neurotransmitters causes an inward flux of sodium, creating a voltage gradient that is called the excitatory postsynaptic potential. Hyperpolarization by other neurotransmitters causes an outward flow of sodium, contributing to an inhibitory postsynaptic potential. Summation of excitatory postsynaptic potentials and inhibitory postsynaptic potentials within a region involving a number of synapses determines the degree of postsynaptic membrane depolarization or hyperpolarization. If excitatory postsynaptic potentials predominate, depolarization will lead to an action potential. If inhibitory postsynaptic potentials predominate, hyperpolarization will follow, preventing the occurrence of an action potential. Although synaptic potentials are of lower voltage than action potentials, their longer time course and larger membrane surface area contribute primarily to scalp-detected EEG activity. Figure 12-2 illustrates the generation of extracellular voltage fields from graded synaptic activity, depicting the relationship between polarity of surface potentials and the site of dendritic postsynaptic potentials [Ebersole and Pedley, 2003]. EEG fields are primarily generated by the large, vertically oriented pyramidal neurons located in cortical layers III, V, and VI. Because of the attenuating properties of the skull, spatial summation of cortical activity is critical for producing a voltage field recordable from the scalp (Figure 12-3).
Fig. 12-2 Simultaneous intracranial and scalp EEG recording of a temporal lobe seizure.
(From Olejniczak P, Neurophysiologic basis of EEG. J Clin Neurophysiol 2006;23(3):187.)
Fig. 12-3 Generation of extracellular voltage fields from graded synaptic activity.
Relationship between polarity of surface potentials and site of dendritic postsynaptic potentials.
(From Olejniczak P, Neurophysiologic basis of EEG. J Clin Neurophysiol 2006;23(3):188.)
Figure 12-4 depicts a schematic cross-section of a brain, illustrating four representative cortical EEG sources. Certain radial fields are negative since the negative maximum voltage is maximal directly above them. Alternatively, tangential fields produce both positive and negative voltage maxima [Ebersole and Pedley, 2003]. During the excitatory postsynaptic potential or inhibitory postsynaptic potential, there is a current flow in a loop orientation with opposite polarities at each end of the cell’s axonal or dendritic processes. Because most neurons are oriented radially to the cortical surface, these current flows follow a radial direction in and out, as detected by surface electrodes. The polarity, as recorded on the surface, reflects an excitatory or inhibitory current flow, depending on the nature of the summated synaptic potentials and on the site of the synapse. Virtually all electrical activity recorded on the scalp is generated by current flow across the synaptic membranes of cortical neurons.
Fig. 12-4 Schematic of a brain cross-section, illustrating four representative cortical EEG sources.
(From Olejniczak P, Neurophysiologic basis of EEG. J Clin Neurophysiol 2006;23(3):188.)
The main sources of EEG derive from the cerebral cortex and form three-dimensional potential fields, which can be recorded as two-dimensional potential fields in the function of voltage versus time. It takes a combined synchronous electrical activity of approximately 108 neurons and their synaptic connections in a cortical area of 6 cm2 to create visible EEG. The area of cortex required for the generation of interictal spikes may be as large as 20 cm2 [Olejniczak, 2006].
Subcortical activity does not substantially contribute to the generation of current flow and electric fields. Instead, diencephalic structures, such as the thalamus, exert a modulatory effect on cortical rhythms. The dorsal thalamus is considered the chief subcortical EEG rhythm generator, synchronizing populations of neocortical neurons as voltage generators. In normal conditions both thalamic and cortical regions interact to produce synchrony of cortical postsynaptic potentials during wakefulness and sleep. The facultative pacemaker theory assumes that the thalamocortical relay neurons send fibers to the cortex, as well as giving off branches that turn back and end on thalamic inhibitory interneurons (biofeedback servomechanism). The nucleus reticularis hypothesis attributes the cells of the nucleus reticularis thalami to release the inhibitory neurotransmitter gamma-aminobutyric acid (GABA) in rhythmic bursts of depolarization directed to the neurons of the dorsal thalamus and rostral brainstem (Figure 12-5) [Olejniczak, 2006].
Fig. 12-5 Relationship between EEG slow waves and thalamic intracellular potentials.
(From Olejniczak P, Neurophysiologic basis of EEG. J Clin Neurophysiol 2006;23(3):188.)
Unlike sleep spindles, which require synaptic activities to establish the rhythmic oscillations, delta oscillation is an intrinsic rhythm that depends on potassium fluxes at voltage-dependent ion channels of cortical and thalamic neurons. Desynchronization of the EEG is the interruption of its rhythmical activity. It occurs with activation of ascending cholinergic projections of the basal forebrain and brainstem projections from the raphe nuclei and locus ceruleus. Rhythmic activity is interrupted both by direct effects on cortical neurons and indirectly by thalamic neurons. At the cellular level, desynchronization is accompanied by a transition from a burst firing pattern to a more continuous or single spike pattern. Desynchronization is enhanced by behavioral arousal and suppressed by non-rapid eye movement (REM) sleep. Certain abnormal synchronous patterns, such as alpha coma, occur in the setting of widespread injury to the ascending neuronal networks that otherwise produce arousal and desynchronization [Olejniczak, 2006].
Glial cells consist of a soma and fibers. Glial cells intermingle with the neuronal structures and are electrically coupled, building up an extended functional network. Glial cells also exhibit a membrane potential. Unlike neurons, glial cells do not generate postsynaptic action potentials. Their resting potential is exclusively based on potassium-outward current through leakage channels. The membrane potential value is close to the potassium equilibrium potential. With a decrease in extracellular potassium concentration, glial cells depolarize and repolarize, respectively. Glial cells are functionally linked by way of the extracellular potassium concentration. Neuronal action potentials are associated with an outflow of potassium ions. With an increase in the repetition rate of neuronal action potentials, extracellular potassium concentration increases, resulting in depolarization of glial cells adjacent to active neurons [Somjen and Trachtenbers, 1979].
Potential Fields and Neuronal Networks
Each neuronal arrangement generates opened and closed fields. In open fields, one electrode largely integrates potentials of the neuronal population, whereas the other electrode sees only the positive or negative field, permitting the recording of the field potential. In a closed field, external electrodes do not appear to see potential differences because currents within the pool compensate for each other [Niedermeyer and Lopes da Silva, 2005]. Several types of field potentials can be differentiated, depending on the time constant of the amplifying recording device. Amplified EEG recordings at a time constant of 1 second or less can be contrasted with an infinite time constant using a direct current (DC) amplifier, permitting additional recording of baseline shifts and wavelike potentials without filtering of slow-frequency activities.
Neurophysiologic Basis of Abnormal Electrical Patterns
Interictal spike discharges, the hallmark of the epileptic neuron in experimental models of epilepsy, involve a specific type of membrane depolarization, referred to as a paroxysmal depolarization shift. There are general similarities between the neuronal events underlying this interictal epileptogenic process [Jeffreys, 1990]. In hippocampal and neocortical slice recordings taken after penicillin application [Ayala et al., 1973], high-voltage discharges appear in the EEG recording and are associated with an intracellularly recorded paroxysmal depolarization shift. These phenomena appear in intracellular recordings of experimental animals and human cortices. The depolarization is of relatively high voltage (10–15 μV) and long duration (100–200 msec), and it is associated with a burst of spike discharges. The event produces a train of action potentials that conduct away from the neuron along the axon. The interictal paroxysmal depolarization shift is followed by a period of hyperpolarization. Over time, this depolarization can summate to form a prolonged depolarization with a persistent loss of hyperpolarization, which is recorded on the surface as continuous spike discharges coinciding with the tonic phase of a generated tonic-clonic seizure. Subsequently, large inhibitory potentials alternate with recurrent rhythmic depolarization, which coincides with the clonic phase of the seizure. Despite the higher threshold necessary to achieve depolarization and the longer refractory period observed in immature animals [Prince and Gutnick, 1972], an understanding of paroxysmal depolarization shift is crucial to an appreciation of maturational aspects of epileptogenesis.
Based on these experimental observations, several hypotheses have been advanced to explain the mechanism by which normal neuronal activities convert to those of abnormal interictal discharges [Prince, 1985]. One mechanism involves intrinsic membrane abnormalities that promote burst-generating properties in individual neurons by an imbalance of calcium and sodium ion movements [Schwartzkroin and Prince, 1978]. Another mechanism involves the loss of inhibition by a group of neurons because of the absence of the inhibitory neurotransmitter, GABA [Prince, 1985]. A third mechanism of summated excitatory postsynaptic potentials helps explain how large groups of neurons generate depolarization shifts [Prince, 1978].
Although overshadowed by factors influencing seizure initiation, seizure termination is a critical step in the return to the interictal state [Lado and Moshe, 2008]. Understanding the mechanisms contributing to seizure termination could potentially identify novel anti-ictal and antiepileptogenic drugs, as well as highlighting the pathophysiology contributing to both seizure initiation and termination.
Proposed mechanisms unfortunately do not yet fully explain the transformation from an interictal to an ictal event. Other mechanisms have been proposed based on additional experimental studies, including changes in the ionic microenvironment that result in enhanced neuronal excitability, axonal burst generation, and cholinergic alteration of neuronal properties [Prince, 1985]. A systems biology approach from membranes to synapses to networks and finally circuits may better elucidate pathways to normal or abnormal neurobehavior [Grillner et al., 2005].
Metabolic factors related to glucose or electrolyte imbalance or noncerebral factors, such as trauma or fever, also facilitate the onset of seizures, particularly in children. Additional biochemical and anatomic alterations within a seizure focus may further promote seizure generation by neuronal destruction or glial proliferation [Aird et al., 1984].
Abnormal Suppression or Slowing of Electroencephalographic Activity
In addition to the presence of spike or sharp-wave discharges for the diagnosis of seizure disorders, other types of abnormal EEG patterns coincide with different neuropathologic substrates [Ebersole and Pedley, 2003]. Unfortunately, little information exists that correlates altered neuronal properties, such as the mechanisms discussed for epileptogenesis, with specific neuropathologic entities. Instead, clinical interpretations of the following EEG patterns are empirically based on correlative neuropathology.
Local suppression or absence of background rhythmic activity is a strong indication of brain dysfunction, irrespective of age or location in the brain. Complete absence of activity usually implies cortical necrosis that is close to the surface [Goldensohn, 1979a; Goldensohn, 1979b]. However, incomplete depression of background activity is the more common situation. The presence of symmetric suppression of frontal beta activity, central rhythms, dominant alpha activity, or sleep spindles in association with polymorphic delta waves strongly indicates a destructive process in the brain underlying those electrodes (Figure 12-6A) [Arfel and Fischgold, 1961]. EEG recordings of neonates showing asymmetric background activities usually suggest that the brain lesion is in the attenuated location [Scher, 1982].
Continuous polymorphic delta waves constitute a category of EEG abnormality that may suggest a structural brain lesion on an acquired or congenital basis (see Figure 12-6B). Irregular delta waves between 0.5 and 2.5 Hz do not react to eye opening, arousal, or sleep. Correlations with brain lesions in animals [Gloor et al., 1968] and in humans at postmortem examination have been described [Rhee et al., 1975]. Focal slowing may imply focal destructive lesions of white matter by a congenital, vascular, neoplastic, or infectious process. Polymorphic delta waves can commonly appear immediately after a seizure of focal onset and with reversible conditions, such as migraine [Hockaday and Whitty, 1969]; both are common occurrences in children. The combination of bilateral, synchronous rhythmic discharges and polymorphic delta waves occurs in diffuse encephalopathies involving white and gray matter. Certain brain regions, such as the frontal, temporal, and occipital areas, are more likely to express polymorphic delta waves. The association of background rhythm depression and polymorphic delta waves increases the likelihood of destructive lesions, especially tumors. Parasagittal and parietal lesions often are associated with attenuation of rhythms or prominent theta rhythms.
Intermittent rhythmic delta activity is another category of nonepileptiform abnormality with a variety of neuropathologic correlates. Runs of sinusoidal 2.5 Hz are generally reactive to eye opening, hyperventilation, or arousal. Two distinct distributions of rhythmic delta activity over the scalp have been identified. Frontal intermittent delta activity (Figure 12-7A) and occipital rhythmic delta activity (see Figure 12-7B) generally indicate modification of cortically generated EEG activity by midline subcortical structures. The thalamus, reticular activating system, and midbrain can contribute to the dysfunction between subcortical gray matter and cortical neurons [Daly, 1974]. These two types of rhythmic delta activity are largely age-related. Frontal intermittent delta activity usually occurs in adult patients, whereas occipital rhythmic delta activity is found mainly in children. Intermittent rhythmic delta activity does not necessarily indicate that the major pathologic condition is in that region. Occipital rhythmic delta activity and frontal intermittent delta activity have been documented in 53 percent of 145 children with posterior fossa tumors [Martinius et al., 1968]. As a rule, it has little localizing value for supratentorial masses, although it may be accentuated on the side of the tumor [Hess, 1975]. Intermittent rhythmic delta activity is nonspecific and may be observed with systemic metabolic disorders, increased intracranial pressure, encephalitis, and trauma. However, a subsequent report concerning frontal intermittent delta activity described this pattern as rare for children, observed in only 20 of 1500 EEG studies of children between 18 months and 17 years of age. Most patients were awake and showed no encephalopathic signs, but were cognitively impaired. Another 50 percent had a history of epilepsy, with epileptiform activity occurring in 55 percent of the cohort [Watemberg et al., 2003].
Epileptiform discharges can be found in combination with slowing as an indication of a structural abnormality. Focal discharges during a seizure have better localizing value than interictal spikes [Hess, 1975]. In general, slow-growing neoplasms, such as oligodendrogliomas or astrocytomas, produce more epileptiform activity than rapidly growing tumors [Kershman et al., 1949]. Spike discharges are more common after surgery, such as for meningiomas, but neurologists are advised to exercise extreme caution concerning spike discharges as reliable guides to localization of destructive lesions. Imaging studies are far more reliable diagnostic guides for structural abnormalities.
Significance of Normal Variation in Electroencephalography: Maturational Patterns
Guidelines for Interpretation
EEG analysis requires a systematic, orderly process in which a series of steps are followed to reach a proper interpretation [Ebersole and Pedley, 2003]. The rhythmicity of spontaneous EEG signals gives a continuous admixture of scalp-generated oscillatory potentials. EEG frequencies used for clinical studies are classified in four band ranges. Delta activity is less than 4 Hz; theta activity is 4–8 Hz; alpha activity is 8–13 Hz; and beta activity is greater than 13 Hz. While DC (usually below 3 Hz) and gamma-frequencies (above 30 Hz) can be recorded with appropriate filter settings, these rhythms are currently applied only to research recordings. In general, the amplitude of EEG activity is inversely proportional to frequency.
For pediatric EEG studies, the amount of slow activity decreases with increasing age, and the persistence and frequency of slow activity vary in different brain regions. It is important to appreciate the presence and degree of expression of frequencies in various regions at different ages, and other parameters, such as waveform, manner of occurrence (e.g., random, continuous), and amplitude, are essential to visual analysis. By means of this cumulative analysis, using a list of parameters of EEG activity [Ebersole and Pedley, 2003; Kellaway and Crawley, 1964; Lombroso, 1980], the neurologist can attempt to assign normal or abnormal clinical significance to the EEG pattern. Critical information regarding age and state of the patient affects the ability of the neurologist to judge normality in the EEG record. It may require several EEG recordings and the persistence or resolution of abnormal electrical activity relative to the state of the patient to assess normality properly. Several recordings allow an appreciation of the ontogeny, or evolution, of significant age-specific EEG patterns. These guidelines must be repeatedly emphasized as the pediatric neurologist acquires an appreciation of the rich diversity of normal maturational patterns.
Newborn Electroencephalographic Patterns
Neonatal EEG studies have been reported for more than 60 years [Okamato and Kirikae, 1951]. Pioneering investigations by several independent researchers have all contributed information concerning the developmental neurophysiology of the immature brain. Some of these studies predate the development of the tertiary-care neonatal intensive care unit, and the neurologist using EEG recordings had an understandably limited role in the diagnostic assessment and clinical care of the sick neonate.
Improvements in recording equipment and standardization of the recording techniques are available in modern neonatal intensive care units. An internationally accepted system of electrode placement, adapted for the neonate and young infant, permits standardization of recordings between laboratories [AES, 1986]. Development of 16- and 21-channel EEG machines with improved filtering systems and electrode construction minimizes environmental and physiologic sources of artifacts. Synchronized video-EEG studies permit more accurate comparison between electrographic and behavioral changes in the assessment of seizures, movement disorders, and sleep cycles [Dyken et al., 1997; Scher, 2008; Scher and Barmada, 1987a].
Several fundamental principles for neonatal EEG studies serve as an introduction to an understanding of its chief clinical application [Scher, 2005a; Scher, 2008]. There are expected changes in the scalp-generated EEG patterns for neonates of different gestational ages. The experienced encephalographer can approximate the electrical maturity within 2 weeks of the gestational age. Changing electrical patterns reflect the postconceptional age of the neonate independent of birth weight. Maturation of the neonate’s sleep–wake behavior follows maturation of the CNS and is independent of the birth weight. Preterm neonates, when corrected to term postconceptional age, should have EEG patterns and sleep behavior similar to those of term, appropriate-for-gestational-age newborns.
Detailed electrographic and anatomic correlations that compare sulcal-gyral development with evolving electrical patterns have been correlated with clinical information concerning gestational maturity [Scher and Barmada, 1987a] (Figure 12-8 and Figure 12-9). Of 25 infants, 23 had maturational agreement within 2 weeks between electrical patterns and sulcal-gyral measurements of the inferior frontal, superior temporal, and calcarine gyri, and between the cytoarchitecture of various brain regions.
Fig. 12-8 Correlation of EEG and anatomical development in a 26-week-gestation preterm neonate.
(From Scher MS, Ahdab-Barmada M. Gestational age by electrographic, clinical and anatomical criteria. Pediatr Neurol 1987;3:256.)
Fig. 12-9. Correlation of EEG and anatomical development in a 30 week-gestation preterm neonate.
(From Scher MS, Ahdab-Barmada M. Gestational age by electrographic, clinical and anatomical criteria. Pediatr Neurol 1987;3:256.)
Regional changes in electrical activity clearly occur in the EEG of the premature neonate when recordings are obtained after 24–25 weeks’ estimated gestational age and at weekly intervals [Dreyfus-Brisac, 1979; Mizrahi and Kellaway, 2003; Scher, 2005a; Scher et al., 2003a; Tharp et al., 1981; Torres and Anderson, 1985] (Figure 12-10). Sleep–wake behavior cannot be distinguished for patients younger than 30 weeks of age, but other hemispheric or regional patterns demonstrate predictable, evolving characteristics.
Ontogeny of Electroencephalographic Features
The evolving EEG sleep patterns in the asymptomatic, presumably healthy preterm infant has been the subject of many excellent reviews [Ebersole and Pedley, 2003; Lombroso, 1985; Pope et al., 1992; Scher, 1993a; Scher, 1993b; Torres and Anderson, 1985]. Improvements in neonatal intensive care, however, require periodic revisions to include more preterm infants [Mizrahi and Kellaway, 2003; Scher, 2005a, 2008]. These revisions are particularly relevant for preterm infants younger than 32 weeks’ gestation, for whom substantial improvement in survival rates has occurred over the past decade. However, there is a greater prevalence of late preterm infants (34–37 weeks estimated gestational age [EGA]) who also remain at increased risk for neurodevelopmental deficits [Ramachandrappa and Jain, 2009]. Applying the principles of functional brain maturation using EEG is therefore relevant across the gestational age spectrum. It will always be important to verify which EEG-sleep patterns are within the range of normal by systematic neurodevelopmental assessment of such children at increasing postnatal ages.
In the following sections, regional and hemispheric EEG patterns for preterm and term neonates are arbitrarily assigned within specific gestational age ranges. Temporal, spatial, and state organization of the EEG recordings of cerebral activity during each age range is highlighted with appropriate illustrations. Greater details can be found in recent reviews [Scher, 2008; Scher and Loparo, 2009].
Gestational Age of Younger than 28 Weeks
A pattern of alternating active and sleep periods in preterm infants is characterized as discontinuity, or tracé discontinuity [Ellingson, 1964; Tharp et al., 1981], with alternating longer periods of quiescence and shorter periods of EEG activity. In fact, a 1-hour cyclic rhythm between burst and interburst intervals is present as early as 25–30 weeks EGA and persists up to a term age [Scher et al., 2005c]. None the less, Anderson and colleagues found that 60 percent of EEG recordings consisted of discontinuity [Anderson et al., 1985]. These same investigators found that the average interburst interval for this age range was 8–16 seconds, with the longest interburst intervals occurring between 15 and 88 seconds. Similar ranges for the duration of interburst intervals have been found by other investigators [Benda et al., 1989; Connell et al., 1987; Eyre et al., 1988; Hughes et al., 1983a; Hughes et al., 1983b; Hughes et al., 1987]. This finding sharply contrasts with earlier descriptions of interburst intervals as long as 2 minutes [Lombroso, 1985]. Such differences may be related to the medical condition of the neonate at the time of the recording or the lack of information concerning long-term follow-up. In this age group, EEG activity predominates in the vertex, central, and occipital regions. Bitemporal attenuation is common and may reflect intrahemispheric asynchrony [Scher and Barmada, 1987a]. Underdevelopment of the inferior frontal and superior temporal gyri may also help explain the relative quiescence of activity in this brain region.
EEG activity consists of mixed frequencies, dominated by delta activity in the parasagittal and occipital regions. Occipital delta activity is isolated to one or two waveforms and rarely lasts longer than 5–6 seconds. Faster frequencies in the theta, alpha, and beta ranges are intermixed in multiple brain regions. Diffuse theta bursts are common during continuous or discontinuous periods. Beta/delta complexes are transient patterns that identify preterm infants of various conceptional ages. Random or briefly rhythmic 0.3- to 1.5-Hz delta activity of 50–250 μV has superimposed bursts of low to moderate amplitude, and faster frequencies, with a frequency range of 10–20 Hz [Ebersole and Pedley, 2003]. The amplitude of such activity on bipolar recordings rarely exceeds 60–75 μV. Historically, various terms have been applied to such complexes, including spindle delta bursts, brushes, spindle-like fast waves, and ripples of prematurity. These complexes can be seen as early as 24–26 weeks, largely in the central and midline regions, as well as in the occipital regions.
Runs of monorhythmic alpha or theta activities are independent of delta brushes principally occurring in the occipital regions in the neonate younger than 28 weeks’ gestation. This transient pattern has been described in more detail and can last for 6–10 seconds in an asynchronous or asymmetric manner [Hughes et al., 1990]. Such activity should be distinguished from the more diffuse bursts of moderate- to high-amplitude theta activity that commonly exists at this degree of prematurity (see Figure 12-10A and B).
Intrahemispheric synchrony and interhemispheric synchrony have been variably described by different investigators. Lombroso described synchronous bursts as morphologically similar bursts of activity appearing within 1.5 seconds. He estimated that synchronous periods ranged from only 50 percent of all periods of activity at 31–32 weeks’ postconceptional age to 100 percent at 40–43 weeks’ postconceptional age, with a midpoint of 70–85 percent at 35–36 weeks’ postconceptional age [Lombroso, 1989, 1985]. This finding is in sharp contrast to Anderson’s observations that interhemispheric synchrony had a mean of 93 percent for 1-minute epochs at 27 weeks’ postconceptional age, with a mean of 94 percent at 29–32 weeks’ postconceptional age [Anderson et al., 1985]. A high degree of intrahemispheric synchrony already exists in the preterm infant younger than 30 weeks’ gestation. However, it is also reasonable to consider that more epochs of asynchrony occur as the distance from the midline increases, given the rapid brain growth beyond 30 weeks’ postconceptional age. Rapid growth of temporal and parietal structures in particular may contribute to more frequent episodes of asynchrony [Scher, 2005a]. Measures of asynchrony must include information about postconceptional age and about the EEG state. Asynchrony should be assessed for all background rhythms[Scher, 2008], not just for bursts during discontinuous epochs [Anderson et al., 1985; Lombroso, 1985].
Gestational Age of 28–31 Weeks
Cyclic organization of state remains visually undifferentiated in infants with a gestational age of 28–31 weeks [Lombroso, 1989; Lombroso, 1985], although a rudimentary ultradian rhythm of approximately 1 hour can be discerned with polysomnographic analysis [Scher et al., 2005c]. Also, periods of body and eye movements are more distinctively associated with irregular respirations during continuous periods of EEG activity. Discontinuous epochs still predominate but decrease in duration compared with the premature neonate younger than 28 weeks’ postconceptional age. Interbursts become progressively briefer with a dramatic increase in low to moderate-amplitude faster rhythms primarily in the theta range. By 32 weeks’ postconceptional age, the degree of discontinuity has decreased to 45 percent of the record [Anderson et al., 1985]. Dreyfus-Brisac found an alternating pattern in 24 percent of records at 32–34 weeks’ gestation [Dreyfus-Brisac, 1970]. The average interburst intervals at 29–31 weeks’ postconceptional age ranged between 5 and 14 and between 4 and 11 seconds, respectively, with means of 9 and 7 seconds; whereas the longest interburst periods for these two postconceptional age groups were found to be between 16–57 and 6–41 seconds with means of 36 and 20 seconds, respectively.
Monorhythmic occipital delta patterns with durations of more than 30 seconds are quite abundant at 28–31 weeks. Delta brush patterns continue to be abundant, involving the vertex and central regions along with the occipital and temporal regions [Watanabe et al., 1972]. Sometimes, it may be difficult to differentiate delta brushes in the temporal region, particularly because of superimposition with temporal theta bursts.
Another useful developmental marker is the appearance of rhythmic, 4.5- to 6-Hz activity occurring independently and synchronously in each midtemporal region. Although this activity is occasionally observed in neonates younger than 28 weeks’ postconceptional age, it is expressed maximally between 28 and 32 weeks. In the past, this feature has been described as “temporal sawtooth waves” [Scher, 2005a
[/not-level-membership-for-neurology-category]
