Nutritional Requirements

Published on 22/03/2015 by admin

Filed under Pediatrics

Last modified 22/04/2025

Print this page

rate 1 star rate 2 star rate 3 star rate 4 star rate 5 star
Your rating: none, Average: 0 (0 votes)

This article have been viewed 4187 times

Chapter 41 Nutritional Requirements

Nutritional intakes for infants, children, and adolescents should provide for maintenance of current weight and support normal growth and development. The infancy growth period is rapid, is critical for neurocognitive development, and bears higher metabolic rate and nutrient requirements, relative to body size, than other periods of growth. It is followed by the childhood period of growth, during which 60% of total growth occurs, and then by the puberty phase. Nutrition and growth during the first 3 yr of life predict adult stature and some health outcomes. The major risk period for growth stunting (impaired linear growth) is between 4 mo and 2 yr of age, and it may be followed by a delay in the childhood phase of growth. It is critical to identify nutrient deficiencies promptly and to address them aggressively early in life, because they can impart lasting effects on growth and development.

Failure to meet the substantial dietary needs in childhood can result in energy and nutrient deficiencies that adversely affect the growth and development process. Deficiency in any one nutrient can be growth limiting. In parallel to the risk for nutrient and energy deficiencies, issues relating to excesses pose important challenges because of their negative health effects, such as obesity or cardiovascular disease risk factors. The nutrition transition under way in the developing world from traditional diets to the Western diet has been associated with increases in noncommunicable diseases, often coexisting with undernutrition and malnutrition, observed sometimes in the same communities or even the same families.

In addition to providing calories to meet energy requirements, dietary intake also provides macronutrients and micronutrients essential for sustaining the functioning of multiple vital processes. Therefore, in addition to nutrient deficiencies potentially limiting growth, impairments in immune functioning and increased morbidity and mortality can occur. Zinc is a micronutrient that supports multiple metabolic functions in the body, is essential for normal immune functioning, and is required to support linear growth; zinc deficiency is associated with impaired immune functioning and poor linear growth. The significant global burden of malnutrition and undernutrition is the leading worldwide cause of acquired immunodeficiency and the major underlying factor for morbidity and mortality globally for children <5 yr of age.

It is important to view the impact of nutrition on health with various perspectives: to prevent deficiency, to promote adequacy, and to prevent noncommunicable diseases associated with excess intakes. As illustrated by the examples of intake of vitamin D and polyunsaturated fatty acids (PUFAs), our understanding of nutritional needs is evolving beyond deficiency and adequacy states to intakes and status associated with optimal health.

Dietary Reference Intakes

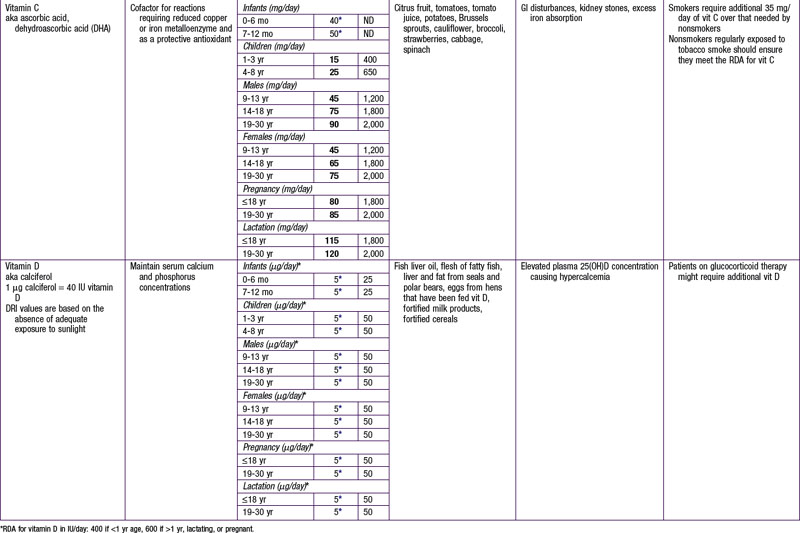
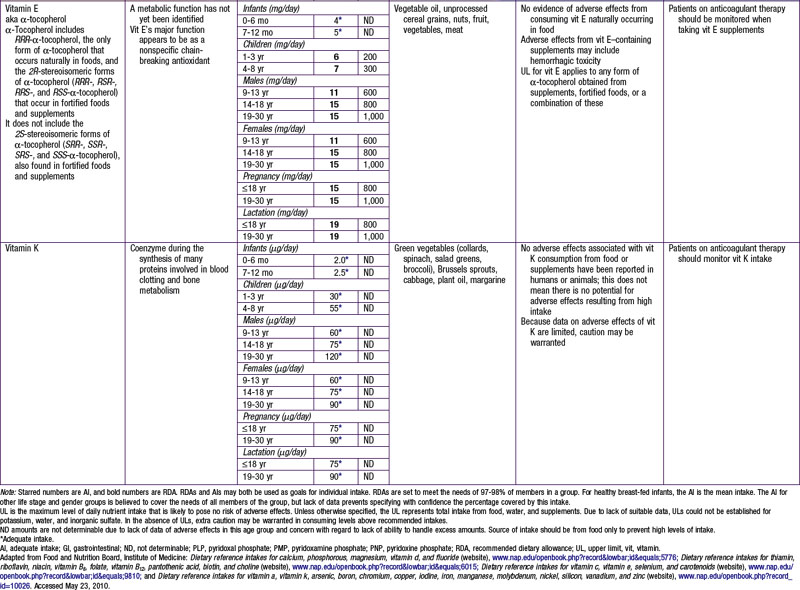
The dietary reference intake (DRI) has been established for most nutrients by the Food and Nutrition Board of the Institute of Medicine using a rigorous process of scientific evidence evaluation (Tables 41-1 to 41-8). The DRI provides guidance as to nutrient needs for individuals and groups across different life stages and by sex. The DRI replaces the former recommended dietary allowances (RDA).

Table 41-2 EQUATIONS TO ESTIMATE ENERGY REQUIREMENT

INFANTS AND YOUNG CHILDREN: EER (kcal/day) = TEE + ED
0-3 mo EER = (89 × weight [kg] − 100) + 175
4-6 mo EER = (89 × weight [kg] − 100) + 56
7-12 ms EER = (89 × weight [kg] − 100) + 22
13-35 mo EER = (89 × weight [kg] − 100) + 20
CHILDREN AND ADOLESCENTS 3-18 yr: EER (kcal/day) = TEE + ED
Boys
3-8 yr EER = 88.5 − (61.9 × age [yr] + PA × [(26.7 × weight [kg] + (903 × height [m])] +20
9-18 yr EER = 88.5 − (61.9 × age [yr] + PA × [(26.7 × weight [kg] + (903 × height [m])] +25
Girls
3-8 yr EER = 135.3 − (30.8 × age [yr] + PA [(10 × weight [kg] + (934 × height [m])] + 20
9-18 yr EER = 135.3 − (30.8 × age [yr] + PA [(10 × weight [kg] + (934 × height [m])] + 25

ED, energy deposition; EER, estimated energy requirement; PA, physical activity quotient; TEE, total energy expenditure.

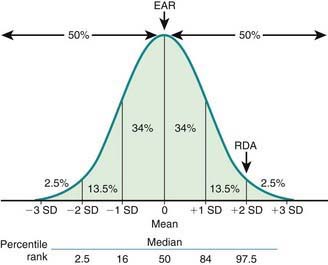
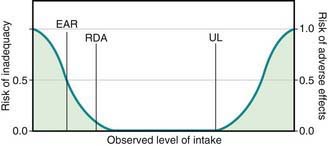
Key DRI concepts include the estimated average requirement (EAR), the recommended dietary allowance (RDA), and the tolerable upper limit of intake (UL) (Fig. 41-1). The EAR is the average daily nutrient intake level estimated to meet the requirements for 50% of the population, assuming normal distribution; the RDA is an estimate of the daily average nutrient intake to meet the nutritional needs of >97% of the individuals in a population, and it can be used as a guideline for individuals to avoid deficiency in the population. When an EAR cannot be derived, an RDA cannot be calculated; therefore, an adequate intake (AI) is developed as a guideline for individuals based on the best available data and scientific consensus. The UL denotes the highest average daily intake at which no adverse health effects are associated for almost all individuals in a particular group. The relationships among EAR, RDA, and UL are characterized in Figure 41-2.

Energy

Energy is thought of in terms of both intake and expenditure. Deficits and excesses of energy intake yield undesirable health consequences. Inadequate energy intake can lead to catabolism of body tissues and inability to provide energy substrate, whereas excess energy intakes can increase the risk for obesity. Adequacy of energy intake in adults is associated with maintenance of a healthy weight. The 3 components of energy expenditure in adults are the basal metabolic rate, the thermal effect of food (energy required for digestion and absorption), and energy for physical activity. Additional energy intake and expenditure are required to support growth and development for children.

The estimated energy requirement (EER) is the average dietary energy intake predicted to maintain energy balance in a healthy individual of a defined group. The EER accounts for age, gender, weight, stature, and physical activity level (PAL) (see Tables 41-2 and 41-3). The Dietary Guidelines for Americans and the DRI recommend 60 min of moderately intense daily activity for children >2 yr of age to maintain a healthy weight and to prevent or delay progression of chronic noncommunicable diseases such as obesity and cardiovascular disease. The EER was determined based on empirical research in healthy persons at different physical activity levels, including levels different from the recommended levels. They do not necessarily apply to children with acute or chronic diseases. EER is estimated by equations that account for total energy expenditure as well as energy deposition for healthy growth. Note that the EER for infants, relative to body weight, are approximately twice those for adults, due to the increased metabolic rate and requirements for weight maintenance and tissue accretion affecting growth.

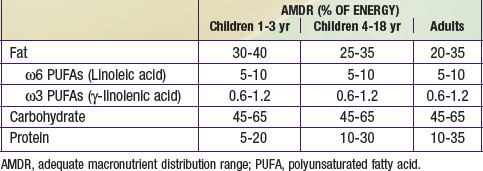
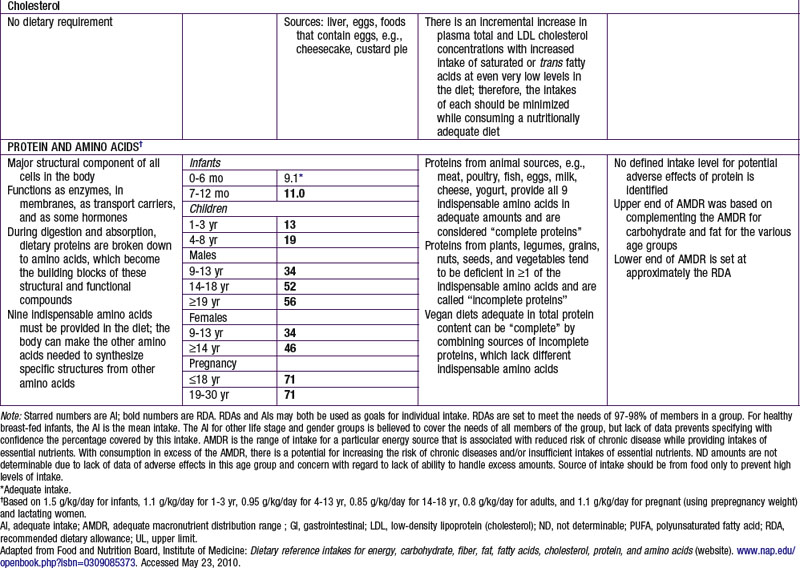
The nutrients that provide energy intake in the child’s diet are fats (∼ 9 kcal/g), carbohydrates (∼ 4 kcal/g), and proteins (∼ 4 kcal/g). They are referred to as macronutrients. Alcohol intake can also contribute to energy intake (∼ 7 kcal/g). The EER does not specify the relative energy contributions of carbohydrates, fats, or proteins. Once the minimal intakes of each of the respective macronutrients are attained to meet physiologic requirements and to achieve adequacy (sufficient protein intake to meet specific amino acid requirements), the remainder of the intake is used to meet energy requirements with some degrees of freedom and interchangeability among fats, carbohydrates, and proteins. This forms the basis for the acceptable macronutrient distribution ranges (AMDR) (see Table 41-4), expressed as a function of total energy intake. In the following sections, each macronutrient is reviewed.

Fat

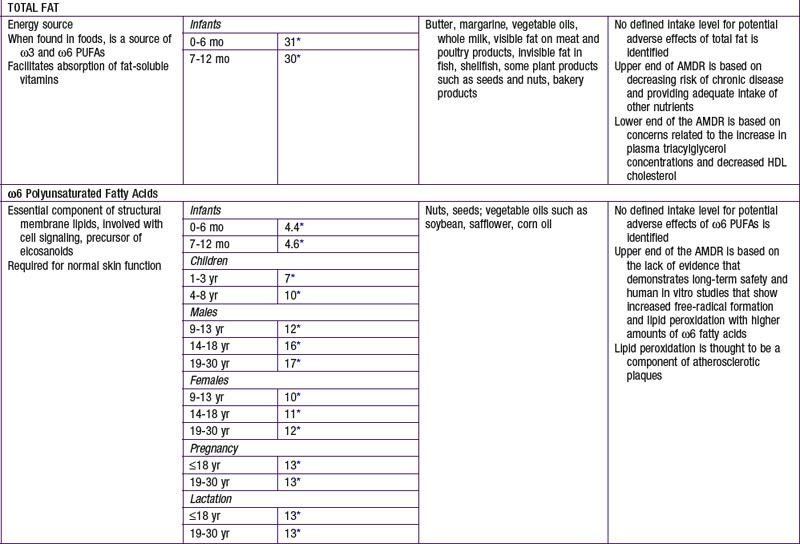
Fat is the most calorically dense macronutrient, providing about 9 kcal/g. The main dietary sources of fat include animal products (meat, butter, milk, cheese, egg yolk), vegetable oils, margarine, baked goods, and fried foods. The AMDR for fats is 30-40% of the total energy intake for children 1-3 yr of age and 25-35% for children 4-18 yr of age. Dietary fats are composed of a various mix of saturated fats, monounsaturated fat, PUFA, trans fat, and cholesterol. In addition to being energy-dense macronutrients, fats play significant structural and functional roles; cholesterol moieties are precursors for cell membranes, hormones, and bile acids. Fat intake also facilitates absorption of the fat-soluble vitamins A, D, E, and K.

Although some dietary fat intake is necessary to achieve a healthy, balanced diet, in the USA, the most common nutritional issues are associated with excess intake of fat or of some types of fat. Dietary saturated fatty acids, trans fats (found in hydrogenated margarines and oils), and cholesterol increase the LDL fraction of serum cholesterol, a risk factor for the development of arteriosclerosis and coronary heart disease. Autopsy studies have demonstrated that atherosclerosis begins early in childhood, and even infancy, starting with the development of fatty streaks (accumulation of lipid-filled macrophages within the arterial intimal lining). Therefore, dietary advice to optimize cardiovascular health should be dispensed for children starting at age 2 yr, when sufficient fat intake to sustain growth and brain development is no longer a concern.

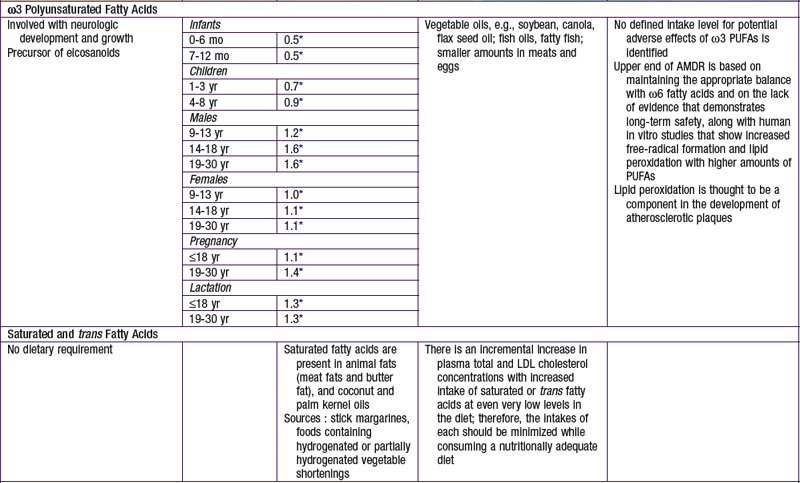
Because saturated and monounsaturated fats can be synthesized endogenously to support adequate structural and physiologic requirements, there is no AI or RDA set for these dietary components. Trans fats have no known beneficial effects in humans; therefore, no corresponding AI or RDA has been set. Similarly, a UL has not been set for cholesterol, saturated, or trans fats because there is a positive linear association between intake of these fats and increased risk for cardiovascular disease, without a threshold level at which risk is increased compared to intake below the threshold. Diets low in saturated fats and cholesterol are therefore preferred. Diets containing as little as possible, if not devoid of, trans fats, are also encouraged. On the other hand, dietary intakes of mono- and polyunsaturated fats have been associated with positive health outcomes. Therefore, for optimal cardiovascular health in the general population, rather than limiting the total amount of fat intake, in most cases, advice should focus on changing the type of fat that is consumed. With respect to preventing obesity, all types of fatty acids have about the same energy content and can contribute to increasing the risk for obesity. The different dietary recommendations are in general agreement that optimal dietary intake of fat over time from several sources should be <30% of total energy intake, <1/3 (10% of total energy intake) from saturated fat, no trans fat, and <300 mg/day cholesterol.

Humans are incapable of synthesizing the precursor ω3 (α–linolenic; ALA) and ω6 (linoleic; LA) PUFAs and are dependent on dietary sources for these essential fatty acids. Essential fatty acid (EFA) deficiency can be associated with desquamating skin rashes, alopecia, and growth deficits, but they are rare in the general population. EFAs are enzymatically elongated and desaturated into longer-chain fatty acids; ALA can be converted to eicosapentaenoic (EPA) and docosahexaenoic (DHA) ω3 PUFAs, and LA is converted to arachidonic acid (ARA), the major ω6 PUFA. Long-chain PUFAs such as DHA and ARA play a variety of structural and functional roles, influence membrane fluidity and function as well as gene expression, and modulate the inflammatory response, and, as such, have important roles throughout the life cycle. ARA and DHA are present in breast milk, are often supplemented in infant formulae, and are required for normal growth and development. DHA is present in the retina and is involved in the visual evoked response in infants.

The conversion of ALA to EPA and DHA and of LA to ARA is influenced by many factors, including by type and amounts (absolute and relative) of dietary fats and by enzymatic substrate affinity among competing ω3, ω6, ω9, saturated, and trans fatty acids. ALA supplementation has been demonstrated to increase erythrocyte DHA content, but the efficiency in conversion of ALA to a longer-chain PUFA is minimal and variable, and approximately 0.5% of dietary ALA is converted to DHA and 5% of ALA intake converted to EPA; therefore, dietary intake of longer-chain PUFAs is an important determinant of serum and tissue long-chain PUFA status. The biologic activity and health benefits of ALA are thought to be derived via the longer-chain PUFA products EPA and DHA. Consistent with both of these findings of limited conversion of ALA to EPA and DHA, and that EPA and DHA appear to confer the biologic role and health benefits, the DRI stipulates that up to 10% of the AI for ω3 PUFA (ALA being the major dietary constituent) can be replaced by DHA and EPA to support normal neural development and growth.

Dietary intake of ω6 and ω3 PUFAs determines tissue status, and the ratio of dietary intake of each type of PUFA influences their relative amounts in different tissue compartments. A dietary ω6 : ω3 PUFA ratio of 4-5 : 1 may be beneficial in reducing risk of disease and may be associated with improved health outcomes, as compared to the current 15-30 : 1 ratio observed in the USA.

Protein

Proteins and amino acids have structural and functional roles in every cell in the body. Proteins also provide about 4 kcal/g (see Table 41-4 for the AMDR). Dietary protein requirements are determined by nitrogen balance studies and are used to determine the EAR and DRI for various age groups.

Dietary protein intake is required to replenish the turnover of proteins from different body compartments and to meet amino acid needs. Some dietary protein intake also provides energy substrate. Inadequate energy intake and/or inadequate protein intake increases catabolism of the body’s protein reservoirs (i.e., lean body mass, muscle) in order to provide substrate for energy and free amino acids required to support normal physiologic function. Nitrogen losses, derived from proteins, occur through urine, stool, and other bodily excretions and may be increased with greater lean body mass turnover and catabolism. Protein energy malnutrition, while relatively rare in the noninstitutionalized U.S. population, is more common in the developing world. Protein energy malnutrition impairs immune function and cellular membrane integrity, can lead to impaired linear growth, and increases the risk for morbidity and mortality. Age-related differences in protein requirements and turnover is such that infants have a higher protein per kilogram requirement than adults relative to body weight. Increased intake of proteins may be required for rare hypermetabolic states, such as extensive burns, but it is not required for the majority of children. In fact, protein intake in the USA is much greater than recommended in almost all infants and children. Protein intake in excess of what is needed is used as energy and stored as fat.

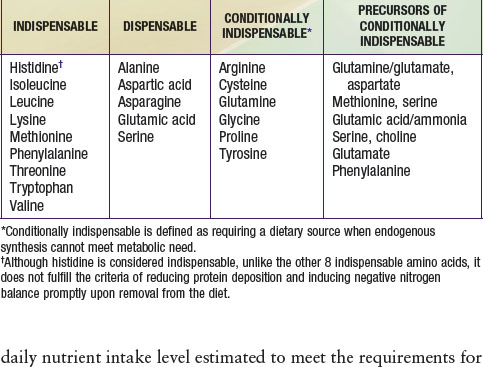
The amino acid content of dietary protein is also important. Certain amino acids are indispensable, and humans depend on dietary sources to meet adequacy and prevent deficiency. Certain amino acids are essential only at certain life stages and are termed conditional essential/indispensable. Infants require all of the indispensable amino acids that adults require, as well as cysteine and tyrosine (and perhaps arginine) early in life; these additional amino acids are indispensable for this life stage, due to the immaturity of hepatic cystathionase in early infancy. Human milk contains both the indispensable and conditionally indispensable amino acids and therefore meets the protein requirements for infants.

The amino acid composition of a dietary protein determines its biologic quality. Breast milk is considered the optimal source of protein for infants and is the reference amino acid composition by which biologic quality is determined for infants. If a single amino acid in a food protein source is low or absent but is required to support normal metabolism and meet needs, that specific amino acid becomes the limiting nutrient. For protein sources that have a limiting nutrient, use of complementary foods that contain the limiting amino acid, or use of an amino acid supplement, addresses the biologic quality deficit for that particular food. For soy-based infant formula, supplementation with the limiting amino acid (methionine) is the approach commonly used.

DRI for protein is provided in Table 41-5. Specific recommendations for appropriate dietary protein sources to meet indispensable amino acid requirements are available for groups adopting specific diets, such as vegetarians and vegans. Use of a variety of food sources to provide all of the required amino acids is a strategy advocated for vegetarians and vegans. A UL for protein has not been set per se, but excessive protein intake may be related to increased risk for gout in some patients. Intake of proteins or specific amino acids needs to be limited in some health conditions, such as renal disease and several rare metabolic diseases in which specific amino acids can be toxic. Specialized medical and nutritional care should be provided for these patients.

Carbohydrates

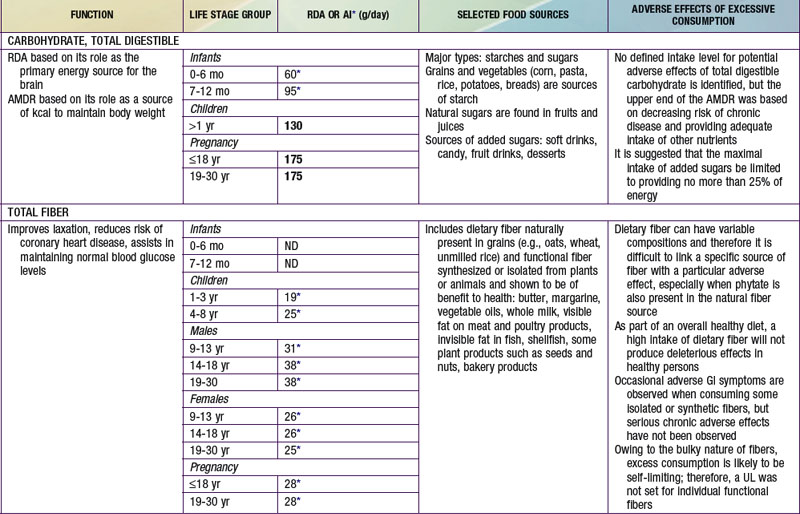
Carbohydrates provide about 4 kcal/g. They are abundant in many foods including cereals, grains, fruits, and vegetables. Dietary carbohydrates include monosaccharides (glucose, fructose), disaccharides (sucrose, lactose), oligosaccharides, and polysaccharides (starch), as well as the sugar alcohols. The primary function of carbohydrates is to serve as an energy source for all cells, with the central nervous system and erythrocytes depending most on glucose as an energy substrate. Dietary carbohydrate requirements are based on estimated brain requirements.

AMDR for carbohydrates is in Table 41-4. The minimum intake is based on estimated brain requirements. Chronic low carbohydrate intake results in ketosis, for which the long-term effects on growth and development have not been established. Although a UL for carbohydrates has not been set, a maximal intake of <25% or <10% of total energy intake from added sugars has been proposed in various dietary guidelines. Higher intakes of added sugar can displace other macro- and micronutrients and increase risk for nutrient deficiency and excessive energy intake. There is no distinct advantage or benefit obtained from discretionary calorie intake such as that provided by the consumption of added sugars. The Dietary Guidelines for Americans endorses diets with carbohydrates from a variety of fiber-rich fruits, vegetables, and whole grains in addition to the recommendations for reduced added sugar (sucrose) intake.

The majority of carbohydrates are present as starches or sugars in food. Simple sugars (mono- and disaccharides) are often added to foods and beverages during food preparation, processing, and packaging to enhance palatability and as preservatives. Nondiet soft drinks, juice drinks, iced tea, and sport drinks are among the major contributors to added sugars in the diet of U.S. children and adolescents. Added sugars have been demonstrated to increase systolic blood pressure and serum uric acid levels and can confer increased risk for obesity, diabetes, and dental caries. Fructose is one such added sugar in the form of high-fructose corn syrup, which is nearly ubiquitous in the U.S. diet. Excessive fructose intake, such as in the form of fruit juices, is associated diarrhea, abdominal pain, and failure to thrive in children.

The glycemic index is a measure of the area under the curve of blood sugar over time (2 hr) following ingestion against the reference standard (a slice of white bread). The glycemic index has predictable effects on blood glucose, hemoglobin A1C, insulin, triacylglycerol, and high-density lipoprotein (HDL) cholesterol levels. Lower glycemic index foods are recommended and can reduce the risk of insulin resistance and cardiovascular disease, although the data from clinical studies remain controversial.

Fiber

Dietary fiber is best characterized as nondigestible carbohydrates mostly derived from plant sources, such as whole grain, fruits, and vegetables, that escape digestion and reach the colon nearly 100% intact. These compounds are further classified as soluble versus non-soluble and by whether or not they are fermented by colonic bacteria. The DRI classifications list dietary fiber (nondigestible carbohydrates and lignin that are intrinsic and intact in plants), functional fiber (with known physiologic benefits in humans), and total fiber (dietary plus functional).

Fiber intake does not contribute significantly to energy intake, but it plays several important roles. The metabolic fate of dietary fiber is influenced primarily by the colonic bacterial complement, which, depending on the structure of the fiber, can render it susceptible to fermentation (e.g., pectin and oat bran). Common by-products of colonic fermentation include carbon dioxide, methane (in addition to other gases), oligofructases (a substrate that nourishes beneficial commensurate gastrointestinal (GI) flora known as prebiotic), and short-chain fatty acids (SCFAs). The common SCFAs produced by fermentation include acetate, butyrate, and proprionate. There is dynamic interplay between the colonic bacterial milieu and the diet. SCFAs also influence colonic physiology by stimulating colonic blood flow and fluid and electrolyte uptake. Butyrate is the preferred fuel for the colonocyte, and it might have a role in maintaining the normal phenotype in these cells.

Nondigestible dietary fiber might also play an important role by diluting toxins, carcinogens, and tumor promoters; by decreasing transit time, thereby decreasing colonic mucosal exposure; and by promoting their expulsion in the fecal stream. Dietary fiber resistant to colonic degradation might also play a role in maintaining and promoting stool bulk and in the regulation of intraluminal pressure and colonic wall resistance, disordered colonic motility, or both. Lack of dietary fiber is associated with constipation and diverticulosis. Fiber also slows gastric emptying and can promote satiety. Non-GI benefits of dietary fiber include reducing absorption of cholesterol.

Data are insufficient to establish an EAR; an AI for dietary fiber has been established based on the intake levels associated with reducing risk for cardiovascular disease and in lowering or normalizing serum cholesterol (see Table 41-5). A UL has not been established for fibers, which are not thought to be harmful to human health.

Micronutrients

Many U.S. children have suboptimal intake of iron, zinc, potassium, calcium, vitamin D, and vitamin K but excess intakes of sodium. Historically, dietary recommendations for micronutrients have been established to prevent deficiency. Food fortification is an effective strategy to prevent specific nutrient deficiencies, and it has been successfully implemented, for example, to reduce iodine deficiency globally with the introduction of iodized salt.

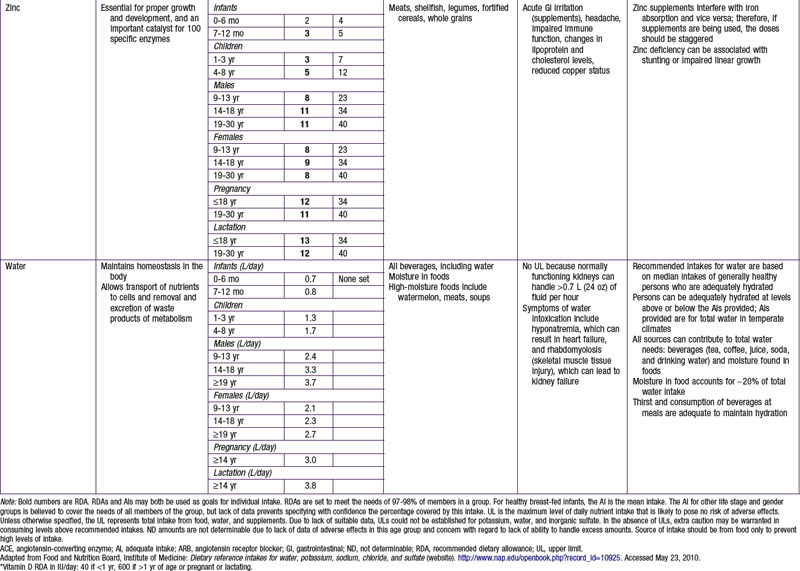
Breast milk provides optimal intake of most nutrients including iron and zinc, which, while present in lower amounts than in infant formula, are more bioavailable and sufficient to meet infant needs until 4-6 mo of age. After 4-6 mo of age, iron and zinc are required from complementary foods, fortified foods, or supplements. Iron present in animal protein is more bioavailable than that found in vegetables and other foods, because it is already incorporated into heme moieties in blood and muscle. Deficiencies in iron and zinc are among the most common and serious and can be associated with anemia, as well as neurocognitive and growth deficits. Iron requirements are higher during infancy and childhood as compared to later life stages and are higher for menstruating females as compared to males of similar age groups. Zinc deficiency is also associated with increased risk for impaired linear growth (stunting), impaired immune functioning, and increased risk for respiratory and diarrheal diseases, and it is associated with significant childhood morbidity and mortality risk globally.

Breast milk is a poor source of vitamin D, and vitamin D insufficiency is more common and prevalent than previously thought in infants and children. Vitamin D is central to calcium and bone metabolism, and although rickets is not very common in the USA, vitamin D status is an important determinant of various health outcomes and is a prodifferentiation and antiproliferative hormone. The DRI for vitamin D was set based on its effects on calcium status and bone health. Another approach to assessing vitamin D status has been in relationship to clinical outcomes, as opposed to comparisons to status in the general population.

Vitamin D is present naturally in some foods and is fortified in others, with sunlight as an important nondietary source. Sunlight exposure varies by season, and for populations residing in northern latitudes and/or who have darker skin, sunlight exposure is unlikely to meet the vitamin D needs over the year; in these groups, additional sunlight exposure and/or vitamin D supplementation may be required to achieve optimal status.

Unlike vitamin D obtained by means of ingested supplements, there is no potential toxicity reported for vitamin D obtained via sunlight. Sunlight exposure sufficient to provide optimal vitamin D synthesis may be difficult to achieve because of the caution exercised with respect to duration of sunlight exposure given the increased risk of skin cancer induced by sunlight-related UV radiation exposure. Precise sunlight exposure requirements to achieve desirable vitamin D levels while considering skin pigmentation, season, latitude, and time of day as well as skin cancer prevention are therefore difficult to define.

The goal is to achieve serum levels of 25(OH)D levels above 50 nmol/L (20 ng/dL), often using supplementation with vitamin D, but measurement of these levels is not recommended routinely. The American Academy of Pediatrics recommends daily supplementation with 400 IU of vitamin D per day in all children who are ingesting <1000 mL/day of vitamin D–fortified milk. It is important for families to know that in the USA most reduced-fat milks are also vitamin D fortified and that optimal vitamin D intake can be achieved without using whole-fat milk.

The main storage organs for calcium are the bones and teeth. Calcium adequacy is determined in part as a function of bone health as measured by bone mineral content and density, and an AI has been set for calcium intake based on these data. Bone mineral accretion is key in the pediatric age range, with peak bone mass being achieved by the 2nd to 3rd decade of life. Vitamin K status is also an important determinant of bone health and plays a number of additional roles, such as an important cofactor in coagulation factors. Status can be assessed by prothrombin time. Protein in the absence of vitamin K (PIVKA II) and the vitamin K–dependent factors can also be useful in determining adequacy, and an AI is set for vitamin K. Neonates are at increased risk for suboptimal vitamin K status, leading to an increased risk for hemorrhagic disease. Therefore, vitamin K prophylaxis is recommended for all newborn infants.

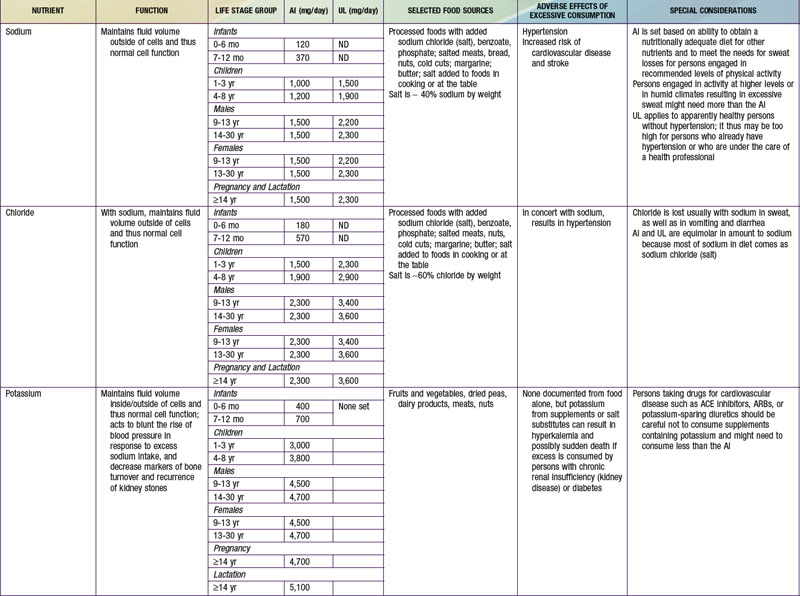
Potassium and sodium are the main intra- and extracellular cations, respectively, and involved in transport of fluids and nutrients across the cellular membrane. There is an AI set for potassium related to its effects in maintaining lower blood pressure, to reduce risk for nephrolithiasis, and to support bone health. Moderate potassium deficiency can occur even in the absence of hypokalemia and can result in increased blood pressure, stroke, and other cardiovascular disease. Most American children have potassium intake below the current recommendations. African-Americans in particular are at increased risk for potassium deficiency. For persons at increased risk for hypertension and who are salt sensitive, reducing sodium intake and increasing potassium intake is advised. Leafy green vegetables, vine fruit (such as tomatoes) and root vegetables are good food sources of potassium (see Table 41-7). Conversely, persons with impaired renal function might need to reduce their potassium intake; hyperkalemia can increase risk for fatal cardiac arrhythmias among these patients.

Sodium has an AI, but given the adverse effects on blood pressure (hypertension) and cardiovascular health, a UL has also been set. The UL threshold may be even lower in African-Americans, who, on average, are more salt sensitive, and for those with hypertension or pre-existing renal disease. Dietary sodium intake also displaces potassium intake. Elevated sodium : potassium ratios can increase the risk for nephrolithiasis. Intakes of <2,300 mg (approximately 1 tsp) per day have been recommended; currently, average daily salt intake for most persons in the USA and Canada exceeds both the AI and UL. For populations with or at risk for hypertension and renal disease, sodium intake should be decreased to <1,500 mg/day and potassium intake increased to >4,700 mg/day. For persons with hypertension, additional dietary guidelines are available and can be achieved using the Dietary Approaches to Stop Hypertension (DASH) eating plan. The major source of salt intake in the USA is in the form of salt added to many processed foods and condiments as a food preservative and to enhance palatability, including bread, a major source of sodium intake.

Water

The water requirement and content as a proportion of body weight are highest in infants and decrease with age. Water intake is achieved with liquid and food intake, and losses include excretion in the urine and stool as well as insensible evaporative and vapor losses through the skin, respiratory tracts, and mucosal membranes. An AI has been established for water (see Table 41-7). Special considerations are required by life stages and by basal metabolic rate, physical activity, body proportions (surface area to volume), environment, and underlying medical conditions. Breast milk and infant formula provide adequate water, and additional water intake is not required until complementary foods are introduced. Although water contains no calories, the concern is that water intake might actually decrease breast milk intake and displace the intake of essential nutrients during this metabolically very active life stage. The high ratio of body surface area to volume in infancy, as well as the high respiratory rate, increases insensible water losses, which in part explain the increased fluid needs in infants and young children.

The consequences of inadequate fluid intake include dehydration, impaired thermoregulation and heat dissipation, reduced activity tolerance and performance, and reduced intravascular fluid. These deficits can result in an increased compensatory heart rate, hypotension and syncope, and, if uncorrected, renal injury or nephrolithiasis. Excess free water intake is usually better tolerated by healthy adults than by younger children, who may be at increased risk for water intoxication. Hyponatremia can result from excess free water intake coupled with inadequate sodium intake. Fluid intake requirements and restrictions are also influenced by underlying renal and hormonal disorders, including diabetes, the syndrome of inappropriate antidiuretic hormone secretion (SIADH), and diabetes insipidus.

Bibliography

Bhargava A, Amialchuk A. Added sugars displaced the use of vital nutrients in the National Food Stamp Program Survey. J Nutr. 2007;137:453-460.

Bhutta ZA. Childhood iron and zinc deficiency in resource poor conuntries. BMJ. 2007;334:104-105.

Bibbins-Dormingo K, Chertow GM, Coxson PG, et al. Projected effect of dietary salt reductions on future cardiovascular disease. N Engl J Med. 2010;362:590-598.

Devaney B, Ziegler P, Pac S, et al. Nutrient intakes of infants and toddlers. J Am Diet Assoc. 2004;104:s14-s21.

Fischer Walker CL, Ezzati M, Black RE. Global and regional child mortality and burden of disease attributable to zinc deficiency. Eur J Clin Nutr. 2009;63:591-597.

Gidding SS, Dennison BA, Birch LL, et al. American Heart Association: Dietary recommendations for children and adolescents: a guide for practitioners. Pediatrics. 2006;117:544-559.

Havas S, Roccella EJ, Lenfant C. Reducing the public health burden from elevated blood pressure levels in the United States by lowering intake of dietary sodium. Am J Public Health. 2004;94:19-22.

Holick MF, Chen TC. Vitamin D deficiency: a worldwide problem with health consequences. Am J Clin Nutr. 2008;87:1080S-1086S.

Kleinman RE, editor. Pediatric nutrition handbook, ed 6, Elk Grove Village, IL: American Academy of Pediatrics, 2009.

Lazzerini M. Effect of zinc supplementation on child morality. Lancet. 2007;370:1194-1195.

Ludwig DS. The glycemic index: physiological mechanisms relating to obesity, diabetes, and cardiovascular disease. JAMA. 2002;287:2414-2423.

Maqbool A. Colon: structure and function. In: Caballero B, Allen L, Prentice A, editors. Encyclopedia of human nutrition. ed 2. London: Elsevier; 2006:449-460.

Maqbool A, Shingara IO, Stallings VA. Clinical assessment of nutritional status. In: Walker WA, Watkins JB, Duggan C, editors. Nutrition in pediatrics. ed 4. Hamilton, Ontario: BC Decker; 2008:5-13.

National Center for Health Statistics. CDC growth charts (website). www.cdc.gov/GrowthCharts/. Accessed May 23, 2010

Institute of Medicine. Otten JJ, Hellwig JP, Meyers LD, editors. Dietary reference intakes: the essential guide to nutrient requirements. Washington, DC: National Academies Press, 2006.

Reeds PJ. Dispensable and indispensable amino acids for humans. J Nutr. 2000;130:1835S-1840S.

Rovner AJ, O’Brien KO. Hypovitaminosis D among healthy children in the United States: a review of the current evidence. Arch Pediatr Adolesc Med. 2008;162:513-519.

Saintonge S, Bang H, Gerber LM. Implications of a new definition of vitamin D deficiency in a multiracial US adolescent population: the National Health and Nutrition Examination Survey III. Pediatrics. 2009;123:797-803.

Schroeder DG, Martorell R, Rivera JA. Age differences in the impact of nutritional supplementation on growth. J Nutr. 1995;125(4 Suppl):1051S-1059S.

Simopoulos AP. Essential fatty acids in health and chronic disease. Am J Clin Nutr. 1999;70(3 Suppl):560S-569S.

Committee on Nutrition Standards for Foods in Schools, Food and Nutrition Board, Institute of Medicine. Stallings VA, Yaktine AL, editors. Nutrition standards for foods in schools. Washington, DC: National Academies Press, 2007.

Stoltzfus RJ. Iron deficiency: global prevalence and consequences. Food Nutr Bull. 2003;24(4 Suppl):S99-S103.

United Nations Children’s Fund. The state of the world’s children 2008 (website). www.unicef.org/sowc08/. Accessed July, 2010

United States Department of Agriculture. Dietary guidelines for Americans (website). www.healthierus.gov/dietaryguidelines. Accessed May 23, 2010

United States Department of Agriculture. MyPyramid (website). www.mypyramid.gov/. Accessed May 23, 2010

United States Food and Drug Administration. Claims that can be made for conventional foods and dietary supplements (website). www.fda.gov/Food/LabelingNutrition/LabelClaims/ucm111447.htm. Accessed July 1, 2010

Vos MB, Kimmons JE, Gillespie C, et al. Dietary fructose consumption among US children and adults: the Third National Health and Nutrition Examination Survey. Medscape J Med. 2008;10:160.

World Health Organization (WHO). WHO child growth standards (website). www.who.int/childgrowth/en/. Accessed May 23, 2010

World Health Organization. Diet, Nutrition and the Prevention of Chronic Diseases. WHO Technical Report Series # 916. Geneva: World Health Organization; 2003.