[level-membership-for-pathology-category]
CHAPTER 2 Normal bone marrow cells
Development and cytology
Hemopoietic cells
Embryonic hemopoiesis
Hemopoiesis commences from a transient population of primitive HSC generated in the yolk sac. This commences on the 14th to 19th day of embryogenesis and persists there until the end of the 12th week of gestation. The yolk sac primarily produces nucleated erythroid cells that are megaloblastic and contain embryonic hemoglobins, Gower I (ζ2ε2), Gower II (α2ε2) and Portland I (ζ2γ2) (Fig. 2.1). Yolk sac erythropoiesis is referred to as ‘primitive’. In the 6th and 7th weeks of gestation, the blood islands within the yolk sac also contain a few megakaryocytes. Hemopoietic activity then occurs in a region of the para-aortic splanchopleural mesoderm. This region contains the dorsal aorta, gonadal ridge and mesonephros and is known as the aorta-gonad-mesonephros or AGM region.1,2 Hemopoiesis in the AGM region develops from ‘definitive’ HSC that eventually populate the adult BM. Some adult-type HSC also develop in the yolk sac and the placenta.
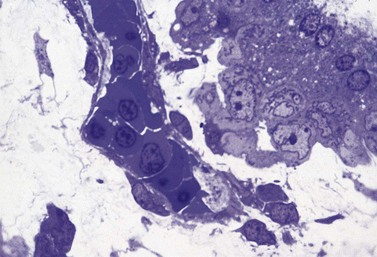
HSC derived from the AGM migrate to the liver and erythropoietic foci are detectable in the 6th week of gestation. The liver remains the main site of erythropoiesis from the 3rd to the 6th month when erythroblasts account for about 50% of the nucleated cells of the liver. The erythroblasts are mainly extravascular (Fig. 2.2), located near and within Kupffer cells (emperipolesis) and continue their maturation inside sinusoids.3 Erythroblasts are initially megaloblastic but subsequently become macronormoblastic. Fetal hepatic erythropoiesis is associated with the synthesis of fetal hemoglobin (HbF; α2γ2) and results in the production of nucleated, macrocytic red cells. The liver continues to produce red cells in decreasing numbers after the 6th month of gestation until the end of the 1st postnatal week.
General characteristics of hemopoiesis
The formation of blood cells of all types involves two processes:
Hemopoietic stem cells and progenitor cells
The uncommitted HSC has the capacity for self-renewal and is pluripotent, that is, it has the ability to differentiate into lineage-committed progenitors. It is not recognizable morphologically but can be identified by antigen expression profile. The differentiation of HSC generates multipotent myeloid progenitors and lymphoid progenitors (Fig. 2.3).4 Evidence for the presence of pluripotent HSC has come from a number of pieces of evidence including:
All pluripotent HSC express CD34 antigen and are usually AC133+, CD59+; Thy1low; CD38−; C-kit−/low; CD33−; lineage−. By flow cytometry (FCM) CD34+ HSC constitute most cells of the CD45dim/SSClow (blast) region and are a heterogeneous cell population. A small fraction of pluripotent HSC with long-term repopulating cell activity have been associated with the CD34+/CD38− phenotype.5,6 These cells are very rare in normal BM (usually <0.1%), but may increase in regenerating BM and in myelodysplastic syndromes.7,8 CD34+/CD45dim cells include a major fraction of progenitor cells that are already committed to specific hematopoietic lineages (erythroid, neutrophil, monocytic, dendritic cell (DC), basophil, mast cell (MC), eosinophil and megakaryocytic) and variable numbers of CD34+ B-cell precursors (BCP).9
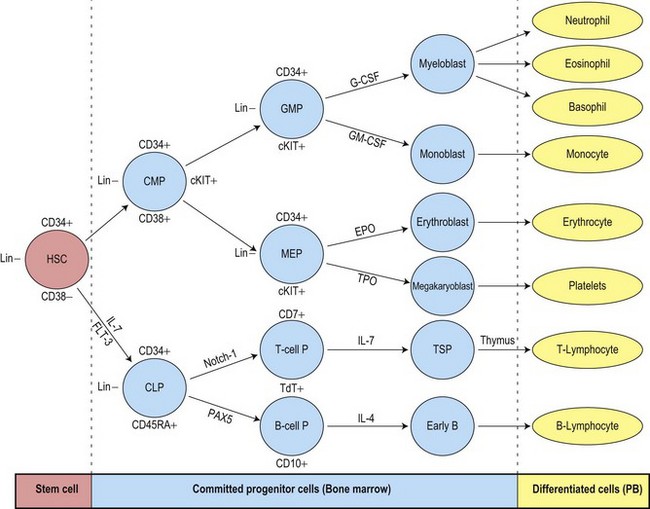
The multipotent (or pluripotent) HSC undergo gradual restriction in their hemopoietic potential as they eventually give rise to unipotent progenitor cells10,11 (Fig. 2.4). The progeny of HSC therefore become progressively restricted to one cell lineage and they lose the capacity to self-renew. The earliest branching between myeloid and lymphoid development is to committed progenitor cells of myeloid or lymphoid types, as follows:11,12
The complex mechanisms involved in the regulation of hemopoietic stem cells and progenitor cells are described in Chapter 4. Growth-promoting cytokines, such as granulocyte-macrophage colony stimulating factor (GM-CSF) and granulocyte colony stimulating factor (G-CSF), other cytokines and transcription factors are key regulators of hemopoiesis and may also enhance some functions of the mature cells.
Erythropoiesis
The CMP undergoes further differentiation to generate megakaryocyte-erythroid progenitors (MEP) or granulocyte-macrophage progenitors (GMP).4,13 The bipotent MEP has potential to form erythroid or megakaryocytic cells, both of which require GATA-1 (globin transcription factor 1) for their terminal differentiation. The most immature lineage-specific erythroid progenitor cells are the erythroid burst-forming units (BFU-E) and the most mature are the erythroid colony-forming units (CFU-E). The CFU-E develop into proerythroblasts, the earliest morphologically recognizable BM red cell precursors. Proerythroblasts progress through several morphologically defined cytologic classes. These are, in order of increasing maturity, the basophilic erythroblasts, early and late polychromatic erythroblasts and reticulocytes. Cell division occurs in the proerythroblasts, basophilic erythroblasts and early polychromatic erythroblasts but not in more mature cells. There are, on average, four cell divisions in the morphologically recognizable precursor pool so that one proerythroblast may give rise to 24 (16) red cells. In normal adults, the time taken for a proerythroblast to mature into BM reticulocytes and for reticulocytes to enter the circulation is about 7 days; of this, about 2.5 days is spent in the marrow reticulocyte pool. The time taken for blood reticulocytes to mature into erythrocytes is 1–2 days. In normal individuals erythrocytes circulate for approximately 120 days before they are removed and broken down by the mononuclear phagocyte system.
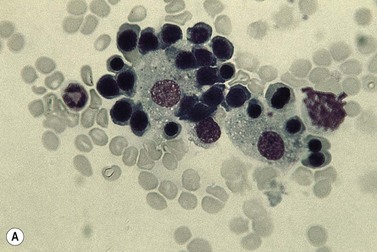
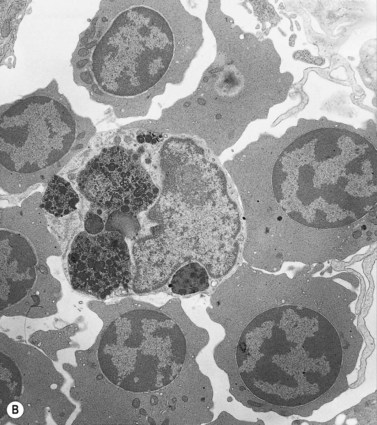
Within the BM, erythroblasts are present in erythroid islands composed of one or more central macrophages surrounded by one or two layers of erythroblasts (Fig. 2.5); fine processes of macrophage cytoplasm are found between the erythroid progenitors. Surface receptors on the macrophages are involved in macrophage–erythroblast interactions. One such receptor, erythroblast macrophage protein (Emp), mediates attachment of erythroid cells to macrophages in the erythroid island. Emp is required for normal erythroid differentiation and nuclear extrusion.14 A receptor on erythroblasts, intercellular adhesion molecule-4, binds to alpha (V) integrins on macrophages and is important for the formation of erythroblastic islands.15 Interactions between the macrophage and erythroblasts may modulate erythropoiesis by affecting gene expression and apoptosis and are required for iron delivery for the production of hemoglobin.16,17
Regulation of erythropoiesis
A key factor determining the rate of red cell production is the glycoprotein hormone erythropoietin (EPO) which, in the adult, is produced mainly by the peritubular cells of the kidney. EPO receptors are expressed on erythroid progenitor cells and the binding of EPO to its receptor results in the activation of JAK2 tyrosine kinase, which causes tyrosine phosphorylation in a number of proteins and triggers the activation of several signal transduction pathways involved in proliferation and in the prevention of apoptosis.18 An important effect of EPO is, therefore, to maintain the viability and proliferation of erythroid progenitor cells, by preventing apoptosis. In synergy with stem cell factor (SCF), GM-CSF, interleukin (IL)-3 and insulin-like growth factor-1 (IGF-1), EPO stimulates the rate of differentiation of CFU-E to pronormoblasts. EPO also stimulates terminal differentiation and decreases the time taken for the maturation of a pronormoblast to a marrow reticulocyte and its release into the circulation. The plasma level of EPO is inversely related to the capacity of the blood to deliver oxygen to the kidneys and other tissues. Reduction of the oxygen supply to the kidney results in enhanced EPO gene expression via a hypoxia-regulated transcription factor, HIF (hypoxia-inducible factor).19 Thus, in most anemic states there is an EPO increased level in the plasma, which in turn causes an enhancement of the rate of erythropoiesis.
Erythropoiesis is also influenced by the secretions of various endocrine glands. For example, hypofunction of the thyroid, testes, adrenal glands or anterior lobe of the pituitary gland result in mild to moderate anemia. Erythropoiesis is stimulated by thyroxine (stimulates terminal differentiation of erythroid progenitor cells), androgens (proliferation and expansion of erythroid progenitors) and growth hormone partly by an effect on the kidneys resulting in increased EPO production.20 Corticosteriods enhance erythropoiesis by stimulating EPO production and by a direct effect on progenitor cells. There is some evidence that estrogens may inhibit erythropoiesis;21 the sex difference in the hemoglobin levels of adults appears to be largely due to the higher androgen levels in males.
Light microscope cytology
The term erythroblast is used to define erythroid progenitors. When these appear normal the term normoblast is applied. In Romanowsky-stained normal BM smears morphologically identifiable erythroid cells have the following features (Figs 2.5 and 2.6):
Antigen expression
Early erythroblasts have weak CD45 expression, are CD44 (strong), CD71, CD36, HLA-DR and CD117 positive. Glycophorin A (CD235a) is expressed at a low level at this stage. Maturation to the basophilic erythroblast is accompanied by a decrease in CD44, CD45 and acquisition of CD235a antigen. Transition to polychromatic erythroblast shows a further loss of CD45, HLA-DR and CD44, a mild decrease in CD36 expression and presence of hemoglobin.22,23
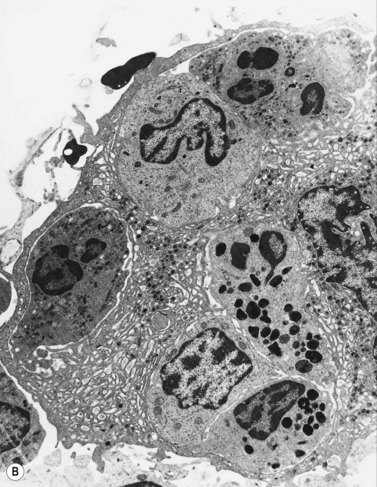
Ultrastructure
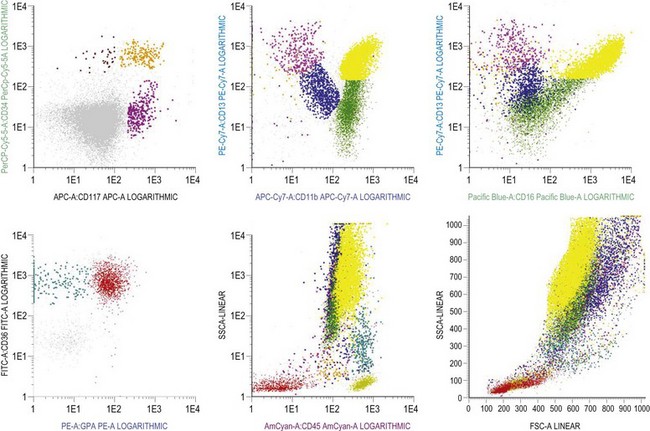
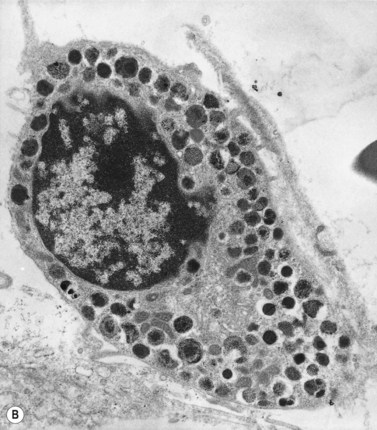
Electron microscope studies show that all erythroblasts contain characteristic surface invaginations which develop into small intracytoplasmic vesicles (rhopheocytotic vesicles) (Fig. 2.5B). Morphological changes can be seen with maturation from pronormoblasts to mature late polychromatic normoblasts. The major changes are an increase in the amount of heterochromatin, decrease in the number of ribosomes, increase in the electron-density of the cytoplasm due to the accumulation of hemoglobin, a decrease in the number and size of mitochondria and aggregation of ferritin molecules into siderosomes. A Golgi apparatus persists in polychromatic normoblasts.
Megakaryopoiesis
Megakaryopoiesis is the process of development of megakaryocytes and platelets within the marrow. Humans generate 1011 platelets per day, and production can be increased 20-fold when in demand.24 Megakaryocytes are derived following a cascade of differentiation from the megakaryocyte-erythroid progenitor (MEP). The bipotent MEP commits to megakaryopoiesis under the influence of thrombopoietin (TPO), the primary regulator of platelet production, IL-6 and IL-11 to generate megakaryocyte colony-forming units (CFU-MK). CFU-MK are a diploid cell population, in which DNA synthesis and nuclear division (karyokinesis) is followed by cell division (cytokinesis). CFU-MK undergo further maturation to megakaryoblasts, the earliest morphologically recognizable member of the megakaryocyte series.
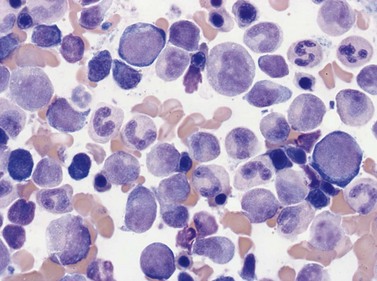
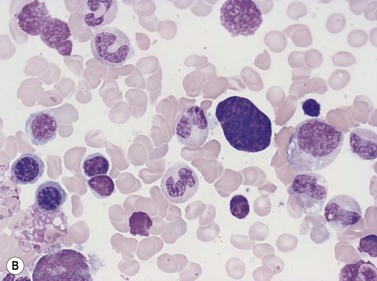
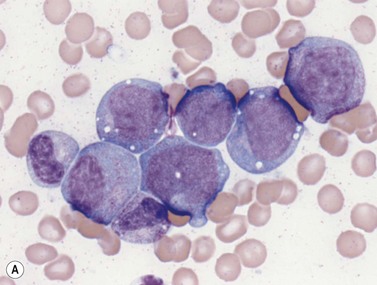
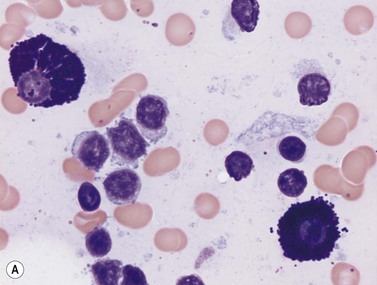
Four types of megakaryocytic cells can be identified in Romanowsky-stained BM smears. These are, in increasing order of maturity (Fig. 2.7):
Light microscope cytology
Early megakaryoblasts are difficult to distinguish from BM myeloblasts (see later) but do have a distinct ultrastructural appearance and phenotype. Megakaryoblasts (20–30 µm diameter) have a single large oval, kidney-shaped or lobed nucleus with several nucleoli, a very high nucleus to cytoplasm ratio and deeply basophilic agranular cytoplasm. Promegakaryocytes are usually larger than megakaryoblasts and have a lower nucleus to cytoplasm ratio and less basophilic cytoplasm. They have overlapping nuclear lobes and the cytoplasm may contain azurophilic cytoplasmic granules. The granular megakaryocytes (Fig. 2.7) are up to 70 µm in diameter and possess abundant pale-staining cytoplasm and numerous azurophilic cytoplasmic granules. The nucleus has coarsely granular chromatin and multiple lobes which extend through much of the cell. Prior to the formation of platelets by the fragmentation of cytoplasmic processes, the nuclear lobes become fairly tightly packed together. Following completion of platelet formation, a ‘bare’ nucleus remains (Fig. 2.7B).
Ultrastructure
Extensive studies have been performed of megakaryocytes throughout differentiation; the reader is referred to the previous edition of this book and other references for details of the ultrastructural features.25,26 Ultrastructural cytochemical studies have demonstrated platelet peroxidase (PPO), distinct from myeloperoxidase (MPO), in the endoplasmic reticulum and perinuclear space of promegakaryoblasts, megakaryoblasts and megakaryocytes. PPO is also present in the dense bodies and dense tubular system of platelets.
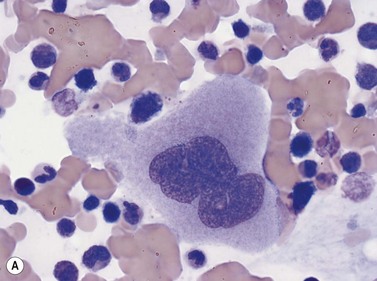
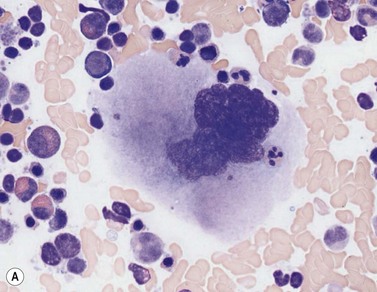
Emperipolesis
Emperipolesis describes the presence and movement of one cell within the cytoplasm of another; the ‘engulfed’ cell can subsequently leave the ‘engulfing’ cell and appears morphologically unaltered by the interaction.27 Emperipolesis is most commonly seen within megakaryocytes and sometimes one megakaryocyte may contain several cells ‘inside’ it (Fig. 2.8). The engulfed cells may be neutrophils, eosinophils and their precursors, lymphocytes, erythroblasts or red cells. Megakaryocytic emperipolesis is of uncertain significance but may represent a transmegakaryocytic route for the entry of blood cells into the circulation; it has been suggested that some of the intramegakaryocytic cells may enter the circulation via the processes of megakaryocytic cytoplasm which protrude into adjacent marrow sinusoids. Emperipolesis has also been described in non-hemopoietic cells and malignant cells, including blast cells in the blast phase of chronic myelogenous leukemia.
Granulopoiesis and monocytopoiesis
Granulopoesis is the production of granulocytic cells (neutrophils, eosinophils and basophils, and cells of the monocyte–macrophage series) within the BM. Granulopoiesis commences with the differentiation of the HSC to the common myeloid progenitor (CMP). The CMP further develops into the bipotent granulocyte-macrophage progenitor (GMP). The GMP differentiates into cells that are irreversibly committed to mature into granulocytic cells (CFU-G) or macrophages (CFU-M). The granulocytic cells, including neutrophils, eosinophils and basophils, are all characterized by the presence of cytoplasmic granules (Table 2.1).
Table 2.1 The major granule proteins present in neutrophils, eosinophils, basophils and mast cells
| Cell type | Primary granules | Specific granules |
|---|---|---|
| Neutrophil granulocytes | Myeloperoxidase Acid phosphatase Lysozyme Neutrophil elastase Defensins Bactericidal permeability-increasing protein Cathepsins α1 antitrypsin Heparin-binding protein Sulphated mucosubstances Aryl sulphatase α-mannosidase |
Eosinophil cationic protein
Eosinophil major basic protein
Aryl sulphatase
Eosinophil cationic protein
Eosinophil major basic protein
Eosinophil-derived neurotoxin
Histaminase
Aryl sulphatase
Gelatinase
Histamine
Chondroitin sulphates
Heparin
Neutral proteases
Chymase
Cathepsin G
Mast cell carboxypeptidase A
Heparin
Chondroitin sulphates
Histamine
5-hydroxytryptamine (serotonin)
Granzymes
Neurolysin
Neutrophil granulopoiesis
The formation of neutrophil granulocytes from the GMP is stimulated by G-CSF, GM-CSF and IL-3 and is also influenced M-CSF, SCF and IL-6. The transcription factor, lymphoid enhancer-binding factor 1 (LEF-1), also plays an important role in regulating proliferation, lineage commitment and differentiation during granulocytopoiesis.28 In granulopoiesis the earliest morphologically recognizable cell is the myeloblast. The myeloblast undergoes sequential differentiation to the promyelocyte, myelocyte, metamyelocyte, ‘band’ form (also known as ‘stab’ form or juvenile neutrophil) and finally mature segmented neutrophil granulocytes. Cell division occurs up to and including the myelocyte stage whereas cell differentiation occurs in both the proliferating and non-proliferating cells. It takes 10–12 days for a myeloblast to differentiate into a mature neutrophil granulocyte, and for the latter to enter the circulation; about half of this time is spent in the proliferating cell pool. In healthy individuals the blood neutrophils leave the circulation with an average T1/2 of 7.2 hours.
Light microscope cytology
In Romanowsky-stained BM smears, myeloblasts are round cells with a diameter of 10–20 µm, have a large rounded or oval nucleus with immature nuclear chromatin, two or more nucleoli and a relatively small quantity of agranular, moderately basophilic cytoplasm (Fig. 2.9A). The neutrophil promyelocyte is slightly larger and has an eccentrically located ovoid nucleus with coarser nuclear chromatin and prominent nucleoli. The cytoplasm retains some basophilia and contains a few to several azurophilic granules (primary granules) (Fig. 2.9B). The primary granules first formed at the promyelocyte stage remain in the more mature cells, including granulocytes, but lose their azurophilic property and are therefore not seen by light microscopy in metamyelocytes and more mature cells. The neutrophil myelocyte is smaller than the promyelocyte and has a greater volume of predominantly acidophilic cytoplasm. It contains many fine neutrophilic granules (specific granules) in addition to the primary azurophilic granules (see Table 2.1). The nucleus is rounded, oval, flattened on one side or slightly indented (Fig. 2.9C), has coarsely granular chromatin and usually lacks a nucleolus. Neutrophil metamyelocytes are smaller than myelocytes and have a C-shaped nucleus with greater nuclear chromatin condensation than the myelocyte nucleus. The cytoplasm is acidophilic and contains numerous neutrophilic granules but few or no azurophilic granules. The ‘band’ form has a U-shaped or long, relatively narrow, band-like nucleus, which shows no further chromatin condensation. The nucleus may be twisted and may show one or more partial constrictions along its length (see Fig. 2.9C). The neutrophil granulocyte differs from the ‘band’ neutrophil in being slightly smaller and having a segmented nucleus in which there are 2–5 nuclear masses with condensed chromatin joined by fine stands of chromatin.
Antigen expression
Multipotent myeloid stem cells are CD34+, CD38+ and CD33+. Several antigens change their expression intensity during granulopoiesis, especially CD13, CD11b, and CD16. The sequence of antigen expression during neutrophil differentiation is summarized in Table 2.2 and FCM findings illustrated in Fig. 2.10.5,6,29,30 CD13 is expressed at high levels on CD34+ stem cells and CD117+ precursors (promyelocytes). CD13 is then down-regulated and is expressed more weakly on intermediate precursors (myelocytes); it is gradually up-regulated as granulocytic cells differentiate into segmented neutrophils. CD11b and CD16 are initially expressed at low levels in granulocyte progenitors (myeloblasts), but expression increases during maturation.
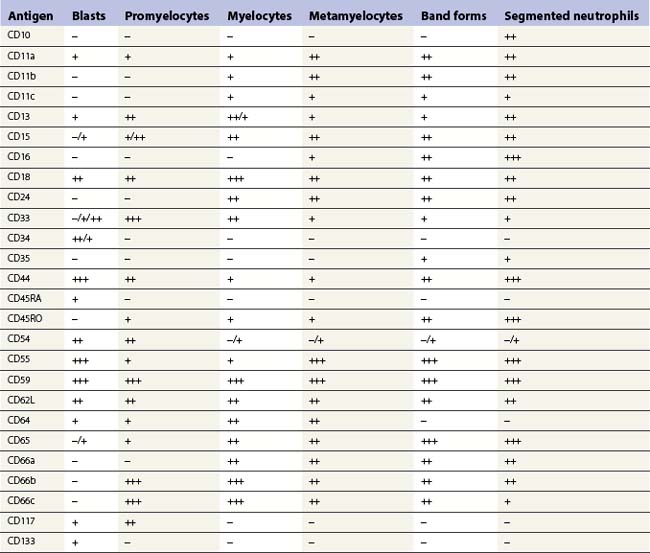
The expression of CD33 is particularly useful if followed together with that of HLA-DR during granulocytic maturation. CD34+ cells are HLA-DR positive and become weakly positive for CD33. With maturation there is loss of the CD34 antigen and CD33 expression is up-regulated; this is followed by down-regulation of HLA-DR and slight down-regulation of CD33 in most mature granulocytes.31 CD15 and CD65 antigens are only expressed when cells are restricted to neutrophil differentiation. CD66, CD16 and CD10 are the markers of band forms and segmented neutrophil granulocytes.30 MPO is present in myeloblasts through granulocytic differentiation to mature neutrophils and elastase from promyelocytes onwards. Lactoferrin is present in myelocytes, metamyelocytes and granulocytes.
Granule composition and ultrastructure
Neutrophil granulocytic cells contain primary and secondary granules, which appear at different stages of their differentiation. About 300 individual granule proteins are synthesized and stored in these granules at different times during granulocytopoiesis and these have important roles in neutrophil function.32 There are three main types of granules (see Table 2.1):
The granules contain antimicrobial and cytotoxic substances including MPO, defensins, lactoferrin and serine proteases. The neutrophil granules secrete these products for hydrolytic substrate degradation, microbial killing and to mediate a number of physiological processes, including inflammation.34 Neutrophil granulocytes also contain small membrane-bound vesicles with alkaline phosphatase activity, called phosphosomes. The granule structure and other ultrastructural features of granulocytic progenitors have been well studied by electron microscopy (Fig. 2.11).
Eosinophil granulopoiesis
Light microscope cytology
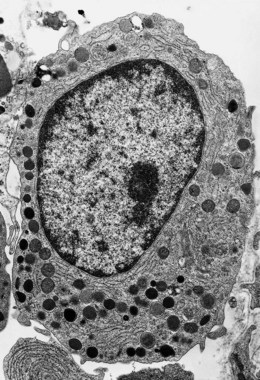
In Romanowsky-stained smears, eosinophil promyelocytes resemble a neutrophil promyelocyte except that they contain coarse granules, some of which are reddish-orange (eosinophilic) and others basophilic. Other maturing eosinophil progenitors (eosinophil myelocytes, metamyelocytes and band forms) resemble their neutrophil counterpart except that they have many typical eosinophil granules in the cytoplasm (Fig. 2.12A). The mature eosinophil granulocyte (described in Chapter 1) has a bisegmented nucleus and the cytoplasm is filled with eosinophil granules.
Antigen expression
Eosinophilic myelocytes express CD45 at a level slightly higher than that of neutrophilic myelocytes. By FCM they have low to intermediate intensity of CD11b, intermediate CD13, and low CD33 with bright CD66b without CD16. Mature eosinophils show increased levels of CD45 and CD11b with a decrease in CD33 and, in contrast to neutrophils, are negative for CD16 antigen.23,35
Eosinophil granules and ultrastructure
Eosinophils produce and store many granule proteins in primary and secondary granules. Primary granules are large, homogeneous and electron-dense on EM; secondary granules are derived from the maturation of primary granules, contain a crystalloid inclusion that is composed largely of polymerized major basic protein. Eosinophil promyelocytes contain several primary granules (larger and more rounded than those of neutrophil promyelocytes) and an occasional secondary granule. Eosinophil myelocytes contain several granules of both types (Fig. 2.12B); secondary granules predominate in eosinophil metamyelocytes and mature eosinophils. Eosinophil granules contain a number of proteins including eosinophil cationic protein, eosinophil peroxidase, eosinophil-derived neurotoxin, an arginine- and zinc-rich major basic protein, histaminase and aryl sulphatase (Table 2.1). Eosinophil peroxidase is biochemically and immunochemically distinct from the MPO present in granules of the neutrophil granulocyte series.36
Basophil granulopoiesis
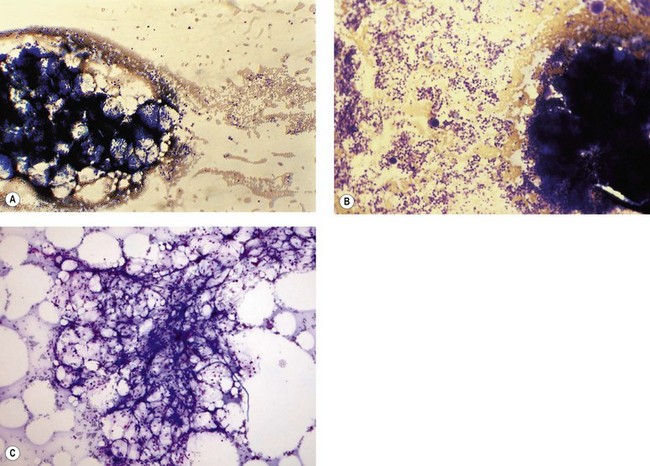
The basophil granulocyte is derived from the CMP via a committed progenitor cell, the basophil colony-forming unit (CFU-Baso), a progenitor cell that may be closely related to the mast cell progenitor.37 IL-3, GM-CSF, IL-5 and nerve growth factor (NGF) all stimulate basophil differentiation.38 The morphologically recognizable precursors of basophil granulocytes are basophil promyelocytes and myelocytes, which are round cells with a round or oval nucleus, and basophil metamyelocytes, which have C-shaped, unsegmented nuclei. Characteristically, in Romanowsky-stained smears these cell types all have large round deeply basophilic (blue–black) cytoplasmic granules that often overlie and obscure the nucleus. The mature basophil granulocyte is extensively granulated and the granules overlie and obscure the segmented nucleus (Table 2.1). Basophil granules are water-soluble and so their contents may be extracted during fixation and staining. Basophils are the least common granulocyte subset (0.5% of total blood leukocytes and about 0.3% of nucleated BM cells in healthy individuals).
With basic dyes such as toluidine blue or methylene blue, the more mature basophil granules stain metachromatically (i.e. reddish-violet). Basophil granules are PAS-negative (with PAS-positive deposits between the granules), Sudan black- and MPO-positive (most strongly in promyelocytes and myelocytes), acid-phosphatase-positive and essentially alpha-naphthol AS-D chloroacetate-esterase-negative (Table 2.2). By FCM, basophils express the following antigens: CD9, CD13, CD22 (weaker than B lymphocytes), CD25 (dim), CD33, CD36 (may be due to adherent platelets), CD38 (bright), CD45 (dimmer than lymphocytes; brighter than myeloblasts), and CD123 (bright). They are negative for CD3, CD4, CD19, CD34, CD64, CD117, and HLA-DR. In some individuals basophils are CD11b-positive.39
Monocytopoiesis: the mononuclear phagocyte system
Monocytopoiesis is the process by which peripheral blood monocytes and tissue macrophages are produced. The monocyte–macrophage lineage is derived from the GMP, the common progenitor for granulocytes and monocytes. Under the influence of GM-CSF, M-CSF and IL-3, and up-regulation of a basic leucine zipper (bZIP) transcription factor, MafB, the GMP commits to the monocyte maturation pathway.40 The morphologically recognizable precursors of the monocyte series are, in order of increasing maturity, monoblasts, promonocytes and BM monocytes; only the first two of these cell types undergoes division. The blood monocytes leave the circulation after 20–40 hours and transform into tissue macrophages. These are present in the BM, as well as other tissues, where they have a role in erythropoiesis and phagocytosis of cell debris (see below). In the normal steady state there is a constant loss of tissue macrophages (e.g. by shedding of alveolar macrophages), balanced by the formation of new macrophages from blood monocytes and to a small extent from the division of some existing macrophages. The system of cells concerned with macrophage production is called the mononuclear phagocyte system.
Antigen expression
CD14, CD36 and CD64 are considered as monocyte-associated markers, CD14, the lipopolysaccharide receptor, being the most specific. During maturation towards promonocytes, monoblasts down-regulate CD34 and CD117 and gain expression of CD64, CD33, HLA-DR, CD36 and CD15 antigens, with an initial mild decrease in CD13 and an increase in CD45 expression. Maturation toward mature monocytes leads to a progressive increase in CD14, CD11b, CD13, CD36 and CD45 expression, with a mild decrease in HLA-DR and CD15. Mature monocytes show expression of bright CD14, bright CD33, variably bright CD13, bright CD36, CD38 and CD64 and low CD15.9,23
Lymphopoiesis
The common lymphoid progenitor (CLP), the precursor of mature lymphocytes, arises from the differentiation of the HSC under the influence of IL-7 and FLT3.41–43 The common lymphoid progenitor cells exist in both fetal and postnatal hemopoietic tissues. These generate B-cell, T-cell and NK cell progenitors and give rise to all types of lymphocytes. Much of the lymphopoiesis that occurs in normal BM is independent of antigenic stimulation and serves to supply the body with mature B-lymphocytes or with T-lymphoid progenitors that mature into T-cells in the thymus. The newly-formed mature B- and T-cells enter the circulation and then migrate to peripheral lymphoid tissues (spleen, lymph nodes, Peyer’s patches, Waldeyer’s ring).
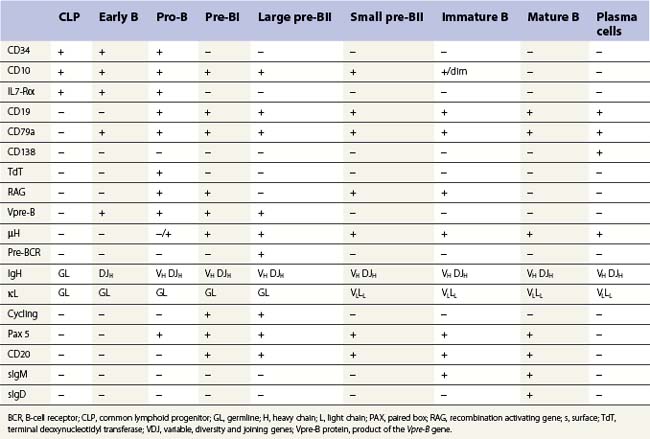
B-cell production commences in fetal life within the BM, fetal liver and omentum. Postnatally it is restricted to the BM where it is dependent on the interaction of the CLP and their progeny with marrow stromal cells. The main features of the development of a CLP cell into an antibody-secreting plasma cell are shown in Table 2.3; this development is characterized by the step-wise rearrangement of the V, D and J segments of the immunoglobulin (Ig) heavy and light chain gene loci and differential expression of the rearranged genes. The maturation of early B, pro-B, pre-B and immature B-cells is antigen-independent and occurs within the BM under the influence of PAX5 and IL-4. Mature B-cells that leave the marrow have both IgM and IgD on their surface. Newly formed B-cells that enter peripheral lymphoid tissues may undergo antigen-dependent proliferation within lymphoid tissue and further maturation into plasma cells. The activation of a mature B-cell results from the binding of surface antibody with unique antigen specificity (generated by immunoglobulin gene rearrangement) to the corresponding unprocessed antigen. B-cells may also be activated by processed antigen via a T-cell-dependent mechanism. Some B-cells undergo antigen-dependent development into plasma cells in the BM itself. Other antigen-activated B-cells develop into memory B-cells rather than plasma cells, allowing rapid antibody production in a secondary immune response.
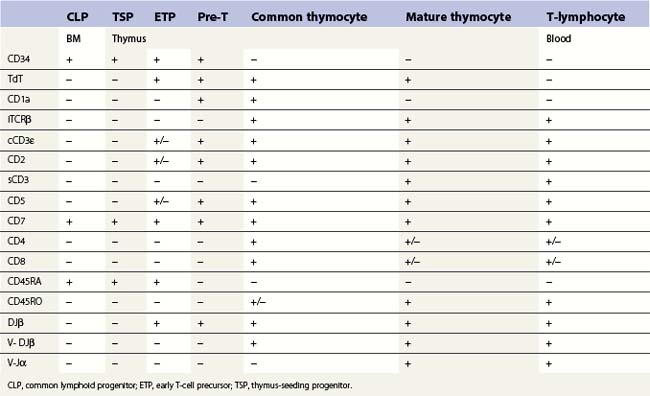
T-cell production occurs predominantly in the thymus and this requires a supply of early progenitors (thymus-seeding progenitor cells) from the BM. The development of T-lymphocytes is dependent on an interaction of the precursor cells with the surface molecules and secretory products of the epithelial elements of the thymus. The stages in the development of CLP into mature peripheral blood T-cells in the thymus is shown in Table 2.4. During T-lymphopoiesis in the thymus, the thymus-seeding progenitor (TSP) matures sequentially from early thymic progenitors, through transitional stages to mature T-lymphocytes. During the early stages of T-cell ontogeny rearrangement of the T-cell receptor (TCR) genes occurs in the sequence δ, γ, β and then α. The TCR (the antigen receptor on the surface of a T-cell) is a heterodimer consisting of one α- and one β-chain in about 95% of the mature thymocytes and mature T-cells and of one γ and one δ chain in the remainder. During thymic T-cell development the cell goes through a double-positive stage (common thymocyte) when both CD4 and CD8 antigens are expressed. The mature thymocytes and mature T-cells are either CD4+CD8− (T-helper cells) or CD4−CD8+ (cytotoxic T-cells).
The regulation of lymphopoiesis is complex, and involves cytokines, transcription factors and stromal cells; the same cytokine may affect development of different lineages. For B-cell lymphopoiesis stromal cell-derived IL-4 plays a key role as well as IL-5, IL-6, KL (kit ligand), FL (FLT3 ligand) and IL-11. Expression of the transcription factors EBF (early B-cell factor) and PAX5 commits the lymphoid progenitor cell to the B-lineage.44 IL-7 has a critical role for the T-lineage and is indispensible for T-cell development. Other key cytokines are stem cell factor, FL, IL-2, IL-3, IL-4, IL-12 and IL-10. Binding of ligands in intrathymic niches to Notch-1 receptor and the glycosyl transferase lunatic fringe (Lfng) on the progenitor surface commits progenitors to the T-cell lineage.45
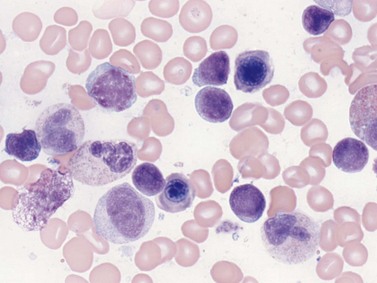
Light microscope cytology
Lymphoblasts are morphologically identifiable in marrow and are also known as hematogones, most of which are B-cell precursors. They are small to intermediate sized round mononuclear cells with a high nucleus-to-cytoplasm ratio, round or indented nuclei, homogeneous condensed chromatin, absent or inconspicuous nucleolus and minimal basophilic agranular cytoplasm (Fig. 2.13). They comprise up to 5% of cells in normal pediatric BM and up to 1% in adults. Mature marrow lymphocytes, in contrast, are smaller with a round nucleus, more coarsely clumped chromatin and no nucleolus. They have a moderately high nucleus-to-cytoplasm ratio and basophilic cytoplasm which is visible around the majority of the nucleus. Intermediate stages of lymphoid differentiation cannot be identified. The morphology of mature B- and T-lymphocytes do not differ. Large granular lymphocytes, which may be T-suppressor/cytotoxic or NK cells, are larger with an eccentrically located nucleus, more abundant cytoplasm and azurophilic granules. The distribution of lymphoid cells and plasma cells in the marrow is described in Chapter 3.
Antigen expression
The common lymphoid progenitor cell is CD34+, CD10+, CD45RA+, CD24− and does not express surface markers for T-, B- or NK cells. B- and T-cells then undergo an orderly sequence of antigen expression during differentiation (see Tables 2.3 and 2.4).
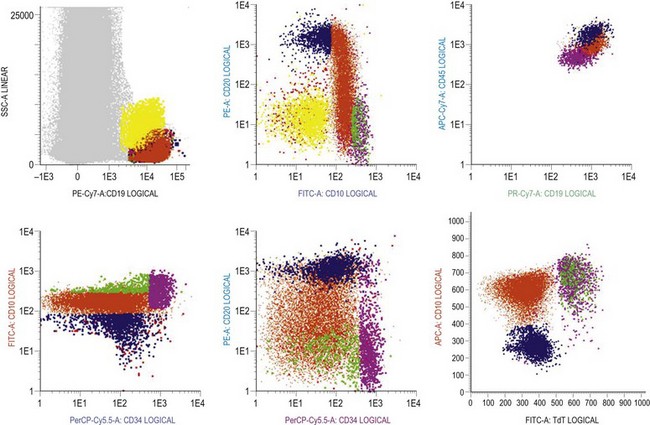
B-cells: there are characteristic patterns of antigen expression through B-cell differentiation in the normal human bone marrow (Table 2.3 and Fig. 2.14).9,46–49 The current concept is that progenitor B-cells undergo differentiation as follows:41
Rearrangements of the immunoglobulin (Ig) variable, diversity and joining (VDJ) heavy (H) chain loci are characteristic of pro-B-cells and require expression of the lymphocyte-specific recombination enzymes RAG1, RAG2 and TdT. Expression of the pre-B-cell receptor (BCR), composed of IgH chains and surrogate light (L) chains (VpreB and λ14.1), is a hallmark for the pre-B-cell population. Signaling through the pre-BCR promotes L chain (VJL) rearrangement and allelic exclusion at the IgH chain locus. Once VJ rearrangements are successful, L chains are expressed and combine with H chains as well as Igα/Igβ (CD79a, CD79b) to form a functional BCR expressed on IM-B cells.41 Pre-B and IM B-cells constitute the majority of B-cells in children, while mature B-cells are most frequent in adult BM.9,46 In children with BM regeneration after chemotherapy and transient hyperplasia of B-cell progenitors, subpopulations of IM and mature B-cells co-expressing CD5 have been identified.50 CD5+ B cells are the major population of B cells in fetal life, and their percentage decreases with age.51
T-cells: rare (<0.1%) T-cell restricted precursors, which express the pre-Tα protein on the cell surface and are CD34+ CD7+ CD45RA+, can be identified in human BM.41,52 Recently, it has been suggested that CD34+ CD10+ CD24− progenitors are present in both BM and thymus. These constitute a thymus-seeding population and may replace CD34+ CD7+ CD45RA+ cells in the postnatal period. However, the frequency of these cells in normal BM is lower than 1 × 10−4.47 No TdT positive T-cells expressing cytoplasmic CD3 are found in normal BM. Most mature T-cells in the marrow co-express CD2, CD5, CD7 and membrane CD3 antigens, are either CD4 or CD8 positive and express CD45 brightly. However, minor subsets of CD7+ cells lacking other ‘pan-T’ antigens, small subsets with co-expression of CD4 and CD8, and a subset lacking CD4 and CD8 have been reported.
Natural killer cells: there are two major subsets of NK cells: one expressing high levels of CD56 and low or no CD16 (CD56hi CD16−), and the second that is CD56+ CD16hi.53 CD56hi CD16± cells have relatively lower cytolytic activity and produce more cytokines than the CD56+ CD16hi cells, which are the cytotoxic effectors exerting their function through perforin and granzyme production. A putative committed NK cell precursor has been found within the CD34lo CD45RA+ α4β7hiCD7±CD10− BM population and gives rise to CD56hiCD16± NK cells in vitro. The immature NK cells developing from committed NK cell precursors are defined by the expression of CD161 (NKR-P1).54 These do not express CD56 or CD16 antigens. Immature NK cells can be induced to express these markers as well as the activating and inhibitory receptors, CD94- NKG2A and killer immunoglobulin receptors (KIR), upon culture with stromal cells and cytokines such as IL-15 or FLT3-L.41
Plasma cells
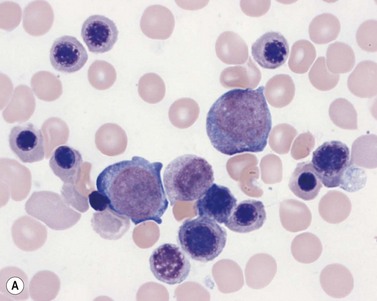
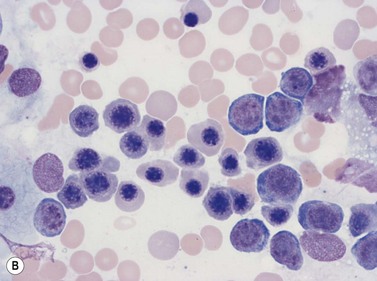
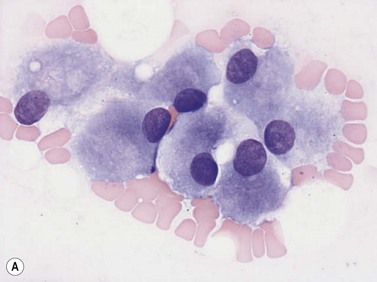
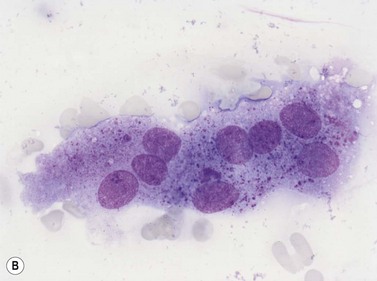
Plasma cells comprise less than 1% of cells in normal BM. The morphology of mature plasma cells in Romanowsky-stained smears varies markedly (Fig. 2.15). The majority are 14–20 µm in diameter and have deeply basophilic cytoplasm with a pale perinuclear zone corresponding to the site of the Golgi apparatus; the cytoplasm may have one or more vacuoles. The nucleus is eccentric and small relative to the volume of the cytoplasm and contains moderate amounts of condensed chromatin. A small proportion of normal plasma cells may show various additional cytologic features, such as:
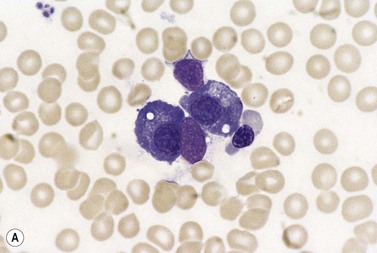
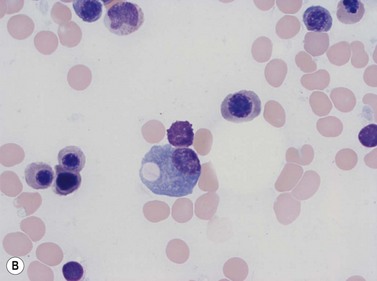
Fig. 2.15 (A, B) Plasma cell morphology. May–Grünwald–Giemsa stain. × 400. (A) Normal plasma cells. (B) Plasma cell showing a Russell body.
Normal plasma cells in the BM are CD19dim/ CD38++/ CD138+/++/ CD20−/ CD45−/ CD56−/ sIg−/ and express cytoplasmic immunoglobulin kappa or lambda.55 They are negative for CD45, HLA-DR, CD117 and CD20.
Bone marrow stromal cells
The differentiation and proliferation of HSC requires interactions with the BM environment, the majority of which is cellular. BM stromal cells include osteoblasts, endothelial cells, macrophages, non-phagocytic reticular cells (including myofibroblasts and sinusoidal adventitial cells) and mesenchymal stem cells. The stromal cells are important in the regulation of hemopoiesis through direct contact and soluble mediators, that is, adhesive ligands, synthesis of extracellular matrix and production of signaling molecules and cytokines. Two niches exist in the bone marrow for pluripotent hemopoietic stem cells, one associated with the endosteum (in which osteoblasts play a key role) and the other with the sinusoids.56
Bone marrow macrophages
Light microscope cytology, cytochemistry and antigen expression
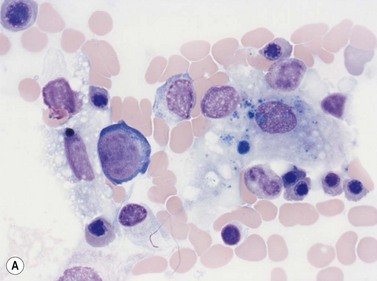
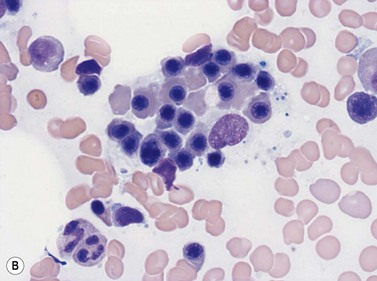
Macrophages are large (20–30 µm) irregularly shaped cells with a round or ovoid nucleus with lacy chromatin and may have a nucleolus (Fig. 2.16). They have abundant pale-staining cytoplasm with long cytoplasmic processes. The cytoplasm may be vacuolated and contain small azurophilic granules, vacuoles, lipid droplets and phagocytosed material, including extruded erythroblast nuclei and, occasionally, whole granulocytes. Phagocytosed degraded cells, extruded erythroid nuclei and other debris may be visible. Phagocytosed intact cells (hemophagocytosis) may also be seen. Macrophages are relatively fragile and their cytoplasm is frequently ruptured during the preparation of smears. The macrophages of iron-replete individuals contain blue granules when stained with Perls’ acid ferrocyanide. Macrophages are PAS-positive, strongly alpha-naphthyl acetate esterase- and acid phosphatase-positive, NADH dehydrogenase- and succinate dehydrogenase-positive and alpha-naphthol AS-D chloroacetate esterase-negative. Most are Sudan black- and alkaline phosphatase-negative. Macrophages express monocyte-associated cell surface antigens CD11b, CD14, CD64, CD68 and CD163 and are CD45 and HLA-DR-positive and their granules contain acid hydrolases and lysozyme.
Dendritic cells
Mast cells
Mast cells differentiate from multipotent hemopoietic cells in the BM and have a close developmental relationship with basophils.58,59 After initial differentiation in the BM the most mature mast cell progenitors enter the blood, circulate and migrate into tissues where they proliferate and mature into mast cells.60 Mature mast cells are present in normal BM at a very low frequency (<0.03%). Stem cell factor (SCF), also known as Kit ligand, is crucial for the development, proliferation and maturation of mast cells from progenitors. SCF and Kit signaling are necessary for stimulating the proliferation of committed mast cell progenitors and homing and recruitment mast cells to tissues. Other factors that influence mast cell development are TPO, IL-3, a number of other cytokines and inflammatory mediators such as prostaglandin E, TNFα, IL-6 and IFNγ.61–63
Mast cells have an abundance of electron-dense secretory granules. These contain large amounts of mast cell mediators which include histamine, serotonin, cytokines (especially tumor necrosis factor), proteoglycans, lysosomal enzymes, heparin and chondroitin sulphates and mast-cell-specific proteases (Table 2.1).64 Mast cells contain particularly large amounts of the serine proteases tryptase, chymase and carboxypeptidase A and these are stored in fully active form.65,66 After activation by antigen and IgE, mast cell granule contents are released in massive amounts by a process termed piecemeal degranulation. Stimulated mast cells also release products of arachidonic acid oxidation such as leukotriene C4 (LTC4) and prostaglandin D2 (PGD2) as well as the cytokines such as tumor necrosis factor α (TNFα) and IL-4. Tissue mast cells have a principal role in immediate-type hypersensitivity and allergic reactions where they respond to antigen and release mast cell mediators. Mast cells (and basophils) also participate in IgE-dependent host defense against parasites and accumulate at sites of resolving inflammation. They may modulate inflammatory responses by releasing heparin (which prevents further fibrin deposition) and proteases (which may inhibit coagulation and promote fibrinolysis).
Light microscope cytology
Mast cells can be distinguished from basophils by their generally larger size and the coarse, purplish-black to red-purple granules (Romanowsky stain) that pack the cytoplasm but seldom overlie the nucleus (Fig. 2.17). The nucleus of the mast cell is small, round or oval and the chromatin is less condensed than that of a basophil. The nucleus is centrally or, occasionally, eccentrically placed. Mast cells stain metachromatically with toluidine blue and are less strongly PAS-positive than basophils. Unlike basophil granulocytes, mast cells may undergo mitosis.
Antigen expression
Bone marrow mast cells have characteristically strong CD117 expression and high light scatter by FCM. They express CD9, CD11c, CD29, CD33, CD43, CD44, CD45, CD49d, CD49e, CD51, CD54 and CD71 antigens and FcεRI. Other antigens such as CD11b, CD13, CD18, CD22, CD35, CD40 and CD61 display a variable expression in normal individuals. They are negative for CD34, CD38 and CD138 antigens.67,68
Osteoblasts
Osteoblasts are derived from pluripotent mesenchymal stem cells. They may be seen in BM smears as single cells or small groups. They are ovoid or elongated, have a single small eccentric nucleus with small quantities of condensed chromatin and one to three nucleoli (Fig. 2.18A). They have abundant lightly basophilic cytoplasm with indistinct margins. Although they superficially resemble plasma cells, they are larger and their Golgi zone is not immediately adjacent to the nucleus. Furthermore, the nucleus of an osteoblast does not show the heavily-stained coarse clumps of condensed chromatin that are characteristic of plasma cells. Osteoblasts are alkaline-phosphatase-positive and express CD56. Osteoblasts in the endosteum of trabecular bone interact with HSC via adhesion and signaling molecules and maintain them in a quiescent state (i.e. osteoblasts regulate the bone-associated HSC niche).69,70 In addition, factors that regulate B-lymphopoiesis affect osteoblast and osteoclast formation and vice versa.71
Osteoclasts
Osteoclasts are derived from undifferentiated cells of the monocyte-macrophage lineage. Diffferentiation to terminally differentiated osteoclasts requires RANKL or osteoclast differentiation factor. Osteoclasts are giant multinucleate cells with abundant pale-staining cytoplasm containing many fine azurophilic granules (Fig. 2.18B). The individual nuclei within a single cell are small, round or oval, are uniform in size, and have a single prominent nucleolus. There is usually no overlap between adjacent nuclei within the same cell. Osteoclasts must be distinguished from megakaryocytes, the other polyploid giant cells in the marrow. Unlike multinucleated osteoclasts, normal megakaryocytes have a single large lobulated nucleus. Osteoclasts are strongly acid-phosphatase-positive.
Mesenchymal stem cells
Mesenchymal stem cells (MSC) comprise a population of non-hemopoietic stromal cells and are found in the BM. They are rare cells in the BM (<0.01%) and possess multilineage potential with the capacity to differentiate and contribute to the regeneration of mesenchymal tissues but not blood cells. MSC also exist in the AGM region of the embryo and can differentiate in vitro into chondrocytes, adipocytes and osteocytes.72 They express CD73, CD90 and CD105 antigens but not CD34, CD45 or HLA-DR. They are further characterized by their ability to adhere to tissue-culture plastic and capacity to generate osteoblasts, chondrocytes and adipocytes in vitro.73
Assessment of marrow hemopoietic activity
Morphological assessment
BM activity can be assessed subjectively by morphological analysis of hemopoietic cells in aspirated material or on sections of a biopsy specimen by light microscopy; the latter is discussed in Chapter 3. The cellularity of the BM can be assessed in the aspirate by examining several marrow fragments in stained smears (Fig. 2.19). Cellularity varies according to age and the site from which the specimen was taken. Marrow cellularity is at its greatest at birth (>80% cellularity) and reduces with aging; by age 10 years the cellularity will have reduced to approximately 70%, by 30 years 50% and by 70 years to 30%. Although it is not established that the number of HSC declines with age, qualitative changes may affect their self-renewal potential and hence BM cellularity. The overall BM cellularity is more accurately assessed in BM trephine biopsies or clot sections of aspirated marrow than smears, as discussed in Chapter 3.
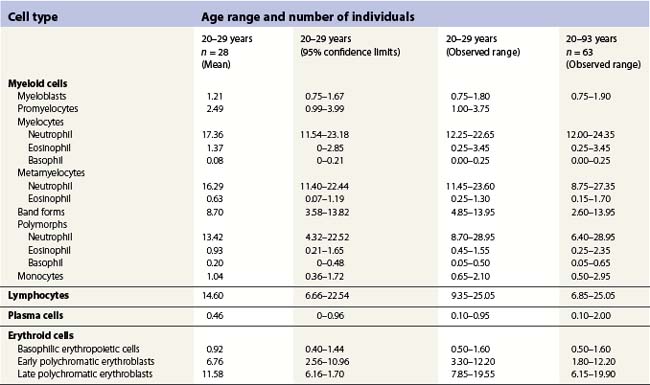
Hemopoietic activity is determined by assessing the individual hemopoietic cell lineages, as described above. A bone marrow nucleated differential cell count (NDC) is used to assess the proportions of the different hemopoietic cell lineages against known reference ranges, and to quantify any abnormal cells that may be present.74 The NDC should include the morphologically recognizable cells, that is, blast cells, promyelocytes, myelocytes, metamyelocytes, band forms, segmented neutrophil granulocytes, eosinophils, basophils, promonocytes and monocytes, lymphocytes, plasma cells and erythroblasts. It does not include megakaryocytes, macrophages, mast cells, osteoblasts, osteoclasts, stromal cells, smudged cells or non-hemopoietic cells such as metastatic tumor cells.
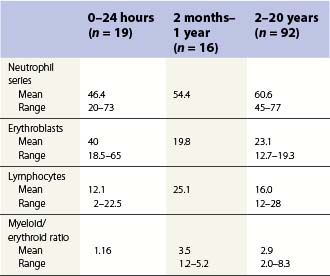
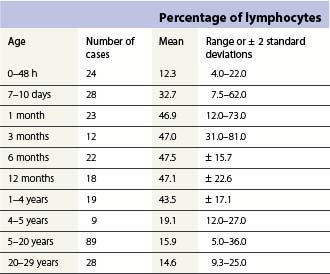
Changes occur in the cellular composition as well as the cellularity of the marrow during life (Tables 2.5–2.7). In the first 3 months of life there is a progressive fall in erythroid progenitors from 40% (range, 20–65%) on the first day to 10% (range, 0–20.5%) between days 8 and 10, and this remains low for about 3 weeks. It then gradually increases again to reach 15–20% in the 3-month-old infant. These changes appear to be secondary to an increase of arterial oxygen saturation to adult levels within 3 h of birth resulting in a suppression of erythropoietin production. Erythropoietin production increases again when the infant is 6–13 weeks old. The proportion of granulocytes and their precursors increases during the first 2 weeks after birth and decreases to stabilize at about 50% after the 2nd month (Table 2.5); a slight increase is seen after the age of 4 years. The proportion of lymphocytes is relatively low in the neonate, increases markedly during the first 7–10 days and remains high throughout the first year. Adult values are reached by the age of 4 years (Table 2.6). Plasma cells are rarely seen in the marrow at birth but increase progressively to reach adult values by the age of about 12 years.
Phenotypic assessment
Multiparameter flow cytometry (FC) is a highly reproducible and objective way of assessing hemopoietic cells of all lineages and their stage of differentiation based on antigen expression. Knowledge of levels and expression patterns of various antigens in normal hemopoietic cells at different stages of development provides a frame of reference for recognition of abnormal differentiation patterns in the assessment of hematologic malignancies. Antigenic profiles of normal hemopoietic cells have been described in preceding sections of this chapter; these data have been based on reports by several groups that have rigorously assessed differentiation stages of various hematopoietic cell lineages.9,31,46,47,75–77 Mapping of normal BM cell subpopulations can be achieved by gating cell populations on CD45 (leukocyte common antigen) expression and light side scatter (SSC) (Fig. 2.20).78,79 This approach can be used to assess hemopoietic activity as cells of the following types can all be identified and analyzed:
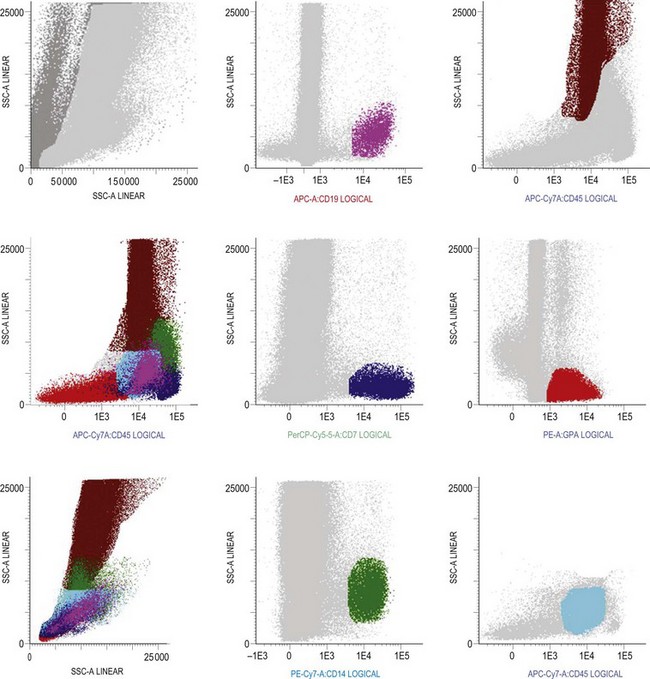
The localization of these subpopulations on the CD45/SSC plot can be refined by multicolor labeling of lineage-associated antigens and visualization of cell populations positive for given antigen combinations (Fig. 2.20).79 Further analysis of discrete cell subpopulations will depend on the clinical question and include antibodies to differentiation-associated antigens, as described above. Immunocytochemistry can also be used to detect normal hemopoietic cell types of all lineages; this will be described in Chapter 3.
1 Robin C, Ottersbach K, de Bruijn M, et al. Developmental origins of hematopoietic stem cells. Oncology Research. 2003;13:315-321.
2 Dzierzak E, Speck NA. Of lineage and legacy: the development of mammalian hematopoietic stem cells. Nat Immunol. 2008;9(2):129-136.
3 Lee W, Erm SK, Kim KY, Becker RP. Emperipolesis of erythroblasts within Kupffer cells during hepatic hemopoiesis in human fetus. Anatomical Record. 1999;256:158-164.
4 Wickramasinghe S. Human bone marrow. Oxford: Blackwell Scientific Publications; 1975.
5 Yahata T, Muguruma Y, Yumino S, et al. Quiescent human hematopoietic stem cells in the bone marrow niches organize the hierarchical structure of hematopoiesis. Stem Cells. 2008;26(12):3228-3236.
6 Huang S, Terstappen LW. Lymphoid and myeloid differentiation of single human CD34+, HLA-DR+, CD38− hematopoietic stem cells. Blood. 1994;83(6):1515-1526.
7 Bjorklund E, Gruber A, Mazur J, et al. CD34+ cell subpopulations detected by 8-color flow cytometry in bone marrow and in peripheral blood stem cell collections: application for MRD detection in leukemia patients. Int J Hematol. 2009;90(3):292-302.
8 Goardon N, Nikolousis E, Sternberg A, et al. Reduced CD38 expression on CD34+ cells as a diagnostic test in myelodysplastic syndromes. Haematologica. 2009;94(8):1160-1163.
9 van Lochem EG, van der Velden VH, Wind HK, et al. Immunophenotypic differentiation patterns of normal hematopoiesis in human bone marrow: reference patterns for age-related changes and disease-induced shifts. Cytometry B Clin Cytom. 2004;60(1):1-13.
10 Bellantuono I. Haemopoietic stem cells. Int J Biochem Cell Biol. 2004;36(4):607-620.
11 Buza-Vidas N, Luc S, Jacobsen SE. Delineation of the earliest lineage commitment steps of haematopoietic stem cells: new developments, controversies and major challenges. Current Opinion in Hematology. 2007;14:315-321.
12 Giebel B, Punzel M. Lineage development of hematopoietic stem and progenitor cells. Biol Chem. 2008;389(7):813-824.
13 Migliaccio AR, Papayannopoulou T. Erythropoiesis. Steinberg MH, Forget BG, Higgs DR, Nagel RL. Cambridge Cambridge: University Press; 2001:52–71.
14 Hanspal M, Smockova Y, Uong Q. Molecular identification and functional characterisation of a novel protein that mediates the attachment of erythroblasts to macrophages. Blood Reviews. 1998;92:2940-2950.
15 Lee G, Lo Lee G, Lo A, et al. Targeted gene deletion demonstrates that the cell adhesion molecule ICAM-4 is critical for erythroblastic island formation. Blood Reviews. 2006;108:2064-2071.
16 Chasis J. Erythroblastic islands: specialized microenvironmental niches for erythropoiesis. Current Opinion in Hematology. 2006;13:137-141.
17 Manwani D, Bieker JJ. The erythroblastic island. Current Topics in Developmental Biology. 2008;82:23-53.
18 Fisher J. Erythropoietin: physiology and pharmacology update. Experimental Biology and Medicine. 2003;228:1-14.
19 Gleadle JM. Review article: How cells sense oxygen: lessons from and for the kidney. Nephrology (Carlton). 2009;14(1):86-93.
20 Leberbauer C, Boulmé F, Unfried G, et al. Different steroids co-regulate long-term expansion versus terminal differentiation in primary human erythroid progenitors. Blood. 2005;105:85-94.
21 Blobel G, Sieff CA, Orkin SH. Ligand-dependent repression of the erythroid transcription factor GATA-1 by the estrogen receptor. Molecular and Cellular Biology. 1995;15:3147-3153.
22 Chen K, Liu J, Heck S, et al. Resolving the distinct stages in erythroid differentiation based on dynamic changes in membrane protein expression during erythropoiesis. Proc Natl Acad Sci USA. 2009;106(41):17413-17418.
23 Wood B. Multicolor immunophenotyping: human immune system hematopoiesis. Methods Cell Biol. 2004;75:559-576.
24 Kaushansky K. Historical review: megakaryopoiesis and thrombopoiesis. Blood. 2008;111(3):981-986.
25 Jean G, Lambertenghi-Deliliers G, Ranzim T, Poirier-Basseti M. The human bone marrow megakaryocyte. An ultrastructural study. Haematologia. 1971;5:253-264.
26 Breton-Gorius J, Reyes F. Ultrastructure of human bone marrow cell maturation. International Review of Cytology. 1976;46:251-321.
27 Larsen T. Emperipolesis of granular leukocytes within megakaryocytes in human hemopoietic bone marrow. American Journal of Clinical Pathology. 1970;53:485-489.
28 Skokowa J, Welte K. LEF-1 is a decisive transcription factor in neutrophil granulopoiesis. Annals of the New York Academy of Sciences. 2007;1106:143-151.
29 van Rhenen A, Feller N, Kelder A, et al. High stem cell frequency in acute myeloid leukemia at diagnosis predicts high minimal residual disease and poor survival. Clin Cancer Res. 2005;11(18):6520-6527.
30 Elghetany MT, Ge Y, Patel J, et al. Flow cytometric study of neutrophilic granulopoiesis in normal bone marrow using an expanded panel of antibodies: correlation with morphologic assessments. J Clin Lab Anal. 2004;18(1):36-41.
31 Kussick SJ, Wood BL. Using 4-color flow cytometry to identify abnormal myeloid populations. Arch Pathol Lab Med. 2003;127(9):1140-1147.
32 Cowland JB, Borregaard N. The individual regulation of granule protein mRNA levels during neutrophil maturation explains the heterogeneity of neutrophil granules. Journal of Leukocyte Biology. 1999;66:989-995.
33 Faurschou M, Kamp S, Cowland JB, et al. Prodefensins are matrix proteins of specific granules in human neutrophils. Journal of Leukocyte Biology. 2005;78:785-793.
34 Jacobsen L, Theilgaard-Mönch K, Christensen EI, Borregaard N. Arginase 1 is expressed in myelocytes/metamyelocytes and localized in gelatinase granules of human neutrophils. Blood. 2007;109:3084-3087.
35 Bjornsson S, Wahlstrom S, Norstrom E, et al. Total nucleated cell differential for blood and bone marrow using a single tube in a five-color flow cytometer. Cytometry B Clin Cytom. 2008;74(2):91-103.
36 Egesten A, Calafat J, Weller PF, et al. Localization of granule proteins in human eosinophil bone marrow progenitors. International Archives of Allergy and Immunology. 1997;114:130-138.
37 Zucker-Franklin D. Ultrastructural evidence for the common origin of human mast cells and basophils. Blood Reviews. 1980;56(3):534-540.
38 Valent P. Cytokines involved in growth and differentiation of human basophils and mast cells. Experimental Dermatology. 1995;4:255-259.
39 Han X, Jorgensen JL, Brahmandam A, et al. Immunophenotypic study of basophils by multiparameter flow cytometry. Arch Pathol Lab Med. 2008;132(5):813-819.
40 Gemelli C, Montanari M, Tenedini E, et al. Virally mediated MafB transduction induces the monocyte commitment of human CD34+ hematopoietic stem/progenitor cells. Cell Death and Differentiation. 2006;13:1686-1696.
41 Blom B, Spits H. Development of human lymphoid cells. 2006. Annu Rev Immunol. 2006;24:287-320.
42 LeBien T, Tedder TF. B lymphocytes: how they develop and function. Blood. 2008;112:1570-1580.
43 Strominger J. Developmental biology of T cell receptors. Science. 1989;244:943-950.
44 Pongubala J, Northrup DL, Lanckim DW, et al. Transcription factor EBF restricts alternative lineage options and promotes B cell fate commitment independently of Pax5. Nature Immunology. 2008;9:203-215.
45 Visan I, Tan JB, Yuan JS, et al. Regulation of T lymphopoiesis by Notch1 and Lunatic fringe-mediated competition for intrathymic niches. Nature Immunology. 2006;7:634-643.
46 Lucio P, Parreira A, van den Beemd MW, et al. Flow cytometric analysis of normal B cell differentiation: a frame of reference for the detection of minimal residual disease in precursor-B-ALL. Leukemia. 1999;13(3):419-427.
47 Porwit-MacDonald A, Bjorklund E, Lucio P, et al. BIOMED-1 concerted action report: flow cytometric characterization of CD7+ cell subsets in normal bone marrow as a basis for the diagnosis and follow-up of T cell acute lymphoblastic leukemia (T-ALL). Leukemia. 2000;14(5):816-825.
48 McKenna RW, Washington LT, Aquino DB, et al. Immunophenotypic analysis of hematogones (B-lymphocyte precursors) in 662 consecutive bone marrow specimens by 4-color flow cytometry. Blood. 2001;98(8):2498-2507.
49 Campana D, Janossy G, Bofill M, et al. Human B cell development. I. Phenotypic differences of B lymphocytes in the bone marrow and peripheral lymphoid tissue. J Immunol. 1985;134(3):1524-1530.
50 Fuda FS, Karandikar NJ, Chen W. Significant CD5 expression on normal stage 3 hematogones and mature B lymphocytes in bone marrow. Am J Clin Pathol. 2009;132(5):733-737.
51 Loken MR, Shah VO, Dattilio KL, Civin CI. Flow cytometric analysis of human bone marrow. II. Normal B lymphocyte development. Blood. 1987;70(5):1316-1324.
52 Six EM, Bonhomme D, Monteiro M, et al. A human postnatal lymphoid progenitor capable of circulating and seeding the thymus. J Exp Med. 2007;204(13):3085-3093.
53 Cooper MA, Fehniger TA, Caligiuri MA. The biology of human natural killer-cell subsets. Trends Immunol. 2001 Nov;22(11):633-640.
54 Bennett IM, Zatsepina O, Zamai L, et al. Definition of a natural killer NKR-P1A+/CD56-/CD16- functionally immature human NK cell subset that differentiates in vitro in the presence of interleukin 12. J Exp Med. 1996;184(5):1845-1856.
55 Jourdan M, Caraux A, De Vos J, et al. An in vitro model of differentiation of memory B cells into plasmablasts and plasma cells including detailed phenotypic and molecular characterization. Blood. 2009;114(25):5173-5181.
56 Yin T, Li L. The stem cell niches in bone. Journal of Clinical Investigation. 2006;116:1195-1201.
57 Dzionek A, Fuchs A, Schmidt P, et al. BDCA-2, BDCA-3, and BDCA-4: three markers for distinct subsets of dendritic cells in human peripheral blood. J Immunol. 2000;165(11):6037-6046.
58 Okayama Y, Kawakami T. Development, migration, and survival of mast cells. Immunol Res. 2006;34(2):97-115.
59 Denburg J, Richardson M, Telizyn S, Bienenstock J. Basophil/mast cell precursors in human peripheral blood. Blood Reviews. 1983;61:775-780.
60 Kirshenbaum A, Kessler SW, Goff JP, Metcalfe DD. Demonstration of the origin of human mast cells from CD34+ bone marrow progenitor cells. Journal of Immunology. 1991;146:1410-1415.
61 Migliaccio A, Rana RA, Vannucchi AM, Manzoli FA. Role of thrombopoietin in mast cell differentiation. Annals of the New York Academy of Sciences. 2007;1106:152-174.
62 Takemoto C, Lee YN, Jegga AG. Mast cell transcriptional networks. Blood Cells, Molecules and Diseases. 2008;41:82-90.
63 Hu Z, Zhao WH, Shimamura T. Regulation of mast cell development by inflammatory factors. Current Medicinal Chemistry. 2007;14:3044-3050.
64 Pejler G, Ronnberg E, Waern I, Wernersson S. Mast cell proteases: multifaceted regulators of inflammatory disease. Blood. 2010;115(24):4981-4990.
65 dePaulis A, Minopoli G, Arbustini E, et al. Stem cell factor is localized in, released from, and cleaved by human mast cells. Journal of Immunology. 1999;163:2799-2808.
66 Diao J, Zhao J, Winter E, Cattral MS. Recruitment and differentiation of conventional dendritic cell precursors in tumors. J Immunol. 2010;184(3):1261-1267.
67 Orfao A, Escribano L, Villarrubia J, et al. Flow cytometric analysis of mast cells from normal and pathological human bone marrow samples: identification and enumeration. Am J Pathol. 1996;149(5):1493-1499.
68 Escribano L, Navalon R, Nunez R, et al. Immunophenotypic analysis of human mast cells by flow cytometry. Curr Protoc Cytom. 2001. Chapter 6:Unit 6
69 Arai F, Suda T. Maintenance of quiescent hematopoietic stem cells in the osteoblastic niche. Annals of the New York Academy of Sciences. 2007;1106:41-53.
70 Porter R, Calvi LM. Communications between bone cells and hematopoietic stem cells. Archives of Biochemistry and Biophysics. 2008;473:193-200.
71 Horowitz M, Bothwell AL, Hesslein DG, et al. B cells and osteoblast and osteoclast development. Immunological Reviews. 2005;208:141-153.
72 Wang X, Lan Y, He WY. Identification of mesenchymal stem cells in aorta-gonad-mesonephros and yolk sac of human embryos. Blood Reviews. 2008;111:2436-2443.
73 Dominici M, Le Blanc K, Mueller I, et al. Minimal criteria for defining multipotent mesenchymal stromal cells. The International Society for Cellular Therapy position statement. Cytotherapy. 2006;8(4):315-317.
74 Lee SH, Erber WN, Porwit A, et al. ICSH guidelines for the standardization of bone marrow specimens and reports. Int J Lab Hematol. 2008;30(5):349-364.
75 Terstappen LW, Huang S, Picker LJ. Flow cytometric assessment of human T-cell differentiation in thymus and bone marrow. Blood. 1992;79(3):666-677.
76 Terstappen LW, Levin J. Bone marrow cell differential counts obtained by multidimensional flow cytometry. Blood Cells. 1992;18(2):311-330. discussion 31–2
77 Terstappen LW, Safford M, Loken MR. Flow cytometric analysis of human bone marrow. III. Neutrophil maturation. Leukemia. 1990;4(9):657-663.
78 Stelzer GT, Shults KE, Loken MR. CD45 gating for routine flow cytometric analysis of human bone marrow specimens. Ann N Y Acad Sci. 1993;677:265-280.
79 Arnoulet C, Bene MC, Durrieu F, et al. Four- and five-color flow cytometry analysis of leukocyte differentiation pathways in normal bone marrow: a reference document based on a systematic approach by the GTLLF and GEIL. Cytometry B Clin Cytom. 2010;78(1):4-10.
80 Campana D, Coustan-Smith E. Minimal residual disease studies by flow cytometry in acute leukemia. Acta Haematol. 2004;112(1–2):8-15.
[/level-membership-for-pathology-category][not-level-membership-for-pathology-category]
CHAPTER 2 Normal bone marrow cells
Development and cytology
Hemopoietic cells
Embryonic hemopoiesis
Hemopoiesis commences from a transient population of primitive HSC generated in the yolk sac. This commences on the 14th to 19th day of embryogenesis and persists there until the end of the 12th week of gestation. The yolk sac primarily produces nucleated erythroid cells that are megaloblastic and contain embryonic hemoglobins, Gower I (ζ2ε2), Gower II (α2ε2) and Portland I (ζ2γ2) (Fig. 2.1). Yolk sac erythropoiesis is referred to as ‘primitive’. In the 6th and 7th weeks of gestation, the blood islands within the yolk sac also contain a few megakaryocytes. Hemopoietic activity then occurs in a region of the para-aortic splanchopleural mesoderm. This region contains the dorsal aorta, gonadal ridge and mesonephros and is known as the aorta-gonad-mesonephros or AGM region.1,2 Hemopoiesis in the AGM region develops from ‘definitive’ HSC that eventually populate the adult BM. Some adult-type HSC also develop in the yolk sac and the placenta.
HSC derived from the AGM migrate to the liver and erythropoietic foci are detectable in the 6th week of gestation. The liver remains the main site of erythropoiesis from the 3rd to the 6th month when erythroblasts account for about 50% of the nucleated cells of the liver. The erythroblasts are mainly extravascular (Fig. 2.2), located near and within Kupffer cells (emperipolesis) and continue their maturation inside sinusoids.3 Erythroblasts are initially megaloblastic but subsequently become macronormoblastic. Fetal hepatic erythropoiesis is associated with the synthesis of fetal hemoglobin (HbF; α2γ2) and results in the production of nucleated, macrocytic red cells. The liver continues to produce red cells in decreasing numbers after the 6th month of gestation until the end of the 1st postnatal week.
General characteristics of hemopoiesis
The formation of blood cells of all types involves two processes:
Hemopoietic stem cells and progenitor cells
The uncommitted HSC has the capacity for self-renewal and is pluripotent, that is, it has the ability to differentiate into lineage-committed progenitors. It is not recognizable morphologically but can be identified by antigen expression profile. The differentiation of HSC generates multipotent myeloid progenitors and lymphoid progenitors (Fig. 2.3).4 Evidence for the presence of pluripotent HSC has come from a number of pieces of evidence including:
All pluripotent HSC express CD34 antigen and are usually AC133+, CD59+; Thy1low; CD38−; C-kit−/low; CD33−; lineage−. By flow cytometry (FCM) CD34+ HSC constitute most cells of the CD45dim/SSClow (blast) region and are a heterogeneous cell population. A small fraction of pluripotent HSC with long-term repopulating cell activity have been associated with the CD34+/CD38− phenotype.5,6 These cells are very rare in normal BM (usually <0.1%), but may increase in regenerating BM and in myelodysplastic syndromes.7,8 CD34+/CD45dim cells include a major fraction of progenitor cells that are already committed to specific hematopoietic lineages (erythroid, neutrophil, monocytic, dendritic cell (DC), basophil, mast cell (MC), eosinophil and megakaryocytic) and variable numbers of CD34+ B-cell precursors (BCP).9
The multipotent (or pluripotent) HSC undergo gradual restriction in their hemopoietic potential as they eventually give rise to unipotent progenitor cells10,11 (Fig. 2.4). The progeny of HSC therefore become progressively restricted to one cell lineage and they lose the capacity to self-renew. The earliest branching between myeloid and lymphoid development is to committed progenitor cells of myeloid or lymphoid types, as follows:11,12
The complex mechanisms involved in the regulation of hemopoietic stem cells and progenitor cells are described in Chapter 4. Growth-promoting cytokines, such as granulocyte-macrophage colony stimulating factor (GM-CSF) and granulocyte colony stimulating factor (G-CSF), other cytokines and transcription factors are key regulators of hemopoiesis and may also enhance some functions of the mature cells.
Erythropoiesis
The CMP undergoes further differentiation to generate megakaryocyte-erythroid progenitors (MEP) or granulocyte-macrophage progenitors (GMP).4,13 The bipotent MEP has potential to form erythroid or megakaryocytic cells, both of which require GATA-1 (globin transcription factor 1) for their terminal differentiation. The most immature lineage-specific erythroid progenitor cells are the erythroid burst-forming units (BFU-E) and the most mature are the erythroid colony-forming units (CFU-E). The CFU-E develop into proerythroblasts, the earliest morphologically recognizable BM red cell precursors. Proerythroblasts progress through several morphologically defined cytologic classes. These are, in order of increasing maturity, the basophilic erythroblasts, early and late polychromatic erythroblasts and reticulocytes. Cell division occurs in the proerythroblasts, basophilic erythroblasts and early polychromatic erythroblasts but not in more mature cells. There are, on average, four cell divisions in the morphologically recognizable precursor pool so that one proerythroblast may give rise to 24 (16) red cells. In normal adults, the time taken for a proerythroblast to mature into BM reticulocytes and for reticulocytes to enter the circulation is about 7 days; of this, about 2.5 days is spent in the marrow reticulocyte pool. The time taken for blood reticulocytes to mature into erythrocytes is 1–2 days. In normal individuals erythrocytes circulate for approximately 120 days before they are removed and broken down by the mononuclear phagocyte system.
Within the BM, erythroblasts are present in erythroid islands composed of one or more central macrophages surrounded by one or two layers of erythroblasts (Fig. 2.5); fine processes of macrophage cytoplasm are found between the erythroid progenitors. Surface receptors on the macrophages are involved in macrophage–erythroblast interactions. One such receptor, erythroblast macrophage protein (Emp), mediates attachment of erythroid cells to macrophages in the erythroid island. Emp is required for normal erythroid differentiation and nuclear extrusion.14 A receptor on erythroblasts, intercellular adhesion molecule-4, binds to alpha (V) integrins on macrophages and is important for the formation of erythroblastic islands.15 Interactions between the macrophage and erythroblasts may modulate erythropoiesis by affecting gene expression and apoptosis and are required for iron delivery for the production of hemoglobin.16,17
Regulation of erythropoiesis
A key factor determining the rate of red cell production is the glycoprotein hormone erythropoietin (EPO) which, in the adult, is produced mainly by the peritubular cells of the kidney. EPO receptors are expressed on erythroid progenitor cells and the binding of EPO to its receptor results in the activation of JAK2 tyrosine kinase, which causes tyrosine phosphorylation in a number of proteins and triggers the activation of several signal transduction pathways involved in proliferation and in the prevention of apoptosis.18 An important effect of EPO is, therefore, to maintain the viability and proliferation of erythroid progenitor cells, by preventing apoptosis. In synergy with stem cell factor (SCF), GM-CSF, interleukin (IL)-3 and insulin-like growth factor-1 (IGF-1), EPO stimulates the rate of differentiation of CFU-E to pronormoblasts. EPO also stimulates terminal differentiation and decreases the time taken for the maturation of a pronormoblast to a marrow reticulocyte and its release into the circulation. The plasma level of EPO is inversely related to the capacity of the blood to deliver oxygen to the kidneys and other tissues. Reduction of the oxygen supply to the kidney results in enhanced EPO gene expression via a hypoxia-regulated transcription factor, HIF (hypoxia-inducible factor).19 Thus, in most anemic states there is an EPO increased level in the plasma, which in turn causes an enhancement of the rate of erythropoiesis.
Erythropoiesis is also influenced by the secretions of various endocrine glands. For example, hypofunction of the thyroid, testes, adrenal glands or anterior lobe of the pituitary gland result in mild to moderate anemia. Erythropoiesis is stimulated by thyroxine (stimulates terminal differentiation of erythroid progenitor cells), androgens (proliferation and expansion of erythroid progenitors) and growth hormone partly by an effect on the kidneys resulting in increased EPO production.20 Corticosteriods enhance erythropoiesis by stimulating EPO production and by a direct effect on progenitor cells. There is some evidence that estrogens may inhibit erythropoiesis;21 the sex difference in the hemoglobin levels of adults appears to be largely due to the higher androgen levels in males.
Light microscope cytology
The term erythroblast is used to define erythroid progenitors. When these appear normal the term normoblast is applied. In Romanowsky-stained normal BM smears morphologically identifiable erythroid cells have the following features (Figs 2.5 and 2.6):
Antigen expression
Early erythroblasts have weak CD45 expression, are CD44 (strong), CD71, CD36, HLA-DR and CD117 positive. Glycophorin A (CD235a) is expressed at a low level at this stage. Maturation to the basophilic erythroblast is accompanied by a decrease in CD44, CD45 and acquisition of CD235a antigen. Transition to polychromatic erythroblast shows a further loss of CD45, HLA-DR and CD44, a mild decrease in CD36 expression and presence of hemoglobin.22,23
Ultrastructure
Electron microscope studies show that all erythroblasts contain characteristic surface invaginations which develop into small intracytoplasmic vesicles (rhopheocytotic vesicles) (Fig. 2.5B). Morphological changes can be seen with maturation from pronormoblasts to mature late polychromatic normoblasts. The major changes are an increase in the amount of heterochromatin, decrease in the number of ribosomes, increase in the electron-density of the cytoplasm due to the accumulation of hemoglobin, a decrease in the number and size of mitochondria and aggregation of ferritin molecules into siderosomes. A Golgi apparatus persists in polychromatic normoblasts.
Megakaryopoiesis
Megakaryopoiesis is the process of development of megakaryocytes and platelets within the marrow. Humans generate 1011 platelets per day, and production can be increased 20-fold when in demand.24 Megakaryocytes are derived following a cascade of differentiation from the megakaryocyte-erythroid progenitor (MEP). The bipotent MEP commits to megakaryopoiesis under the influence of thrombopoietin (TPO), the primary regulator of platelet production, IL-6 and IL-11 to generate megakaryocyte colony-forming units (CFU-MK). CFU-MK are a diploid cell population, in which DNA synthesis and nuclear division (karyokinesis) is followed by cell division (cytokinesis). CFU-MK undergo further maturation to megakaryoblasts, the earliest morphologically recognizable member of the megakaryocyte series.
Four types of megakaryocytic cells can be identified in Romanowsky-stained BM smears. These are, in increasing order of maturity (Fig. 2.7):
Light microscope cytology
Early megakaryoblasts are difficult to distinguish from BM myeloblasts (see later) but do have a distinct ultrastructural appearance and phenotype. Megakaryoblasts (20–30 µm diameter) have a single large oval, kidney-shaped or lobed nucleus with several nucleoli, a very high nucleus to cytoplasm ratio and deeply basophilic agranular cytoplasm. Promegakaryocytes are usually larger than megakaryoblasts and have a lower nucleus to cytoplasm ratio and less basophilic cytoplasm. They have overlapping nuclear lobes and the cytoplasm may contain azurophilic cytoplasmic granules. The granular megakaryocytes (Fig. 2.7) are up to 70 µm in diameter and possess abundant pale-staining cytoplasm and numerous azurophilic cytoplasmic granules. The nucleus has coarsely granular chromatin and multiple lobes which extend through much of the cell. Prior to the formation of platelets by the fragmentation of cytoplasmic processes, the nuclear lobes become fairly tightly packed together. Following completion of platelet formation, a ‘bare’ nucleus remains (Fig. 2.7B).
Ultrastructure
Extensive studies have been performed of megakaryocytes throughout differentiation; the reader is referred to the previous edition of this book and other references for details of the ultrastructural features.25,26 Ultrastructural cytochemical studies have demonstrated platelet peroxidase (PPO), distinct from myeloperoxidase (MPO), in the endoplasmic reticulum and perinuclear space of promegakaryoblasts, megakaryoblasts and megakaryocytes. PPO is also present in the dense bodies and dense tubular system of platelets.
Emperipolesis
Emperipolesis describes the presence and movement of one cell within the cytoplasm of another; the ‘engulfed’ cell can subsequently leave the ‘engulfing’ cell and appears morphologically unaltered by the interaction.27 Emperipolesis is most commonly seen within megakaryocytes and sometimes one megakaryocyte may contain several cells ‘inside’ it (Fig. 2.8). The engulfed cells may be neutrophils, eosinophils and their precursors, lymphocytes, erythroblasts or red cells. Megakaryocytic emperipolesis is of uncertain significance but may represent a transmegakaryocytic route for the entry of blood cells into the circulation; it has been suggested that some of the intramegakaryocytic cells may enter the circulation via the processes of megakaryocytic cytoplasm which protrude into adjacent marrow sinusoids. Emperipolesis has also been described in non-hemopoietic cells and malignant cells, including blast cells in the blast phase of chronic myelogenous leukemia.
Granulopoiesis and monocytopoiesis
Granulopoesis is the production of granulocytic cells (neutrophils, eosinophils and basophils, and cells of the monocyte–macrophage series) within the BM. Granulopoiesis commences with the differentiation of the HSC to the common myeloid progenitor (CMP). The CMP further develops into the bipotent granulocyte-macrophage progenitor (GMP). The GMP differentiates into cells that are irreversibly committed to mature into granulocytic cells (CFU-G) or macrophages (CFU-M). The granulocytic cells, including neutrophils, eosinophils and basophils, are all characterized by the presence of cytoplasmic granules (Table 2.1).
Table 2.1 The major granule proteins present in neutrophils, eosinophils, basophils and mast cells
| Cell type | Primary granules | Specific granules |
|---|---|---|
| Neutrophil granulocytes | Myeloperoxidase Acid phosphatase Lysozyme Neutrophil elastase Defensins Bactericidal permeability-increasing protein Cathepsins α1 antitrypsin Heparin-binding protein Sulphated mucosubstances Aryl sulphatase α-mannosidase |
Buy Membership for Pathology Category to continue reading. Learn more here
[/not-level-membership-for-pathology-category] |
