CHAPTER 55 Neuroradiologic Evaluation for Epilepsy Surgery
Computed Tomography, Magnetic Resonance Imaging, and Functional Imaging (Diffusion Tensor Imaging, Positron Emission Tomography, and Functional Magnetic Resonance Imaging)
Magnetic Resonance Imaging
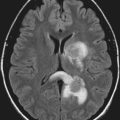
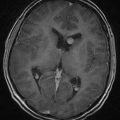
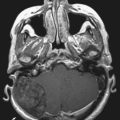
Because of its high sensitivity and excellent tissue contrast, MRI should be the first step in screening an epilepsy patient because it detects underlying structural pathology in as many as 75% of patients with refractory focal seizures. MRI is the primary imaging modality when a patient experiences the first seizure or when the clinician suspects epilepsy. Most centers will have performed screening studies that usually include T1-weighted (with contrast enhancement if a space-occupying lesion is suspected), T2-weighted, and fluid-attenuated inversion recovery (FLAIR) sequences in the axial, sagittal, and coronal planes. These studies can be sufficient to reveal focal pathology. If focal pathology as shown by MRI is concordant with that noted on electroencephalography (EEG), a better surgical outcome is achieved, and identifying a focal lesion in patients with refractory epilepsy remains one of the most important factors in determining surgical outcomes.1 However, if no focal lesion is seen and if EEG suggests a focal etiology, further MRI and other imaging studies should be performed.2 In recent years, detection of lesions with MRI has improved by optimizing scan protocols with the use of FLAIR sequences, diffusion-weighted images, and volume acquisition with three-dimensional reconstruction.
MRI protocols specific for epilepsy patients can differ but often include variations of the following3:
Recent imaging improvements include the following:
3 T and 7 T versus 1.5 T
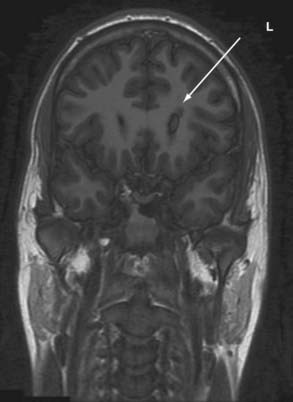
Some lesions, such as cortical dysplasia, can be difficult to detect, and there is ongoing interest in using new advances in MRI, such as high-field and multichannel technology. It remains to be tested whether multichannel 3- or 7-T imaging can provide additional useful information. Increasing field strength from 1.5 to 3 and 7 T for the clinical evaluation of epilepsy has required optimization of imaging protocols but has shown that increased field strength improves the SNR and may therefore prove useful in the detection of cortical dysplasia. However, some have found that 1.5 T appears to be more sensitive in cases of tissue loss and mesial temporal sclerosis.8
Diffusion Tensor Imaging
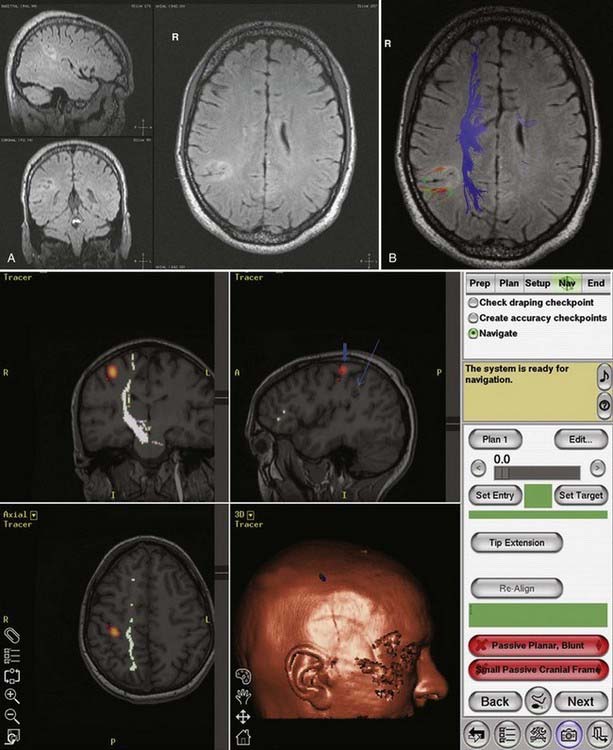
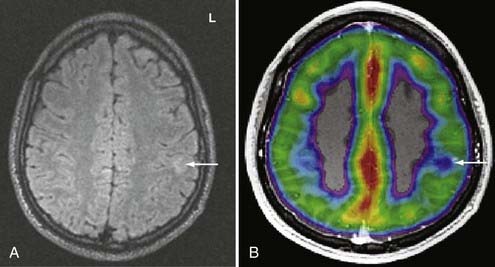
DTI, also known as “fiber tracking,” is an MRI modality that has allowed three-dimensional study of white matter fiber bundles at visible resolution (millimeters). Previously, white fiber (axonal) tracts were mapped post mortem by using specialized preparations or chemical techniques. DTI provides imaging of major white matter bundles connecting functional groups of neurons (Fig. 55-3). Computer analysis can connect fiber bundles in close relation to a planned surgical field such as the motor cortex to motor areas in the brainstem. DTI can therefore aid in planning surgery by avoidance of not only eloquent cortex but also the white matter tracts that connect functional areas.
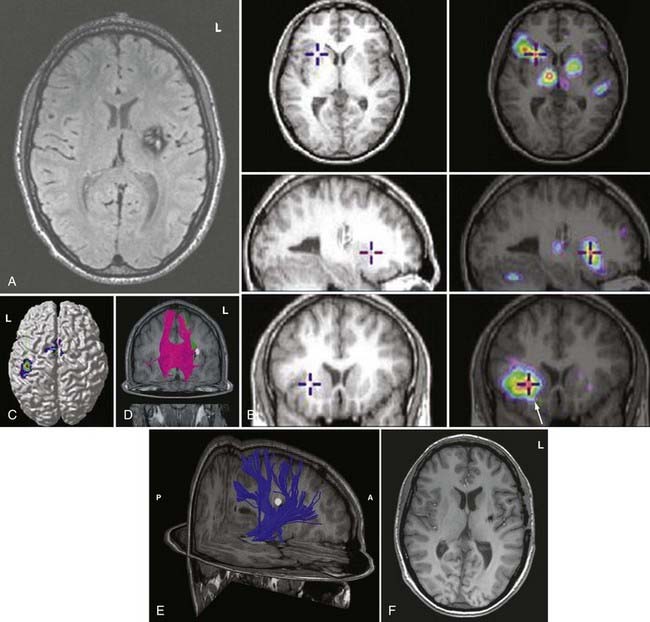
Because white matter tract trajectories are complex, the use of DTI necessitates knowledge of the core or seed regions (voxels) of interest, specifically, where the tracts originate, where they pass through, and where they end. For example, when mapping the corticospinal tracts, the seed areas are the cortex in the motor area, the internal capsule, and the peduncles of the midbrain (Fig. 55-4). Placement of a seed area in the motor cortex is often preceded by fMRI to enable precise choice of the tracts of interest (Fig. 55-5).
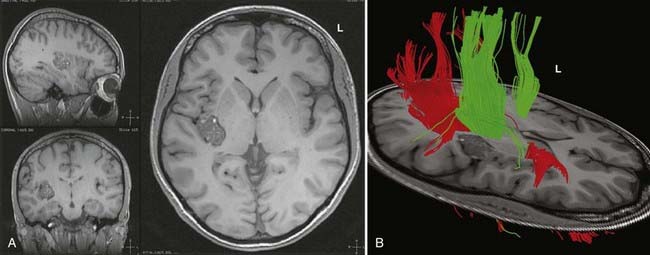
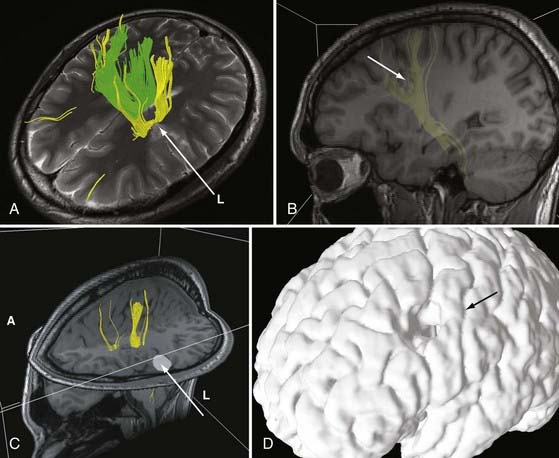
In clinical practice, it is probably not necessary to study more than 20 prominent tracts in the cerebrum and brainstem. Regions of special interest to the epilepsy surgeon are tracts that connect areas of special functional importance and include the corticospinal tracts, corpus callosum, arcuate and uncinate fasciculi, and the inferior orbitofrontal tract, the latter including the optic tract and Meyer’s loop. In recent years, papers and atlases have been published on white tract anatomy, placement of seed areas, and comparison of DTI with traditional white matter dissection.9,10 Recent advances include intraoperative DTI, in which real-time images of white matter tracts are generated during neurosurgical procedures and shifting of tracts as a result of surgery can be depicted.11 The role of DTI in neurosurgical practice is currently being defined.
Functional Brain Imaging
Magnetic Resonance Spectroscopy
MRS is a noninvasive functional neuroimaging tool that has been especially useful in studying hippocampal pathology. Hippocampal sclerosis is found by pathologic examination in 65% of patients with temporal lobe epilepsy and is characterized by loss of neurons, atrophy, and replacement gliosis.12 It can be seen by visual inspection or volumetric analysis and can be defined by MRI in 70% of cases.13 MRS allows in vivo analysis of neurochemicals and their metabolites. Attention has focused on proton [1H] MRS, which has principally yielded data on N-acetylaspartate (NAA), choline, phosphocreatine, creatine, and lactate; MRS quantifies metabolites from brain regions that have underlying cellular abnormalities. NAA, which is an amino acid synthesized in mitochondria, is a neuronal and axonal marker that decreases with neuronal loss or dysfunction. Decreased levels of NAA can be interpreted as cell loss or neuronal damage. Total creatine, composed of phosphocreatine and its precursor creatine, is a marker of brain energy metabolism. Total choline is a marker for membrane synthesis or repair, inflammation, or demyelination and can reflect astrocytosis. Studies have shown that in comparison to controls, the temporal lobe ipsilateral to the seizure focus shows a reduction in NAA signal intensity and an increase in creatine and choline signal. Reduction of the ratio of NAA to choline, creatine, and phosphocreatine is a marker for neuronal loss and dysfunction. This method has shown promise for localizing epileptic foci with underlying pathology that is not visible with other imaging modalities. However, routine use of MRS for epilepsy is declining in many centers as a result of the increased application and improvement of other imaging modalities.
Functional Mapping
Human brain mapping has produced new data that have added considerable information on the anatomy of specific cerebral functions. As already noted, there are two basic types of brain mapping methods for measuring brain function: first, techniques that detect electromagnetic activity (EEG and MEG) measure the electromagnetic fields generated by neural activity, and second, techniques that are based on hemodynamic or metabolic signals (PET and fMRI) measure signs of neural activity. These two methodologies differ, including their temporal and spatial resolution. fPET and fMRI produce data from most of the brain with a spatial resolution of a few millimeters and a temporal resolution of minutes (fPET) or seconds (fMRI). The electromagnetic techniques, in contrast, produce data with limited spatial resolution but with a temporal resolution of milliseconds. High temporal resolution is important to resolve rapidly the changing patterns of brain activity that underlie cerebral function. However, traditionally, EEG and MEG have provided insufficient spatial detail to identify relationships between electrical events, structures, and functions, as visualized by MRI, PET, or fMRI. It is hoped that combining the two technologies will provide increasing information on processing in the human brain.14 The rationale behind fPET and fMRI is to determine the spatial relationship between active eloquent brain areas and to identify the least traumatic neurosurgical approach. In the case of fPET, structural MRI images are required for coregistration.
Functional Magnetic Resonance Imaging
Applications of fMRI include mapping of eloquent cortex, particularly sensorimotor function and language. Baseline studies are carried out, followed by presentation of relevant tasks to the patient. It is hoped that in the future fMRI will replace the Wada test for memory and language and mitigate the need for intraoperative cortical mapping in certain cases.15 However, caution is necessary in comparing the localization of functions based on areas of brain activated, as with the use of fMRI, with areas inactivated by the Wada test or intraoperative stimulation mapping. There are also concerns of the accuracy of fMRI localization, which can be impaired by the low SNR (in comparison to fPET) and susceptibility to various artifacts, including movement during speech. Thus far, studies comparing fPET and fMRI in the same patient are rare.16
Positron Emission Tomography
PET records the accumulation of radioactively labeled compounds in regions of the brain. The radioactive compounds (tracers) follow the biochemical pathways of native molecules without altering the velocity of the reactions in these pathways. Although fMRI appears to be superseding fPET in terms of clinical use because of cost and availability, FDG-PET and fPET can assist in lateralization and localization of epileptogenic cortical areas (Fig. 55-6).
Functional Positron Emission Tomography
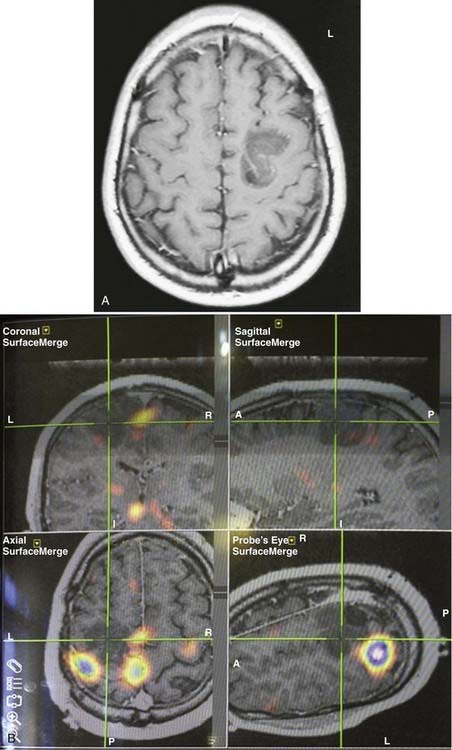
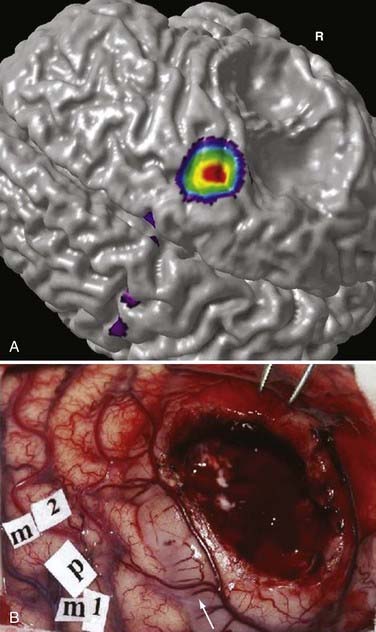
During functional activity, fPET shows significantly altered signals in comparison to a reference or baseline state. Functional activity results in altered signals in the region of interest, and fPET highlights the neuroanatomic correlates of changes in these processes by comparing the active state with the reference or baseline state. As in fMRI, activation typically involves sequential tasks contralateral to the lesion, such as thumb opposition, flexion-extension of the foot, or language tasks (Fig. 55-7). fPET is generally believed to be an accurate localization method that has demonstrated good correspondence with intraoperative cortical mapping methods and a high SNR. In fPET, uptake of radioactive water into the brain is proportional to blood flow during the first few minutes after the intravenous injection of [15O]H2O, and blood flow is assumed to change in proportion to functional activity.
FDG-PET has been found to be useful in nonlesional epilepsy by interictally locating areas of reduced glucose consumption (Fig. 55-8). This has been found to enhance the treatment of patients with cortical dysplasia.17 Others have found that FDG-PET asymmetry such as left temporal lobe hypometabolism can predict verbal memory after temporal lobectomy.18 Recent studies have indicated that FDG-PET can detect interictal hypometabolism in areas of cortical dysplasia in 81% of cases and has been found to be useful in identifying epileptogenic regions in patients with tuberous sclerosis.19,20 PET remains of value in the diagnostic work-up of patients with epilepsy because of its simplicity, speed of performance, accuracy, and comfort in patients. There are usually no concerns for claustrophobic or overweight patients or those who have metal implants. Radioactivity is not commonly an issue because of its low concentration and the short half-life of positron-emitting isotopes.
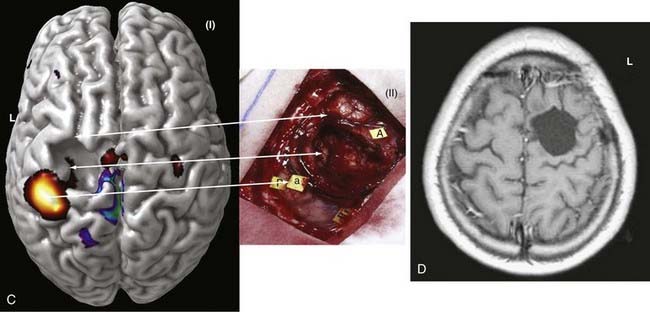
In summary, functional brain-imaging techniques can support the presurgical diagnosis, especially in patients with nonlesional MRI findings or nonlateralizing or localizing scalp EEG recordings. Intraoperative cortical mapping is facilitated because eloquent areas are mapped preoperatively and coregistered to the surgical navigational system. They aid in planning surgery and can serve as a basis for discussion with patients and families (Fig. 55-9).
Magnetoencephalography and Magnetic Source Imaging in the Presurgical Evaluation for Epilepsy
Fundamentals of Neuromagnetism
MEG measures the extracranial magnetic field activity arising from the electric currents produced in the brain. This activity arises largely from intracellular neuronal currents in the dendrites of tangentially oriented cortical pyramidal cells. MEG represents the magnetic signals corresponding to the brain’s electrical activity recorded with standard EEG.21–25 MEG is based on a fundamental principle of electromagnetism, namely, that for every electric current, there is a corresponding magnetic field. Applying the “right-hand rule” of electromagnetism, for every electric dipole, the corresponding magnetic field wraps around the dipole with the field flowing toward or away from the MEG detector in a counterclockwise fashion.26 Much like its EEG counterpart, the majority of the magnetic signal produced by the brain arises from aligned groups of pyramidal cells in the six-layered cerebral cortex.27 Because the detectors that measure the MEG signals are usually aligned perpendicular to the skull, MEG best detects the fields that arise from tangentially oriented current dipoles perpendicular to the cortical surface.25,26,28,29
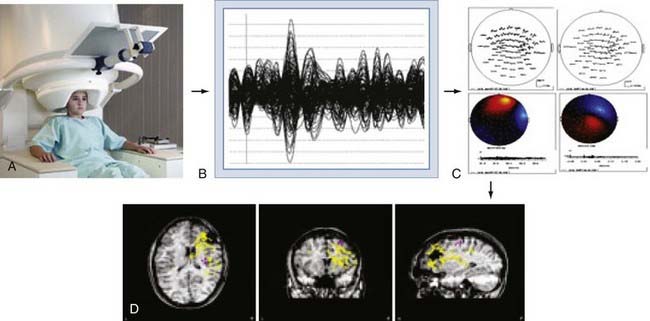
The brain’s magnetic fields are incredibly small, typically in the pico-tesla (10−12) range. In contrast, the magnetic field activity of the earth itself is approximately 1 billion times (109) larger, ambient environmental sources such as room lighting and electric power lines are 105 to 106 times larger, and even those of the human heart are 102 times larger. SQUID detectors2 must be used to measure these tiny magnetic fields (see elsewhere for further details25,27). These detectors are kept at very cold temperatures by bathing them in liquid helium in a magnetically shielded Dewar flask. Early MEG systems consisted of a single SQUID detector or small arrays of 3 to 7 detectors that were moved about the head to different positions during a recording session lasting several hours.30 This would be equivalent to recording scalp EEG signals by moving a single EEG electrode from site to site on the scalp. Modern systems (Fig. 55-10A) consist of a whole-head helmet containing 36 to 240 or more detectors that simultaneously record MEG signals, again much the way that an EEG electrode montage records EEG signals from multiple brain sites simultaneously. These large sensor arrays allow recording of whole-brain activity, thereby providing excellent temporal and spatial resolution of brain activity.
Magnetic Source Imaging
MEG signals are collected as traces of data much the way that EEG traces are collected. The majority of MEG data represent background brain activity and are of little clinical interest. However, MEG activity that is either provoked by a stimulus (evoked potential)31–34 or arises from epileptiform spike activity is of primary interest. Identification of these evoked or spontaneous potentials is performed by off-line review of the individual MEG tracings. This requires manual review by an experienced technician or physician, or it can be done with automated spike detection algorithms.35–37 Manual review with selection of spikes is the most reliable and commonly used method. Automated detection programs often identify more artifactual spikes, so automatically detected spikes must be interpreted with some caution. Once a spike has been detected, the MEG tracings from all channels for the time period of that spike are displayed in the anatomic location of the sensor from which it was detected, thereby creating a “spike map.” This map is then subjected to a process of dipole modeling in which various mathematical solutions are tested to identify the single best location for the current dipole that matches the pattern of MEG traces recorded around the brain. The most commonly used method is the “single equivalent dipole” (SED) model, in which it is assumed that any given pattern arises from a single brain area and that simultaneous spikes in distinct regions do not occur. More complex models involving other estimation methods, such as local minima, known anatomic features, and consideration of the skull as a multilayered structure with varying conductivities,38–41 have been used more recently, although none have proved clearly superior in a clinical setting, and the SED model is the only Food and Drug Administration–approved algorithm for routine clinical use.
Once the MEG dipoles have been localized, they are superimposed on a brain MRI scan that has been coregistered to the MEG channels based on a set of fiducial markers to create a visual dipole map of the brain. This process is commonly referred to as magnetic source imaging (MSI) and represents the primary method by which MEG data are used in clinical and research settings. For most applications, the terms MEG and MSI are functionally interchangeable, although MSI is the preferred term for the complete process of data processing and display. An overview of this process is shown in Figure 55-10.
Magnetic fields are not significantly altered by passing in and out of the skull, whereas electric fields are “smeared” by conduction through the volume of the multilayered skull, analogous to the diffraction or bending of light going from air to water. Thus, localization with MSI is generally thought to be more spatially accurate and reliable than EEG source localization.42 Recent investigations using more complex modeling methods are challenging this assumption, however.43–45
Uses of Magnetic Source Imaging
Early investigators saw that the clinical utility of MEG, for instance in comparison to EEG, would depend on the specific situation. Because MSI depends on the identification of event-specific spike activity, it is primarily useful for identifying the location of evoked brain activity or interictal epileptiform discharges. MSI has proved to be a highly reliable and reproducible method to identify and map the primary sensory cortex.30,46–49 It can map the sensory homunculus with extreme precision and is superior to fMRI in this regard.30,46,50–52 Similarly, MSI has been used to identify regions of receptive and expressive language.53–57 These studies rely on the later component of the MEG signal in response to an evoked stimulus because the early component (100 msec) represents activation of primary auditory cortex whereas the late component (150 to 700 msec) is specific to brain regions involved in language processing. Several language paradigms have been developed that primarily identify receptive language areas, and some groups have confirmed the results with intraoperative or intracranial EEG (ICEEG) language stimulation mapping. MSI has been proposed as an alternative to the intracarotid sodium amobarbital test for determining hemispheric language dominance.57,58 Reliable reproduction of these methods has proved challenging, with significant patient-to-patient variability, although this method is promising. Because of the relative lack of availability of MSI and the inability to test for memory preservation, it is unlikely that MSI will supplant the intracarotid sodium amobarbital (Wada) test completely in the near future.
MSI has also been used as a method to identify brain regions involved in higher cortical functions such as visual and thought processing.47,56 This application closely parallels work that has been carried out with fMRI- or EEG-based event-related potentials. Because MSI provides temporal resolution superior to that achieved with fMRI and measures neural activity rather than blood flow–related changes, it may be superior to fMRI for source localization. MSI has also been used in the study of psychiatric disorders.59,60
Epilepsy
Since its earliest introduction, a principal application of MSI has been to identify seizure foci.33,61 In approximately 30% of patients, anticonvulsant medications cannot control their epilepsy, and about half of these patients are probably good candidates for seizure surgery. Focal excisional surgery has the highest chance of curing patients with intractable epilepsy, but it depends on accurate identification of the zone of seizure origin. The use of ICEEG monitoring with depth electrodes and subdural or epidural grid electrodes has resulted in a 36% increase in the number of patient who can benefit from seizure surgery. However, ICEEG monitoring is invasive, carries major surgical risks, and is time-consuming. The principal advantage of prolonged ICEEG monitoring is capture of stereotypic seizures on EEG and localization of the zone of origin with great precision. Although MSI can record true ictal events,49,61–64 this is relatively rare because of the practical limitations of prolonged recording in an MEG unit. MSI does routinely capture interictal epileptiform discharges (“spikes”), which represent spontaneous brain irritability and often originate near the zone of seizure origin.36,58,65–68 Thus, MSI has been used to identify the ictal zone indirectly and to help guide the placement of ICEEG electrodes for definitive identification of the ictal onset region.36,45,51,58,65–68
The accuracy of MEG localization has best been validated by studies comparing MEG spikes with simultaneously recorded ICEEG. These studies have demonstrated that a 2- to 4-cm2 region (two to three EEG contacts on a standard grid) on the cortical surface must be activated to detect an MEG spike69 and greater than a 6-cm2 region for spikes in the basal temporal lobe.70 Controlled studies with implanted dipoles have demonstrated that MEG-identified localizations were within about 1 to 2 cm of the true location, with greater errors for deeper sources.71 For afterdischarge spikes recorded simultaneously on ICEEG with implanted subdural grids, MEG localization was within 12 mm72 for lateral temporal spikes but up to 4 cm away for mesial temporal source spikes.73 The large amount of tissue that must be activated on the medial temporal lobe indicates that few MSI spikes will reflect activation of the mesial temporal lobe or other deep structures, and therefore the MSI results are limited to regions that can be accurately sampled, namely, detection and localization of spikes close to the dorsolateral cortical surface. This does not mean that MEG has no predictive value for mesial frontal or temporal lobe epilepsy but simply that the source localizations cannot be relied on to identify the ictal zone with the same confidence that can be applied in dorsolateral neocortical cases.
Mesial Temporal Lobe Epilepsy
Mesial temporal lobe epilepsy originates from deep structures such as the amygdala and hippocampus, which are situated at least 3 to 4 cm below the cortical surface. Because of the intrinsic limitation of MEG for detecting such deep sources, MEG/MSI has not proved to be particularly useful for accurately identifying these deep sources.74 However, correlative studies have implicated the orientation of the MEG dipoles as a potential predictor of outcome after temporal lobe surgery. In one study, correlation with ICEEG demonstrated that patients with vertically oriented anterior temporal dipoles tended to have mesial temporal seizure onsets whereas those with horizontally oriented dipoles had more basal or temporal polar origins.65,75 Posterior vertically oriented dipoles were strongly correlated with lateral temporal lobe (neocortical) onset. This study suggests that dipole orientations are of greater value than actual dipole localization for temporal lobe epilepsy. Other studies have suggested that patients with more than 70% of the MEG spikes localized to the anterior temporal lobe are much more likely to become seizure free after lobectomy than are patients with spikes in the posterior temporal lobe.76
Neocortical Epilepsy
The application of MSI to epilepsy has been best studied in patients with neocortical epilepsy. Because most neocortical epilepsy arises from sources on the surface or perisylvian area, their shallow location is ideal for detection by MEG. Several groups have reported their experiences and clinical outcomes with MEG for detection of neocortical seizure zones by comparing the findings with ictal localization by ICEEG or seizure outcome after resection (or both). For example, a study of 11 children with neocortical epilepsy demonstrated that the principal anatomic location of the MSI spikes correlated with the ictal onset zone determined by ICEEG grids in 10 of 11 children, with 9 of 11 experiencing a greater than 90% reduction in seizures after resection.77 Similar studies have provided similar conclusions, namely, that presurgical MSI data generally correlate with the zone of seizure origin as determined by ICEEG or by seizure-free outcomes.49,78–83 However, the majority of these studies have a sample size of 4 or fewer patients, are retrospective in nature, and do not define the exact role of MSI in the evaluation of a patient with epilepsy. It is not clear whether the MSI data altered the treatment plan, resulted in better localization, or had an impact on surgical resection. It is also not clear from the majority of these studies whether MSI supplies novel, nonredundant data or whether it truly has an effect on surgical decision making or outcome. In fact, a recent systematic review indicated that the currently available medical literature does not clearly support a causal relationship between the use of MSI and improved seizure-free outcomes in patients with intractable epilepsy.45
More recent, larger series have attempted to better define the exact role and utility of MSI in neocortical epilepsy. Mamelak and colleagues evaluated the correlation between MSI spike density and ICEEG ictal localization.51 In 23 patients undergoing MSI and then ICEEG, ICEEG correctly identified the zone of seizure origin in 16 (70%). MSI demonstrated a pattern of densely clustered spikes, and the zone of seizure origin was localized to the same lobe as the MSI spikes in all cases. In contrast, when a dense clustering pattern was not observed, ICEEG failed to localize the zone of seizure origin. In 3 patients (8%) MEG provided novel localization information not available from other presurgical modalities that had a direct impact on the surgical outcome by altering electrode placement. These findings suggest that when MSI demonstrates tightly clustered dipoles, there is a high probability that ICEEG will correctly localize a zone of seizure origin and portend a subsequent good surgical outcome. In contrast, when MSI demonstrates diffuse spikes, the chances of discrete localization with ICEEG are low. In this regard, MSI may be useful for excluding poor surgical candidates and confirming good surgical candidates to yield better overall surgical results.
A similar study was performed in 22 children with normal MRI findings who underwent resective surgery.84 In this series, 77% of the children had a good (Engel class IIA or better) outcome, but only 36% of them became seizure free. Analysis of this subgroup indicated that all seizure-free patients had a tight cluster of MSI dipoles in the resection area as determined by ICEEG. In contrast, freedom from seizures was not achieved in any patient who had bilateral MSI dipole clusters. When the MSI cluster was confined to fewer than five adjacent electrodes by ICEEG, all patients became seizure free, in contrast to the 7 patients in whom the MSI cluster extended beyond five electrodes. Other studies have confirmed that when 90% of the MSI spikes occur in one focal area, this overlaps the seizure zone and predicts a good outcome.85,86 Taken as a whole, these studies suggest that MSI is valuable for predicting the ability of ICEEG to identify a resectable seizure focus but do not indicate that MSI can be used as a substitute for ICEEG to identify a seizure focus. Furthermore, these data indicate that if MSI spikes are diffusely distributed rather than tightly grouped, the seizure zone is far less likely to be correctly identified, and a seizure-free outcome after resection is much less likely.
Only recently have prospective, blinded, crossover, controlled clinical studies of MSI in epilepsy been conducted. Knowlton and associates evaluated 49 patients who completed both MSI and ICEEG studies in a prospective “intent-to-treat” design.87 All patients were initially selected for ICEEG coverage by a consensus surgical conference, only after which the results of the MSI studies were made available. MSI data could be used only to supplement surgical coverage, but not alter it. Patients were then evaluated for seizure outcome, as well as the ability of MSI and ICEEG to localize the seizure focus. Based on their analysis, which included 55% of patients with neocortical epilepsy and 37% with medial temporal lobe epilepsy, they determined that MSI had a positive predictive value of 82% to 90% for seizure localization when compared with ICEEG localization. Of note, they included several epilepsy patients with completely negative ICEEG studies who still had successful surgery based on concordant data from other modalities. Thus, some of the patients underwent surgical resection based on concordant noninvasive data without identification of the ictal zone by ICEEG. These data do not indicate that MSI spike localization was accurate enough to be used for tailored neocortical resection, so MSI cannot be used in place of ICEEG for neocortical epilepsy. The general consensus remains that MSI is not sufficiently accurate at present to replace ICEEG for identification of the seizure focus.
A more recent study by Sutherling and coworkers evaluated 69 patients being evaluated for potential ICEEG studies in a prospective, blinded, basic “intent-to-treat” design.88 Like the study by Knowlton and associates, a consensus surgical decision was made on the basis of preoperative data that excluded MSI. Once the surgical decision was made, the MSI data were disclosed to the conference attendees, and a new consensus decision was made. The subsequent analysis determined whether MSI changed the initial surgical decision and, if so, in what fashion. Additional features of this study versus the previous Knowlton study were the basic intention-to-treat approach and the ability to reduce or avoid ICEEG, as well as to add electrodes. MSI provided nonredundant information in 23 patients (33%). Incorporation of MSI data into the surgical decision making resulted in the addition of electrodes in 9 patients (13%) and changed the surgical decision in 14 (20%). Sixteen patients (23%) were scheduled for ICEEG coverage that differed from that decided before the inclusion of MSI data. Twenty-six completed ICEEG and 30 completed resection or vagus nerve stimulator implantation, including 15 patients for whom MSI changed the decision. Additional electrodes placed in 4 patients covered the correct lobe in 3 and the sublobar ictal onset zone in 2. The addition of MSI data avoided contralateral electrodes in 2 patients. In 9 patients in whom MSI changed the decision and who had adequate postresection follow-up, it was determined that the MSI data contributed to improved outcomes in 3 patients. These data indicate that MSI can provide nonredundant, useful interictal localization information in approximately a third of patients undergoing work-up for neocortical epilepsy and that it affects outcome in approximately 26% of these patients without any increase in complications. This study shows the utility of MSI in the presurgical evaluation of the subset of patients with suspected neocortical epilepsy, principally by improving the yield of ICEEG. Like previous studies, it also indicated that MSI localizations cannot be used to perform tailored neocortical resections.
Landau-Kleffner Syndrome
Landau-Kleffner syndrome (LKS) is characterized by regression of language skills in children with previously normal development. LKS is caused by seizures arising from the perisylvian language cortex. Identification of LKS and treatment with either anticonvulsant agents or surgery can result in reversal of the symptoms. Because of the location of seizures arising from the perisylvian region, MSI has proved to be a very useful tool for identification of patients with LKS because it is better suited than EEG to identify interictal spikes arising from this location.89,90 In light of this, MSI is recommended for the evaluation of all patients suspected of having LKS.
The Future of Magnetic Source Imaging
Unlike EEG, MRI, or even PET, MSI has not yet been proved to be an essential component of the presurgical evaluation of the majority of patients with intractable epilepsy. Certainly it has not been proved to be able to replace ICEEG, one of the main hopes for MSI when it was first developed. Even though multiple reports indicate the potential utility of MSI for the presurgical evaluation of epilepsy, the long-term future of routine MSI remains uncertain for several reasons. First, MSI is a very expensive technology that costs in the range of several million dollars, in addition to the need for considerable technical expertise with relatively low patient throughput. It is possible that improved EEG source and head modeling may be able to accomplish similar goals as MSI at a fraction of the cost.91,92 Second, MSI, unlike long-term EEG or ICEEG, does not typically record seizures, but rather a limited sample of interictal spikes, which may correlate with the seizure focus but do not clearly define it. In the absence of true ictal recordings, MSI will remain predominantly a concordant rather than a definitive tool for seizure localization. Finally, for a technology to be of utility, it should provide information that is not available with other methods. Far less expensive and more widely available technologies such as ictal SPECT, PET, MRS, and MRI often provide concordant data that are as useful as those provided by MSI. Because MSI has excellent temporal resolution, it is likely to remain nonredundant for the foreseeable future. However, technology that provides novel information in about 33% of cases but is economically prohibitive may not remain a viable option in the long run unless more efficient use is made of this technology by referring a larger number of patients to a limited number of centers.
Ictal Single-Photon Emission Computed Tomography for Definition of the Seizure Onset Zone
Partial or localization-related epilepsy is characterized by recurrent and unprovoked focal seizure activity and is the most common seizure disorder.93–95 More than 90% of the incident cases of epilepsy in adults involve focal seizures. Individuals with partial epilepsy may experience focal sensory, focal motor (including temporal lobe automatisms), or secondarily generalized seizures. Approximately 30% to 40% of patients with newly diagnosed epilepsy will experience medically refractory seizures that are physically and socially disabling.93 A minority of patients who fail to respond to the initial antiepileptic drug regimen will be rendered seizure free with “newer” medical treatments.96–98 Epilepsy surgery is an effective and safe form of therapy for selected patients with intractable localization-related epilepsy.93,94,99–104 Patients with mesiobasal limbic epilepsy and focal seizures related to foreign tissue lesional pathology may be favorable candidates for epilepsy surgery. Patients with these surgically remediable epileptic syndromes almost invariably experience a significant reduction in seizure tendency after focal cortical resection and excision of the pathologic findings underlying the epileptogenic zone.94,99,100 The majority of these patients experience a significant reduction in seizure tendency after surgical ablation of the epileptic brain tissue.99–108 The hallmark pathology of medial temporal lobe epilepsy is mesial temporal sclerosis.106,108–110 The surgically excised hippocampus in these patients almost invariably shows focal cell loss and gliosis.105,106,108–110 Patients with lesional epilepsy may have a primary brain tumor, vascular anomaly, or a malformation of cortical development (MCD).102,103,106,107,110 The common surgical pathologies encountered in patients with lesional epilepsy include low-grade glial neoplasm, cavernous hemangioma, and focal cortical dysplasia.102,103 Individuals with mesial temporal sclerosis and lesional pathology usually have abnormal findings on structural MRI, and the seizure types are classified as substrate-directed partial epilepsy.94,102,110–112 MRI in these individuals may detect a specific intra-axial structural abnormality that may suggest the probable site of seizure onset and the surgical pathology.112 MRI has a pivotal role in the selection and evaluation of patients for alternative forms of therapy.99,102,105,108–110
The rationale for presurgical evaluation is to identify the site of ictal onset and initial seizure propagation (i.e., the epileptogenic zone) and determine the probable pathologic findings underlying the epileptic brain tissue.104,105 In patients with an MRI-identified foreign tissue lesion or unilateral mesial temporal sclerosis, the purpose of electroclinical correlation is essentially to confirm the epileptogenicity of the structural abnormality.105,107,108,110 Demonstration of concordance between the pathologic substrate and the ictal onset zone indicates a highly favorable operative outcome in selected individuals. Approximately 80% of patients with unilateral mesial temporal sclerosis, a low-grade glial neoplasm, or a cavernous hemangioma are rendered seizure free after surgical treatment.94,99,103,105–108,110 More than 90% of patients with these pathologic findings will experience an excellent surgical outcome (i.e., auras only or rare nondisabling seizures).99 The operative outcome is distinctly less favorable in individuals with focal cortical dysplasia and other MCDs.111 The most common operative strategy in patients with intractable partial epilepsy involves focal cortical resection of the epileptogenic zone with excision of the surgical pathology.102,103 The goals of surgical treatment are to render the individual seizure free and allow the patient to become a participating and productive member of society.93,94,101
Non–Substrate-Directed Partial Epilepsy
The seizure types in patients with localization-related seizure disorders and normal findings on MRI are classified as non–substrate-directed partial epilepsy.112 The anatomic location of the epileptogenic zone in these individuals commonly involves the neocortex (i.e., extrahippocampal).110,112 The most frequent site of seizure onset in patients with neocortical nonlesional partial epilepsy is the frontal lobe.107,110 The surgical pathology in these patients includes gliosis, focal cell loss, MCD, or no histopathologic alteration.110 MRI may rarely be indeterminate in selected lesional pathology, such as focal cortical dysplasia.112 Only a minority of patients with neocortical, extratemporal seizures are rendered seizure free after surgical treatment.107,110 An estimated 20% to 30% of these patients with extratemporal, mainly frontal lobe seizures will enter seizure remission after focal cortical resection.110 An important reason for the unfavorable operative outcome in patients with non–substrate-directed partial epilepsy is the inherent difficulty in identifying the epileptogenic zone.110 The potential limitations of interictal and ictal extracranial EEG and ICEEG monitoring in patients with partial seizures of extratemporal origin have been well defined.110 The anatomic region of seizure onset may represent a continuum in these patients that lends itself to incomplete focal resection of the epileptogenic zone. A large resection increases the likelihood of rendering the patient seizure free, but it also increases the potential for operative morbidity.110,112 Advances in peri-ictal imaging (see later) have assisted in the selection of operative candidates with non–substrate-directed partial epilepsy, altered the preoperative evaluation, and tailored the surgical excision.113–118
Single-Photon Emission Computed Tomography
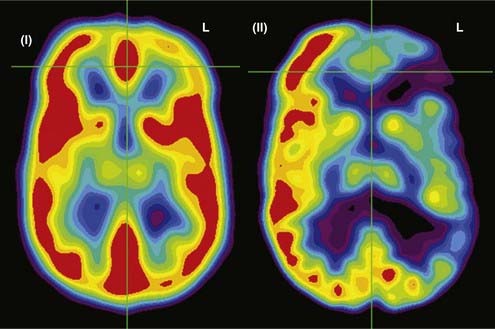
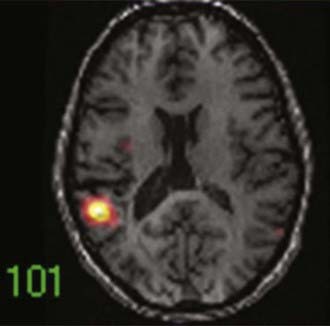
SPECT is most appropriate for peri-ictal imaging in patients with partial epileptic syndromes being considered for epilepsy surgery.113,117,119–129 There is a broad consensus that ictal SPECT studies are superior to interictal images (Fig. 55-11) in localization-related epilepsy.117,119,120 SPECT studies involve CBF imaging with radiopharmaceuticals, principally either technetium 99m-hexamethylpropyleneamine oxime (99mTc-HMPAO) or 99mTc-bicisate, that have rapid first-pass brain extraction, with maximum uptake being achieved within 30 to 60 seconds of an intravenous injection.113,119–121,126 These studies may produce a “photograph” of the peri-ictal cerebral perfusion pattern that was present soon after the injection (Fig. 55-12).121 SPECT images can be acquired up to 4 hours after termination of the seizure so that the individual patient can recover from the ictus before being transported to the nuclear medicine laboratory. SPECT studies have an important clinical application in potential identification of epileptic brain tissue when the remainder of the noninvasive presurgical evaluation is unable to lateralize or localize the site of seizure onset.121
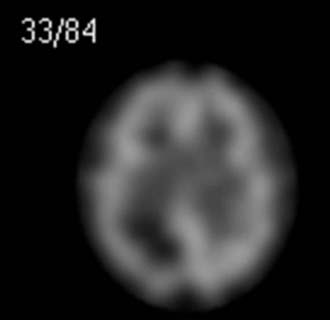
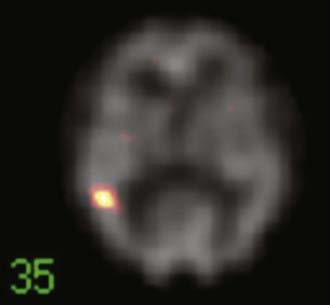
The initial blood flow SPECT studies in patients with intractable partial epilepsy involved interictal imaging, which variably detected focal hypoperfusion in the region of the epileptogenic zone (see Fig. 55-11).114 Interictal SPECT images have proved to have low sensitivity and a relatively high false-positive rate in patients with temporal lobe epilepsy.114 Interictal SPECT has also been shown to have a low diagnostic yield in patients with extratemporal seizures.117 Ictal SPECT studies have been confirmed to be useful in patients with temporal lobe epilepsy for identification of a region of focal hyperperfusion.117 The rationale for interictal SPECT at present is to serve as a reference baseline study for interpretation of the ictal SPECT images. The diagnostic yield of ictal SPECT has been established to be superior to that of interictal SPECT in patients being considered for surgical ablation procedures. The recent development of stabilized radiotracers that do not require mixing immediately before injection, such as 99mTc-bicisate, has made ictal SPECT more practical in patients with extratemporal seizures, which are often not associated with an aura and may have a shorter seizure duration.126 A potential limitation of ictal SPECT is that the spatial resolution of these studies is inferior to that of PET.114
Subtraction Ictal Single-Photon Emission Computed Tomography Coregistered to Magnetic Resonance Imaging
An imaging paradigm using computer-aided subtraction ictal SPECT coregistered to MRI (SISCOM) has been introduced in patients with intractable partial epilepsy.113,121–129 SISCOM is a recent innovation in neuroimaging that may be useful in the evaluation of patients with non–substrate-directed partial epilepsy. The localized alteration in blood flow demonstrated with SISCOM may be intimately associated with the epileptogenic zone121 (Figs. 55-13 and 55-14). Subtracting normalized and coregistered ictal and interictal SPECT images and then matching the resultant difference in images to high-resolution MRI for anatomic correlation has been shown to be a reliable indicator of localization of the epileptogenic zone in patients with localization-related epilepsy.122–125 The technique used at the Mayo Clinic that was introduced by O’Brien and colleagues has compared favorably with traditional visual analysis of the interictal and ictal images.121 SISCOM in a series of 51 patients had a higher rate of localization (88.2% versus 39.2%, P < .0001), had better interobserver agreement, and was a better predictor of surgical outcome than visual inspection of the interictal and ictal images.121 The study demonstrated the inherent problems with visual interpretation of either peri-ictal or interictal SPECT studies alone.
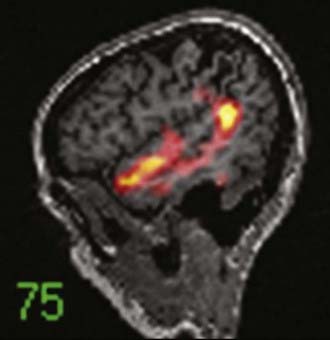
The methodology used for SISCOM at the Mayo Clinic involves coregistering the interictal and the ictal SPECT study by matching the surface points on the cerebral binary images of the two procedures.122,125,126 The normalized interictal image is subtracted from the normalized ictal image to derive the difference (subtraction) in CBF related to the partial seizure. Thresholding of the subtraction image to display only the pixels with intensities greater than 2 standard deviations (SD) above zero is performed. Finally, images with intensities greater than 2 SD are coregistered to the structural MRI scan. After the implantation of subdural electrodes for chronic ICEEG monitoring, the electrode positions can be segmented from a spiral CT scan and coregistered to the SISCOM image.123 This allows determination of the relationship between the localized alteration in peri-ictal blood flow and the ictal onset zone.
The SISCOM region of alteration in blood flow is a surrogate for localization of the epileptogenic zone independent of the pathologic finding.128 Clinical parameters that are significant in determining the diagnostic yield of SISCOM include the duration of the seizure and the length of time from ictal onset to injection.113,121 The seizure should be at least 5 to 10 seconds in duration, and the time after seizure onset should be less than 45 seconds.121 The SISCOM findings also correlate with the operative outcome. Patients with a SISCOM alteration concordant with the epileptogenic zone are most likely to experience a significant re-education in seizure tendency if the focal cortical resection includes the region of change in peri-ictal blood flow.121,128 Disadvantages of a SISCOM study include the need for hospitalization and long-term EEG monitoring, the use of radioisotopes for two imaging procedures, and the required presence of habitual seizure activity. Indications for SISCOM in patients undergoing presurgical evaluation include non–substrate-directed partial epilepsy and conflicting findings on noninvasive evaluation. SISCOM may be used to identify a “target” for the placement of ICEEG electrodes.123 The presence of a SISCOM alteration may obviate the need for ICEEG recordings in selected patients. For example, patients with non–substrate-directed partial epilepsy of temporal lobe origin may not require chronic ICEEG monitoring if the extracranial ictal EEG pattern and peri-ictal SPECT studies are concordant. SISCOM also improves the diagnostic yield of postictal studies in patients with intractable partial epilepsy.124
The superiority of SISCOM in localizing the epileptogenic zone, particularly in extratemporal epilepsy, has previously been demonstrated.128 The prognostic importance of the SISCOM focus in patients undergoing focal cortical resection for partial epilepsy of extratemporal origin has been evaluated.128 O’Brien and colleagues in a previous series evaluated the operative outcomes of 36 patients with extratemporal epilepsy who underwent a SISCOM study before surgery.128 The presence of a localizing SISCOM alteration concordant with the epileptogenic zone was a favorable predictor of an excellent surgical outcome (P < .05).128 Eleven of 19 patients (57.9%) with a concordant SISCOM focus and 3 of 17 patients (17.6%) with a nonlocalizing or discordant SISCOM focus, respectively, were rendered seizure free or experienced only nondisabling seizures. Approximately three quarters of the patients with a localized SISCOM abnormality had normal structural MRI findings. In addition, this study demonstrated that the extent of resection of the SISCOM focus was also of prognostic importance (P < .05).128 Failure to resect the neocortical region intimately associated with the localized change in blood flow concordant with the ictal onset zone was a predictor of an unfavorable operative outcome.128
Assaf BA, Karkar KM, Laxer KD, et al. Magnetoencephalography source localization and surgical outcome in temporal lobe epilepsy. Clin Neurophysiol. 2004;115:2066.
Assaf BA, Karkar KM, Laxer KD, et al. Ictal magnetoencephalography in temporal and extratemporal lobe epilepsy. Epilepsia. 2003;44:1320.
Barkley GL. Controversies in neurophysiology. MEG is superior to EEG in localization of interictal epileptiform activity: Pro. Clin Neurophysiol. 2004;115:1001.
Barth DS. The neurophysiological basis of epileptiform magnetic fields and localization of neocortical sources. J Clin Neurophysiol. 1993;10:99.
Genow A, Hummel C, Scheler G, et al. Epilepsy surgery, resection volume and MSI localization in lesional frontal lobe epilepsy. Neuroimage. 2004;21:444.
Iwasaki M, Nakasato N, Shamoto H, et al. Surgical implications of neuromagnetic spike localization in temporal lobe epilepsy. Epilepsia. 2002;43:415.
Knake S, Halgren E, Shiraishi H, et al. The value of multichannel MEG and EEG in the presurgical evaluation of 70 epilepsy patients. Epilepsy Res. 2006;69:80.
Knowlton RC, Elgavish R, Howell J, et al. Magnetic source imaging versus intracranial electroencephalogram in epilepsy surgery: a prospective study. Ann Neurol. 2006;59:835.
Knowlton RC, Shih J. Magnetoencephalography in epilepsy. Epilepsia. 2004;45(suppl 4):61.
Lau M, Yam D, Burneo JG. A systematic review on MEG and its use in the presurgical evaluation of localization-related epilepsy. Epilepsy Res. 2008;79:97.
Lee D, Sawrie SM, Simos PG, et al. Reliability of language mapping with magnetic source imaging in epilepsy surgery candidates. Epilepsy Behav. 2006;8:742.
Makela JP, Forss N, Jaaskelainen J, et al. Magnetoencephalography in neurosurgery. Neurosurgery. 2006;59:493.
Mamelak AN, Lopez N, Akhtari M, et al. Magnetoencephalography-directed surgery in patients with neocortical epilepsy. J Neurosurg. 2002;97:865.
Minassian B, Otsubo H, Weiss S, et al. Magnetoencephalographic localization in pediatric epilepsy surgery: comparison with invasive intracranial electroencephalography. Ann Neurol. 1999;46:627.
Morrell F, Whisler W, Smith M, et al. Landau-Kleffner syndrome: treatment with subpial intracortical transection. Brain. 1995;1:1529.
Nakamura A, Yamada T, Goto A, et al. Somatosensory homunculus as drawn by MEG. Neuroimage. 1998;7:377.
O’Brien O’Brien TJ, So EL, Mullan BP, et al. Subtraction ictal SPECT co-registered to MRI improves clinical usefulness of SPECT in localizing the surgical seizure focus. Neurology. 1998;50:445.
Papanicolaou AC, Castillo EM, Billingsley-Marshall R, et al. A review of clinical applications of magnetoencephalography. Int Rev Neurobiol. 2005;68:223.
Papanicolaou AC, Simos PG, Castillo EM, et al. Magnetocephalography: a noninvasive alternative to the Wada procedure. J Neurosurg. 2004;100:867.
Ramachandran Nair R, Otsubo H, Shroff MM, et al. MEG predicts outcome following surgery for intractable epilepsy in children with normal or nonfocal MRI findings. Epilepsia. 2007;48:149.
Sato S, Balish M, Muratore R. Principles of magnetoencephalography. J Clin Neurophysiol. 1991;8:144.
Smith JR, King DW, Park YD, et al. A 10-year experience with magnetic source imaging in the guidance of epilepsy surgery. Stereotact Funct Neurosurg. 2003;80:14.
Sutherling WW, Crandall PH, Darcey TM, et al. The magnetic and electric fields agree with intracranial localizations of somatosensory cortex. Neurology. 1988;38:1705.
Sutherling W, Mamelak AN, Thyerlei D, et al. Influence of magnetic source imaging for planning intracranial EEG in epilepsy. Neurology. 2008;71:97.
Yoshinaga H, Ohtsuka Y, Watanabe Y, et al. Ictal MEG in two children with partial seizures. Brain Dev. 2004;26:403.
1 Cascino GD. Surgical treatment for extratemporal epilepsy. Curr Treat Options. Neurol. 2004;6:257.
2 Jayakar P, Dunoyer C, Dean P, et al. Epilepsy surgery in patients with normal or nonfocal MRI scans: integrative strategies offer long-term seizure relief. Epilepsia. 2008;49:758.
3 Mascott CR. Surgical planning: image guidance and epilepsy surgery. In: Baltuch G, Villemure J-G, editors. Operative Techniques in Epilepsy Surgery. Heidelberg, Germany: Thieme, 2009.
4 Wolf RL, Alsop DC, Levy-Reis I, et al. Detection of mesial temporal lobe hypoperfusion in patients with temporal lobe epilepsy by use of arterial spin labeled perfusion MR imaging. AJNR Am J Neuroradiol. 2001;22:1334.
5 Haacke EM, Mittal S, Wu Z, et al. Susceptibility-weighted imaging: technical aspects and clinical applications, part 1 and 2. AJNR Am J Neuroradiol. 2009;30:19.
6 Madan N, Grant PE. New directions in clinical imaging of cortical dysplasias. Epilepsia. 2009;50(suppl 9):9.
7 Glenn OA, Barkovich J. Magnetic resonance imaging of the fetal brain and spine: an increasingly important tool in prenatal diagnosis: part 2. AJNR Am J Neuroradiol. 2006;27:1807.
8 Zijlmans M, de Kort GA, Witkamp TD, et al. 3T versus 1.5T phased-array MRI in the presurgical work-up of patients with partial epilepsy of uncertain focus. J Magn Reson Imaging. 2009;30:256.
9 Lawes IN, Barrick TR, Murugam V, et al. Atlas-based segmentation of white matter tracts of the human brain using diffusion tensor tractography and comparison with classical dissection. Neuroimage. 2008;39:62.
10 Mori S, Wakana S, Nagae-Poetscher L, et al. MRI Atlas of Human White Matter. Amsterdam: Elsevier; 2005.
11 Nimsky C, Ganslandt O, Hastreiter P, et al. Intraoperative diffusion-tensor MR imaging: shifting of white matter tracts during neurosurgical procedures—initial experience. Radiology. 2005;234:218.
12 Babb TL, Brown WJ. Pathological findings in epilepsy. In: Engel JJ, editor. Surgical Treatment of the Epilepsies. New York: Raven Press; 1987:511.
13 Bronen RA, Fulbright RF, King D, et al. Qualitative MR imaging of refractory temporal lobe epilepsy requiring surgery: correlation with pathology and seizure outcome after surgery. AJR Am J Roentgenol. 1997;169:875.
14 Toga WT, Mazziotta JC, editors. Brain Mapping. The Systems. San Diego, CA: Academic Press, 2000.
15 Deblaere K, Backes WH, Hofman P, et al. Developing a comprehensive presurgical functional MRI protocol for patients with intractable temporal lobe epilepsy: a pilot study. Neuroradiology. 2002;44:667.
16 Reinges MH, Krings T, Meyer PT, et al. Preoperative mapping of cortical motor function: prospective comparison of functional magnetic resonance imaging and [15O]-H2O-positron emission tomography in the same co-ordinate system. Nucl Med Commun. 2004;25:987.
17 Salamon N, Kung J, Shaw SJ, et al. FDG-PET/MRI coregistration improves detection of cortical dysplasia in patients with epilepsy. Neurology. 2008;71:1594.
18 Griffith HR, Perlman SB, Woodard AR, et al. Preoperative FDG-PET temporal lobe hypometabolism and verbal memory after temporal lobectomy. Neurology. 2000;54:116.
19 Mathern GW. Challenges in the surgical treatment of epilepsy patients with cortical dysplasia. Epilepsia. 2009;50(suppl 9):45.
20 Chandra PS, Salamon N, Huang J, et al. FDG-PET/MRI coregistration and diffusion-tensor imaging distinguish epileptogenic tubers and cortex in patients with tuberous sclerosis complex: a preliminary report. Epilepsia. 2006;47:1543.
21 Baumgartner C, Deecke L. Magnetoencephalography in clinical epileptology and epilepsy research. Brain Topogr. 1990;2:203.
22 Cohen D. Magnetoencephalography: detection of the brain’s electrical activity with a superconducting magnetometer. Science. 1972;175:664.
23 Hamalainen MS. Basic principles of magnetoencephalography. Acta Radiol Suppl. 1991;377:58.
24 Hari R, Lounasmaa OV. Recording and interpretation of cerebral magnetic fields. Science. 1989;244:432.
25 Pizzella V, Romani GL. Principles of magnetoencephalography. Adv Neurol. 1990;54:1.
26 Sato S, Balish M, Muratore R. Principles of magnetoencephalography. J Clin Neurophysiol. 1991;8:144.
27 Barth DS. The neurophysiological basis of epileptiform magnetic fields and localization of neocortical sources. J Clin Neurophysiol. 1993;10:99.
28 Ueno S, Iramina K. Modeling and source localization of MEG activities. Brain Topogr. 1990;3:151.
29 Wheless JW, Castillo E, Maggio V, et al. Magnetoencephalography (MEG) and magnetic source imaging (MSI). Neurologist. 2004;10:138.
30 Sutherling WW, Crandall PH, Darcey TM, et al. The magnetic and electric fields agree with intracranial localizations of somatosensory cortex. Neurology. 1988;38:1705.
31 da Silva FH, Spekreijse H. Localization of brain sources of visually evoked responses: using single and multiple dipoles. An overview of different approaches. Electroencephalogr Clin Neurophysiol Suppl. 1991;42:38.
32 Gordon E, Rennie C, Collins L. Magnetoencephalography and late component ERPs. Clin Exp Neurol. 1990;27:113.
33 Gotman J. Magnetoencephalographic localization of epileptic foci. Ann Neurol. 1990;28:725.
34 Knake S, Halgren E, Shiraishi H, et al. The value of multichannel MEG and EEG in the presurgical evaluation of 70 epilepsy patients. Epilepsy Res. 2006;69:80.
35 Cohen D, Cuffin BN, Yunokuchi K, et al. MEG versus EEG localization test using implanted sources in the human brain. Ann Neurol. 1990;28:811.
36 Iida K, Otsubo H, Matsumoto Y, et al. Characterizing magnetic spike sources by using magnetoencephalography-guided neuronavigation in epilepsy surgery in pediatric patients. J Neurosurg. 2005;102:187.
37 Shiraishi H, Stufflebeam SM, Knake S, et al. Dynamic statistical parametric mapping for analyzing the magnetoencephalographic epileptiform activity in patients with epilepsy. J Child Neurol. 2005;20:363.
38 Mosher J, Baillet S, Jerbi K, et al: MEG multipolar modeling of distributed sources using RAP-MUSIC. In Proceedings of the Thirty-Fourth Asilomar Conference on Signals, Systems and Computers, Asilomar, CA, 2000, p 318.
39 Mosher J, Leahy R. Source localization using recursively applied and projected (RAP) MUSIC. IEEE Trans Signal Process. 1999;47:332.
40 Robinson S, Vrba J. Functional neuroimaging by synthetic aperture magnetometry (SAM). In: Yoshimoto T, Kotani M, Kuriki S, et al, editors. Recent Advances in Biomagnetism. Sendai, Japan: Tohoku University Press; 1999:302.
41 Cuffin BN. Effects of local variations in skull and scalp thickness on EEG’s and MEG’s. IEEE Trans Biomed Eng. 1993;40:42.
42 Cohen D, Cuffin BN. EEG versus MEG localization accuracy: theory and experiment. Brain Topogr. 1991;4:95.
43 Barkley GL. Controversies in neurophysiology. MEG is superior to EEG in localization of interictal epileptiform activity: Pro. Clin Neurophysiol. 2004;115:1001.
44 de Jongh A, de Munck JC, Goncalves SI, et al. Differences in MEG/EEG epileptic spike yields explained by regional differences in signal-to-noise ratios. J Clin Neurophysiol. 2005;22:153.
45 Lau M, Yam D, Burneo JG. A systematic review on MEG and its use in the presurgical evaluation of localization-related epilepsy. Epilepsy Res. 2008;79(2-3):97.
46 Makela JP, Forss N, Jaaskelainen J, et al. Magnetoencephalography in neurosurgery. Neurosurgery. 2006;59:493.
47 Orrison WW, Davis LE, Sullivan GW, et al. Anatomic localization of cerebral cortical function by magnetoencephalography combined with MR imaging and CT. AJNR Am J Neuroradiol. 1990;11:713.
48 Ossenblok P, Leijten FS, de Munck JC, et al. Magnetic source imaging contributes to the presurgical identification of sensorimotor cortex in patients with frontal lobe epilepsy. Clin Neurophysiol. 2003;114:221.
49 Yoshinaga H, Ohtsuka Y, Watanabe Y, et al. Ictal MEG in two children with partial seizures. Brain Dev. 2004;26:403.
50 Holowka SA, Otsubo H, Iida K, et al. Three-dimensionally reconstructed magnetic source imaging and neuronavigation in pediatric epilepsy: technical note. Neurosurgery. 2004;55:1226.
51 Mamelak AN, Lopez N, Akhtari M, et al. Magnetoencephalography-directed surgery in patients with neocortical epilepsy. J Neurosurg. 2002;97:865.
52 Nakamura A, Yamada T, Goto A, et al. Somatosensory homunculus as drawn by MEG. Neuroimage. 1998;7:377.
53 Lee D, Sawrie SM, Simos PG, et al. Reliability of language mapping with magnetic source imaging in epilepsy surgery candidates. Epilepsy Behav. 2006;8:742.
54 Maestu F, Ortiz T, Fernandez A, et al. Spanish language mapping using MEG: a validation study. Neuroimage. 2002;17:1579.
55 Merrifield WS, Simos PG, Papanicolaou AC, et al. Hemispheric language dominance in magnetoencephalography: sensitivity, specificity, and data reduction techniques. Epilepsy Behav. 2007;10:120.
56 Papanicolaou AC, Castillo EM, Billingsley-Marshall R, et al. A review of clinical applications of magnetoencephalography. Int Rev Neurobiol. 2005;68:223.
57 Papanicolaou AC, Simos PG, Castillo EM, et al. Magnetoencephalography: a noninvasive alternative to the Wada procedure. J Neurosurg. 2004;100:867.
58 Knowlton RC, Shih J. Magnetoencephalography in epilepsy. Epilepsia. 2004;45(suppl 4):61.
59 Reeve A, Rose DF, Weinberger DR. Magnetoencephalography. Applications in psychiatry. Arch Gen Psychiatry. 1989;46:573.
60 Reite M. Magnetoencephalography in the study of mental illness. Adv Neurol. 1990;54:207.
61 Rose DF, Smith PD, Sato S. Magnetoencephalography and epilepsy research. Science. 1987;238:329.
62 Shiraishi H, Watanabe Y, Watanabe M, et al. Interictal and ictal magnetoencephalographic study in patients with medial frontal lobe epilepsy. Epilepsia. 2001;42:875.
63 Tilz C, Hummel C, Kettenmann B, et al. Ictal onset localization of epileptic seizures by magnetoencephalography. Acta Neurol Scand. 2002;106:190.
64 Assaf BA, Karkar KM, Laxer KD, et al. Ictal magnetoencephalography in temporal and extratemporal lobe epilepsy. Epilepsia. 2003;44:1320.
65 Baumgartner C, Pataraia E, Lindinger G, et al. Neuromagnetic recordings in temporal lobe epilepsy. J Clin Neurophysiol. 2000;17:177.
66 Fernandes JM, da Silva AM, Huiskamp G, et al. What does an epileptiform spike look like in MEG? Comparison between coincident EEG and MEG spikes. J Clin Neurophysiol. 2005;22:68.
67 Pataraia E, Feucht M, Lindinger G, et al. Combined electroencephalography and magnetoencephalography of interictal spikes in benign rolandic epilepsy of childhood. Clin Neurophysiol. 2008;119:635.
68 Smith JR, King DW, Park YD, et al. A 10-year experience with magnetic source imaging in the guidance of epilepsy surgery. Stereotact Funct Neurosurg. 2003;80:14.
69 Baumgartner C, Barth D, Levesque M, et al. Detection sensitivity of spontaneous magnetoencephalography spike recordings in frontal lobe epilepsy. Epilepsia. 1989;30:665.
70 Sutherling W, Crandall P, Cahan L, et al. The magnetic field of epileptic spikes agrees with intracranial localizations in complex partial epilepsy. Neurology. 1988;38:778.
71 Balish M, Sato S, Connaughton P, et al. Localization of implanted dipoles by magnetoencephalography. Neurology. 1991;41:1072.
72 Sutherling W, Akhtari M, Mamelak A, et al. Dipole localization of human induced focal afterdischarge seizure in simultaneous magnetoencephalography and electrocorticography. Brain Topogr. 2001;14:101.
73 Rose DF, Sato S, Smith PD, et al. Subdural electrode as a dipole source for magnetoencephalography. Electroencephalogr Clin Neurophysiol. 1989;72:86.
74 Ebersole J. Classification of MEG spikes in temporal lobe epilepsy. In: Yoshimoto T, Kotani M, Kuriki S, et al, editors. Recent Advances in Biomagnetism. Sendai: Tohoku University Press; 1999:758.
75 Assaf BA, Karkar KM, Laxer KD, et al. Magnetoencephalography source localization and surgical outcome in temporal lobe epilepsy. Clin Neurophysiol. 2004;115:2066.
76 Iwasaki M, Nakasato N, Shamoto H, et al. Surgical implications of neuromagnetic spike localization in temporal lobe epilepsy. Epilepsia. 2002;43:415.
77 Minassian B, Otsubo H, Weiss S, et al. Magnetoencephalographic localization in pediatric epilepsy surgery: comparison with invasive intracranial electroencephalography. Ann Neurol. 1999;46:627.
78 Anninos PA, Tsagas N. Localization and cure of epileptic foci with the use of MEG measurements. Int J Neurosci. 1989;46:235.
79 Genow A, Hummel C, Scheler G, et al. Epilepsy surgery, resection volume and MSI localization in lesional frontal lobe epilepsy. Neuroimage. 2004;21:444.
80 Kamimura T, Tohyama J, Oishi M, et al. Magnetoencephalography in patients with tuberous sclerosis and localization-related epilepsy. Epilepsia. 2006;47:991.
81 Kurita H, Suzuki I, Shin M, et al. Successful radiosurgical treatment of lesional epilepsy of mesial temporal origin. Minim Invasive Neurosurg. 2001;44:43.
82 Stefan H, Scheler G, Hummel C, et al. Magnetoencephalography (MEG) predicts focal epileptogenicity in cavernomas. J Neurol Neurosurg Psychiatry. 2004;75:1309.
83 Wu JY, Sutherling WW, Koh S, et al. Magnetic source imaging localizes epileptogenic zone in children with tuberous sclerosis complex. Neurology. 2006;66:1270.
84 Ramachandran Nair R, Otsubo H, Shroff MM, et al. MEG predicts outcome following surgery for intractable epilepsy in children with normal or nonfocal MRI findings. Epilepsia. 2007;48:149.
85 Blum D. Prevalence of bilateral partial seizure foci and implications for electroencephalographic telemetry monitoring and epilepsy surgery. Electroencephalogr Clin Neurophysiol. 1994;91:329.
86 Lieb J, Engel J, Gevins A, et al. Surface and deep EEG correlates of surgical outcome in temporal lobe epilepsy. Epilepsia. 1981;22:515.
87 Knowlton RC, Elgavish R, Howell J, et al. Magnetic source imaging versus intracranial electroencephalogram in epilepsy surgery: a prospective study. Ann Neurol. 2006;59:835.
88 Sutherling W, Mamelak AN, Thyerlei D, et al. Influence of magnetic source imaging for planning intracranial EEG in epilepsy. Neurology. 2008;71:97.
89 Morrell F, Whisler W, Smith M, et al. Landau-Kleffner syndrome: treatment with subpial intracortical transection. Brain. 1995;1:1529.
90 Shiraishi H, Takano K, Shiga T, et al. Possible involvement of the tip of temporal lobe in Landau-Kleffner syndrome. Brain Dev. 2007;29:529.
91 Ebersole J. Non-invasive localization of the epileptogenic focus by EEG dipole modeling. Acta Neurol Scand Suppl. 1994;152:20.
92 Mosher JC, Leahy RM, Lewis PS. EEG and MEG: forward solutions for inverse methods. IEEE Trans Biomed Eng. 1999;46:245.
93 Dreifuss FE. Goals of surgery for epilepsy. In: Engel JJr, editor. Surgical Treatment of the Epilepsies. New York: Raven Press; 1987:31.
94 Cascino G.D. Selection of candidates for surgical treatment of epilepsy. In: Cascino GD, Jack CRJr, editors. Neuroimaging in Epilepsy: Principles and Practice. Boston: Butterworth-Heinemann; 1996:209.
95 Mattson RH. Drug treatment of uncontrolled seizures. Epilepsy Res. 1992;5(suppl):29.
96 Camfield P, Camfield C. Antiepileptic drug therapy: when is epilepsy truly intractable? Epilepsia. 1996;37(suppl 1):S60.
97 Hauser W. The natural history of drug resistant epilepsy: epidemiologic considerations. Epilepsy Res. 1992;5(suppl):25.
98 Hauser A, Hesdorffer D. Prognosis. In: Hauser WA, Hesdorffer DC, editors. Epilepsy: Frequency, Causes and Consequences. New York: Demos; 1990:197.
99 Radhakrishnan K, So EL, Silbert PL, et al. Predictors of outcome of anterior temporal lobectomy for intractable epilepsy: a multivariate study. Neurology. 1998;51:465.
100 Van Buren JM, Ajmone-Marsan C, Mustaga N, et al. Surgery of temporal lobe. In: Purpura DP, Penry JK, Walter RD, editors. Neurosurgical Management of the Epilepsies. New York: Raven Press; 1975:155.
101 Crandall PH. Postoperative management and criteria for evaluation. In: Purpura DP, Penry JK, Walter RD, editors. Advances in Neurology. New York: Raven Press; 1987:31.
102 Cascino GD, Boon PAJM, Fish DR. Surgically remediable lesional syndromes. In: Engel JJr, editor. Surgical Treatment of the Epilepsies. 2nd ed. New York: Raven Press; 1993:77.
103 Awad IA, Rosenfeld J, Ahl H, et al. Intractable epilepsy and structural lesions of the brain: mapping, resection strategies, and seizure outcome. Epilepsia. 1991;32:179.
104 Engel JJr, Ojemann GA. The next step. In: Engel JJr, editor. Surgical Treatment of the Epilepsies. 2nd ed. New York: Raven Press; 1993:319-329.
105 Cascino GD, Trenerry MR, So E, et al. Routine EEG and temporal lobe epilepsy: relation to long-term EEG monitoring, quantitative MRI, and operative outcome. Epilepsia. 1996;37:651.
106 Cascino GD, Jack CR, Parisi J, et al. Operative strategy in patients with MRI-identified dual pathology and temporal lobe epilepsy. Epilepsy Res. 1993;14:175.
107 Mosewich RK, So EL, O’Brien TJ, et al. Factors predictive of the outcome of frontal lobe epilepsy surgery. Epilepsia. 2000;41:843.
108 Cambier DM, Cascino GD, So EL, et al. Video-EEG monitoring in patients with hippocampal atrophy. Acta Neurol Scan. 2001;103:1.
109 Jackson GD. Visual analysis in mesial temporal sclerosis. In: Cascino GD, Jack CR, editors. Neuroimaging in Epilepsy: Principles and Practice. Boston: Butterworth-Heinemann; 1996:73.
110 Cascino GD, Jack CRJr, Parisi JE, et al. MRI in the presurgical evaluation of patients with frontal lobe epilepsy and children with temporal lobe epilepsy: pathological correlation and prognostic importance. Epilepsy Res. 1992;11:51.
111 Palmini A, andermann F, Olivier A, et al. Focal neuronal migrational disorders and intractable partial epilepsy: results of surgical treatment. Ann Neurol. 1991;30:750.
112 Cascino GD. Advances in neuroimaging: surgical localization. Epilepsia. 2001;42:3.
113 O’Brien TJ, So EL, Mullan BP, et al. Extent of resection of the ictal subtraction SPECT focus is an important determinant of epilepsy surgery outcome. Epilepsia. 1996;37(suppl 5):S182.
114 Spencer S. The relative contributions of MRI, SPECT and PET imagining in epilepsy. Epilepsia. 1994;35:S72.
115 Theodore WH. Positron emission tomography in the evaluation of epilepsy. In: Cascino GD, Jack CRJr, editors. Neuroimaging in Epilepsy. Principles and Practice. Boston: Butterworth-Heinemann; 1996:165.
116 Henry TR, Babb TL, Engel JJr, et al. Hippocampal neuronal loss and regional hypometabolism in temporal lobe epilepsy. Ann Neurol. 1994;36:925.
117 Ho SS, Berkovic SF, Berlangieri SU, et al. Comparison of ictal SPECT and interictal PET in the presurgical evaluation of temporal lobe epilepsy. Ann Neurol. 1995;37:738.
118 Henry TR. Functional neuroimaging with positron emission tomography. Epilepsia. 1996;37:1141.
119 Marks DA, Katz A, Hoffer P, et al. Localization of extratemporal epileptic foci during ictal single photon emission computed tomography. Ann Neurol. 1992;31:250.
120 Newton MR, Berkovic SF. Interictal, ictal, and postictal single photon emission computed tomography. In: Cascino GD, Jack CRJr, editors. Neuroimaging in Epilepsy: Principles and Practice. Boston: Butterworth-Heinemann; 1996:177.
121 O’Brien TJ, So EL, Mullan BP, et al. Subtraction ictal SPECT co-registered to MRI improves clinical usefulness of SPECT in localizing the surgical seizure focus. Neurology. 1998;50:445.
122 O’Brien TJ, O’Connor MK, Mullan BP, et al. Subtraction ictal SPECT co-registered to MRI in partial epilepsy: description and technical validation of the method with phantom and patients studies. Nucl Med Commun. 1998;19:31.
123 So EL. Integration of EEG, MRI and SPECT in localizing the seizure focus for epilepsy surgery. Epilepsia. 2000;41(suppl 3):S48.
124 O’Brien TJ, So EL, Mullan BP, et al. Subtraction SPECT co-registered to MRI improves postictal localization of seizure foci. Neurology. 1999;52:137.
125 Brinkmann BH, O’Brien TJ, Webster DB, et al. Voxel significance mapping using local image variances in subtraction ictal SPET. Nucl Med Commun. 2000;21:545.
126 O’Brien TJ, Brinkmann BH, Mullan BP, et al. Comparative study of 99mTc-ECD and 99mTc-HMPAO for SPECT: qualitative and quantitative analysis. J Neurol Neurosurg Psychiatry. 1999;66:331.
127 So EL, O’Brien TJ, Brinkmann BH, et al. The EEG evaluation of single photon emission computed tomography abnormalities in epilepsy. J Clin Neurophysiol. 2000;17:10.
128 O’Brien TJ, So EL, Mullan BP, et al. Subtraction peri-ictal SPECT is predictive of extratemporal epilepsy surgery outcome. Neurology. 2000;55:1668.
129 Fessler JA, Cascino GD, So EL, et al. Subtraction ictal SPECT co-registered to MRI (SISCOM) in the evaluation for repeat epilepsy surgery. Neurology. 2000;54(suppl 3):A4.