Monitoring the Patient in the Intensive Care Unit
After reading this chapter you will be able to:
 Discuss the principles of monitoring the respiratory system, cardiovascular system, neurologic status, renal function, liver function, and nutritional status of patients in intensive care.
 Identify the risks and benefits of intensive care unit (ICU) monitoring techniques.
 Explain why the caregiver is the most important monitor in the ICU.
 Describe how to evaluate measures of patient oxygenation in the ICU.
 Explain why PaCO2 is the best index of ventilation for critically ill patients.


 Describe the approach used to interpret the results of ventilator graphics monitoring.


 Discuss evaluation of renal function, liver function, and nutritional status in the ICU.

 Discuss monitoring and troubleshooting of the patient-ventilator system in the ICU.
 )
) )
)The concept and purposes of monitoring have evolved over the past 50 years. The importance of monitoring was established with the advent of the intensive care unit (ICU) during the polio epidemic in the 1950s.1 Enhanced monitoring represents the main difference between a general hospital ward and the ICU. The purpose of monitoring is simple and clear: to measure in “real time” physiologic values that can change rapidly. The values can be analyzed and interpreted with the expectation that interventions such as fluid resuscitation, medication administration, or changes in ventilator settings can be made in time to prevent adverse consequences.
Principles of Monitoring
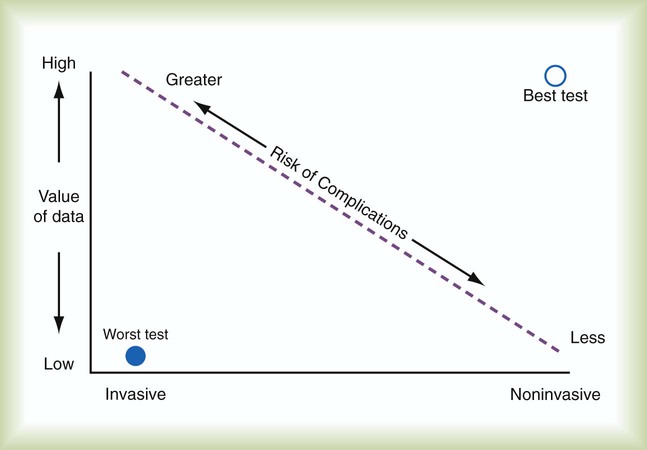
Each monitoring test, procedure, or instrument carries certain risks and provides information that has value. There is an important balance between the risks and benefits of monitoring, especially when evaluating new monitoring techniques. Every test or monitoring technique should be continually judged for usefulness. Figure 46-1 depicts a continuum for judging the risk and benefit of tests, diagnostic procedures, and monitoring techniques. The most useful tests have little or no risk and high potential value. Less useful tests carry higher risk with little potential value. Use of a pulse oximeter probe carries little physical risk and provides valuable information about blood oxygenation (low risk-benefit ratio). However, there is a small but known risk of obtaining incorrect values with the instrument. Hemodynamic monitoring requires placement of a highly invasive Swan-Ganz catheter (pulmonary artery catheter) in the pulmonary artery to provide data that must be correctly interpreted. This type of monitoring should be undertaken only with an expectation of collecting important (high value) information. The risk-benefit ratio for pulmonary artery catheterization is high. For this reason and with fluid status data available from central venous pressure (CVP) monitoring, the widespread use of pulmonary arterial catheterization has markedly decreased.2
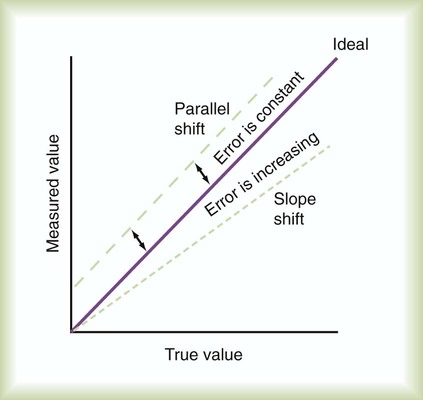
The measuring instrument can produce values that are shifted in a systematic way—consistently high or low or in error in relation to the magnitude of the signal. These shifts are referred to as either parallel or slope shifts (Figure 46-2). Generally, all values must be interpreted with a background of training and experience so that one can understand when a value is normal and when it should be considered abnormal.
 Rule of Thumb
With the responsibility of detecting variations in physiologic data comes the responsibility of setting alarms appropriately. The alarms should be set to detect monitored values that require attention. Monitors also detect the artifacts, factitious events, and random variation often seen in the ICU. The ICU is a noisy environment with many alarms sounding that may not require immediate attention. Ventilators respond to coughs, and electrocardiographs (ECGs), oximeters, and vascular pressure monitors sound alarms with physical movements of the patient. Practitioners must develop mental filtering skills to evaluate true and false alarms and to know when to correct the alarm settings, when to wait for multiple alarms, and when to be concerned about an alarm signal (Box 46-1).
The best monitor continues to be the caregiver: the respiratory therapist (RT), nurse, and physician. Changes in the patient’s condition are detected and monitored most directly by means of patient assessment in the ICU. Chapter 15 describes the important details and bedside assessment skills required of caregivers in the ICU. This assessment is valuable because the information is obtained by a decision maker—the caregiver. The art of the physical examination is being lost with the use of monitoring instruments. A common observation is a group of caregivers staring intently at monitors while a patient is waving for attention. Nevertheless, monitors continue to improve, and they are often relied on to substitute for skills of observation. Monitors are needed for two main reasons: (1) continuous assessment (humans need breaks) and (2) measurement of values that caregivers cannot detect, such as ECG findings or airway pressure.
Pathophysiology and Monitoring
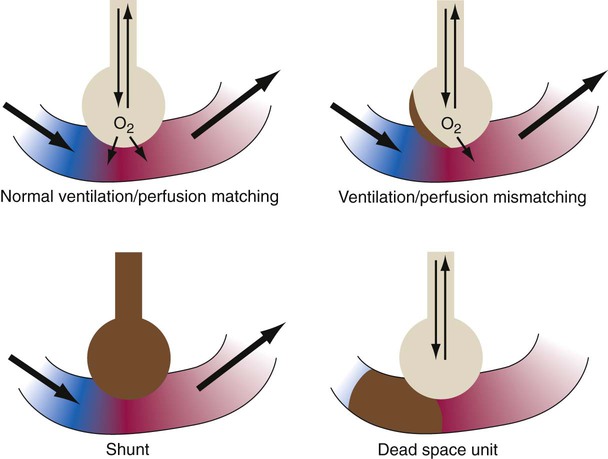
The lungs contain 300 million alveoli, but a basic model of lung injury reduces a lung disorder to three types of injured lung units (Figure 46-3): (1) alveoli that are ventilated but not perfused (dead space units), (2) alveoli that are perfused but not ventilated (shunt units), and (3) alveoli that are receiving either partial ventilation or partial perfusion ( mismatch). In terms of treatment options,
  mismatching is more responsive to oxygen (O2) therapy than shunt or dead space units. However, all three forms of disordered lung units display reduced O2 saturation. Within the context of this model, treatment should be aimed at the source of the disorder and not an attempt to “fix” the arterial partial pressure of oxygen (PaO2) or SpO2.
Respiratory Monitoring
Gas Exchange
The most important function of the lungs is uptake of O2 from air into the arterial blood and disposal of carbon dioxide (CO2) from mixed venous or pulmonary artery blood into the environment. Arterial blood gas (ABG) values contain this gas exchange information. A typical ABG report includes PaO2, PaCO2, pH, a calculated HCO3−, and an estimated base excess or deficit. ABG samples can be obtained quickly and analyzed rapidly. The typical absolute values, predicted values, derangements including compensation, and basic interpretation of ABGs are described in Chapter 18. However, ABGs do not tell the complete story; other values assessing gas exchange that are actively obtained or calculated are discussed in this section.
Monitoring Oxygenation
Arterial Pulse Oximetry
The goal of breathing and circulation is adequate tissue oxygenation. All organs require O2 delivery that meets O2 use demands; the brain and kidneys have particularly high requirements. An important innovation in monitoring is the use of oximetry—a color spectrum measurement of pulsing arterial blood is used for continuous assessment of arterial oxygenation (SpO2). The human eye is not good at detecting or quantifying arterial hypoxemia. Frank cyanosis does not develop until there is at least 5 g/dl of deoxyhemoglobin in the blood.3 The threshold at which cyanosis becomes apparent is affected by skin perfusion, skin pigmentation, and hemoglobin concentration. ABG analysis has been the accepted method of detecting hypoxemia in critically ill patients, but obtaining arterial blood can be painful and cause complications, and ABG analysis does not provide immediate or continuous data. For these reasons, SpO2 has become the standard for a continuous, noninvasive assessment of SaO2. SpO2 does not measure PaCO2, and patients breathing an elevated FiO2 can build up CO2 (increased PaCO2), although SpO2 values are acceptable. Ventilatory failure may go unnoticed unless ABGs are measured.
Tissue O2 sensors designed to measure SaO2 of muscle or the brain were developed more recently.4 Brain oxygenation is crucial, and deep muscle tissue in compartment syndromes can become deoxygenated. This tissue oxygen sensing technique involves positioning of an emitter and detector (of usually four wavelengths) on the skin surface over the tissue or organ of interest. Light from the emitter reflects from tissue at a depth of one-third the distance between the emitter and detector. The light received by the detector is read, and algorithms determine tissue oxygenation, not SpO2.
 Rule of Thumb
Although SpO2 has been universally adopted, it does have limitations (Box 46-2).5,6 Motion artifact is an important problem, resulting in inaccurate readings and false alarms. Motion artifacts are common because of shivering, seizure activity, pressure on the sensor, or transport of the patient. The choice of probe site may also affect accuracy. Finger probes appear to be more accurate than forehead, nose, or earlobe probes during low perfusion states. Intense daylight and fluorescent, incandescent, xenon, and infrared light sources have caused errors in SpO2 readings. Anemia and deeply pigmented skin can affect the accuracy of SpO2; however, the effect of anemia is not clinically significant until the hemoglobin level is markedly reduced. Carboxyhemoglobin and methemoglobin can produce falsely high SpO2 values, and some colors of nail polish, particularly blue, green, and black, interfere with light transmission and absorbency, as do some blood-borne dyes, such as indocyanine green and methylene blue, which tend to produce falsely low SpO2 values. Although rare, exposure to numerous toxins and drugs, including topical benzocaine, can elevate methemoglobin and produce falsely elevated SpO2 values.
 Problem
Oxygen Consumption
 ) is the volume of O2 consumed by the body in milliliters per minute. Normal resting
  is approximately 250 ml/min, and
  increases with activity, stress, and temperature. The acquisition of O2 from the lungs into the circulatory system is described by the Fick equations:
< ?xml:namespace prefix = "mml" />

 is cardiac output (CO), and CaO2 and
  are arterial and mixed venous oxygen contents. If the values for
  , CaO2, and
  are normal, this becomes:

 that does not require an arterial or mixed venous blood sample or measurement of cardiac output (CO) is:
 are the mean inspired and expired fractional concentrations of oxygen, and
  and
and  are the inspired and expired minute ventilations. If
  equals
  (normally
  is slightly greater than
  , but the difference is small), this becomes:
 of 250 ml/min represents approximately 25% of normal O2 delivery (1000 ml/min). The blood carries a large reservoir of O2 that can diffuse into deoxygenated tissues under high O2 demand conditions.
 may be useful in determining nutritional requirements and adequacy of O2 delivery and may occasionally help determine the cause of a high ventilation requirement. If there is a stable tissue demand for O2, measurements of
  may be used to follow the hemodynamic response to therapeutic interventions.


PaO2/FiO2 Ratio
The PaO2/FiO2 ratio has become important for the determination of the extent of acute lung injury (ALI) and acute respiratory distress syndrome (ARDS) in multicenter collaborative studies.7,8 A normal PaO2/FiO2 ratio while breathing room air is about 400 to 500 mm Hg. The PaO2/FiO2 ratio provides an index for the effect of O2 on PaO2 when a range of FiO2 settings may be prescribed. The index allows comparisons of severity between patients or if FiO2 is changed in the same patient. ARDS has been defined by a PaO2/FiO2 ratio less than 200 mm Hg. The PaO2/FiO2 ratio is easy to calculate and a reliable index of gas exchange when FiO2 is greater than 0.5 and PaO2 is less than 100 mm Hg—values often observed in critically ill patients. The level of applied mean airway pressure (MAP), which is strongly affected by PEEP, must also be considered as an independent factor that influences the PaO2/FiO2 ratio.
 Rule of Thumb
 ). The physiologic shunt is computed as follows:
 is the oxygen content of mixed venous blood, all expressed in milliliters of O2 per 100 ml of blood. When the patient is breathing 100% O2,
  can be estimated as follows:
 , CcO2) is calculated in the same manner as any O2 content calculations:
 is influenced by
  mismatching and by fluctuations in mixed venous oxygen saturation (
 ) and FiO2. A “shunt” calculation when FiO2 is less than 1.0 is defined as venous admixture. If venous admixture is elevated but all alveoli are patent, venous admixture decreases toward the normal value (<5%) as FiO2 is increased. Conversely, if increased venous admixture is caused by a true shunt such as an intracardiac defect, there would be no change in venous admixture as FiO2 is increased.
Murray Lung Injury Score
ARDS is a syndrome of severe lung injury that was originally described by Ashbaugh and Petty in 1970.9 Evaluating and treating a patient with ARDS is a primary challenge for the ICU clinician. To monitor the severity of this disease, Murray and colleagues10 developed a lung injury score that is often calculated in studies of ALI/ARDS. The Murray lung injury score quantifies the injury level using the following four factors: chest radiographic findings, PaO2/FiO2 ratio, positive end expiratory pressure (PEEP) setting, and compliance. The Murray lung injury score is an example of a composite score that allows quantification of lung status according to different aspects of the injury—gas exchange, radiographic findings, and mechanics. This score is used as an index of the effectiveness of therapy or for interstudy comparisons. The method for calculating the Murray lung injury score is shown in Box 46-3. Other measures of lung injury are listed in Box 46-4.
Box 46-3 Murray Lung Scoring
| Component | Value |
| 1. Chest Radiograph | |
| No alveolar consolidation | 0 |
| Alveolar consolidation confined to 1 quadrant | 1 |
| Alveolar consolidation confined to 2 quadrants | 2 |
| Alveolar consolidation confined to 3 quadrants | 3 |
| Alveolar consolidation in all 4 quadrants | 4 |
| 2. Hypoxemia Score | |
| PaO2/FiO2 > 300 | 0 |
| PaO2/FiO2 225-299 | 1 |
| PaO2/FiO2 175-224 | 2 |
| PaO2/FiO2 100-174 | 3 |
| PaO2/FiO2 < 100 | 4 |
| 3. PEEP Score (When Ventilated) | |
| PEEP ≤ 5 cm H2O | 0 |
| PEEP 6-8 cm H2O | 1 |
| PEEP 9-11 cm H2O | 2 |
| PEEP 12-14 cm H2O | 3 |
| PEEP > 15 cm H2O | 4 |
| 4. Respiratory System Compliance Score (When Available) | |
| Compliance ≥ 80 ml/cm H2O | 0 |
| Compliance 60-79 ml/cm H2O | 1 |
| Compliance 40-59 ml/cm H2O | 2 |
| Compliance 20-39 ml/cm H2O | 3 |
| Compliance ≤ 19 ml/cm H2O | 4 |
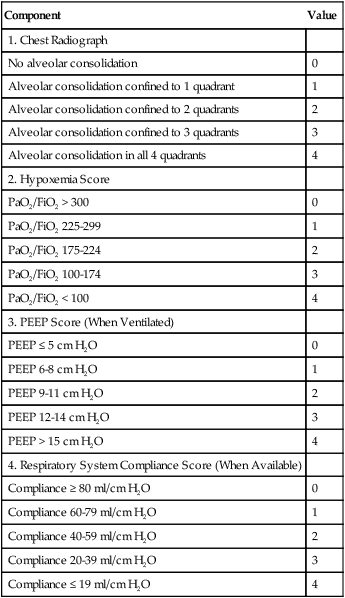
The final value is obtained by dividing the aggregate sum by the number of components used.
Monitoring Ventilation
Similar to oxygenation, the adequacy and efficiency of ventilation is routinely evaluated in the ICU (Box 46-5). Monitoring of patients receiving mechanical ventilatory support in the ICU includes measurement of the patient’s tidal volume (VT), respiratory rate (f), and minute ventilation ( ) where:
 )
)
However, effective ventilation depends on alveolar ventilation ( ), as follows:

where VDphys is physiologic dead space, and:

 is CO2 production in milliliters per minute, and 0.863 is a conversion factor. With a normal PaCO2 and
  , this becomes:
Dead Space

where  is the CO2 concentration in mixed expired gas. A rapid response capnometry or exhaled flow analysis provides a volumetric CO2 method for attaining
  values.11 When
  is determined, a specimen of arterial blood should be drawn for ABG analysis. When the gas and blood samples are analyzed, the preceding formula can be used to calculate VD/VT.
In healthy persons who are sitting, the VD/VT ratio is 0.20 to 0.40. This value varies little with age, position, exercise, VT, or breath holding. In the setting of critical illness, however, the VD/VT ratio commonly exceeds 0.6. Frequently, the VD/VT ratio is increased in patients with congestive heart failure, pulmonary embolism, ALI, or pulmonary hypertension and in patients undergoing mechanical ventilation. The VD/VT ratio has been used to evaluate patients being considered for weaning from mechanical ventilation. A VD/VT ratio greater than 0.60 requires continuation of ventilatory support. Increased VD/VT in the early phase of ARDS has been associated with an increased risk of death.12
 ), respiratory rate (f), and VT are assessed by:
 ) is the sum of the patient’s spontaneous minute ventilation (
 ) and the machine minute ventilation (
 ) provided:
Capnography
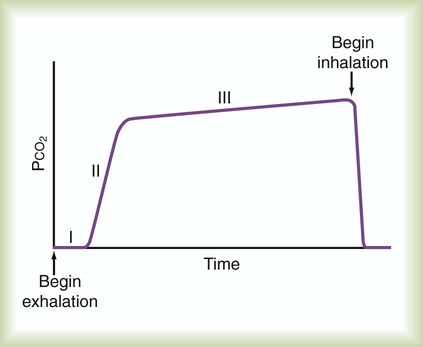
Capnometry is the measurement of CO2 at the airway opening during the ventilatory cycle. Capnography refers to plotting CO2 concentration against time or against exhaled volume. The normal CO2 waveform is displayed in Figure 46-4. The height of the capnogram (the peak value) indicates the end-tidal CO2 value. PetCO2 normally is 1 to 5 mm Hg less than PaCO2, ranging between 35 mm Hg and 43 mm Hg. Because PetCO2 in healthy persons closely approximates PaCO2, this measure is a potentially useful noninvasive index of the adequacy of ventilation. Abnormal waveform contours can indicate changes in the distribution of ventilation and perfusion, or airway obstruction. These changes typically are an irregular increase in CO2 level and a lower than normal end-tidal CO2 level. Positive pressure ventilation (especially with PEEP), pulmonary embolism, cardiac arrest, and pulmonary hypoperfusion also may cause an increase in PaCO2 to PetCO2 difference [P(a − et)CO2]. Exercise and a large VT can reverse the P(a − et)CO2 difference, and PetCO2 can exceed PaCO2 temporarily.
Patients for whom capnometry may be a useful monitoring tool include patients with normal lungs but an unstable ventilatory drive who are breathing spontaneously or receiving low-level ventilatory support. In these patients, capnometry readings should initially be validated by comparison with PaCO2. Changes in PetCO2 can be used to alert the clinician to potential changes in patient ventilation. Thereafter, periodic reevaluation should be performed as the patient’s clinical state changes. Capnometry has been extremely useful in emergency situations, such as verification of endotracheal intubation and assessment of blood flow during or after cardiac arrest. Small in-line CO2 monitors that employ colorimetry are now routinely used to verify endotracheal intubation.13
Although PetCO2 and PaCO2 values tend to correlate at a single point in time, correlation between changes in PetCO2 and changes in PaCO2 tend to be weaker.14 Decreases in ventilation are reflected by increases in PetCO2 and PaCO2. However, with very small VT, PaCO2 increases, whereas PetCO2 may decrease. Although the appropriate role of capnometry in critical care may be unclear, integration of capnometry into modern ventilators is reasonable because the primary role of the ventilator is CO2 extraction. As a guide for clinicians, the American Association for Respiratory Care (AARC) has created clinical practice guidelines for the use of capnometry in ventilated patients. Box 46-6 lists common causes of changes in monitored PetCO2 values.
 , ↓
, ↓  , ↑ PaCO2)
 ) (agitation, stress, shivering, fighting the ventilator, pain, anxiety, recovery from sedation or paralysis)
 , ↑
, ↑  , ↓ PaCO2)
 approaching dead space volume; rapid shallow breathing)
 ) (sedation, sleep, cooling)
With improvements in infrared capnometry response time and a simultaneous measure of exhaled volume, volumetric CO2 monitoring holds promise in the continuous monitoring of ventilation efficiency. VCO2, or the net volume of CO2 eliminated from the lungs, can be continuously monitored in a patient being weaned from mechanical ventilation as an indicator of adequate or improving ventilatory efficiency.15 The volumetric capnogram has been examined as a potential tool for detecting a pulmonary embolism16 and may be useful for tracking the efficiency of mechanical ventilation.17
Monitoring Lung and Chest Wall Mechanics
Ventilation of the lungs involves overcoming the flow-resistive, inertial, and elastic properties of the respiratory system. A reasonable model for the mechanics of the respiratory system is an analogy to an electrical circuit.18 The circuit for gas flow is the pathway to the lungs with resistive elements interposed in series. The gas is collected or stored in a capacitor (the lungs) and discharged (exhaled) through the circuitry. Several assumptions are made with the acceptance of this model (a constant value for resistance and compliance and nonturbulent flow); however, this model serves to simplify and explain the dynamics of ventilation for at least a mechanical lung model.
A mechanical test lung displays a straight line during a P-V determination. An actual in vivo P-V relationship is curvilinear and displays hysteresis (Figure 46-5). To measure a static P-V curve of a ventilated patient from resting (at functional residual capacity [FRC]) to total lung capacity, a calibrated syringe, referred to as a supersyringe ranging from 1.5 to 3 L, was used until more recently to inject 50- to 100-ml increments into the lungs while airway pressure was recorded. Patients were usually sedated during the maneuver. A P-V curve can be measured more easily by the continuous delivery of a low flow of gas into the lung (<5 L/min) with the simultaneous recording of system pressure change. Current ICU ventilators allow the determination of an inflation P-V curve using this approach. The P-V curve is plotted as part of the ventilator graphics package with cursors available to identify specific points on the curve. However, the clinical utility of the P-V relationship of patients may not be directly related to the patient receiving mechanical ventilation owing to an effect on lung volume from tidal recruitment.19
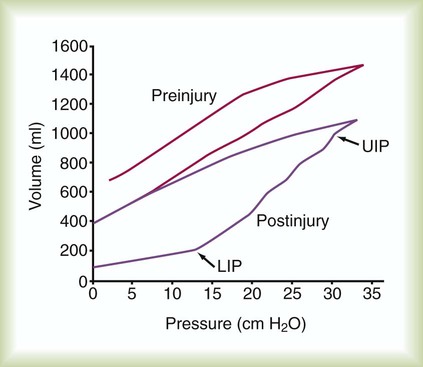
The inflation P-V curve often, but not always, reveals two points at which the slope of the curve changes. The lower point at which the slope changes is called the lower inflection point. As depicted in Figure 46-5, a lower inflection point may occur over the lower range of volumes, indicating a pressure above which total respiratory system compliance is improved owing to the beginning of alveolar recruitment or the peripheralization of secretions.20 A recommended strategy is to set PEEP slightly above the lower inflection point with the goal of maintaining recruitment and stabilization of dependent alveoli that may otherwise sustain injury from repetitive opening, closing, and reopening of lung units during tidal ventilation. The other pressure change in the slope, called an upper deflection point, may be seen at a higher volume, indicating where compliance decreases owing to alveolar overdistention or a slowing of lung recruitment. Although the risk of alveolar overdistention is generally reduced if the end inspiratory plateau pressure (Pplat) is less than 30 cm H2O, deflection points in patients with ARDS may occur at pressures of 25 cm H2O.21
Respiratory System Compliance
Normal compliance ranges from 60 to 100 ml/cm H2O. Diseases of the lung parenchyma, such as pneumonia, pulmonary edema, and any chronic disease causing fibrosis, cause decreased effective compliance. Acute changes, such as atelectasis, pulmonary edema, ARDS, and lung compression, caused by tension pneumothorax cause a rapid decrease in compliance. Compliance is often less than 25 to 30 ml/cm H2O in patients with ARDS. Common causes of changes in respiratory system compliance are listed in Box 46-7. Several ventilators report breath-to-breath compliance and resistance values dynamically without the use of pause maneuvers. Monitoring these estimates can indicate impedance problems, but they should be verified by static maneuver calculations.
Chest Wall Compliance
End inspiratory Ptp can be monitored to evaluate the potential for overdistention—usually allowing some liberty in accepting higher Pplat to deliver adequate ventilation. The monitoring of end expiratory Ptp has been used more recently as a rationale for setting PEEP. A negative Ptp probably indicates lung closure (dependent lobe) during expiration that can result in lung opening and closing during the ventilatory cycle. Adequate PEEP is the PEEP level that establishes a positive Ptp or dependent lobe recruitment. (See Chapter 44 for details.)
Resistance

In ventilated patients, a significant component of the total flow resistance is from endotracheal tubes, which have highly curvilinear flow-resistive properties.22 In healthy persons, flow is relatively laminar during tidal ventilation and becomes turbulent only with increasing ventilatory demands. The flow resistance offered by the endotracheal tube increases markedly with increasing flow and varies with the size of the tube. Normal airway resistance is approximately 1 to 2 cm H2O/L per second; however, intubated patients receiving mechanical ventilatory support typically have an airway resistance of 5 to 10 cm H2O/L per second or more. Automated tube compensation modes have been added to mechanical ventilators to deliver flow that accounts for the added resistance of the endotracheal tube. Common causes of changes in airway resistance in mechanically ventilated patients are listed in Box 46-7.
Peak and Plateau Pressures
The maximum value of airway pressure at the airway opening during a ventilatory cycle is routinely monitored in the ICU. Peak airway pressure greater than 50 to 60 cm H2O is generally discouraged because high values of peak pressure carry increased risk of barotrauma and hypotension.23 An increase in peak pressure results from increased resistive pressure or increased elastic pressure from decreased lung or chest wall compliance. Measurement of end inspiratory Pplat helps to differentiate between the resistive and elastic components. The Pplat level should be monitored for all ventilated patients. Pplat ideally should not exceed 30 cm H2O because elevated Pplat increases the likelihood of developing ventilator-induced lung injury.
Auto–Positive End Expiratory Pressure (Intrinsic Positive End Expiratory Pressure)
Numerous factors, both internal and external to the patient, contribute to the development of auto-PEEP. Expiratory muscle activity can increase auto-PEEP and may interfere with attempts at assessment of auto-PEEP based solely on dynamic hyperinflation. Patients receiving mechanical ventilation for obstructive airways disease have a large degree of inhomogeneity in the emptying of lung units, and auto-PEEP can develop even at relatively low minute ventilation. Auto-PEEP is common in mechanically ventilated patients receiving high minute ventilation and occurs in patients with ARDS.24 The presence of auto-PEEP can underestimate the effect of mean alveolar pressure when MAP is being monitored to reflect mean alveolar pressure. An increase in mean alveolar pressure owing to auto-PEEP may exacerbate the hemodynamic effects of positive pressure ventilation and increase the likelihood of barotrauma in a manner similar to the application of PEEP. In addition, auto-PEEP alters the effective trigger sensitivity of the ventilator, making it more difficult for the patient to trigger a ventilator-assisted inspiration.
Finally, if unrecognized, auto-PEEP leads to erroneous calculation of static lung compliance by underestimation of total PEEP. Decreasing minute volume can reduce or eliminate auto-PEEP; however, minimal auto-PEEP can be benign. In addition, increasing expiratory time allows more time for airways to empty normally, decreasing auto-PEEP. The use of extrinsic PEEP can partially overcome the trigger sensitivity problem seen with auto-PEEP and may provide a “stent” to allow more complete lung emptying.25
Matching Auto–Positive End Expiratory Pressure with Positive End Expiratory Pressure
PEEP can be applied to a level (this is possible in some patients) that results in flow reaching zero at end exhalation. The concept involves stenting of the airways by PEEP to allow lung emptying.25 This maneuver is essentially performed by slowly increasing applied PEEP until every patient effort triggers a ventilator breath.
Monitoring Breathing Effort and Patterns
Work of Breathing
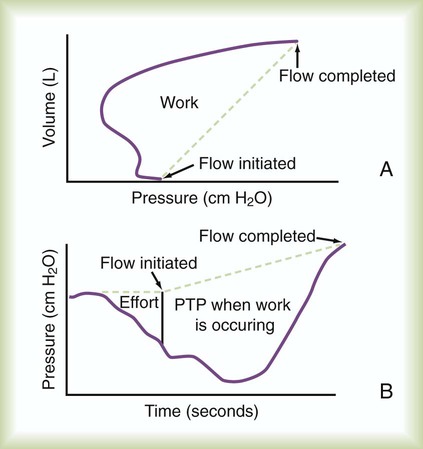
Work of breathing (WOB) is often increased in critically ill patients. Commercially available systems are available for measuring WOB in ventilated patients. For computation of WOB, changes in Ptp must be measured. The procedure requires an assessment of pleural pressure, which is normally estimated by esophageal pressure after placement of an esophageal balloon catheter. The measurement is estimated from the esophageal pressure-versus-volume curve (Figure 46-6).
For healthy persons, average total WOB ranges from 0.030 to 0.050 kg/m/L (0.3 to 0.6 J/L).26 Patients with severe obstructive or restrictive lung disease “work” at levels two to three times this normal value at rest, with marked increases in work at higher minute ventilation. How much work a patient can tolerate before the ventilatory muscles fatigue is unclear. Maintaining adequate spontaneous ventilation is impossible in many patients when the workload exceeds 0.15 kg/m/L (1.5 J/L).
Esophageal Pressure Monitoring
Pressure-Time Product
The pressure-time product (PTP) is the area encompassed by the esophageal pressure-time tracing during inspiration as shown in Figure 46-6. PTP is simpler to measure than WOB because it does not require simultaneous measurement of volume. PTP values parallel changes in effort and the O2 cost of breathing because PTP includes a measure of the “isometric” component of muscle contraction.27 This index includes work and effort components that may indicate endurance during a weaning trial.
 ) is an estimate of respiratory effort at its most basic level.
  can be estimated by measurement of O2 consumption during active breathing compared with the patient being fully supported in the control mode:
 is approximately 2% to 5% of total O2 consumption; however,
  can be 30% of total O2 consumption during hyperventilation owing to severe dyspnea. Theoretically,
  accounts for all factors that tax the respiratory muscles—that is, the external workload and the efficiency of the conversion between cellular energy and useful work.
  is difficult to measure if the patient’s condition is unstable. Other measures of respiratory muscle function are sought to assess the cost of breathing.
Assessing Ventilatory Drive
Until more recently, little attention was paid to measurement of respiratory drive during critical illness. During machine-assisted breathing, ventilatory drive can play an important role in determining the energy expenditure of the patient. One study showed that patients not being weaned from mechanical ventilation often have an elevated drive to breathe and a limited ability to respond to increases in ventilatory load (e.g., increased PaCO2).28
In a sophisticated, commercially available system, a direct measure of the neural drive to breathe from the phrenic nerve can be measured by a catheter positioned within the esophagus. This signal is integrated into a feedback circuit in a modern ventilator. As a mode within the ventilator, flow delivery is coordinated and augmented in response to the neural drive to breathe; this is known as neurally adjusted ventilatory assist. (See Chapters 42 and 44 for details.)
Rapid Shallow Breathing Index
 ) requirements by increasing frequency (f) while decreasing VT. Although smaller breaths require less effort, rapid shallow breathing increases dead space ventilation causing a need for higher minute ventilation to eliminate CO2. A very high and continuously increasing frequency (>30 breaths/min) is a sign of ventilatory muscle decompensation and, potentially, impending fatigue.
Considerable attention has been focused on the rapid shallow breathing index (f/VT ratio), a simple bedside index that indicates whether mechanically ventilated patients can breathe without mechanical assistance.29 The f/VT ratio is easy to measure and is independent of the patient’s effort and cooperation. Discontinuation of ventilator support is likely to prove successful if f/VT ratio is less than 105 breaths/min per L within the first minute of a brief trial of fully spontaneous breathing.29
Monitoring Strength and Muscle Endurance
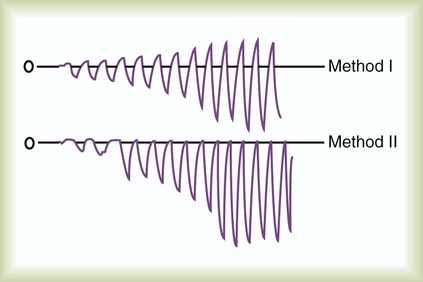
MIP is a more specific measure than VC. MIP provides information based solely on maximum output of the inspiratory muscles. A maximum stimulus is provided by total occlusion of the airway. In contrast to the VC maneuver, the MIP maneuver can be performed on unconscious or uncooperative patients. Measurement of MIP at the bedside requires an aneroid manometer with a maximum value indicator. In an effort to make the measurements more reliable, Marini and colleagues30 described a modified technique in which a one-way valve is attached to the airway to ensure that inspiratory effort is made at a low lung volume. Maintaining an occlusion for 20 seconds, the values with the one-way valve in place were approximately one-third more negative than values without an occlusion (Figure 46-7).
 Rule of Thumb
Lung Stress and Strain
Working definitions for stress and strain applied to the lungs have been studied.32 Stress is simply defined as Ptp (Pairway − Pesophageal). Driving pressure, as previously discussed, may be an alternative measure of stress. Strain has been defined as VT (the deformation) divided by FRC (the resting size of the lungs). These definitions have been associated as stress = 13.5 * strain, predicting that a stress of 27 cm H2O (Ptp of 27 cm H2O) and a strain of 2 (VT of twice the FRC) approach the limits of safe ventilation.32 As previously discussed, Ptp requires placement of an esophageal catheter. To measure strain, automated FRC determinations have become available on some modern ventilators.33 Stress can also occur at lower pressures if lung units are opening and closing during the ventilator cycle.
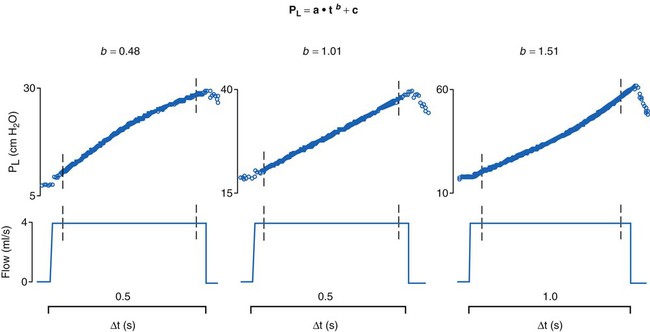
Stress Index
Another index involving the dynamic measurement of stress has been reported.34 The stress index is a value derived from the airway pressure-time curve during constant flow delivery of a tidal breath. During constant flow (when resistance is constant), the slope of the pressure-time tracing is analyzed to evaluate the elastic properties of the lungs. The index is calculated by performing a curve fit of the slope of the pressure-time tracing, where pressure = a * timeb + c. Ideally, a slope (b) of 1 indicates normal filling during lung expansion, whereas a slope greater than 1 indicates overdistention, and a slope less than 1 indicates lung recruitment (Figure 46-8). This measure can be calculated for each delivered tidal breath, although an acceptance criterion should be used to exclude analysis of artifacts and factitious breaths. Although the index may not determine a threshold for excessive stress or strain, it may be a useful indicator of lung response to positive pressure. If the chest wall contributes variably to airway pressure, the calculated index can be altered and deceptive.35
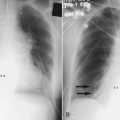
Lung Mapping
The extent of gas exchange abnormalities is revealed by ABG values and SpO2, but the location or source of the disorder remains unknown. The source, but not the extent or type of the pathologic process, can be assessed by auscultation. Localization of the disorder within the lungs is more precisely evaluated by static images obtained by radiographic techniques, such as chest x-ray or computed tomography (CT). These assessments are key to directing therapeutic approaches and for tracking changes in pathology. However, thorough imaging studies frequently require transportation of the patient to a radiology suite, and transport presents risks to the patient.36 Also, the imaging is often static, not dynamically obtained throughout the ventilator cycle.
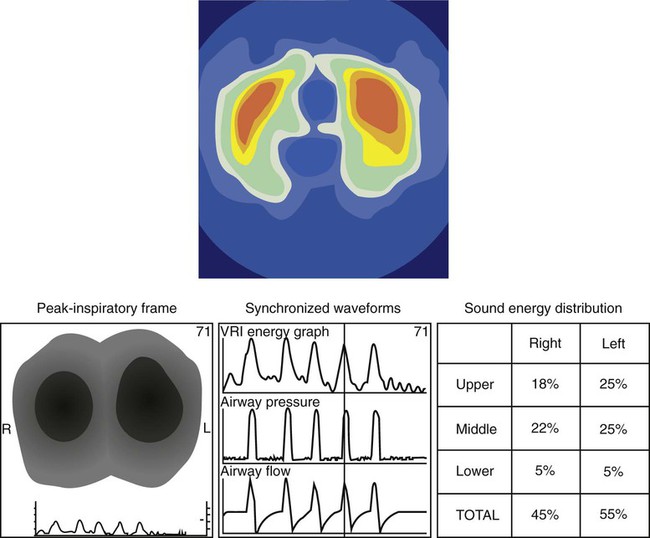
The application of EIT or ARM is simple, and systems are becoming available for clinical use. Both are stand-alone devices that are not, as yet, integrated with ventilators. EIT requires placement around the chest of either 16 or 32 electrodes. Impedance measures between electrodes are rapidly completed, and a video reconstruction of ventilation is created (Figure 46-9). Completion of regional ventilation studies with the use of EIT has been reported more recently.37,38 ARM involves placement of a series of stethoscopes around the chest. The sounds during ventilation are localized, and, similarly, a map of sounds (ventilation) is reconstructed. Specific characteristics of crackles from interstitial pulmonary fibrosis compared with congestive heart failure have been differentiated by ARM.39
Monitoring Patient-Ventilator System
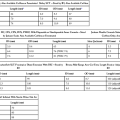
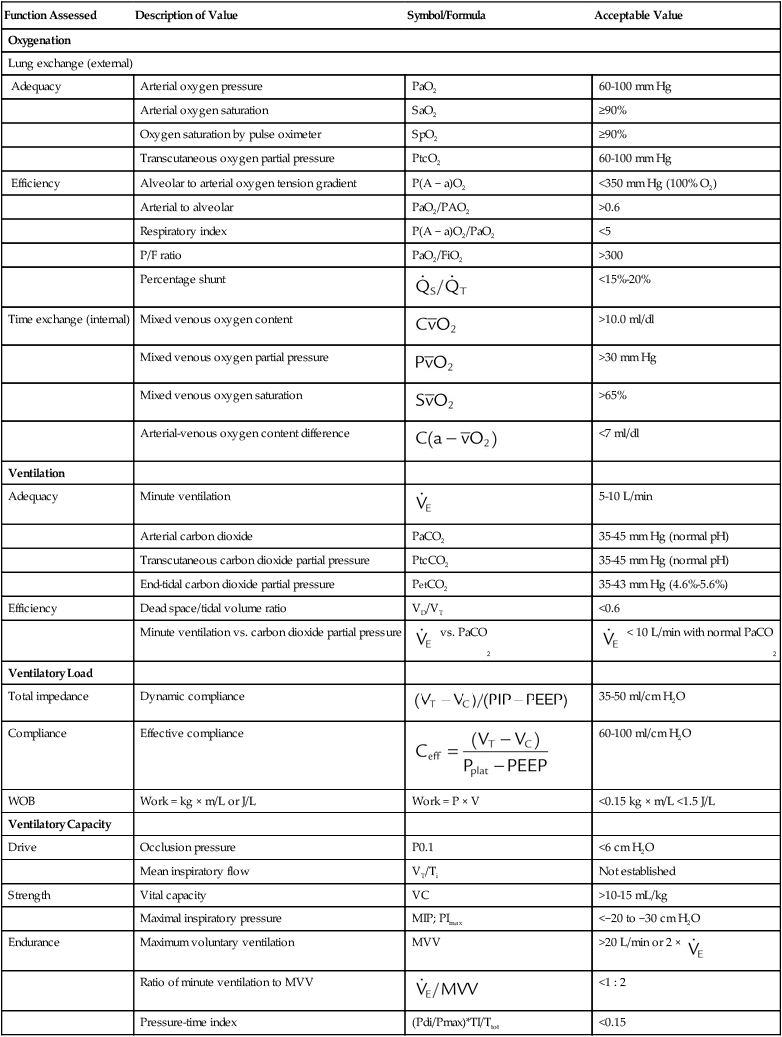
Monitoring of a patient during mechanical ventilatory support should include a physical examination (inspection, palpation, percussion, auscultation), assessment of oxygenation and ventilation, and assessment of ventilatory load and capacity. Table 46-1 lists key physiologic monitoring data and acceptable values for patients receiving mechanical ventilation. Monitoring of all aspects of the patient-ventilator system is an important responsibility that must be clearly delineated within the ICU. Monitoring a ventilated patient is the primary responsibility of the RT. Important areas of this responsibility include the following:
TABLE 46-1
Physiologic Monitoring Data (Respiratory Values)
| Function Assessed | Description of Value | Symbol/Formula | Acceptable Value |
| Oxygenation | |||
| Lung exchange (external) | |||
| Adequacy | Arterial oxygen pressure | PaO2 | 60-100 mm Hg |
| Arterial oxygen saturation | SaO2 | ≥90% | |
| Oxygen saturation by pulse oximeter | SpO2 | ≥90% | |
| Transcutaneous oxygen partial pressure | PtcO2 | 60-100 mm Hg | |
| Efficiency | Alveolar to arterial oxygen tension gradient | P(A − a)O2 | <350 mm Hg (100% O2) |
| Arterial to alveolar | PaO2/PAO2 | >0.6 | |
| Respiratory index | P(A − a)O2/PaO2 | <5 | |
| P/F ratio | PaO2/FiO2 | >300 | |
| Percentage shunt |  |
<15%-20% | |
| Time exchange (internal) | Mixed venous oxygen content |  |
>10.0 ml/dl |
| Mixed venous oxygen partial pressure |  |
>30 mm Hg | |
| Mixed venous oxygen saturation |  |
>65% | |
| Arterial-venous oxygen content difference |  |
<7 ml/dl | |
| Ventilation | |||
| Adequacy | Minute ventilation |  |
5-10 L/min |
| Arterial carbon dioxide | PaCO2 | 35-45 mm Hg (normal pH) | |
| Transcutaneous carbon dioxide partial pressure | PtcCO2 | 35-45 mm Hg (normal pH) | |
| End-tidal carbon dioxide partial pressure | PetCO2 | 35-43 mm Hg (4.6%-5.6%) | |
| Efficiency | Dead space/tidal volume ratio | VD/VT | <0.6 |
| Minute ventilation vs. carbon dioxide partial pressure |  vs. PaCO2 vs. PaCO2 |
 < 10 L/min with normal PaCO2 < 10 L/min with normal PaCO2 |
|
| Ventilatory Load | |||
| Total impedance | Dynamic compliance |  |
35-50 ml/cm H2O |
| Compliance | Effective compliance | 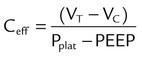 |
60-100 ml/cm H2O |
| WOB | Work = kg × m/L or J/L | Work = P × V | <0.15 kg × m/L <1.5 J/L |
| Ventilatory Capacity | |||
| Drive | Occlusion pressure | P0.1 | <6 cm H2O |
| Mean inspiratory flow | VT/Ti | Not established | |
| Strength | Vital capacity | VC | >10-15 mL/kg |
| Maximal inspiratory pressure | MIP; PImax | <−20 to −30 cm H2O | |
| Endurance | Maximum voluntary ventilation | MVV | >20 L/min or 2 ×  |
| Ratio of minute ventilation to MVV |  |
<1 : 2 | |
| Pressure-time index | (Pdi/Pmax)*TI/Ttot | <0.15 | |
• Assessing the integrity of the airway and circuitry, including secretion clearance
• Maintaining the prescribed settings and assessing their appropriateness
• Ensuring acceptable gas exchange values
• Monitoring of respiratory system mechanics
• Evaluating the comfort and synchrony of breathing of the patient
• Caring for any other safety issues, such as risk of extubation
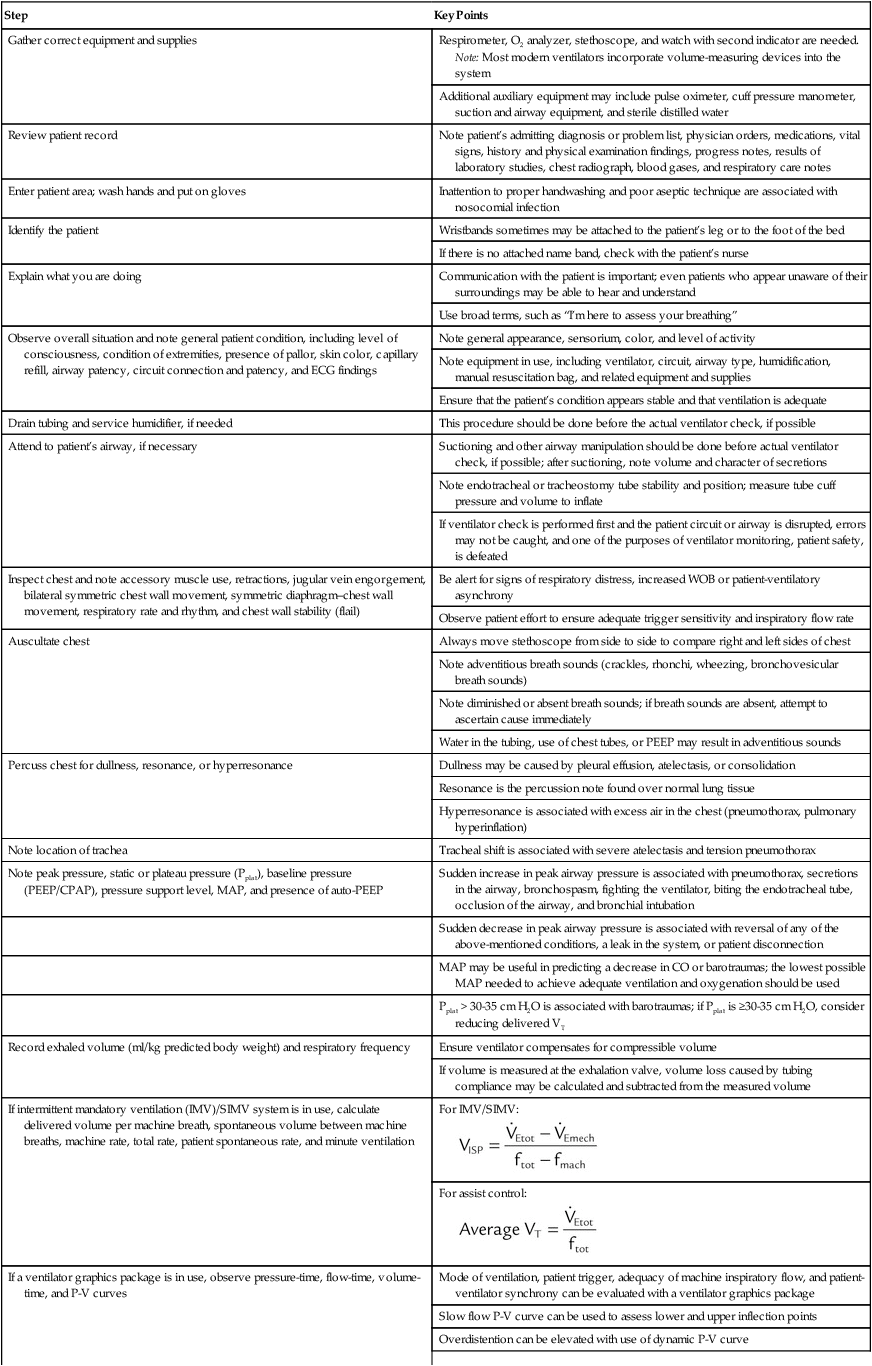
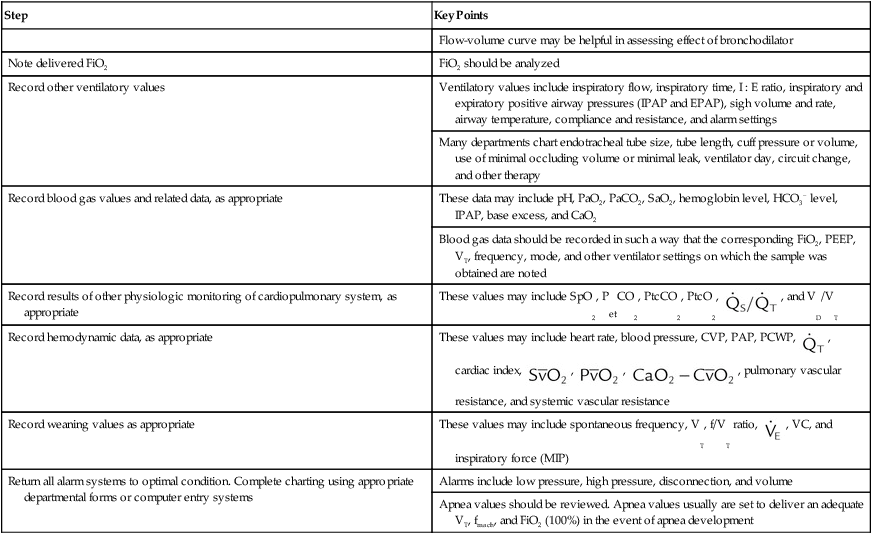
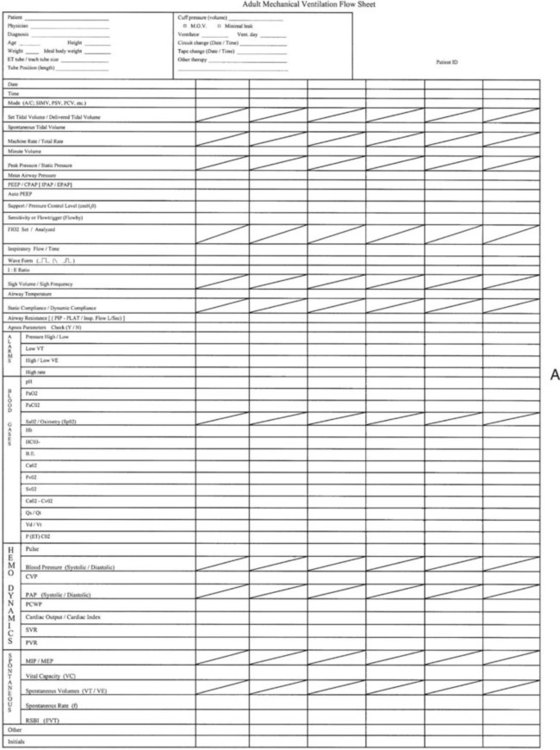
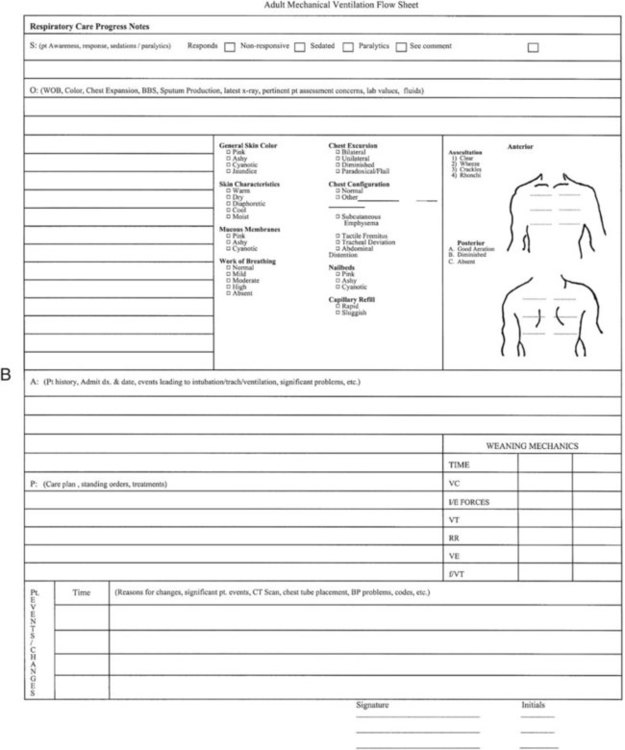
A system of ensuring and documenting all aspects of safe and appropriate care must be in place. This system usually includes a manual or, more frequently, an electronic recording of all important settings, alarms, and ABG values at regular intervals. This monitoring process has been called patient-ventilator assessments. An example of a recording form used for this purpose is shown in Figure 46-10. Increasingly, electronic transfer of ventilator settings and monitored data is being added to the electronic medical record. The responsibility of the RT is much greater than the task of recording values. This responsibility is care of a critically ill, vulnerable patient with respiratory failure who is being supported with a lifesaving machine. The procedure for performing a patient-ventilator system assessment is outlined in Table 46-2. Although the importance of monitoring the patient-ventilator system has increased, the necessity of entry and transcription of numbers into an assessment sheet is decreasing. The era of electronic transfer of monitored data directly to the patients’ charts will soon become the standard. All modern ventilators have the capacity for data transfer, but until standardized transfer protocols, charting formats, and archiving methods are established, electronic monitoring of the patient-ventilator system will continue to be customized to the local setting.
TABLE 46-2
Performing a Patient-Ventilator System Assessment
| Step | Key Points |
| Gather correct equipment and supplies | Respirometer, O2 analyzer, stethoscope, and watch with second indicator are needed. Note: Most modern ventilators incorporate volume-measuring devices into the system |
| Additional auxiliary equipment may include pulse oximeter, cuff pressure manometer, suction and airway equipment, and sterile distilled water | |
| Review patient record | Note patient’s admitting diagnosis or problem list, physician orders, medications, vital signs, history and physical examination findings, progress notes, results of laboratory studies, chest radiograph, blood gases, and respiratory care notes |
| Enter patient area; wash hands and put on gloves | Inattention to proper handwashing and poor aseptic technique are associated with nosocomial infection |
| Identify the patient | Wristbands sometimes may be attached to the patient’s leg or to the foot of the bed |
| If there is no attached name band, check with the patient’s nurse | |
| Explain what you are doing | Communication with the patient is important; even patients who appear unaware of their surroundings may be able to hear and understand |
| Use broad terms, such as “I’m here to assess your breathing” | |
| Observe overall situation and note general patient condition, including level of consciousness, condition of extremities, presence of pallor, skin color, capillary refill, airway patency, circuit connection and patency, and ECG findings | Note general appearance, sensorium, color, and level of activity |
| Note equipment in use, including ventilator, circuit, airway type, humidification, manual resuscitation bag, and related equipment and supplies | |
| Ensure that the patient’s condition appears stable and that ventilation is adequate | |
| Drain tubing and service humidifier, if needed | This procedure should be done before the actual ventilator check, if possible |
| Attend to patient’s airway, if necessary | Suctioning and other airway manipulation should be done before actual ventilator check, if possible; after suctioning, note volume and character of secretions |
| Note endotracheal or tracheostomy tube stability and position; measure tube cuff pressure and volume to inflate | |
| If ventilator check is performed first and the patient circuit or airway is disrupted, errors may not be caught, and one of the purposes of ventilator monitoring, patient safety, is defeated | |
| Inspect chest and note accessory muscle use, retractions, jugular vein engorgement, bilateral symmetric chest wall movement, symmetric diaphragm–chest wall movement, respiratory rate and rhythm, and chest wall stability (flail) | Be alert for signs of respiratory distress, increased WOB or patient-ventilatory asynchrony |
| Observe patient effort to ensure adequate trigger sensitivity and inspiratory flow rate | |
| Auscultate chest | Always move stethoscope from side to side to compare right and left sides of chest |
| Note adventitious breath sounds (crackles, rhonchi, wheezing, bronchovesicular breath sounds) | |
| Note diminished or absent breath sounds; if breath sounds are absent, attempt to ascertain cause immediately | |
| Water in the tubing, use of chest tubes, or PEEP may result in adventitious sounds | |
| Percuss chest for dullness, resonance, or hyperresonance | Dullness may be caused by pleural effusion, atelectasis, or consolidation |
| Resonance is the percussion note found over normal lung tissue | |
| Hyperresonance is associated with excess air in the chest (pneumothorax, pulmonary hyperinflation) | |
| Note location of trachea | Tracheal shift is associated with severe atelectasis and tension pneumothorax |
| Note peak pressure, static or plateau pressure (Pplat), baseline pressure (PEEP/CPAP), pressure support level, MAP, and presence of auto-PEEP | Sudden increase in peak airway pressure is associated with pneumothorax, secretions in the airway, bronchospasm, fighting the ventilator, biting the endotracheal tube, occlusion of the airway, and bronchial intubation |
| Sudden decrease in peak airway pressure is associated with reversal of any of the above-mentioned conditions, a leak in the system, or patient disconnection | |
| MAP may be useful in predicting a decrease in CO or barotraumas; the lowest possible MAP needed to achieve adequate ventilation and oxygenation should be used | |
| Pplat > 30-35 cm H2O is associated with barotraumas; if Pplat is ≥30-35 cm H2O, consider reducing delivered VT | |
| Record exhaled volume (ml/kg predicted body weight) and respiratory frequency | Ensure ventilator compensates for compressible volume |
| If volume is measured at the exhalation valve, volume loss caused by tubing compliance may be calculated and subtracted from the measured volume | |
| If intermittent mandatory ventilation (IMV)/SIMV system is in use, calculate delivered volume per machine breath, spontaneous volume between machine breaths, machine rate, total rate, patient spontaneous rate, and minute ventilation | For IMV/SIMV: |
For assist control: |
|
| If a ventilator graphics package is in use, observe pressure-time, flow-time, volume-time, and P-V curves | Mode of ventilation, patient trigger, adequacy of machine inspiratory flow, and patient-ventilator synchrony can be evaluated with a ventilator graphics package |
| Slow flow P-V curve can be used to assess lower and upper inflection points | |
| Overdistention can be elevated with use of dynamic P-V curve | |
| Flow-volume curve may be helpful in assessing effect of bronchodilator | |
| Note delivered FiO2 | FiO2 should be analyzed |
| Record other ventilatory values | Ventilatory values include inspiratory flow, inspiratory time, I : E ratio, inspiratory and expiratory positive airway pressures (IPAP and EPAP), sigh volume and rate, airway temperature, compliance and resistance, and alarm settings |
| Many departments chart endotracheal tube size, tube length, cuff pressure or volume, use of minimal occluding volume or minimal leak, ventilator day, circuit change, and other therapy | |
| Record blood gas values and related data, as appropriate | These data may include pH, PaO2, PaCO2, SaO2, hemoglobin level, HCO3− level, IPAP, base excess, and CaO2 |
| Blood gas data should be recorded in such a way that the corresponding FiO2, PEEP, VT, frequency, mode, and other ventilator settings on which the sample was obtained are noted | |
| Record results of other physiologic monitoring of cardiopulmonary system, as appropriate | These values may include SpO2, PetCO2, PtcCO2, PtcO2,  , and VD/VT , and VD/VT |
| Record hemodynamic data, as appropriate | These values may include heart rate, blood pressure, CVP, PAP, PCWP,  , cardiac index, , cardiac index,  , ,  , ,  , pulmonary vascular resistance, and systemic vascular resistance , pulmonary vascular resistance, and systemic vascular resistance |
| Record weaning values as appropriate | These values may include spontaneous frequency, VT, f/VT ratio,  , VC, and inspiratory force (MIP) , VC, and inspiratory force (MIP) |
| Return all alarm systems to optimal condition. Complete charting using appropriate departmental forms or computer entry systems | Alarms include low pressure, high pressure, disconnection, and volume |
| Apnea values should be reviewed. Apnea values usually are set to deliver an adequate VT, fmach, and FiO2 (100%) in the event of apnea development |
Graphics Monitoring
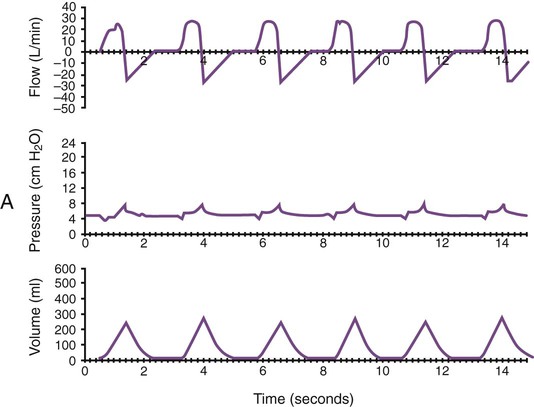
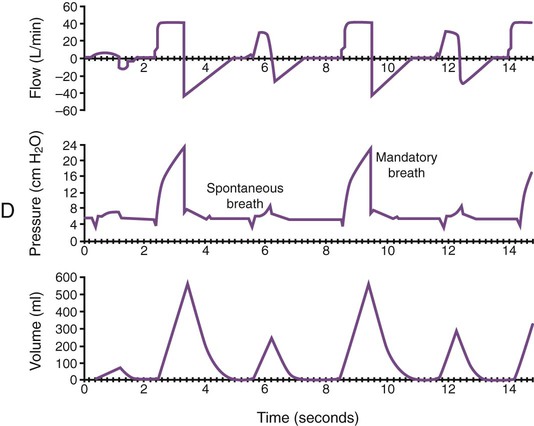
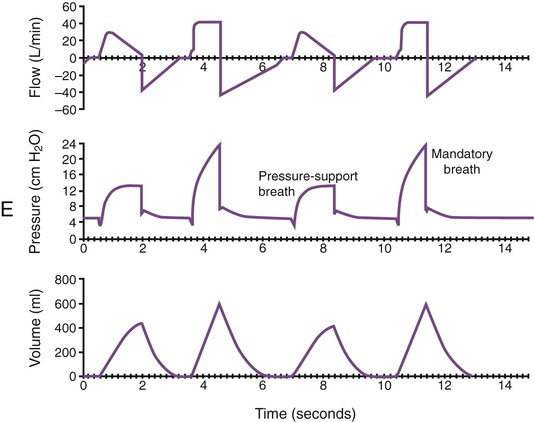
Monitoring of graphic tracings generated during mechanical ventilation has become widely available and accepted in the ICU. A visual display of pressure, flow, and volume tracings is available on all modern ventilators. Graphic displays are possible through the development of improvements in sensing technology, integrated circuitry, and graphic-user interface. Ventilators measure inspiratory and expiratory flow and circuit pressure with pneumotachometers and transducers. The volume displays are generated through calculation of an integral of the flow tracings. All three values (flow, pressure, and volume) can be displayed and plotted against time or each other (Figure 46-11).
 Problem
 Rule of Thumb
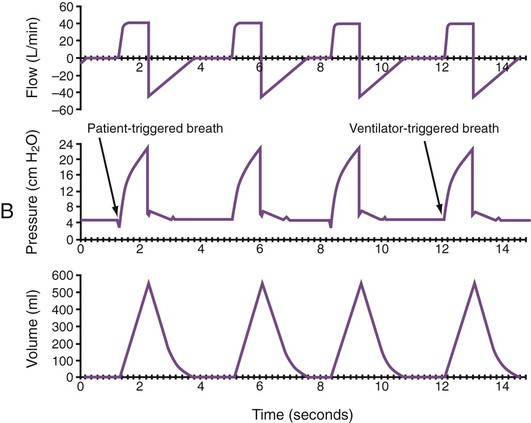
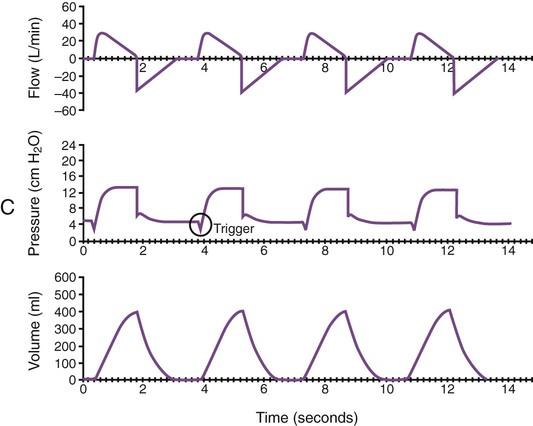
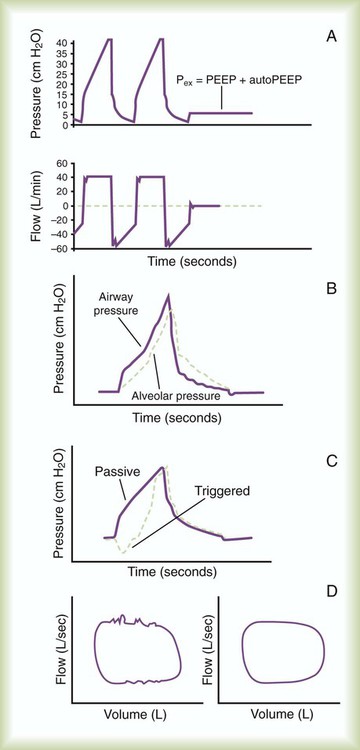
Ventilator manufacturers have developed the graphic displays that allow astute clinicians to base decisions on many more factors than gas exchange values (Box 46-8). However, the study and verification of features observed in ventilator graphics have not developed at the pace of the technology. Ventilator graphics show many important patient-ventilator interactions, such as presence of auto-PEEP, elevated airway pressure, presence of secretions, and general pattern and dependability of supported ventilation (Figure 46-12). The potential for expanded use of ventilator graphics awaits further investigation of the clinical importance of the graphic displays. For more details, see Chapter 44.
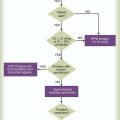
Monitoring During Lung Protective Ventilation
A lung protective ventilation strategy that reduces the risk of pressure injury to the lungs has evolved from numerous animal studies and several key clinical studies.40 Meticulous monitoring of the status of patients with ALI/ARDS or patients at risk of ALI/ARDS is necessary to avoid ventilator-induced lung injury. Three principles have been confirmed: (1) reduce the risk of high-pressure exposure by limiting Pplat to less than 30 cm H2O, (2) reduce VT ventilation to 4 to 8 ml/kg, and (3) maintain adequate end expiratory lung volume with PEEP to avoid opening/closing injury. The AARC created a clinical practice guideline on patient-ventilator system assessment; excerpts from this guideline appear in Clinical Practice Guideline 46-1.
As previously discussed, elevated chest wall or abdominal compliance must also be considered during lung protective ventilation. This concern can be significant in obese patients. Essentially, the stiffer the chest wall or abdomen, the greater is the Pplat that can be established without inducing lung injury. In particularly challenging patients with ARDS, high-frequency ventilation has been considered.41 The importance of setting an elevated PEEP level to maintain an open lung has been established in animal studies.42 However, large multicenter studies designed to determine the effect of high PEEP on mortality in ALI/ARDS have reported conflicting results.43,44 Nevertheless, setting PEEP levels greater than 15 cm H2O is often necessary in patients with ARDS to maintain oxygenation. Elevated PEEP places greater importance on monitoring cardiovascular performance and development of barotrauma.