Chapter 14 Monitoring oxygenation
THE ROLES OF OXYGEN IN AEROBIC ORGANISMS
Oxygen has several vital physiological roles:
TISSUE HYPOXIA
As tissue PO2 falls, the biosynthetic and biodegradation systems are the first to succumb. Cell signalling by reactive oxygen species, released at mitochondrial complex III, activates hypoxia-inducible factor-1, a transcription factor upregulating genes important in hypoxic cell survival.3 Oxidative phosphorylation starts to fail at an intracellular PO2 of 0.1–1 mmHg, equivalent to an extracellular PO2 of around 5 mmHg. At this point oxygen-limited cytochrome turnover causes progressive ATP depletion, a process which has been termed ‘dysoxia’.4 Stopgap production continues by anaerobic glycolysis, but without correction of dysoxia there is progressive lactic acidosis and eventual cell death by apoptosis and necrosis. On reoxygenation, further release of reactive oxygen species causes oxidant stress, often overshadowing the hypoxic insult.2
INSPIRED GAS
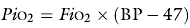
Monitoring the fraction of inspired oxygen (FiO2) is necessary to prevent both hypoxaemia and the adverse effects of excess oxygen. The inspired oxygen tension (PiO2) of humidified gas is determined by the FiO2, the barometric pressure (BP) and the saturated vapour pressure of water (47 mmHg).
TRANSFER OF INSPIRED GAS TO ALVEOLI
Communication between oxygen delivery system and pulmonary alveoli is open if:
ALVEOLAR GAS
DISTRIBUTION OF ALVEOLAR VENTILATION
Clinicians routinely track chest movement, auscultate air entry and examine plain chest radiographs. Although computed tomography scanning can reveal occult overdistension,7 it has logistical disadvantages and is a significant radiation hazard. Electrical impedance tomography is under development as an alternative, and shows promise.8 Simple and non-invasive, it tracks lung volume changes in real time, with potential to optimise alveolar ventilation distribution while limiting overdistension.9
MATCHING OF VENTILATION AND PERFUSION
For efficient gas exchange, the majority of lung units must have well-matched alveolar ventilation and perfusion (V/Q ratios close to 1). Even in health there is a spread to lower and higher V/Q ratios, all clustered around unity. When lungs are diseased, V/Q scatter is much greater, with variable representation across the full spectrum from zero to infinity. Such complexity resists simple bedside quantification. The best method is the multiple inert gas technique (MIGET). MIGET generates a lung model with 50 compartments spanning the full range of V/Q ratios, by measuring the retention and elimination of six inert gases of varying solubility.10,11 Because MIGET is impractical at the bedside, simpler non-invasive modelling of shunt and V/Q mismatch is under evaluation, using FiO2 as a forcing function while tracking haemoglobin oxygen saturation.12 Predictive capacity13 and ease of application14 are encouraging.
THE IDEAL ALVEOLUS AND THE THREE-COMPARTMENT LUNG MODEL
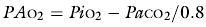
The alveolar PO2 in the ideal compartment (PAO2) is calculated from the alveolar gas:

where R is the respiratory exchange ratio, either measured by indirect calorimetry or assumed to be 0.8. PiO2 is calculated as in Equation 14.1. PaCO2 is arterial PCO2.
Most clinicians use the following approximation:
TRANSFER FROM ALVEOLI TO ARTERIAL BLOOD (PULMONARY OXYGEN TRANSFER)
The MIGET technique has identified V/Q mismatch and intrapulmonary right-to-left shunt as the two main causes of reduced pulmonary oxygen transfer in critical illness.15 Intrapulmonary shunt predominates in the acute respiratory distress syndrome (ARDS), in lobar pneumonia and after cardiopulmonary bypass, whereas V/Q mismatch without shunt is more prominent in chronic lung disease.16
BEDSIDE INDICES OF PULMONARY OXYGEN TRANSFER
These are either tension-based or content-based.
TENSION-BASED INDICES
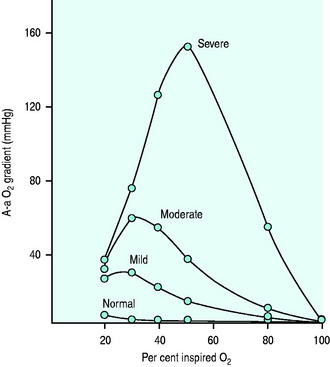
A-a gradient
The A-a gradient is calculated as PAO2 – PaO2, where PAO2 is the ‘ideal’ compartment alveolar PO2 determined from the alveolar gas equation (Equation 14.2). Hypoxaemia can then be classified under two headings:
Raised A-a gradient
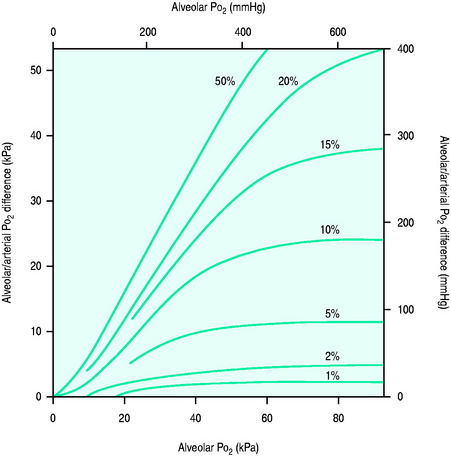
Figure 14.1 Effect of varying FiO2 (PAO2) on A-a gradient with different degrees of intrapulmonary shunt.
(Reproduced from Nunn JF. Oxygen. In: Nunn JF (ed.) Applied Respiratory Physiology, 4th edn. Oxford, UK: Butterworth-Heinemann; 1993: 264, with permission.)
Pao2/Fio2 ratio
The PaO2/FiO2 ratio is used to define acute lung injury and ARDS,18 and is an input variable in the Simplified Acute Physiology Score (SAPS II)19 and lung injury scoring systems.20 At sea level its normal value is ≥ 500 mmHg. In acute lung injury, PaO2/FiO2 < 300 mmHg, whilst in ARDS the ratio is < 200 mmHg.
Its only advantage is simplicity. There are several major disadvantages:
CONTENT-BASED INDICES
Venous admixture (Qs/Qt)
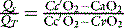
Cc’O2, CaO2 and CvO2 are the oxygen contents of pulmonary end-capillary, arterial and mixed venous blood respectively. CaO2 and CvO2 are calculated using data from arterial and mixed venous blood gas analysis and CO oximetry (see Table 14.4, below). Cc’O2 is derived differently, since pulmonary end-capillary blood cannot be sampled.  is assumed to equal PAO2 as derived from the alveolar gas equation (Equation 14.2).
  (normally close to 1) can then be computed from an algorithm for the HbO2 dissociation curve.22
Disadvantages of venous admixture
When determined at FiO2 = 1, venous admixture is an accurate measure of right-to-left shunt. However, exposure to 100% oxygen causes absorption atelectasis of unstable low V/Q units and increases intrapulmonary shunt.
ARTERIAL BLOOD
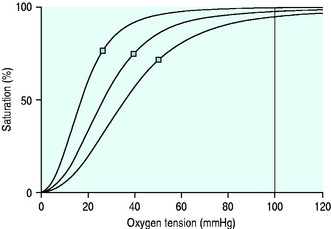
Indices of arterial oxygenation are PaO2 and SaO2. They are linked by the HbO2 dissociation curve (Figure 14.4).
BLOOD GAS ANALYSIS AND CO-OXIMETRY
Arterial blood is collected in a purpose-designed syringe containing lyophilised heparin to a final concentration of 20–50 U/mL. PaO2 measurements are made by a Clark electrode, and SaO2 by CO-oximetry. The Clark electrode works on polarographic principles, and CO-oximeters compute the concentrations of each of the four main haemoglobin species (HbO2, Hb, COHb, MetHb) from light absorbances of haemolysed blood over several wavelengths. SaO2 is functional saturation, determined from concentrations of HbO2 and Hb (see Table 14.4, below). Interference to CO-oximetry arises from substances with competing absorbance spectra, such as bilirubin, HbF, lipid emulsions and intravenous dyes. Newer multi-wavelength techniques reduce or eliminate this interference. SaO2 should always be measured rather than calculated.
ERRORS (Table 14.1)
Temperature correction
Table 14.1 Preanalytic and analytic errors in PO2 measurement
| Preanalytic | Analytic |
|---|---|
| Oxygen diffusing into or out of air bubbles, according to the tension gradient | Interanalyser variability. There is 7–8% measurement variation on the same sample |
| Contamination with flush solution. Discard volume should be 2–3 times the internal volume of cannula and tubing | Inadequate anticoagulation, allowing protein deposition on the electrodes |
| Pseudohypoxaemia. Oxygen consumption in vitro from extreme leukocytosis | Non-linearity at high PO2 (> 150 mmHg) |
| Artifactual PaO2 elevations. With polypropylene syringes stored on ice, the semipermeable plastic allows oxygen ingress, facilitated by the cold-induced increase in oxygen solubility | Maintenance of electrode temperature within narrow limits (37 ± 0.1°C) is critical. PO2 changes by 7% for every degree Celsius temperature change |
| Interference by nitrous oxide and halothane is minimal, provided the polarizing voltage of the electrode does not exceed 600 mV | |
| Quality control materials such as aqueous, perfluorocarbon and bovine haemoglobin solutions are used for convenience, but tonometry is the primary reference method | |
| Arterial blood gas tensions fluctuate breath to breath Intermittent analysis is a snapshot |
CONTINUOUS INTRA-ARTERIAL BLOOD GAS MONITORING (Table 14.2)24
Table 14.2 Continuous intra-arterial PaO2 monitoring – advantages and disadvantages
| Advantages | Disadvantages |
|---|---|
| Eliminates preanalytic errors of intermittent blood gas analysis | The ‘wall’ effect – a sudden decrease in measured Pao2 due to contact with the arterial wall, with averaging of arterial and wall oxygen tensions. The problem is reduced in larger arteries such as the femoral artery |
| More sensitive than pulse oximetry to changes in arterial oxygenation when PaO2 > 70 mmHg (the flat part of the HbO2 dissociation curve). | The ‘flush’ effect. Unless the sensor is inserted a sufficient distance beyond the cannula tip, measured PaO2 can be altered by contamination with the continuous flush solution |
| Free from the sources of error of pulse oximetry (see Table 14.3) | Damping of the arterial waveform |
| Near real-time PaO2 allows prompt tracking of responses to changed ventilator settings | Large footprint of the free-standing monitor |
| Reduced exposure of personnel to potentially infected blood | |
| Reduced blood loss for diagnostic purposes |
Some problems encountered with intra-arterial sensors, particularly artefact due to flow and position, have prompted the development of extracorporeal monitors placed in line but ex vivo. These devices do not provide continuous real-time data. When a measurement is desired, a sample is drawn into the externally located cassette, and then returned. Results are available in 2 minutes. In preterm neonates this method has allowed significant reductions in red cell transfusions.25
TRANSCUTANEOUS PO2 and PCO2 MONITORING
Continuous non-invasive assessment of blood gas tensions is possible with transcutaneous PO2 and PCO2 monitoring. Available systems incorporate PO2 and PCO2 electrodes with integral thermistors and servo-controlled heaters. PO2 measurement utilises the principle of the Clark electrode, while the PCO2 device is a pH-sensitive glass electrode. To achieve good correlation with arterial values, the skin is warmed to a temperature of 42–44°C. Transcutaneous monitors generate reliable PCO2 values in adequately perfused patients, but PO2 measurements are more for trend analysis. Skin warming necessitates frequent site changes to prevent burns, and there is a need for regular recalibration. Monitoring in haemodynamically unstable patients is not recommended. The monitors have a role in the prevention of neonatal hyperoxia, a problem not reliably detected by pulse oximetry.26
PULSE OXIMETRY27,28
For both wavelengths, absorbance (A) is determined as follows:

where I0 = incident light intensity, and I = emergent light intensity. For a given chromophore, A is proportional to its concentration (Beer’s law) and to the path length (Lambert’s law). From the pulsatile (AC) and background (DC) absorbance signals at both wavelengths, a ratio (R) is derived:

SpO2 is then computed from R, using software ‘look-up’ tables of empirically derived relationships between R-values and either SaO2 or fractional saturation (FHbO2) measured in the arterial blood of volunteers breathing hypoxic gas mixtures.
ERROR
Causes of error are set out in Table 14.3. A falsely high SpO2 is of greatest concern.
| Factor | Comment |
|---|---|
| Carboxyhaemoglobin | Measured as HbO2 – SpO2 may be falsely high – see text |
| Methaemoglobin | Absorbs both wavelengths – see text |
| Low saturations | Progressive inaccuracy below 70–80%, usually falsely low SpO2 |
| Prominent venous signal | Dependent limb, tricuspid regurgitation (venous pulsations) – falsely low SpO2 |
| Non-pulsatile flow | Cardiopulmonary bypass – poor signal |
| Vasoconstriction, limb ischaemia, shock states | Low pulsatile signal |
| Motion artefact | Tremor, voluntary movement – falsely low SpO2 |
| Ambient light | Strong sunlight, fluorescent and xenon lamps, flickering light– falsely low SpO2 |
| Anaemia | No effect |
| Dyes | Methylene blue, indocyanine green, indigo carmine – falsely low SpO2 |
| Black skin pigmentation | Variable precision and bias. May require separate calibration |
| Nail polish | Especially blue. Falsely low SpO2. Acrylic nails do not interfere |
| Optical shunting | Due to inadequate probe contact – falsely low SpO2 |
| Radiofrequency interference | Reported with magnetic resonance imaging scanners – falsely high SpO2 |
IMPORTANCE OF PULSE OXIMETRY
Pulse oximeters generate accurate real-time information without calibration, within moments of sensor placement. Their use is mandatory in patient transport, and in high-acuity areas such as operating rooms, recovery rooms and intensive care units. They are also useful screening tools. On the down side, pulse oximeters are the most common source of false alarms in intensive care. They are also insensitive to changes in arterial oxygenation at higher PaO2 values (> 70–100 mmHg).
MONITORING HAEMOGLOBIN–OXYGEN AFFINITY
Haemoglobin–oxygen affinity is the relationship between the oxygen tension of blood and its oxygen content, described by the sigmoid-shaped HbO2 dissociation curve (see Figure 14.4). The P50 is the oxygen tension at SO2 = 0.5. The normal value in humans is 26.7 mmHg. Factors which decrease haemoglobin–oxygen affinity increase the P50. They include acidaemia (the Bohr effect), hypercapnia, high levels of erythrocytic 2,3-diphosphoglycerate (2,3-DPG) and fever, whereas P50 is decreased (increased affinity) by alkalaemia, hypocapnia, low 2,3-DPG levels, hypothermia, COHb, MetHb and FHb.
In the intensive care unit, it is possible to calculate accurate P50 values from a single measurement of blood gases and SaO2 up to SaO2 = 0.97.29 However the impact of haemoglobin–oxygen affinity on tissue oxygenation in critical illness appears to be small,30 making routine monitoring unnecessary.
OXYGEN DYNAMICS
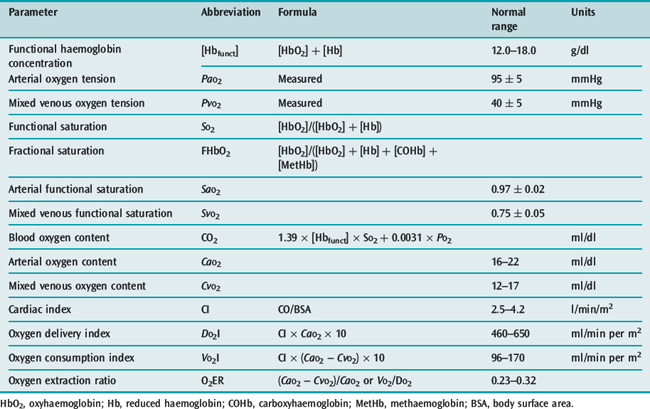
Common indices of oxygen dynamics are set out in Table 14.4.
DO2/VO2 RELATIONSHIPS
More than 30 years ago an association was reported between hyperdynamic oxygen flow patterns and survival after high-risk non-cardiac surgery.31 This led to the hypothesis that an induced perioperative hyperdynamic state is protective, subsequently supported by single-unit studies,32–35 but not by larger multicentre studies.36,37 Much of any benefit may be due to fluid loading, or even increased care and attention. Typical therapeutic goals have been cardiac index (CI) > 4.5 l/min per m2, DO2I > 600 ml/min per m2, VO2I > 170 ml/min per m2. More recently more emphasis has been placed on the DO2I target, since supranormal VO2I values are much harder to achieve. It is now also clear that in sepsis, aggressive pursuit of hyperdynamic goals is counterproductive.38
MEASURING DO2I
Although DO2I determinations require accurate measurements of CI and CaO2, a PA catheter is not essential (see Chapter 12). Normal ranges can be quoted (Table 14.4), but oxygen demand in critical illness is so variable that isolated DO2I measurements are difficult to interpret.
MEASURING VO2I
The two methods of measuring VO2I are the reverse Fick method (Table 14.4) and indirect calorimetry.
Reverse Fick method
The reverse Fick method requires a PA catheter, and has large random errors, ranging from 17% overestimation to 13% underestimation. Changes cannot be detected reliably unless they exceed 20%. The error is increased by lung inflammation, when up to 20% of VO2I can arise from the lungs alone.
MIXED VENOUS BLOOD
MIXED VENOUS PO2 (PvO2)
Venous gas tensions reflect postcapillary and tissue gas tensions. At a PvO2 of 26 mmHg, the average intracellular PO2 has fallen from 11 to 0.8 mmHg.40 A PvO2 below this value is highly suggestive of intracellular hypoxia. However, a normal or high PvO2 does not exclude regional tissue hypoxia, whether cytopathic hypoxia5 or hypoxia due to tissue shunting.41
MIXED VENOUS OXYGEN SATURATION (Svo2)
SvO2 as a therapeutic target (> 0.7) failed to improve survival in a multicentre trial.43 Only two-thirds of the treatment group achieved the SvO2 target. Like PvO2, SvO2 is insensitive to cytopathic hypoxia and tissue shunting. In chronic heart failure, low values can be surprisingly well tolerated.
CENTRAL VENOUS SATURATION (ScvO2)43–45
In an influential single-centre study of the early hypodynamic phase of severe sepsis and septic shock, resuscitation guided by a ScvO2 target of > 0.7, as well as by central venous pressure and mean arterial pressure values, appeared to reduce 28-day and 60-day mortality, and duration of hospitalization.45 It remains to be seen whether this success can be replicated in larger trials, and if so whether intermittent sampling is of equivalent benefit. Nevertheless, ScvO2 currently has equal billing with SvO2 in the management guidelines of the Surviving Sepsis Campaign.46
VENOARTERIAL PCO2 GRADIENT (ΔPCO2)
 PCO2 (normally about 6 mmHg) is markedly increased during cardiac arrest and in experimental low-output states, but lacks sensitivity and specificity as a global index of tissue hypoxia. A sudden increase in the respiratory quotient (VCO2/VO2), or in the venoarterial CO2 tension difference/arteriovenous O2 content difference47 may be more reliable markers of the onset of anaerobic metabolism.
REGIONAL OXYGENATION INDICES
REGIONAL PCO248
 . A rising CO2 gap merely signals falling tissue blood flow. It cannot identify the onset of anaerobic metabolism.
GASTRIC TONOMETRY49
The impetus to develop regional gastric capnometry was the knowledge that splanchnic hypoperfusion occurs early in circulatory shock, tends to persist as ‘covert shock’, and is manifested by intramucosal hypercapnia and acidosis. A gastric tonometer was therefore developed as a modified nasogastric tube with a silicone balloon 11.4 cm from the tip. Gastric mucosal CO2 equilibrates with luminal CO2, which equilibrates with (and is measured in) fluid filling the balloon. Early on, this fluid was saline. Subsequently air was found to have more rapid equilibration characteristics, and automated cycling of air through an infrared CO2 analyser was far more efficient than measuring saline PCO2 intermittently and applying time-based correction factors.
The original concept involved calculation of intramucosal pH (pHi) via the Henderson–Hasselbalch equation, using gastric luminal PCO2 and arterial  . Intramucosal acidosis was defined as pHi < 7.3, and taken to indicate inadequate splanchnic perfusion. Changing the monitoring end-point from pHi to the mucosal–arterial CO2 gap (normally 8–10 mmHg) removed the most fundamental flaw – the use of arterial
  as a surrogate for mucosal
  . Automated air tonometry combined with simultaneous end-tidal CO2 measurement allows the regular calculation of a gastric to end-tidal CO2 gap, a parameter linked to outcome in high-risk surgery.50
DIRECT TISSUE PO2 MEASUREMENT
In patients this is largely impractical. Measurements have been recorded primarily in animal models in the brain, subcutaneous tissue, muscle and renal beds under a variety of perfusion insults.52 Tensions are commonly around 30–45 mmHg, but can range from < 10 mmHg in the renal medulla to > 70 mmHg in subcutaneous tissue.
OTHER REGIONAL TECHNIQUES
Orthogonal polarisation spectroscopy (OPS) allows real-time in vivo imaging of microcirculatory blood flow.42 Tissue beds visualised in intensive care have included the sublingual, rectal, oral and ileal (via stoma) microcirculations. OPS can be combined with near-infrared spectroscopy to monitor deeper regional mitochondrial redox status, and with reflectance spectrophotometry for measurement of superficial microcirculatory oxygen saturation. Combinations of this type provide uniquely integrated information on oxygen transport distribution during sepsis and septic shock.
Other techniques showing promise include in vivo magnetic resonance imaging53 and optical spectroscopy.54
1 Schumacker PT. Cell metabolism and tissue hypoxia. In: Albert RK, Slutsky A, Ranieri M, et al, editors. Clinical Critical Care Medicine. Philadelphia: Mosby Elsevier; 2006:41-50.
2 Bayir H. Reactive oxygen species. Crit Care Med. 2005;33(Suppl.):S498-S501.
3 Schumacker PT. Hypoxia-inducible factor-1 (HIF-1). Crit Care Med. 2005;33(Suppl.):S423-S425.
4 Connett RJ, Honig CR, Gayeski TE, et al. Defining hypoxia: a systems view of VO2, glycolysis, energetics, and intracellular PO2. J Appl Physiol. 1990;68:833-842.
5 Fink MP. Bench to bedside review: cytopathic hypoxia. Crit Care. 2002;6:491-499.
6 Deby-Dupont G, Deby C, Lamy M. Oxygen therapy in intensive care patients: a vital poison? In: Vincent J-L, editor. Yearbook of Intensive Care and Emergency Medicine. Berlin: Springer-Verlag; 1999:417-432.
7 Terragni PP, Rosboch G, Tealdi A, et al. Tidal hyperinflation during low tidal volume ventilation in acute respiratory distress syndrome. Am J Respir Crit Care Med. 2007;175:160-166.
8 Dunlop S, Hough J, Riedel T, et al. Electrical impedance tomography in extremely prematurely born infants and during high frequency oscillatory ventilation analyzed in the frequency domain. Physiol Meas. 2006;27:1151-1165.
9 Wolf GK, Arnold JH. Noninvasive assessment of lung volume: respiratory inductance plethysmography and electrical impedance tomography. Crit Care Med. 2005;33(Suppl.):S163-S169.
10 West JB. Ventilation–perfusion relationships. Am Rev Respir Dis. 1977;116:919-943.
11 Yu G, Yang K, Baker AB, et al. The effect of bi-level positive airway pressure mechanical ventilation on gas exchange during general anaesthesia. Br J Anaesth. 2006;96:522-532.
12 Kjaergaard S, Rees S, Malczynski J, et al. Non-invasive estimation of shunt and ventilation–perfusion mismatch. Intens Care Med. 2003;29:727-734.
13 Rees SE, Kjaergaard S, Andreassen S, et al. Reproduction of MIGET retention and excretion data using a simple mathematical model of gas exchange in lung damage caused by oleic acid infusion. J Appl Physiol. 2006;101:826-832.
14 Kjaergaard S, Rees SE, Gronlund J, et al. Hypoxaemia after cardiac surgery: clinical application of a model of pulmonary gas exchange. Eur J Anaesthesiol. 2004;21:296-301.
15 D’Alonzo GE, Dantzker DR. Respiratory failure, mechanisms of abnormal gas exchange, and oxygen delivery. Med Clin North Am. 1983;67:557-571.
16 Rodriguez-Roisin R, Roca J. Mechanisms of hypoxaemia. Intens Care Med. 2005;31:1017-1019.
17 Nirmalan M, Willard T, Columb MO, et al. Effect of changes in arterial-mixed venous oxygen content difference (C(a-v)O2) on indices of pulmonary oxygen transfer in a model ARDS lung. Br J Anaesth. 2001;86:477-485.
18 Bernard GR, Artigas A, Brigham KL, et al. Report of the American–European consensus conference on ARDS: definitions, mechanisms, relevant outcomes and clinical trial coordination. Intens Care Med. 1994;20:225-232.
19 Le Gall J-R, Lemeshow S, Saulnier F. A new simplified acute physiology score (SAPS II) based on a European/North American multicentre study. JAMA. 1993;270:2957-2963.
20 Murray JF, Mathay MA, Luce JM, et al. An expanded definition of the adult respiratory distress syndrome. Am Rev Respir Dis. 1988;138:720-723.
21 Whiteley JP, Gavaghan DJ, Hahn CE. Variation of venous admixture, SF6 shunt, PaO2, and the PaO2/FiO2 ratio with FiO2. Br J Anaesth. 2002;88:771-778.
22 Siggaard-Andersen O, Siggaard-Andersen M. The oxygen status algorithm: a computer program for calculating and displaying pH and blood gas data. Scand J Clin Lab Invest. 1990;50(Suppl. 203):29-45.
23 Nirmalan M, Willard T, Khan A, et al. Changes in arterial–mixed venous oxygen content difference (CaO2– CvO2) and the effect on shunt calculations in critically ill patients. Br J Anaesth. 1998;80:829-831.
24 Venkatesh B, Hendry S-P. Continuous intra-arterial blood gas monitoring. Intens Care Med. 1996;22:818-828.
25 Widness JA, Madan A, Grindeanu LA, et al. Reduction in red blood cell transfusions among preterm infants: results of a randomized trial with an in-line blood gas and chemistry monitor. Pediatrics. 2005;115:1299-1306.
26 Rudiger M, Topfer K, Hammer H, et al. A survey of transcutaneous blood gas monitoring among European neonatal intensive care units. BMC Pediatr. 2005;5:30.
27 Jubran A. Pulse oximetry. In: Tobin MJ, editor. Principles and Practice of Intensive Care Monitoring. New York: McGraw Hill; 1998:261-287.
28 McMorrow RCN, Mythen MG. Pulse oximetry. Curr Opin Crit Care. 2006;12:269-271.
29 Morgan TJ, Koch D, Morris D, et al. Red cell 2,3-diphosphoglycerate concentrations are reduced in critical illness without net effect on in vivo P50. Anaesth Intens Care. 2001;29:479-483.
30 Gutierrez G. The unpretentious role of 2,3-diphosphoglycerate in critical illness. Crit Care Med. 2005;33:2423-2424.
31 Shoemaker WC, Montgomery ES, Kaplan E, et al. Physiologic patterns in surviving and nonsurviving shock patients. Arch Surg. 1973;106:630-636.
32 Boyd O, Grounds M, Bennett D. A randomized clinical trial of the effect of deliberate perioperative increase of oxygen delivery on mortality in high-risk surgical patients. JAMA. 1993;270:2699-2707.
33 Wilson J, Woods I, Fawcett J, et al. Reducing the risk of major elective surgery: randomised controlled trial of preoperative optimisation of oxygen delivery. Br Med J. 1999;318:1099-1103.
34 Lobo SM, Salgoda PF, Castillo VGT, et al. Effects of maximizing oxygen delivery on morbidity and mortality in high-risk surgical patients. Crit Care Med. 2000;28:3396-3404.
35 Pearse R, Dawson D, Fawcett J, et al. Early goal-directed therapy after major surgery reduces complications and duration of hospital stay. A randomised, controlled trial. Crit Care. 2005;9:687-693.
36 Takala J, Meier-Hellmann A, Eddleston J, et al. Effect of dopexamine on outcome after major abdominal surgery: a prospective, randomized, controlled multicenter study. European Multicenter Study Group on Dopexamine in Major Abdominal Surgery. Crit Care Med. 2000;28:3417-3423.
37 Sandham JD, Hull RD, Brant RF, et alCanadian Critical Care Clinical Trials Group. A randomized, controlled trial of the use of pulmonary-artery catheters in high-risk surgical patients. N Engl J Med. 2003;348:5-14.
38 Gattinoni L, Brazzi L, Pelosi P. Does cardiovascular optimization reduce mortality? In: Vincent J-L, editor. Yearbook of Intensive Care and Emergency Medicine. Berlin: Springer-Verlag; 1996:308-318.
39 Walsh TS, Monaco F. Gas exchange measurement in the ICU. In: Vincent J-L, editor. Yearbook of Intensive Care and Emergency Medicine. Berlin: Springer-Verlag; 2005:632-643.
40 Siggaard-Andersen O, Fogh-Andersen N, Gøthgen IH, et al. Oxygen status of arterial and mixed venous blood. Crit Care Med. 1995;23:1284-1293.
41 Elbers PW, Ince C. Bench-to-bedside review: mechanisms of critical illness – classifying microcirculatory flow abnormalities in distributive shock. Crit Care. 2006;10:221.
42 Marx G, Reinhart K. Venous oximetry. Curr Opin Crit Care. 2006;12:263-268.
43 Gattinoni L, Brazzi L, Pelosi P, et al. A trial of goal-orientated hemodynamic therapy in critically ill patients. N Engl J Med. 1995;333:1025-1032.
44 Rivers E, Nguyen B, Havstad S, et al. Early goal-directed therapy in the treatment of severe sepsis and septic shock. N Engl J Med. 2001;345:1368-1377.
45 Pearse R, Dawson D, Fawcett J, et al. Changes in central venous saturation after major surgery, and association with outcome. Crit Care. 2005;9:R694-R699.
46 Dellinger RP, Carlet JM, Masur H, et al. Surviving Sepsis Campaign guidelines for management of severe sepsis and septic shock. Crit Care Med. 2004;32:858-873.
47 Mekontso-Dessap A, Castelain V, Anguel N, et al. Combination of venoarterial PCO2 difference with arteriovenous O2 content difference to detect anaerobic metabolism in patients. Intens Care Med. 2002;28:272-277.
48 Marik PE. Regional carbon dioxide monitoring to assess the adequacy of tissue perfusion. Curr Opin Crit Care. 2005;11:245-251.
49 Creteur J. Gastric and sublingual capnometry. Curr Opin Crit Care. 2006;12:272-277.
50 Lebuffe G, Vallet B, Takala J, et al. A European, multicenter, observational study to assess the value of gastric-to-end tidal PCO2 difference in predicting postoperative complications. Anesth Analg. 2004;99:166-172.
51 Miami Trauma Clinical Trials Group. Splanchnic hypoperfusion-directed therapies in trauma: a prospective, randomized trial. Am Surg. 2005;71:252-260.
52 Venkatesh B, Morgan TJ. Monitoring tissue gas tensions in critical illness. In: Vincent J-L, editor. Yearbook of Intensive Care and Emergency Medicine. Berlin: Springer-Verlag; 2001:251-265.
53 Zaharchuk G, Busse RF, Rosenthal G, et al. Noninvasive oxygen partial pressure measurement of human body fluids in vivo using magnetic resonance imaging. Acad Radiol. 2006;13:1016-1024.
54 Mayevsky A, Rogatsky G. Mitochondrial function in vivo evaluated by NADH fluorescence: From animal models to human studies. Am J Physiol Cell Physiol. 2007;292:C615-C640.