Ketoacidosis and Hyperosmolar Coma
Ketoacidosis
For many years, diabetic ketoacidosis (DKA) was considered a complication only of type 1 (autoimmune) diabetes.1 That is no longer the case. Increasingly, diabetic ketosis and ketoacidosis is seen in persons previously characterized clinically as having type 2 diabetes, with non-Caucasian populations being primarily susceptible.2–5 In essence, the boundaries between type 1 and type 2 disease have blurred. Autoimmune markers may be seen in classic type 1 and 2 phenotypes. A helpful classification divides patients into four categories, utilizing the presence or absence of biomarkers of autoimmunity (A+ or A−) and the presence or absence of residual insulin secretory capacity as evidenced by C-peptide release (β+ or β−).4,5 Classic type 1 disease would be A+β− while classic type 2 would be A−β+. Overlaps are A+β+ and A−β−. The presence of continued capacity to secrete insulin, even if less than normal, means recovery from an acute complication may not require permanent therapy.2,3,5
Fulminant type 1 diabetes is a variant seen mostly in the orient (Japan and Korea). It begins suddenly with ketoacidosis and is permanent. Originally thought to be non-autoimmune, there is now evidence to suggest that some patients have signs of autoimmunity.6–8 It thus may be A−β− or A+β−. The disease appears to develop complications earlier than classic type 1 diabetes.8
Pathophysiology
Multiple metabolic derangements accompany DKA. In general, the body is shifted into a major catabolic state with breakdown of glycogen stores, hydrolysis of triglycerides in adipose tissue, and mobilization of amino acids from muscle. The fuels newly released from peripheral tissues become the substrates used by the liver for the accelerated production of glucose and ketone bodies—the hallmarks of uncontrolled diabetes.9,10 Hyperglycemia-driven osmotic diuresis and rising concentrations of acetoacetate and β-hydroxybutyrate, in turn, cause loss of body fluids, abnormalities in plasma electrolytes, and metabolic acidosis. The mechanisms underlying the development of ketoacidosis are basically similar to those occurring in nondiabetic subjects during a fast, with one exception: No insulin is available to prevent progression to full-blown acidosis. The similarities and differences can be outlined as follows. In the postprandial state after absorption of food, plasma glucose concentrations gradually fall over a period of several hours. As a result, insulin release from the pancreas is diminished, and a simultaneous rise in glucagon secretion takes place.10–13 These changes occur smoothly in an integrated fashion, thereby maintaining plasma glucose levels in the nonhypoglycemic range. Decreased insulin secretion simultaneously results in mobilization of free fatty acids from adipocytes, with the body shifted toward a lipid economy so that glucose is “spared” for use by the brain,10,14,15 which cannot oxidize fatty acids except in trace quantities.16,17 A portion of the mobilized fatty acids are taken up by the liver for conversion to acetoacetic and β-hydroxybutyric acids. These “ketone bodies,” which are efficiently oxidized by nonhepatic tissues, including the brain, provide backup substrate for the central nervous system should hepatic glucose production be inadequate for any reason.15–18 Normally, fasting ends at breakfast, and no significant ketosis develops. When a fast is extended, ketone concentrations increase to the range of 2 to 4 millimolar (mM) but not much higher, because both fatty acids and ketones have the ability to stimulate insulin release19–21 (Fig. 20-1).
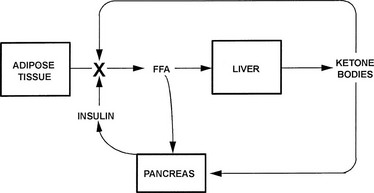
FIGURE 20-1 Feedback control of ketosis during an extended fast. Ketogenesis is activated by a rise in the molar ratio of glucagon to insulin, which induces lipolysis in adipose tissue and fatty acid oxidation in the liver. As the concentrations of circulating fatty acids and ketones rise, the β cell is stimulated to release insulin, with lipolytic rates fixed at modest levels and further rise in glucagon limited. These adaptations allow modest ketosis without the danger of ketoacidosis. In insulin-dependent diabetic subjects, the insulin loop is missing.
In diabetes, the omission of insulin or a stress-induced counterregulatory hormone release that overrides the effect of the usual dose of insulin initiates a process qualitatively similar to fasting, with the exception that the insulin segment of the feedback loop is missing.10,13,20 As a consequence, concentrations of free fatty acids and ketone bodies rise in an uncontrolled fashion and produce acidosis, coma, and death.
Hormonal Initiation of Ketoacidosis
For many years, the hormonal abnormality initiating the hyperglycemia and metabolic acidosis that accompany DKA was thought to be insulin deficiency alone. It is now clear that this view is incorrect and that insulin deficiency coupled with glucagon excess, that is, a rise in the molar ratio of glucagon to insulin, is the operative mechanism. The evidence in support of this concept has been extensively reviewed.12,22,23 The most important study was that of Gerich and colleagues, who showed that withdrawal of insulin from patients with insulin-dependent diabetes was accompanied by rapid increases in plasma glucagon, glucose, and ketone levels that were markedly obtunded when glucagon release was blocked by somatostatin.24
The role of glucagon in inducing hepatic glucose overproduction in uncontrolled diabetes parallels its actions during an overnight fast, in which about 75% of glucose output can be shown to be glucagon mediated.25 Further evidence that glucagon is critical to the initiation of hyperglycemia comes from studies in which simultaneous insulin and glucagon deficiency was produced by infusion of somatostatin26 or total pancreatectomy.27 If insulin deficiency alone were the cause of severe hyperglycemia, one would expect significant overproduction of glucose under both experimental circumstances. In neither dogs nor humans did such overproduction occur. Similarly, patients with somatostatinoma, who have suppression of both glucagon and insulin, exhibit only mild hyperglycemia, an additional finding compatible with the interpretation that major increases in plasma glucose levels occur only in the presence of a relative or absolute excess of glucagon.28
Glucagon also appears to play a central role in initiating ketogenesis. As noted previously, blockade of glucagon release markedly slows the appearance of ketosis in diabetic patients withdrawn from insulin.24 Conversely, administration of glucagon to diabetic humans enhances the conversion of fatty acids to ketone bodies.29–31 Along the same lines, the presence of a glucagonoma resulted in plasma ketone levels four times normal despite the fact that free fatty acid concentrations were not elevated.32 Glucagonoma may also cause ketoacidosis in the face of intact β cells.33 Direct demonstration of the powerful ketogenic effect of glucagon in the liver came from studies in which rats were administered glucagon in vivo (in both physiologic and pathophysiologic amounts).34 The animals did not become either hyperglycemic or ketotic, because a compensatory rise in insulin (secondary to glucagon infusion) allowed disposal of the glucose produced by the liver and prevented a rise in free fatty acids. When the livers from these animals were removed and perfused with fatty acids, they exhibited the shift to activated fatty acid oxidation and ketogenesis expected in fasting and uncontrolled diabetes. Thus a ketogenic liver had been produced in nonketotic animals despite the presence of concentrations of insulin in plasma that were higher than normal. Glucagon has also been shown to stimulate ketone body production directly in homogenates of liver, liver slices, hepatocytes, and isolated perfused liver.35
Although there is good evidence that the molar ratio of glucagon to insulin is the primary control unit for carbohydrate and lipid metabolism, this finding does not imply that other hormones do not play a role. Most systems in the body have redundant regulatory mechanisms, and catecholamines, cortisol, growth hormone, and thyroid hormones can all increase rates of hepatic ketogenesis, albeit less efficiently.36,37 Concentrations of counterregulatory hormones are elevated on admission in patients with ketoacidosis,38,39 either as the consequence of an initiating illness, such as infection, or in response to the stress of ketoacidosis itself. However, when ketoacidosis is induced by withdrawing insulin from well-controlled subjects with insulin-dependent diabetes, glucagon concentrations rise before any increase in other counterregulatory hormones, which suggests that the α-cell hormone is pivotal in causing metabolic decompensation.40,41
Functionally, the two hormones are metabolic antagonists in directing fuel production and utilization.11,12 They act independently through distinct receptors and focus on different target tissues. The primary direct effects of insulin are probably on muscle and fat (to enhance glucose transport into cells and inhibit lipolysis), whereas the primary direct effects of glucagon are exerted on the liver (to increase glycogenolysis, gluconeogenesis, and ketogenesis). It is attractive to consider that in the primary domain of each hormone, the other acts predominantly as an antagonist. Good evidence indicates that insulin functions to a large extent as an antiglucagon in the liver, with direct effects being minimal in the absence of glucagon-induced metabolic changes.31,42,43 The insulin signaling pathway is very complicated, but it is initiated by phosphorylation of intracellular substrates after binding to its receptor.44,45 Most of the initial effects of glucagon are consequent to the generation of cyclic adenosine monophosphate (cAMP).46 In rodents, glucagon can act independently of cAMP, possibly through the protein kinase C signaling system.47 It is probable that a single glucagon receptor activates both pathways,48,49 although isoforms could exist. Counteraction of glucagon by insulin may be the result of direct inhibition of the cAMP-dependent protein kinase.50
Hyperglycemia
The hyperglycemia of uncontrolled diabetes is caused by two alterations in glucose metabolism: increased hepatic glucose production and diminished utilization of the hexose in muscle and adipose tissue. When insulin is withdrawn from well-controlled subjects with insulin-requiring diabetes, hepatic glucose output doubles within 2 hours.41 Simultaneously, clearance of glucose from plasma decreases consequent to falling insulin concentrations. Doubtless, insulin resistance contributes to the decreased uptake and utilization of glucose.51 A significant part of the resistant state may be caused by the accumulation of fat within insulin target tissues. Increased fatty acid oxidation then results in impairment of insulin signaling to the glucose transport machinery and suppression of glucose metabolism.52–54 A third factor, present to a variable extent, is volume depletion secondary to the hyperglycemia-induced osmotic diuresis. If this complication becomes severe enough to cause a fall in urine output, the escape pathway for glucose is removed, and the hyperglycemia worsens.55 This response accounts for the fact that administration of fluids alone can lower the plasma glucose concentration in ketoacidosis.39
The mechanisms by which a rise in the molar glucagon-to-insulin ratio alters hepatic glucose metabolism have been the subject of much study. Cyclic-AMP-dependent activation of glycogenolysis represents one component. Another involves acceleration of the gluconeogenic pathway. In uncontrolled diabetes (or in conditions of glucose need such as fasting or exercise), increased hepatic glucose production is mediated by a fall in phosphofructokinase (PFK) activity, which inhibits glycolysis (flux from glucose 6-phosphate → pyruvate), and a rise in fructose 1,6-bisphosphatase activity (FBPase), which removes a block to gluconeogenesis (flux over the sequence pyruvate → oxaloacetate → phosphoenolpyruvate → glucose 6-phosphate → glucose). The latter pathway is fed primarily by amino acids transported from muscle (primarily alanine and glutamine), lactate, and (to a small extent) glycerol.10 Substrate traffic over the switch point was originally thought to be mediated primarily by fructose 2,6-bisphosphate (F-2,6-P2), a regulatory intermediate that stimulates PFK and inhibits FBPase.56,57 In vitro F-2,6-P2 activates PFK allosterically and inhibits FBPase competitively. F-2,6-P2 levels are controlled by an interesting bifunctional enzyme, 6-phosphofructo-2-kinase/fructose 2,6-bisphosphatase (PFK-2/FBPase-2). Glucagon excess (relative to insulin), acting through the generation of cAMP, causes a fall in F-2,6-P2 concentrations as a result of phosphorylation of PFK-2/FBPase-2 converting it from a kinase to a phosphatase, with the result that synthesis of F-2,6-P2 slows or ceases and its hydrolysis commences (Fig. 20-2).
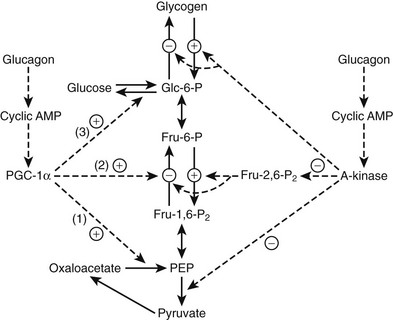
FIGURE 20-2 Regulation of glycolysis and gluconeogenesis by glucagon. Glucagon blocks glycolysis and activates gluconeogenesis by altering two major mediators, fructose 2,6-bisphosphate (Fru-2,6-P2) and peroxisome proliferator activate receptor coactivator 1α (PGC-1α). Phosphorylation of 6-phosphofructokinase/fructose 2,6-bisphosphatase by cyclic AMP dependent kinase (A kinase) converts the enzyme from a kinase to a phosphatase, thereby inhibiting synthesis of Fru-2,6-P2 and blocking glycolysis (see text). The A-kinase also activates glycogenolysis, inhibits glycogen synthesis, and inhibits pyruvate kinase. Glucagon stimulates PGC-1α synthesis and activity. PGC-1α, a master metabolic regulator, primarily enhances gluconeogenesis via induction of the gluconeogenic enzymes phosphoenolpyruvate carboxykinase (1), fructose 1,6-bisphosphatase (2), and glucose 6-phosphatase (3). Dashed lines indicate regulatory activities.
There is no doubt that F-2,6-P2 is the only significant activator of PFK and is thus responsible for stimulation of glycolysis in liver in the fed state (low glucagon-to-insulin ratio). However, it appears that F-2,6-P2 is not present in sufficient concentrations to inhibit FBPase after refeeding in vivo.58,59
When fasted rats were fed glucose, gluconeogenesis measured by nuclear magnetic resonance (NMR) spectroscopy showed no inhibition despite significant increases in F-2,6-P2.59 It may well be that diminished F-2,6-P2 directly accounts for the inhibited glycolysis of fasting or diabetes, but it may not be primarily or significantly responsible for activating gluconeogenesis. Interestingly, F-2,6-P2 has multiple effects beyond control of glycolysis and gluconeogenesis.60 Increases in the primary gluconeogenic enzymes may account for increased gluconeogenic flux. A major factor appears to be increased synthesis of peroxisome proliferator-activated receptor γ-coactivator-1α (PGC-1α), which stimulates gluconeogenesis by activating synthesis of phosphoenolpyruvate carboxykinase, fructose-1, 6-bisphosphatase and glucose-6-phosphatase.61,62 Glucagon-induced production of cAMP, acting through the cAMP response element binding protein (CREB) gene is necessary for PGC-1α synthesis and activation.63 PGC-1α in turn coactivates the hepatic glucocorticoid receptor and the transcription factor hepatic nuclear factor 4α, both of which are necessary for full enhancement of gluconeogenesis (see Fig. 20-2). PGC-1α is involved in many other pathways, including mitochondrial biogenesis and fatty acid oxidation, as will be discussed later.62 The PGC-1α isoform induces both gluconeogenesis and fatty acid oxidation in the liver; PGC-1β induces oxidation only.64
Additional enzymes are altered under catabolic conditions such as fasting and uncontrolled diabetes. For example, pyruvate carboxylase, a distinctive third gluconeogenic enzyme, is also elevated.57,65 Final rates of gluconeogenesis are influenced not only by changes in the key enzymatic activities induced directly by alterations in the glucagon-to-insulin ratio but also by the modulating effects of other hormones,66,67 availability of substrate,68 rates of fatty acid oxidation,53 and transcription factors like Fox 01.69 In short, it is best to consider the changes leading to glucose overproduction in the liver as reflecting a coordinated series of alterations downstream from the hormonal initiators.
Ketogenesis
Metabolic acidosis caused by the overproduction of acetoacetic and β-hydroxybutyric acids requires changes in the metabolism of adipose tissue and the liver.70,71
Long-chain fatty acids derived from triglyceride stores in the adipocyte are the principal substrate for ketone production in the liver. Only under circumstances in which fatty acid oxidation in the hepatocyte is blocked do amino acids such as leucine function efficiently as precursors for acetoacetate synthesis.72 Long-chain fatty acids are mobilized from fat stores under the combined influence of insulin deficiency/counterregulatory hormone excess acting on the intracellular hormone-sensitive lipase.10,73 It is likely that the major activator is cAMP, a rise in its concentration leading to phosphorylation and enhanced activity of the enzyme. Negative modulation is mediated by a membrane phosphoprotein called perilipin A coupled to insulin’s suppressive effect. Ordinarily, ketone production is dependent on delivery of fatty acids to the liver. However, if the liver is fatty, which is not uncommon in cases of poorly controlled diabetes, hepatic triglyceride may serve as the source of fatty acids. This adaptation accounts for differences in the ease of reversibility of ketosis. Ingestion of a small amount of carbohydrate after a fast calls forth endogenous insulin release and immediately reverses fasting ketosis by inhibiting lipolysis in the adipocyte. In DKA, because the liver contains significant amounts of triglyceride, ketogenesis continues for hours after free fatty acid levels in plasma have returned to normal. How intracellular triglyceride lipase activity in the liver is controlled is not well understood. It is possible that a hormone-sensitive lipase activated by glucagon is operative.30,74
Although increased transport of fatty acids to the liver is normally required for significant ketogenesis to supervene, increased fatty acids alone are not enough. In the normal, nonfasted state, fatty acids taken up into the hepatocyte are reesterified to triglyceride and transported back out into plasma as very-low-density lipoprotein.70 Rates of fatty acid oxidation are low. However, when the molar ratio of glucagon to insulin rises, fatty acid oxidation is disinhibited, and incoming fatty acids can be converted to acetoacetate and β-hydroxybutyrate. The key regulatory site for fatty acid oxidation is the initial step in the process catalyzed by the enzyme carnitine palmitoyltransferase I (CPT I)70,75,76 (Fig. 20-3).
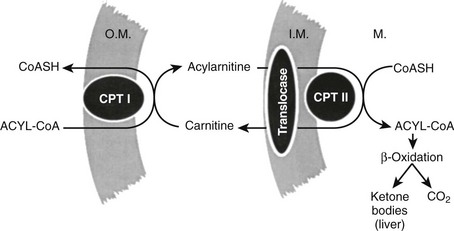
FIGURE 20-3 The fatty acid oxidizing system in the liver. Long-chain fatty acids are activated to coenzyme A (CoA) derivatives on arrival in the liver (acyl-CoA). Acyl-CoA cannot traverse the mitochondrial inner membrane. Entry is accomplished by transesterification to carnitine by carnitine palmitoyltransferase I (CPT I) located in the outer membrane (O.M.). Transport across the inner membrane (I.M.) is accomplished by the translocase carnitine/acylcarnitine translocase. Reversal of the transesterification then occurs on the matrix side by carnitine palmitoyltransferase II (CPT II). The capacity for fatty acid oxidation is fixed and large, so normally the rate-limiting step is CPT I. Tricarboxylic acid cycle activity is low in the liver (acetyl-CoA → CO2), so the bulk of oxidized fatty acid goes to ketone bodies.
Its function is to effect conversion of the coenzyme A (CoA) esters of long-chain fatty acids to acylcarnitines, which unlike fatty acyl CoAs, can be transported across the inner mitochondrial membrane by carnitine/acylcarnitine translocase (CACT).77 Once through the membrane, the reaction is reversed by CPT II, and the newly re-formed fatty acyl CoA enters the fatty acid oxidative pathway. In the liver, the major product is ketone bodies, and terminal oxidation to carbon dioxide and water is limited. In tissues such as the muscle and the heart, complete oxidation of fatty acids to carbon dioxide and water results in the generation of adenosine triphosphate in the electron transport chain. CPT I exists in three isoforms. CPT1A is the liver form, CPT1B is the muscle form, and CPT1C is the brain form,76 but it is also found in testis. In the fed state and with well-controlled diabetes, CPT I is inhibited by malonyl CoA.78 The total amount of enzyme present does not change markedly through wide swings of the regulatory cycle.79 Regulation of fat oxidation by malonyl CoA makes physiologic sense because it is also the first committed intermediate in long-chain fatty acid synthesis. When malonyl CoA concentrations are high, the inhibitory interaction with CPT I precludes oxidation of the newly formed fatty acids and avoids an energetically wasteful futile cycle.70,71 Malonyl CoA concentrations are maximal in the fed state, but they fall rapidly with fasting and uncontrolled diabetes. This change, coupled with desensitization of CPT I to the inhibitor, poises the liver for ketogenesis80,81; accelerated production of acetoacetate and β-hydroxybutyrate begins when long-chain fatty acids arrive in the liver at increased concentrations. Once CPT I and the oxidative sequence is activated, rates of ketogenesis reflect substrate concentration; that is, the higher the concentration of fatty acids, the greater the ketone production until Vmax is reached.
The mechanism by which malonyl CoA inhibits CPT I is still not completely understood. It is believed that malonyl CoA binds through the CoA moiety at the palmitoyl CoA site on the enzyme and that its carboxyl group forms an ionic interaction with an amino acid, probably histidine, at a separate site. When bound, the regulator impairs palmitoyl CoA binding directly and by alteration of membrane fluidity.80,82 Molecular cloning of CPT I has definitively eliminated the possibility that malonyl CoA binds to a separate regulatory subunit.83
As mentioned earlier, the activation of fatty acid oxidation as well as gluconeogenesis is enhanced by peroxisome-proliferator γ-coactivator 1. Both α and β isoforms of PGC-1 stimulate mitochondrial biogenesis, including the genes of fatty acid oxidation. They also activate the oxidative pathway.84–86 Glucagon-stimulated cAMP formation causes transcriptional induction of PGC-1α, which in turn activates carnitine palmitoyltransferase 1A expression in the liver, the rate-limiting step in fatty acid oxidation.86 Peroxisome-proliferator-activated receptors themselves play a prominent role in lipid metabolism. PPAR-α in liver and PPAR-δ in adipose tissue induce the genes of β-oxidation utilizing PGC-1α.87
PPAR-γ induces lipogenesis and fat storage in contrast to PPAR-α. The most potent stimulator of lipogenesis appears to be the transcription factor SREPB-1c (sterol response element binding protein-1c) which is activated by insulin.69,88 SREBP-1c transcriptionally increases all the genes for fatty acid synthesis, especially acetyl CoA carboxylase and fatty acid synthase. Glucagon inhibits SREBP-1c activation,88 so the ratio of glucagon to insulin is the actual regulator, as is generally true in the metabolism of carbohydrate and lipids described earlier. Another pro-lipogenic transcription factor is carbohydrate responsive element binding protein (ChRBP).89,90 It is regulated by xyulose-5-phosphate, which is increased by carbohydrate feeding.90
All of the above factors account for the reciprocal relationship between fatty acid oxidation and fatty acid synthesis. Simultaneous activation of both pathways is never allowed. Malonyl CoA directs traffic between the two pathways. As noted earlier, an increase in the molar glucagon-to-insulin ratio (a relative or absolute glucagon excess) inhibits glycolysis at the phosphofructokinase step. This inhibition of glycolysis interrupts flux from glucose 6-phosphate down the glycolytic pathway to pyruvate, which in turn causes a fall in cytosolic citric acid.81 A lowered citrate concentration has dual effects: decreased production of cytosolic acetyl CoA, the substrate for malonyl CoA formation (citrate is the source of cytosolic acetyl CoA via the citrate cleavage enzyme), and deactivation of acetyl CoA carboxylase, the enzyme that catalyzes the conversion of acetyl CoA to malonyl CoA (citrate activates the carboxylase allosterically).91
Acetyl CoA carboxylase (ACC) is sensitive to inhibition by phosphorylation, which in a setting of high glucagon/low insulin, appears to be mediated primarily by AMP-activated protein kinase.92 Cyclic AMP-dependent kinase may also phosphorylate ACC.91 It can likewise be inhibited by long-chain acyl CoA.93 Nitric oxide, which activates guanylyl cyclase with production of cyclic GMP, blocks both acetyl CoA carboxylase and fatty acid synthase.94 Interestingly, cyclic GMP has the capacity to directly stimulate carnitine palmitoyltransferase IA.94 Consensus is that AMP-kinase is the primary inhibitor. AMP-kinase further lowers malonyl CoA levels by phosphorylating and activating malonyl CoA decarboxylase, so that inhibited production is coupled with enhanced destruction.95,96 Acetyl CoA carboxylase exists in two isoforms, ACC1 (or α) is found primarily in the liver and adipose tissue while ACC2 (β) is dominant in cardiac and skeletal muscle.97 Regulation is thought to be the same in each.
The block in glycolysis is probably the dominant early mechanism. This conclusion is based on the observation that the citrate content in hepatocytes isolated from short-term fasted animals can be increased with the addition of lactate and pyruvate, which causes a rise in the malonyl CoA concentration and diminished ketone production.81 Because three-carbon intermediates that enter the glycolytic pathway below the glucagon-induced block immediately reinitiate the sequence citrate → acetyl CoA → malonyl CoA, it can be concluded that early in a fast, acetyl CoA carboxylase is not fully inactivated. When fasting is prolonged or diabetes is uncontrolled over an extended period, the AMP-kinase mechanism becomes operative. Ultimately, synthesis of acetyl CoA carboxylase also decreases and renders reversal of ketogenesis more difficult. A summary of the metabolic changes occurring in the liver in uncontrolled diabetes is shown in Fig. 20-4. We find it fascinating that both hepatic overproduction of glucose and ketosis result from uncountered activity of glucagon initially acting at strategic sites in the glycogenolytic/glycolytic/gluconeogenic pathways. By controlling substrate flux at critical branch points, all the metabolic abnormalities that characterize the liver in uncontrolled diabetes are activated. Therefore, great interest has been shown in developing drugs to block activation of the glucagon receptor in the treatment of diabetes.98–100
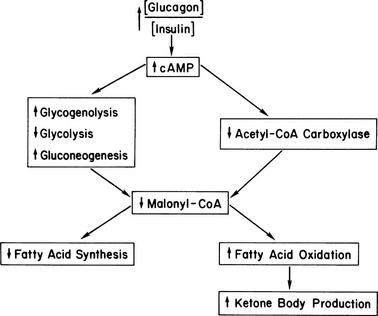
FIGURE 20-4 Hepatic metabolism in uncontrolled diabetes. The increased ratio of glucagon to insulin increases cyclic AMP, thereby initiating a series of enzymic phosphorylations. These reactions convert the liver to an organ of glucose production, with gluconeogenesis predominating after a few hours of poor control. Malonyl CoA levels drop precipitously because of a block in glycolysis, inhibition of acetyl CoA carboxylase, and activation of malonyl CoA decarboxylase (see text). This drop in turn increases fatty acid oxidation/ketogenic capacity and stops long-chain fatty acid synthesis via substrate depletion. Not shown are the increases in long-chain fatty acyl CoA and carnitine that drive the fatty acid oxidative sequence that is poised for action.
There is little doubt that malonyl CoA-mediated control of CPT I is central to the regulation of fatty acid oxidation and ketogenesis in the liver, but another consequence of a rise in the glucagon-to-insulin molar ratio is an increased carnitine content.101 The source of this carnitine has never been identified, but it is attractive to suppose that it moves to the liver from muscle via the plasma. Increased carnitine would favor transesterification of fatty acyl CoAs by mass action once CPT I is activated.
In DKA, impaired glucose disposal contributes significantly to hyperglycemia. In contrast, ketone utilization is not limited until plasma concentrations reach 10 to 12 mM.102
Clinical Features
Diabetic ketoacidosis can occur in every form of diabetes, as noted previously, but is most common in type 1 diabetes, especially in younger children with the disease. It is quite remarkable that DKA is frequently the presenting event at time of diagnosis.103–106 In the Search for Diabetes in Youth Study, the prevalence of DKA at diagnosis was 25.5% in the study group as a whole but decreased with age: 37.3% at ages 0 to 4 and 14.7% at ages 15 to 19.103 DKA at the time of diagnosis was 9.7% in young patients thought to have type 2 diabetes. There is evidence that type 1 diabetes is increasing worldwide.104
Precipitating Events
Diabetic ketoacidosis is usually initiated by physical stress of some kind or cessation of insulin.107,108 Often the stress is infection, but the apparent cause may vary from acute alcohol intake to myocardial infarction. A significant number of cases have no recognizable precipitating event; in these patients, psychological stress may be the operative mechanism, especially in young persons who have repeated episodes of ketoacidosis over short intervals.109 Atypical antipsychotic drugs have been found to induce diabetes and DKA.110 Known to be associated are clozapine, olanzapine, quetiapine, and risperidone. Cocaine use by diabetic subjects is a major cause of DKA.111 Other unusual associations are pheochromocytoma,112 menses,113 and interferon.114
Symptoms and Signs
The usual symptoms and signs of ketoacidosis include vomiting, thirst, polyuria, weakness, altered sensorium, and air hunger. Abdominal pain can occur.107 The differential diagnosis of such pain is tricky because pyelonephritis or a surgical disorder, such as acute appendicitis, may precipitate ketoacidosis. On the other hand, severe pain mimicking an acute abdomen may be due to the ketoacidotic state itself, possibly the consequence of hypertriglyceridemia-induced pancreatitis. Unless clear-cut evidence of a specific cause is present, a conservative course should be taken, with treatment of ketoacidosis taking precedence.
All DKA patients are hospitalized. There are no data available for ER deaths. The vital signs on admission vary with the length and severity of the prehospital phase of the illness. Tachycardia is essentially always present.115 The mean blood pressure is normal when large numbers of patients are evaluated, but hypotension was present in 8% of the survivors in one series. In the same series, hypotensive shock was present in 19% of those who died.115 Hypotension obviously is a poor prognostic sign. Kussmaul respiration with respiratory rates averaging 30 per minute is almost always observed, but in severe acidosis, the ventilatory response may fall and paradoxically rise as treatment is initiated and the acidosis is reversed.116,117 The patient’s temperature is often below normal and may be as low as 34°C.118,119 If fever is present, the likelihood of infection is high. The converse is not true; that is, the absence of fever or the presence of hypothermia does not rule out an infectious process. Although the sensorium is usually clouded on arrival at the hospital, one fifth of patients are alert.107 Only about 10% are actually unconscious, despite frequent use of the phrase “diabetic coma” as a synonym for the acidotic state.
Laboratory Abnormalities
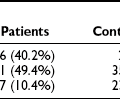
Typical laboratory abnormalities present on admission are shown in Tables 20-1 and 20-2. Hormone values are informative. Glucagon concentrations were elevated sevenfold, with epinephrine, norepinephrine, cortisol, and growth hormone also showing major increases. Epinephrine concentrations were 50-fold higher than normal. As noted earlier, it is probable that the initial change in catabolic hormones is a rise in glucagon followed by an increase in other counterregulatory agents as the stress of ketoacidosis worsens.40,41 The result is a vicious cycle: ketoacidosis → stress hormone release → worsening ketoacidosis → greater stress hormone release. The high concentrations of renin and aldosterone are expected concomitants of volume depletion. Inflammatory cytokines are elevated.120
Table 20-1
Hormone Values in Patients With Diabetic Ketoacidosis
| Hormone | Controls | Patients |
| Insulin (µU/mL) | 15 ± 2 | — |
| C peptide (ng/mL) | 2.4 ± 0.07 | — |
| Glucagon (pg/mL) | 99 ± 19 | 741 ± 247 |
| Epinephrine (ng/mL) | 0.05 ± 0.03 | 2.6 ± 1.3 |
| Norepinephrine (ng/mL) | 0.2 ± 0.08 | 3.8 ± 1.1 |
| Cortisol (µg/dL) | 10.5 ± 2 | 50.4 ± 4.9 |
| Growth hormone (ng/mL) | 0.7 ± 0.1 | 4.6 ± 1.6 |
| Renin (GU × 104/mL) | 0.3 ± 0.1 | 13.2 ± 4.6 |
| Aldosterone (ng/dL) | 7.8 ± 2.3 | 83 ± 25 |
| Pancreatic polypeptide (pg/mL) | 93 ± 11 | 691 ± 200 |
Data from Waldhäusl W, Kleinberger G, Korn A et al: Severe hyperglycemia: effects of rehydration on endocrine derangements and blood glucose concentration. Diabetes 28:577–584, 1979.
Table 20-2
Laboratory Values in Patients With Diabetic Ketoacidosis
| Test | Series 1 (n = 123) | Series 2 (n = 88) |
| Glucose (mg/dL) | 606 | 476 |
| Sodium (mM) | 135 | 132 |
| Potassium (mM) | 5.7 | 4.8 |
| Bicarbonate (mM) | 6.3 | <10 |
| BUN (mg/dL) | 29 | 25 |
| Acetoacetate (mM) | 3.1 | 4.8 |
| β-Hydroxybutyrate (mM) | 9.8 | 13.7 |
| Free fatty acids (mM) | — | 2.1 |
| Lactate (mM) | 2.5 | 4.6 |
| Osmolality (mOsm) | 316 | 310 |
| pH | 7.11 | — |
Series 1 is adapted from Kitabchi AE, Young R, Sacks H, Morris L: Diabetic ketoacidosis: reappraisal of therapeutic approach. Annu Rev Med 30:339–357, 1979. Series 2 is adapted from Foster DW: Diabetes mellitus. In Petersdorf RG, Adams RD, Braunwald E et al (eds): Harrison’s Principles of Internal Medicine, ed 10. New York: McGraw-Hill, 1983, pp 661–679. For simplicity, only mean values are listed.
Plasma analysis reflects the hormonal changes. Glucose is increased into the 28- to 33-mM (500 to 600 mg/dL) range on average but can be lower or much higher. Very high concentrations, similar to those seen in hyperosmolar coma, probably occur only in subjects who have marked volume depletion and dehydration, the mechanism being diminished urine output as previously discussed.55,121 Extracellular fluid volume deficits account for the modest elevation in blood urea nitrogen and creatinine, whereas plasma osmolalities of 310 to 316 mOsm/L reflect deficits of free water. Although insensible losses of water are increased, especially if Kussmaul respiration is marked, the bulk of water deficit is consequent to the glucose-mediated osmotic diuresis, which causes loss of water in excess of electrolytes.55,121,122 Despite dehydration, the plasma sodium level tends to be on the low side, because glucose in the absence of insulin becomes osmotically effective in the extracellular fluid because it cannot penetrate the cell. It osmotically pulls intracellular water to the extracellular compartment and thereby dilutes the sodium concentration. The degree of apparent hyponatremia increases with worsening hyperglycemia. An approximation of the true sodium concentration (millimolar) can be obtained by multiplying excess glucose in 100 mg/dL units by 1.6.123 Thus, for a plasma glucose concentration of 500 mg/dL (assumed normal 100 mg), the calculation would be:
The measured sodium plus 6.4 would approximate the true sodium concentration.
If the plasma sodium level is extremely low, hypertriglyceridemia (secondary to uncontrolled diabetes) should be suspected; the fat, displacing plasma water, causes an artifactually low reading for the sodium concentration. Recognition is not usually a problem, because the plasma will be milky, and lipemia retinalis will be visible on the ophthalmoscopic examination.122 Potassium concentrations tend to be high on arrival despite large total body deficits of the cation,9 primarily because of a shift of potassium from intracellular to extracellular compartments in response to acidosis. Falling urine output will increase the tendency to hyperkalemia. On occasion, the initial potassium level is normal or low, a true danger signal because initiation of insulin therapy, which results in retransfer of potassium into cells, may cause fatal hypokalemia if potassium is not replaced early.
By definition, the acidosis in uncontrolled insulin-dependent diabetes is caused by the overproduction of a acetoacetic and β-hydroxybutyric acids in the liver, with their accumulation in plasma.9,41 Contributing to the fall in pH are elevated levels of lactate, free fatty acids, and other organic acids that are normally excreted by the kidneys. Conventionally, the diagnosis of “ketoacidosis” requires a bicarbonate concentration under 10 mM and a pH under 7.3.9,124 The term ketosis should be used if deteriorating diabetic control has resulted in hyperglycemia/ketosis but not full-blown acidosis. Most hospital laboratories do not routinely measure acetoacetate, but β-hydroxybutyrate levels are often available. β-Hydroxybutyrate levels do not, however, appear helpful in management. The concentration of acetoacetate plus β-hydroxybutyrate rarely rises above 6 mM in fasting individuals,125,126 although a prolonged fast in nonobese persons may induce higher levels. Exceptions to the general rule that fasting ketosis gives total ketone levels of 6 mM or less are seen in late pregnancy,127 some lactating women,128 and a subset of alcoholic patients.129,130 These patients may exhibit true ketoacidosis with a short-term fast.
BUN and creatinine levels are usually modestly elevated on admission and revert to normal as soon as fluids are provided. Creatinine clearance is ordinarily only slightly depressed, in one series averaging 82 mL/min.131 Higher levels of azotemia are a poor prognostic sign in that they indicate a hemodynamically unstable patient vulnerable to vascular collapse or significant underlying renal disease.
Phosphate depletion is universal in DKA, but the initial plasma concentration, like that of potassium, may be low, normal, or high.132 As a result, marked deficiency of erythrocyte 2,3-diphosphoglycerate is present.133 Leukocytosis—at times a true leukemoid reaction—is commonly present and does not indicate infection.107 Amylase may be high but cannot be assumed to represent pancreatitis, because it may be of salivary gland origin in some patients.134 If lipase levels are very high, pancreatitis is more likely. Amylase and lipase are particularly elevated in DKA associated with fulminant type 1 diabetes.135 Triglycerides are almost always elevated and can reach very high levels (e.g., 10,000 mg/dL). If the patient has eaten within a few hours of onset, a significant fraction of the triglyceride may be in chylomicrons. Cholesterol concentrations will also be increased when triglyceride levels are very high, because cholesterol is contained in both chylomicrons (triglyceride-to-cholesterol ratio of more than 10 : 1) and very-low-density lipoprotein particles (triglyceride-to-cholesterol ratio of approximately 5:1).
Treatment
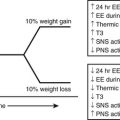
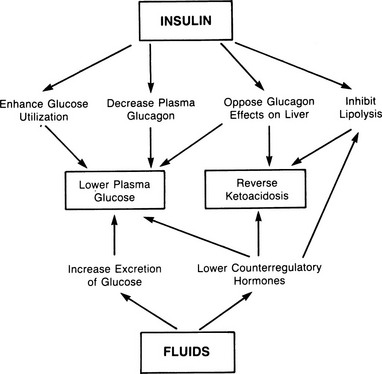
Treatment of uncomplicated DKA requires insulin, fluids, and potassium.1,9,107,121,124,136 In some circumstances, bicarbonate9,21 and phosphate salts133,137 may be given. An overview of the results of treatment is shown in Fig. 20-5.
Fluids
An intravenous saline infusion should be started immediately because it is critical to replace lost volume and secure adequate urine flow. Repletion of the extracellular fluid volume with maintenance of diuresis has a primary role in lowering the plasma glucose level and a secondary role in limiting ketogenesis. The plasma glucose level is lowered by two mechanisms: excretion of glucose in the urine and modulation of counterregulatory hormone release.39 Significant reversal of hyperglycemia can be produced by fluids alone in the absence of insulin. Initially, fluids should be given rapidly; ordinarily a rate of 1 L/hour is appropriate for the first 2 to 3 hours. Because the total deficit is 3 to 5 L,1,9 enough fluid should be given to approximate this amount in net terms (fluids infused minus urine production and estimated insensible loss). Some have recommended giving fluid at half the preceding rate,138 but the authors favor more rapid infusion. Hyperchloremia essentially always develops during treatment.139,140 This can be lessened by use of Ringer’s solution, although no evidence has demonstrated that the hyperchloremia has detrimental consequences. Most patients also have a deficit of water, as evidenced by the elevated plasma osmolality. This deficit should be repaired only after extracellular volume is repleted. Free water can be delivered either as 0.45% saline or, after hyperglycemia has been brought under control, by infusion of dextrose in water.
Insulin
All patients with ketoacidosis require insulin, because fluids alone will not reverse hepatic ketone synthesis. Insulin has at least four effects. Its two most important actions are doubtless to decrease glucagon release from the α cell of the islets12 and to counteract the effects of glucagon in the hepatocyte.1,12,46 These two effects result in suppression of glucose and ketone production in the liver. The primary mechanism, as noted, appears to be inhibition of a glucagon-activated, cAMP-dependent protein kinase.50 Secondary actions of insulin involve enhancement of glucose utilization in muscle and fat and inhibition of lipolysis. As discussed in the Ketogenesis section, a drop in plasma free fatty acids does not reverse ketoacidosis, because hepatic triglycerides replace adipose tissue as a source of fatty acids when plasma concentrations of the latter fall with insulin treatment. This adaptation is thought to account for the prolonged course in DKA, which usually requires about 7 to 9 hours to reverse; that is, ketone production continues unabated, driven by hepatic fat, until CPT I is inactivated.
The amount of insulin that should be used in treatment is a matter of much discussion. The authors’ views have been summarized.9 Insulin resistance is present in all patients with ketoacidosis relative to normal persons.51 It is usually mild but in rare patients may be extreme. Insulin should ordinarily be administered intravenously, and only regular insulin should be used. It may be given intermittently but almost always is given by constant infusion. Most patients respond to modest doses, but the lower limit should be 10 U/hour.141 Administration of larger amounts may have some advantage because presumably at higher concentrations, binding of insulin to the IgF1 receptor would occur and provide additive metabolic effects after the insulin receptor is saturated.142 IgF1 itself has been shown to reverse DKA in the absence of insulin.143 A representative continuous infusion protocol is shown in Table 20-3.
Table 20-3
An Infusion Protocol for Treatment of Diabetic Ketoacidosis*
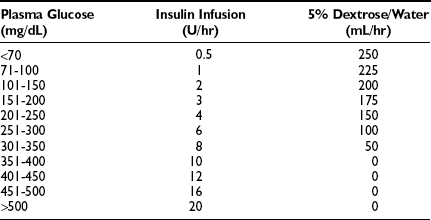
*University Diabetes Service, Parkland Memorial Hospital, Dallas, Texas, courtesy of Dr. Philip Raskin. A 50-U bolus of insulin is given intravenously on arrival. Fluids and potassium are administered as indicated. SMA-6 is obtained hourly for the first few hours, with glucose measured hourly until the condition is reversed. Insulin administration is continued, covered by glucose, until urine is ketone-free.
The best series of control studies in the treatment of DKA has been performed by Kitabchi and colleagues.124 They have shown unequivocally that DKA can be safely treated with lower doses of insulin and without intravenous insulin. There is a slight but insignificant delay in reversal of ketosis with lower doses. Their lab has also studied the use of rapidly acting insulin in place of regular insulin and whether insulin glargine enhances reversal of DKA. The answer to both is no.
The end point of treatment is a urine sample free of ketones inasmuch as the presence of acetone implies continued activation of hepatic ketogenic enzymes. If these enzymes are not deactivated, any complication (e.g., hypoglycemia or infection) will result in reappearance of ketoacidosis, because free fatty acids will be remobilized in response to the action of stress hormones under these conditions and drive production by substrate provision. Therapy should be monitored by checking the anion gap hourly, along with blood gas determination every 4 hours. If the anion gap has not started to close by 4 hours, greater than normal insulin resistance is present, and the insulin dosage should be increased. Occasionally, very large amounts are required, in which case 500 U insulin is available. Plasma glucose levels ordinarily fall before reversal of the acidosis.144 Insulin administration should not be stopped or slowed under such circumstances. Rather, glucose should be infused to allow continuation of insulin therapy (see later section, Cerebral Edema). As noted previously, no advantage is gained by monitoring plasma ketones during therapy.145 Intermittent insulin administration can be resumed after the patient is able to eat.
Potassium
Evaluation of potassium deficits is tricky because body stores are depleted despite plasma values that may be high on admission consequent to the metabolic acidosis that shifts K+ from intracellular to extracellular compartments as noted earlier.144 Usual deficits are 3 to 5 mmol/kg of body weight but at times may be double this value.146 Because of the typical tendency to have hyperkalemia on arrival, potassium salts are not ordinarily given until 2 to 4 hours after treatment is started. On the other hand, if the initial potassium concentration is 4.0 mM or less, potassium salts will be required early, because plasma values will fall as soon as insulin restores glucose transport into cells and urine production picks up.9,147 If the initial potassium level is very low (below 3.0 mM), insulin therapy should be delayed 60 to 90 minutes until some potassium repletion has been accomplished. The infusion rate of potassium chloride or potassium phosphate should be 20 to 40 mmol/hr under most circumstances. Potassium concentrations should be monitored at 2-hour intervals until the patient is metabolically stable. The electrocardiogram may be used as a guide if for some reason plasma levels are not available, but it is much less reliable.148 Potassium salts should be given only with extreme caution in an oliguric patient.
Phosphate
No evidence has shown that phosphate depletion plays a major symptomatic role in the development or treatment of DKA.124,137 Very low phosphate levels can cause altered consciousness, hemolysis, rhabdomyolysis, and heart failure, but these complications are not part of the routine picture in diabetic coma. Thus there appears to be little urgency to replace the deficits of phosphate, which may approach 300 mmol. Nevertheless, many clinicians give the initial potassium replacement as potassium phosphate, thereby dealing with both deficiencies.
Bicarbonate
Severe acidosis is dangerous because it may cause hypotension, especially if volume depletion is present. Acidosis causes decreased myocardial contractility and diminished response of peripheral resistance vessels to catecholamines. It may also contribute to the clouding of consciousness that characterizes ketoacidosis, although increased osmolality of brain cells doubtless plays a role. Warnings against the use of bicarbonate have focused on potential problems such as alkali-induced hypokalemia and lactic acidosis, but it has been argued that the benefits of bicarbonate outweigh the risks.149,150 Some studies have shown no benefit.124,151,152 If hypotension is present, it may be prudent to give bicarbonate to all patients with a pH of 7.2 or less, because increased responsiveness of the left ventricle and resistance vessels would likely outweigh any deleterious effect of alkalinization on the oxygen dissociation curve.152
Monitoring Therapy
Maintenance of a written flow chart is important in monitoring a patient with ketoacidosis.153 Timed recording of insulin, fluids, potassium, and bicarbonate administration are imperative. Capillary blood glucose levels should be measured every 30 minutes initially. Formal laboratory evaluation of plasma glucose, sodium, potassium, bicarbonate, chloride, BUN, and creatinine should be obtained at 1- to 2-hour intervals. As mentioned earlier, the best marker of reversal of acidosis is a fall in the anion gap. It is characteristic for the anion gap to close with therapy, matched by a rise in pH, while the bicarbonate concentration remains low (12 to 14 mM). The low bicarbonate value reflects a hyperchloremic state resulting from the infusion of sodium chloride, exchange with intracellular buffers, and external loss of “potential bicarbonate” in the form of excreted ketones.140 The frequency of clinical and chemical monitoring can decrease as the patient recovers. Rarely, patients do not clear the anion gap despite clinical improvement. While failure to close the gap normally indicates insulin resistance, in some patients an unmeasured anion that is not ketones, lactate, renal acids, or a poison appears to be present. The putative mystery anion (acetate? citrate?) has not been identified. Recognition that this condition is not insulin resistance is readily apparent if the urine is shown to be free of ketones, and blood gas determination indicates that the acidosis has been reversed. We have called this condition “pseudoinsulin resistance.”
Complications
Death from properly treated DKA should be rare, but ketoacidosis is the primary cause of mortality in diabetic children.154 Death rates are also significant in adults. Mortality from DKA in developed countries is 2% to 5%.124 When death occurs, it may be the result of the disease itself or a result of complications of therapy. Clues to complications are given in Table 20-4.
Table 20-4
Clues to Complications of Diabetic Ketoacidosis
| Complications | Clues |
| Acute gastric dilatation or erosive gastritis | Vomiting of blood or coffee-ground material |
| Cerebral edema | Obtundation or coma with or without neurologic signs, especially if occurring after initial improvement |
| Hyperkalemia | Cardiac arrest |
| Hypoglycemia | Adrenergic or neurologic signs; rebound ketosis |
| Hypokalemia | Cardiac arrhythmias |
| Infection | Fever |
| Insulin resistance | Unremitting acidosis after 4-6 hr of adequate therapy |
| Myocardial infarction | Chest pain, appearance of heart failure; appearance of hypotension despite adequate fluids |
| Mucomycosis | Facial pain, bloody nasal discharge, blackened nasal turbinates, blurred vision, proptosis |
| Vascular thrombosis | Strokelike picture or signs of ischemia in nonnervous tissue |
From Foster DW: Diabetic ketoacidosis. In Krieger DT, Bardin CW (eds): Current Therapy in Endocrinology and Metabolism. Toronto: BC Decker, 1985, pp 268–270.
Shock
Vascular collapse is not common in ketoacidosis. When it occurs, it may be the result of one of several causes. Volume depletion and acidosis alone can produce hypotension, as outlined earlier. If blood pressure does not rise with adequate fluid replacement, another cause of hypotension should be sought. Gram-negative sepsis and silent myocardial infarction are prime candidates.115,155
Cerebral Edema
Cerebral edema is a dreaded development, especially in children. Despite aggressive therapy, recovery can never be ensured.156,157 In a retrospective study of 61 subjects from 10 pediatric centers, 28% died, 13% survived with neurologic sequelae, and 59% survived without sequelae.158 In a Swedish study, cerebral edema occurred in 0.68% of DKA episodes.159 The syndrome is heralded by the appearance of neurologic signs or worsening coma in a patient who should be getting well as judged by biochemical parameters. Sluggish pupillary responses and frank papilledema may appear after several hours. Death is probably caused by compression of the brainstem as a result of herniation of the cerebellar tonsils through the foramen magnum.
It has generally been assumed that the complication is a result of treatment, somehow precipitated by rapid falls in the plasma glucose level or oncotic pressure after insulin and crystalloid therapy.156–158,160–163 Alterations in blood-brain barrier permeability due to insulin160 and disequilibrium in pH have also been postulated as important. On the other hand, six of seven consecutive patients with untreated DKA were shown to have subclinical cerebral edema by computed tomographic scan on arrival at the hospital in one series.163 Thus, initial edema was independent of therapy. No conclusion regarding causality could be shown. Osmotic disequilibrium between plasma/interstitial and intracellular water is probably of importance in the transition from subclinical to clinical edema. Because cerebrospinal fluid pressure rises routinely during treatment, it is likely that cerebral edema represents the extreme of a common response to therapy.164 It is usually recommended that glucose infusions be started when the plasma glucose level is in the range of 16.7 mM (300 mg/L) in an attempt to avoid the disequilibrium presumed to occur with rapid reversal of hyperglycemia.160,165,166 This approach is not foolproof, because the syndrome has developed in patients whose glucose remained above 300 mg/dL. The conclusion of a large review is that the cause of the syndrome remains uncertain.165
Treatment consists of the intravenous administration of a 20% mannitol solution in bolus fashion at a dose of 1 g/kg. Dexamethasone is often given simultaneously, 12 mg initially followed by 4 mg every 7 hours, but no real evidence has shown that dexamethasone is of help. It has been suggested that mannitol be administered early rather than late, based on theoretical analysis of the problem, but there are no data to test this.165 As in other forms of cerebral edema, hyperventilation to a Pco2 of 28 to 30 mm Hg may help by decreasing cerebral blood flow. Such therapy requires the assistance of an anesthesiologist.
Infection
Infection is a common problem in DKA and should be suspected in all patients, especially if fever is present.147,155 Although leukocytosis does not indicate infection, as noted earlier, fever almost always does. Pneumonia, pyelonephritis, and septicemia are most common, but cryptic inflammation, such as tooth or perirectal abscesses, may be the precipitating event. Mucormycosis is a rare fungal infection that is specifically associated with DKA.167,168 The initial symptom of facial pain suggests sinusitis, but the signs of bloody nasal discharge, orbital swelling, blackened palate and nasal turbinates, blurred vision, and altered consciousness point to the correct diagnosis. Mucormycosis is fatal if untreated. Amphotericin B should be started immediately on suspicion without waiting for confirmation by culture. Even with treatment the outlook is guarded. The role of ketoacids appears to be interference in the binding of iron to transferrin.167 This interference in iron binding raises the concentration of free iron, which is a growth factor for the fungus.
Vascular Thrombosis
Thrombosis may occur during ketoacidosis in any muscular artery, but the cerebral vessels appear to be especially vulnerable.169,170 The mechanism is multifactorial. A major component is probably increased viscosity of blood coupled with sluggish blood flow because of contraction of the plasma volume. Underlying atherosclerosis is doubtless important, the site of the lesion determining the location of the thrombosis. The activity of factor VIII is enhanced, as are levels of von Willebrand antigen.171,172 Platelets isolated from patients with ketoacidosis exhibit more facile aggregation in vitro than their normal counterparts do.173,174 Endothelial dysfunction predisposing to clot formation may also play a role: decreased fibrinolytic potential,175 elevated levels of endothelin,176 and diminished nitric oxide activity.177,178 Antithrombin III, protein C, and protein S may be low.179 High levels of plasminogen activator inhibitor-1 (PAI-1) are particularly important in thrombotic events.175,180,181 Interestingly, metformin has been reported to lower PAI-1 levels.182 Although prophylactic anticoagulation has been recommended, the authors agree with Carroll and Matz that such anticoagulation is unwise147; the best prophylaxis is aggressive fluid therapy. A single dose of aspirin daily (325 mg) might be prudent.
Nonketotic Hyperosmolar Coma
Pathophysiology
The pathophysiology of nonketotic hyperglycemic coma is similar to that of diabetic ketoacidosis with one exception: overproduction of acetoacetate and β-hydroxybutyrate sufficient to cause ketoacidosis does not occur.184 The basic bihormonal mechanism of uncontrolled diabetes is no different: a relative or absolute excess of glucagon.1,185,186 Elevation of the plasma glucose level is, as in ketoacidosis, the result of increased production of glucose by the liver coupled with its diminished utilization in tissues. The extreme hyperglycemia that characterizes the syndrome is consequent to failure of urine output.121,184 Put another way, production rates of glucose are not higher in hyperosmolar coma than in ketoacidosis, but the urinary escape route for glucose is diminished or absent from prolonged osmotic diuresis. Thus one has a situation in which hepatic glucose production continues unabated, with glucose released into a steadily shrinking plasma/extracellular space. The result is a concentration of glucose in plasma that averages 55 mM (1000 mg/dL)187,188 and may reach nearly 278 mM (5000 mg/dL).189 What accounts for the striking difference in glucose levels in ketoacidosis and hyperosmolar coma? The answer almost certainly is the absence of ketoacidosis. When metabolic acidosis supervenes, the patient or patient’s family knows that the patient is acutely ill because almost invariably, nausea, vomiting, and Kussmaul respiration is present. With hyperosmolar coma, by contrast, the patient has only an unremitting osmotic diuresis that is clinically silent until the patient is so dehydrated that altered consciousness or an acute neurologic syndrome supervenes. Although severe hyperosmolality is not the norm in DKA, it does occur.121 Indeed, patients with true type 1 diabetes may have pure hyperosmolar coma (see following).
Because dehydration and volume depletion resulting from osmotic diuresis never progress to the point of coma, provided that the patient can drink water, it is usual for hyperosmolar coma to appear in the context of some other illness that impairs the patient’s capacity to maintain fluid intake. This event may be infection, a stroke, a fall resulting in a sprain or fracture, or intake of a drug that alters the sensorium, increases glucose production, or causes diuresis with volume depletion.190 Survivors of hyperosmolar coma have been reported to have abnormal thirst response to water deprivation relative to control patients with non-insulin-dependent diabetes.191 It is not known if this was present prior to hyperosmolar coma. To reiterate, as long as enough water is drunk to sustain urine output, even a severe osmotic diuresis does not result in the type of monumental hyperglycemia that characterizes nonketotic hyperosmolar coma.
The critical pathophysiologic question in hyperosmolar coma is why ketoacidosis is not present. The answer to this question is not known. Earlier theories proposed hyperosmolarity and lower free fatty acids as the explanation. Experimentally, hyperosmolarity can quench ketosis, and lower fatty acid concentrations in plasma would limit ketone formation via substrate deficiency. Neither explanation is likely, because some patients with ketoacidosis have plasma osmolalities overlapping those of hyperosmolar coma and hyperosmolar coma has clearly occurred in subjects with very high free fatty acid concentrations in plasma.185 On the basis of studies in animals, it is attractive to postulate that a primary reason for the absence of ketoacidosis is hepatic resistance to glucagon so that malonyl CoA levels do not fall. In the ob/ob mouse, cAMP generation by glucagon is markedly impaired,192 and malonyl CoA concentrations are high.193 The mechanism of glucagon resistance is not known, but this animal appears to have a defect in guanine nucleotide modulation of the adenylate cyclase system, at least in adipose tissue.194 Obviously, the ob/ob mouse is not equivalent to a human with non-insulin-dependent diabetes. It also seems peculiar that glucagon resistance would be limited to ketogenesis and not affect glucose overproduction. Perhaps malonyl CoA levels are maintained at inhibitory levels because of increased hepatic lactate uptake rather than because of glucagon resistance; that is, increased lactate turnover (the Cori cycle sequence) might be expected from the high plasma glucose concentrations. Increased lactate and alanine uptake might be sufficient to maintain hepatic gluconeogenesis while simultaneously inhibiting ketogenesis by generating malonyl CoA.
Clinical Features
Nonketotic hyperosmolar coma usually occurs in older persons with diabetes,121,184,187,188 but it has been seen in the very young.195 The syndrome can thus develop in patients with insulin-dependent, ketosis-prone type 1 diabetes. This phenomenon occurs when the patient is taking enough insulin to prevent ketoacidosis (by limiting free fatty acid mobilization) but not enough to control hyperglycemia. A curious inversion of insulin effects is seen in the presence or absence of ketoacidosis. In a nonketoacidotic subject, it is harder to control the plasma glucose level than to prevent ketoacidosis, whereas in established ketoacidosis, the plasma glucose level, as noted earlier, almost always falls before ketosis is reversed.144 Thus a patient with insulin-dependent diabetes may be rendered functionally equivalent to a patient with non-insulin-dependent diabetes when treated with insulin sufficient to avoid ketoacidosis but insufficient to prevent a hyperglycemia-driven osmotic diuresis.
Precipitating Events
As noted, nonketotic hyperosmolar coma is usually precipitated by a serious underlying illness that renders the patient unable to obtain sufficient water to keep up with the osmotic diuresis under circumstances in which glucose production is increased by stress. Any kind of illness can initiate the sequence of deterioration, but infection is probably the most common.187,188 Stroke, drugs, high-calorie tube feedings, burns, heart attacks, and a variety of other problems have been associated with the syndrome.
Symptoms and Signs
The preeminent symptomatology of hyperosmolar coma is neurologic. Up to half the patients are comatose on arrival, and those who are not show stupor.196 A variety of other neurologic findings may be present, including focal convulsions or a stroke-like picture.197–199 It should always be assumed that an underlying illness precipitated the syndrome, even though it may be masked by the metabolic crisis. Sometimes it is hard to tell whether a finding is cause or effect. Thus, stroke can lead to hyperosmolar coma, and hyperosmolar coma can cause hemiplegia. Only if the neurologic picture reverses rapidly with therapy can it be concluded that the neurologic event was secondary. The possibility of head injury has to be kept in mind in older patients living alone. A computed tomographic scan should be obtained once the metabolic state is stabilized.
Laboratory Abnormalities
Typical findings in nonketotic hyperosmolar coma are shown in Table 20-5. Hyperglycemia, as noted, averages about 55 mM (1000 mg/dL). References to “syrupy blood” are entirely appropriate.189 The plasma osmolality reflects the hyperglycemia and dehydration and is often 100 mOsm higher than normal.
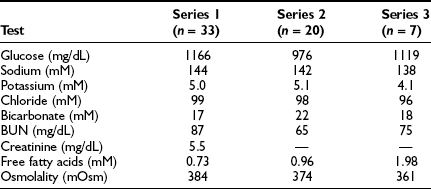
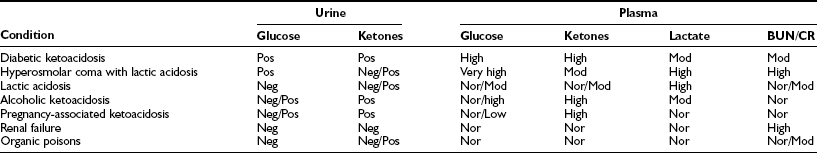
Some investigators have suggested that the serum sodium concentration, corrected for glucose, correlates best with central nervous system dysfunction.200 This seems doubtful given that osmolality reflects the sodium concentration. The BUN and creatinine values are usually significantly elevated, a reflection of volume depletion and/or underlying renal disease. In the absence of vascular collapse, only minimal acidosis is seen, the bicarbonate averaging 18 to 20 mM. Mild ketosis resulting from starvation is usually present, so urine ketone values may be “large.” If full-blown metabolic acidosis is present, the likely mechanism is lactic acidosis, as noted earlier. Its cause is severe volume depletion, which leads to hypoxia of tissues via diminished perfusion. Formal differentiation requires quantitative measurement of lactate (Table 20-6). Levels of free fatty acids tend to be in the normal fasting range but in some patients are very high.184 Hypertriglyceridemia may be present.201 As in ketoacidosis, the amylase level may be elevated, and pancreatitis may be present.
Treatment
Therapy for nonketotic hyperosmolar coma is similar to that for ketoacidosis, with the major variation being the requirement for much larger amounts of fluid. Although recovery may be expected in patients younger than 50 years,147 mortality rates are high in older patients.184 Treatment often requires admission to the intensive care unit.
Fluids
The most important therapy is the rapid administration of isotonic saline solution to reestablish the circulation and urine flow.147 Deficits of fluid in hyperosmolar coma may be 10 L or more.187,188 We prefer to give 2 to 3 L of isotonic salt solution over the first 60 to 90 minutes, after which 0.45% saline is administered. In complicated cases, a Swan-Ganz catheter may be helpful to monitor capillary wedge pressure in older patients who have underlying heart disease. Fluids should be given continuously until deficits are repaired, as manifested by urine output reflecting infusion rates and return of glucose and blood chemistries toward normal.
Insulin
It has frequently been stated that patients with hyperosmolar coma are more sensitive to insulin than are those with ketoacidosis.196 However, studies of glucose disappearance in response to insulin actually suggest that insulin resistance is present to the same degree as seen in the ketoacidotic state.202 Therefore, it seems reasonable to give insulin at the same level as recommended for ketoacidosis.
Complications
The complications of hyperosmolar coma are not dissimilar from those of ketoacidosis, with vascular collapse and infection being the most important problems.187,188 Of particular concern is gram-negative sepsis and pneumonia. Blood cultures should probably be obtained in all patients on arrival; blood culture is imperative if shock or fever is present. Other cultures will depend on the clinical findings. Broad-spectrum antibiotic coverage should be provided for the slightest suspicion of sepsis until cultures prove negative. Adult respiratory distress syndrome is not unusual. Cerebral edema during treatment is rare but may occur.203 Thrombosis, particularly in cerebral vessels, is common,204 and diffuse intravascular coagulation may occur, leading to oozing of blood from a variety of sites. Myocardial infarction is not rare, and acute rhabdomyolysis has been reported.205
References
1. Unger, RH, Foster, DW. Diabetes mellitus. In: Wilson JD, Foster DW, Kronenberg HM, Larsen PR, eds. Williams’ Textbook of Endocrinology. ed 9. Philadelphia: WB Saunders; 1998:973–1059.
2. Ramos-Roman, MA, Pinero-Piloña, A, Adams-Huet, B, et al. Comparison of type 1, type 2, and atypical ketosis-prone diabetes at 4 years of diabetes duration. J Diabetes Complications. 2006;20:137–144.
3. Umpierrez, GE, Smiley, D, Kitabchi, AE. Narrative review: ketosis-prone type 2 diabetes mellitus. Ann Intern Med. 2006;144:350–357.
4. Balasubramanyam, A, Garza, G, Rodriguez, L, et al. Accuracy and predictive value of classification schemes for ketosis-prone diabetes. Diabetes Care. 2006;29:2575–2579.
5. Balasubramanyam, A, Nalini, R, Hampe, CS, et al. Syndromes of ketosis-prone diabetes mellitus. Endocr Rev. 2008;29:292–302.
6. Nagata, M, Moriyama, H, Kotani, R, et al. Immunological aspects of “fulminant type 1 diabetes”. Diabetes Res Clin Pract. 2007;77(Suppl 1):S99–103.
7. Kawasaki, E, Imagawa, A, Makino, H, et al. Differences in the contribution of CTLA4 gene to susceptibility to fulminant and type 1A diabetes in Japanese patients. Diabetes Care. 2008 Apr 28. [(Epub ahead of print)].
8. Murase, Y, Imagawa, A, Hanafusa, T, et al. Fulminant type 1 diabetes as a high risk group for diabetic microangiopathy—a nationwide 5-year study in Japan. Diabetologia. 2007;50:531–537.
9. Foster, DW, McGarry, JD. The metabolic derangements and treatment of diabetic ketoacidosis. N Engl J Med. 1983;309:159–169.
10. Dobbins, RL, Cowley, MA, Foster, DW. Glucose, lipid and protein metabolism. In: Griffin JE, Ojeda SR, eds. Textbook of Endocrine Physiology. ed 5. New York: Oxford University Press; 2004:377–406.
11. Unger, RH. The milieu interieur and the islets of Langerhans. Diabetologia. 1981;20:1–11.
12. Unger, RH, Orci, L. Glucagon and the A cell: physiology and pathophysiology. N Engl J Med. 1981;304:1518–1524.
13. McGarry, JD, Foster, DW. Hormonal control of ketogenesis: biochemical considerations. Arch Intern Med. 1977;137:495–501.
14. Cahill, GF, Jr. Starvation in man. N Engl J Med. 1970;282:668–675.
15. Cahill, GF, Jr. Fuel metabolism in starvation. Annu Rev Nutr. 2006;26:1–22.
16. Allweiss, C, Landau, T, Abeles, M, et al. The oxidation of uniformly labeled albumin-bound palmitic acid to CO2 by the perfused cat brain. J Neurochem. 1966;13:795–804.
17. Wolfgang, MJ, Cha, SH, Millington, DS, et al. Brain-specific carnitine palmitoyl-transferase-1c: role in CNS fatty acid metabolism, food intake, and body weight. Neurochem. 2008;105:1550–1559.
18. Drenick, EJ, Alvarez, LC, Tamasi, GC, et al. Resistance to symptomatic insulin reactions after fasting. J Clin Invest. 1972;51:2757–2762.
19. Madison, LL, Mebane, D, Unger, RH, et al. The hypoglycemic action of ketones: II. Evidence for the stimulatory feedback of ketones on the pancreatic beta cells. J Clin Invest. 1964;43:408–415.
20. McGarry, JD, Foster, DW. Hormonal control of ketogenesis. Adv Exp Med Biol. 1976;111:79–96.
21. McGarry, JD, Dobbins, RL. Fatty acids, lipotoxicity and insulin resistance. Diabetologia. 1999;42:128–138.
22. Dobbs, R, Sakurai, H, Sasaki, H, et al. Glucagon: role in the hyperglycemia of diabetes mellitus. Science. 1975;187:544–547.
23. Unger, RH. Role of glucagon in the pathogenesis of diabetes: the status of the controversy. Metabolism. 1978;27:1691–1709.
24. Gerich, JE, Lorenzi, M, Bier, DM, et al. Prevention of human diabetic ketoacidosis by somatostatin: evidence for an essential role of glucagon. N Engl J Med. 1975;292:985–989.
25. Cherrington, AD, Liljenquist, JE. Role of glucagon in regulating glucose in vivo. In: Unger RH, Orci L, eds. Glucagon. New York: Elsevier; 1981:221–253.
26. Raskin, P, Unger, RH. Hyperglucagonemia and its suppression: importance in the metabolic control of diabetes. N Engl J Med. 1978;299:433–436.
27. Santeusanio, F, Massi-Benedetti, M, Angeletti, G, et al. Glucagon and carbohydrate disorder in a totally pancreatomized man (a study with the aid of an artificial endocrine pancreas). J Endocrinol Invest. 1981;4:93–96.
28. Unger, RH. Somatostatinoma. N Engl J Med. 1977;296:998–1000.
29. Liljenquist, J, Bomboy, J, Lewis, S, et al. Effects of glucagon on lipolysis and ketogenesis in normal and diabetic man. J Clin Invest. 1974;53:190–197.
30. Schade, DS, Woodside, W, Eaton, RP. The role of glucagon in the regulation of plasma lipids. Metabolism. 1979;28:874–886.
31. Miles, JM, Haymond, MW, Nissen, SL, et al. Effects of free fatty acid availability, glucagon excess, and insulin deficiency on ketone body production in postabsorptive man. J Clin Invest. 1983;71:1554–1561.
32. Boden, G, Owen, OE, Rezvani, I, et al. An islet cell carcinoma containing glucagon and insulin. Chronic glucagon excess and glucose homeostasis. Diabetes. 1977;26:128–137.
33. Marynick, SP, Fagadau, WR, Duncan, LA. Malignant glucagonoma syndrome: response to chemotherapy. Ann Intern Med. 1980;93:453–454.
34. McGarry, JD, Wright, PH, Foster, DW. Hormonal control of ketogenesis. Rapid activation of hepatic ketogenic capacity in fed rats by anti-insulin serum and glucagon. J Clin Invest. 1975;55:1202–1209.
35. McGarry, JD, Foster, DW, Glucagon and ketogenesis. Handbook of Experimental Pharmacology. Lefebvre, PJ, eds. Handbook of Experimental Pharmacology, vol 66/I. Glucagon I. Berlin: Springer-Verlag, 1983:383–398.
36. Schade, DS, Eaton, RP. The regulation of plasma ketone body concentration by counter-regulatory hormones in man: III. Effects of norepinephrine in normal man. Diabetes. 1979;28:5–10.
37. Keyes, WG, Heimberg, M. Influence of thyroid status on lipid metabolism in the perfused rat liver. J Clin Invest. 1979;64:182–190.
38. Schade, DS, Eaton, RP. The controversy concerning counterregulatory hormone secretion: a hypothesis for the prevention of diabetic ketoacidosis? Diabetes. 1977;26:596–599.
39. Waldhausl, W, Kleinberger, G, Korn, A, et al. Severe hyperglycemia: effects of rehydration on endocrine derangements and blood glucose concentration. Diabetes. 1979;28:577–584.
40. Alberti, KGMM, Christensen, NJ, Iversen, J, et al. Role of glucagon and other hormones in development of diabetic ketoacidosis. Lancet. 1975;1:1307–1311.
41. Miles, JM, Rizza, RA, Haymond, MW, et al. Effects of acute insulin deficiency on glucose and ketone body turnover in man: evidence for the primacy of overproduction of glucose and ketone bodies in the genesis of diabetic ketoacidosis. Diabetes. 1980;29:926–930.
42. Boyd, ME, Albright, EB, Foster, DW, et al. In-vitro reversal of the fasting state of liver metabolism in the rat. Reevaluation of the roles of insulin and glucose. J Clin Invest. 1981;68:142–152.
43. Harano, Y, Kosugi, K, Kashiwagi, A, et al. Regulatory mechanism of ketogenesis by glucagon and insulin in isolated and cultured hepatocytes. J Biochem. 1982;91:1739–1748.
44. Virkamaki, A, Ueki, K, Kahn, CR. Protein-protein interaction in insulin signaling and the molecular mechanisms of insulin resistance. J Clin Invest. 1999;103:931–943.
45. Krüger, M, Kratchmorova, I, Glagoev, B, et al. Dissection of the insulin signaling pathway via quantitative phosphoproteomes. Proc Natl Acad Sci U S A. 2008;105:2451–2456.
46. Rodbell, M, The actions of glucagon and its receptor: regulation of adenylate cyclase. Handbook of Experimental Pharmacology. Lefebvre, PJ, eds. Handbook of Experimental Pharmacology, vol 66/I. Glucagon I. Berlin: Springer-Verlag, 1983:263–290.
47. Tang, EKY, Houslay, MD. Glucagon, vasopressin and angiotensin all elicit a rapid, transient increase in hepatocyte protein kinase C activity. Biochem J. 1992;283:341–346.
48. Iwanij, V, Vincent, AC. Characterization of the glucagon receptor and its functional domains using monoclonal antibodies. J Biol Chem. 1990;265:21302–21308.
49. Authier, F, Desbuquois, B. Glucagon receptors. Cell Mol Life Sci. Feb 23, 2008. [(Epub].
50. Gabbay, RA, Lardy, HA. Site of insulin inhibition of cAMP-stimulated glycogenolysis. cAMP-dependent protein kinase is affected independent of cAMP changes. J Biol Chem. 1984;259:6052–6055.
51. Barrett, EJ, DeFronzo, RA, Bevilacqua, S, et al. Insulin resistance in diabetic ketoacidosis. Diabetes. 1982;31:923–928.
52. Svedberg, J, Bjorntorp, P, Lonnroth, P, et al. Prevention of inhibitory effect of free fatty acids on insulin binding and action in isolated rat hepatocytes by etomoxir. Diabetes. 1991;40:783–786.
53. McGarry, JD. What if Minkowski had been ageusic? An alternative angle on diabetes. Science. 1992;258:766–770.
54. Savage, DB, Peterson, KF, Shulman, GI. Disordered lipid metabolism and the pathogenesis of insulin resistance. Physiol Rev. 2007;87:507–520.
55. Feig, PU, McCurdy, DK. The hypertonic state. N Engl J Med. 1977;297:1444–1454.
56. Hers, HG, Van Schaftingen, E. Fructose 2, 6-bisphosphate 2 years after its discovery. Biochem J. 1982;206:1–12.
57. Pilkis, SJ, Granner, DK. Molecular physiology of the regulation of hepatic gluconeogenesis and glycolysis. Annu Rev Physiol. 1992;54:885–909.
58. Kuwajima, M, Newgard, CB, Foster, DW, et al. Time course and significance of changes in hepatic fructose-2, 6-bisphosphate levels during refeeding of fasted rats. J Clin Invest. 1984;74:1108–1111.
59. Jin, ES, Uyeda, K, Kawaguchi, T, et al. Increased hepatic fructose-2, 6-bisphospate after an oral glucose load does not affect gluconeogenesis. J Biol Chem. 2003;278:28427–28433.
60. Wu, C, Khan, SA, Peng, LJ, et al. Roles for fructose-2, 6-bisphosphate in the control of fuel metabolism: beyond its allosteric effects on glycolytic and gluconeogenic enzymes. Adv Enzyme Regul. 2006;46:72–88.
61. Yoon, JC, Puigserver, P, Chen, G, et al. Control of hepatic gluconeogenesis through the transcriptional coactivator PGC-1. Nature. 2001;413:131–138.
62. Puigserver, P, Spiegelman, BM. Peroxisome proliferator-activated receptor-gamma coactivator 1 alpha (PGC-1 alpha): transcriptional coactivator and metabolic regulator. Endocr Rev. 2003;24:78–90.
63. Herzig, S, Long, F, Jhala, US, et al. CREB regulates hepatic gluconeogenesis through the coactivator PGC-1. Nature. 2001;413:179–183.
64. Lin, J, Tarr, PT, Yang, R, et al. PGC-1 beta in regulation of hepatic glucose and energy metabolism. J Biol Chem. 2003;278:30843–30848.
65. Munnich, A, Marie, J, Reach, G, et al. In vivo hormonal control of L-type pyruvate kinase gene expression: effects of glucagon, cyclic AMP, insulin, cortisone, and thyroid hormones on the dietary induction of mRNAs in the liver. J Biol Chem. 1984;259:10228–10231.
66. Wimhurst, JM, Manchester, KL. A comparison of the effects of diabetes induced with either alloxan or streptozotocin and of starvation on the activities in rat liver of the key enzymes of gluconeogenesis. Biochem J. 1970;120:95–103.
67. Chan, TM. The permissive effects of glucocorticoid on hepatic gluconeogenesis. Glucagon stimulation of glucose-suppressed gluconeogenesis and inhibition of 6-phosphofructo-1-kinase in hepatocytes from fasted rats. J Biol Chem. 1984;259:7426–7432.
68. Chen, KS, Lardy, HA. 3-Aminopicolinate inhibits phosphoenolpyruvate carboxykinase in hepatocytes and increases release of gluconeogenic precursors from peripheral tissues. J Biol Chem. 1984;259:6920–6924.
69. Brown, MS, Goldstein, JL. Selective versus total insulin resistance: a pathogenic paradox. Cell Metabolism. 2008;7:95–96.
70. McGarry, JD, Foster, DW. Regulation of hepatic fatty acid oxidation and ketone body production. Annu Rev Biochem. 1980;49:395–420.
71. Foster, DW. From glycogen to ketones—and back. Diabetes. 1984;33:1188–1199.
72. Williamson, JR, Walajtys-Rode, E, Coll, KE. Effects of branched chain α-ketoacids on the metabolism of isolated rat liver cells: I. Regulation of branched chain α-ketoacid metabolism. J Biol Chem. 1979;254:11511–11520.
73. Souza, SC, Muliro, KV, Liscum, L, et al. Modulation of hormone-sensitive lipase and protein kinase A-mediated lipolysis by perilipin A in an adenoviral reconstituted system. J Biol Chem. 2002;277:8267–8272.
74. Reid, BN, Ables, GP, Otlivanchik, OA, et al. Hepatic overexpression of hormone-sensitive lipase and adipose triglyceride lipase promotes fatty acid oxidation, stimulates direct release of free fatty acids, and ameliorates steatosis. J Biol Chem. 2008;283:13087–13099.
75. McGarry, JD, Woeltje, KF, Kuwajima, M, et al. Regulation of ketogenesis and the renaissance of carnitine palmitoyltransferase. Diabetes Metab Rev. 1989;5:271–284.
76. Foster, DW. The role of the carnitine system in human metabolism. Ann N Y Acad Sci. 2004;1033:1–16.
77. Sekoguchi, E, Sato, N, Yasui, A, et al. A novel mitochondrial carnitine-acylcarnitine translocase induced by partial hepatectomy and fasting. J Biol Chem. 2003;278:38796–38802.
78. McGarry, JD, Leatherman, GF, Foster, DW. Carnitine palmitoyltransferase I: The site of inhibition of hepatic fatty acid oxidation by malonyl-CoA. J Biol Chem. 1978;253:4128–4136.
79. DiMarco, JP, Hoppel, C. Hepatic mitochondrial function in ketogenic states: diabetes, starvation and after growth hormone administration. J Clin Invest. 1975;55:1237–1244.
80. McGarry, JD, Brown, NF. The mitochondrial carnitine palmitoyltransferase system: from concept to molecular analysis. Eur J Biochem. 1997;244:1–14.
81. McGarry, JD, Takabayashi, Y, Foster, DW. The role of malonyl-CoA in the coordination of fatty acid synthesis and oxidation in isolated rat hepatocytes. J Biol Chem. 1978;253:8294–8300.
82. López-Viñas, E, Bentebibel, A, Gurunathan, C, et al. Definition by functional and structural analysis of two malonyl-CoA sites in carnitine palmitoyltransferase 1A. J Biol Chem. 2007;282:18212–18224.
83. Esser, V, Britton, CH, Weis, BC, et al. Cloning, sequencing and expression of a cDNA encoding rat liver carnitine palmitoyltransferase I: proof that a single polypeptide is involved in inhibitor interaction and catalytic function. J Biol Chem. 1993;268:5817–5822.
84. Vega, RB, Huss, JM, Kelly, DP. The coactivator PGC-1 cooperates with peroxisome proliferators-activated receptor alpha in transcriptional control of nuclear genes encoding mitochondrial fatty acid oxidation enzymes. Mol Cell Biol. 2000;20:1868–1876.
85. St. Pierre, J, Lin, J, Krauss, S, et al. Bioenergetic analysis of peroxisome proliferation-activated receptor gamma alpha and 1 beta (PGC-1 alpha and PGC-1 beta) in muscle cells. J Biol Chem. 2003;278:26557–26603.
86. Louet, JF, Hayhurst, G, Gonzalez, FJ, et al. The coactivator PGC-1 is involved in the regulation of the liver carnitine palmitoyltransferase 1 gene expression by cAMP in combination with HNF4 alpha and cAMP-response element-binding protein (CREB). J Biol Chem. 277, 2002. [37991–8000].
87. Wang, YX, Lee, CH, Tiep, S, et al. Peroxisome-proliferator-activated receptor delta activates fat metabolism to prevent obesity. Cell. 2003;113:159–170.
88. Horton, JD, Goldstein, JL, Brown, MS. SREBPs: activators of the complete program of cholesterol synthesis in the liver. J Clin Invest. 2002;109:1125–1131.
89. Yamashita, H, Takenoshita, M, Sakurai, M, et al. A glucose-responsive transcription factor that regulates carbohydrate metabolism in the liver. Proc Natl Acad Sci U S A. 2001;98:9116–9121.
90. Kabashima, T, Kawaguchi, T, Wadzinski, BE, et al. Xylulose 5-phosphate mediates glucose-induced lipogenesis by xylulose 5-phosphate-activated protein phosphatase in rat liver. Proc Natl Acad Sci U S A. 2003;100:5107–5112.
91. Swenson, TL, Porter, JW. Mechanism of glucagon inhibition of liver acetyl-CoA carboxylase. Interrelationship of the effects of phosphorylation, polymer-protomer transition, and citrate on enzyme activity. J Biol Chem. 1985;260:3791–3797.
92. Hardie, DG, Salt, IP, Hawley, SA, et al. AMP-activated protein kinase: an ultrasensitive system for monitoring cellular energy change. Biochem J. 1999;338:717–722.
93. McGarry, JD, Foster, DW. Effects of exogenous fatty acid concentration on glucagon-induced changes in hepatic fatty acid metabolism. Diabetes. 1980;29:236–240.
94. Garcia-Villafranca, J, Guillen, A, Castro, J. Involvement of nitric oxide/cyclic GMP signaling pathway in the regulation of fatty acid metabolism in rat hepatocytes. Biochem Pharmacol. 2003;65:807–812.
95. Park, H, Kaushik, VK, Constant, S, et al. Coordinate regulation of malonyl-CoA decarboxylase, sn-glycerol-3-phosphate acyltransferase, and acetyl-CoA carboxylase by AMP-activated protein kinase in rat tissues in response to exercise. J Biol Chem. 2002;277:32571–32577.
96. Ruderman, NB, Park, H, Kaushik, VK, et al. AMPK as a metabolic switch in rat muscle, liver and adipose tissue after exercise. Acta Physiol Scand. 2003;178:435–442.
97. Ruderman, N, Flier, JS. Chewing the fat—ACC and energy balance. Science. 2001;291:2558–2559.
98. de Laszlo, SE, Hacker, C, Li, B, et al. Potent, orally absorbed glucagon receptor antagonists. Bioorg Med Chem Lett. 1999;9:641–646.
99. Cascieri, MA, Koch, GE, Ber, E, et al. Characterization of a novel, non-peptidyl antagonist of the human glucagon receptor. J Biol Chem. 1999;274:8694–8697.
100. Jiang, J, Zhang, BB. Glucagon and regulation of glucose metabolism. Am J Physiol Endocrinol Metab. 2003;284:E671–678.
101. McGarry, JD, Robles-Valdes, C, Foster, DW. Role of carnitine in hepatic ketogenesis. Proc Natl Acad Sci U S A. 1975;72:4385–4388.
102. Fery, F, Balasse, EO. Ketone body production and disposal in diabetic ketosis. A comparison with fasting ketosis. Diabetes. 1985;34:326–332.
103. Rewers, A, Klingensmith, G, Davis, C, et al. Presence of diabetic ketoacidosis at diagnosis of diabetes mellitus in youth: the search for diabetes in youth study. Pediatrics. 2008;121:e1258–e1266.
104. The DIAMOND Project. Group, incidence and trends of childhood type 1 diabetes worldwide 1990–1999. Diabet Med. 2006;23:857–866.
105. Quinn, M, Fleischman, A, Rosner, B, et al. Characteristics at diagnosis of type 1 diabetes in children younger than 6 years. J Pediatr. 2006;148:366–371.
106. Hekkala, A, Knip, M, Veijola, R. Ketoacidosis at diagnosis of type 1 diabetes in children in northern Finland: temporal changes over 20 years. Diabetes Care. 2007;30:861–866.
107. Alberti, KGMM, Hockaday, TDR. Diabetic coma: a reappraisal after five years. Clin Endocrinol Metab. 1977;6:421–455.
108. Morris, AD, Boyle, DIR, McMahon, AD, et al. Adherence to insulin treatment, glycaemic control, and ketoacidosis in insulin-dependent diabetes mellitus. Lancet. 1997;350:1505–1510.
109. Tattersall, R. Brittle diabetes. Clin Endocrinol Metab. 1977;6:403–419.
110. Jin, H, Meyer, JM, Jeste, DV. Phenomenology of and risk factors for new-onset diabetes mellitus and diabetic ketoacidosis associated with atypical antipsychotics: an analysis of 45 published cases. Ann Clin Psychiatry. 2002;14:59–64.
111. Warner, EA, Greene, GS, Buchsbaum, MS, et al. Diabetic ketoacidosis associated with cocaine use. Arch Int Med. 1998;158:1799–1802.
112. Douma, S, Petidis, K, Kartali, N, et al. Pheochromocytoma presenting as diabetic ketoacidosis. J Diabetes Complications. April 15, 2008.
113. Ovalle, F, Vaughan, TB, 3rd., Sohn, JE, et al. Catamenial diabetic ketoacidosis and catamenial hyperglycemia: case report and review of the literature. Am J Med Sci. 2008;335:298–303.
114. Nylen, ES, Marathe, IC, Khan, IA, et al. Sudden onset of diabetic ketoacidosis during consensus interferon therapy for chronic viral hepatitis C. Am J Med Sci. 2008;335:329–330.
115. Beigelman, PM. Severe diabetic ketoacidosis (diabetic “coma”): 482 episodes in 257 patients; experience of three years. Diabetes. 1971;20:490–500.
116. Kety, SS, Polis, BD, Nadler, CS, et al. The blood flow and oxygen consumption of the human brain in diabetic acidosis and coma. J Clin Invest. 1948;27:500–510.
117. Verdon, F, van Melle, G, Perret, C. Respiratory response to acute metabolic acidosis. Bull Eur Physiopathol Respir. 1981;17:223–235.
118. Esale, EA, Tatersall, RB. Hypothermia: a complication of diabetic ketoacidosis. Br Med J. 1978;2:1387–1389.
119. Guerrin, JM, Meyer, P, Segrestaa, JM. Hypothermia in diabetic ketoacidosis. Diabetes Care. 1987;10:801–802.
120. Ozer, G, Teker, Z, Cetiner, S, et al. Serum IL-1, IL-2, TNF alpha and INF gamma levels of patients with type 1 diabetes mellitus and their siblings. J Pediatr Endocrinol Metab. 2003;16:203–210.
121. Siperstein, MD. Diabetic ketoacidosis and hyperosmolar coma. Endocrinol Metab Clin North Am. 1992;21:415–432.
122. Hockaday, TDR, Alberti, KGMM. Diabetic coma. Clin Endocrinol Metab. 1972;1:751–788.
123. Robin, AP, Ing, TS, Lancaster, GA, et al. Hyperglycemia-induced hyponatremia: a fresh look. Clin Chem. 1979;25:496–497.
124. Kitabchi, A, Umpierrez, GE, Fisher, JN, et al. Thirty years of personal experience in hyperglycemic crises: diabetic ketoacidosis and hyperglycemic hyperosmolar state. J Clin Endocrinol Metab. 2008;93:1541–1552.
125. Cahill, GF, Herrera, MG, Morgan, AP, et al. Hormone-fuel interrelationships during fasting. J Clin Invest. 1966;45:1751–1769.
126. Owen, OE, Morgan, AP, Kemp, HG, et al. Brain metabolism during fasting. J Clin Invest. 1967;46:1589–1595.
127. Mahoney, CA. Extreme gestational starvation ketoacidosis: case report and review of pathophysiology. Am J Kidney Dis. 1992;20:276–280.
128. Chernow, B, Finton, C, Rainey, TG, et al. “Bovine ketosis” in a non-diabetic postpartum woman. Diabetes Care. 1982;5:47–49.
129. Levy, LJ, Duga, J, Girgis, M, et al. Ketoacidosis associated with alcoholism in non-diabetic subjects. Ann Intern Med. 1973;78:213–219.
130. Wren, KD, Slovis, CM, Minion, GE, et al. The syndrome of alcoholic ketoacidosis. Am J Med. 1991;91:119–128.
131. Owen, OE, Licht, JH, Sapir, DG. Renal function and effects of partial rehydration during diabetic ketoacidosis. Diabetes. 1981;30:510–518.
132. Wilson, HK, Keuer, SP, Lea, AS, et al. Phosphate therapy in diabetic ketoacidosis. Arch Intern Med. 1982;142:517–520.
133. Bellingham, AJ, Detter, JC, Lenfant, C. The role of hemoglobin affinity for oxygen and red-cell 2,3-diphosphoglycerate in the management of diabetic ketoacidosis. Trans Assoc Am Physicians. 1970;83:113–120.
134. Vinicor, F, Lehmer, LM, Kam, RC, et al. Hyperamylasemia in diabetic ketoacidosis: sources and significance. Ann Intern Med. 1979;91:200–204.
135. Tanaka, S, Kobayashi, T, Nakanishi, K, et al. Association of HLA-DQ genotype in autoantibody-negative and rapid-onset type 1 diabetes. Diabetes Care. 2002;25:2302–2307.
136. Kitabchi, AE, Young, R, Sacks, H, et al. Diabetic ketoacidosis: reappraisal of therapeutic approach. Annu Rev Med. 1979;30:339–357.
137. Keller, U, Berger, W. Prevention of hypophosphatemia by phosphate infusion during treatment of diabetic ketoacidosis and hyperosmolar coma. Diabetes. 1980;29:87–95.
138. Adrogue, HJ, Barrero, J, Eknoyan, G. Salutary effect of modest fluid replacement in the treatment of adults with diabetic ketoacidosis. JAMA. 1989;262:2108–2113.
139. Androgue, HJ, Wilson, H, Boyd, WE, III., et al. Plasma acid-base patterns in diabetic ketoacidosis. N Engl J Med. 1982;307:1603–1610.
140. Halperin, ML, Bear, RA, Hannaford, MC, et al. Selected aspects of the pathophysiology of metabolic acidosis in diabetes mellitus. Diabetes. 1981;30:781–787.
141. Piters, KM, Kumar, D, Pei, E, et al. Comparison of continuous and intermittent intravenous insulin therapies for diabetic ketoacidosis. Diabetologia. 1977;13:317–321.
142. Flier, JS. Lilly lecture: syndromes of insulin resistance: from patient to gene and back again. Diabetes. 1992;41:1207–1219.
143. Usala, A-L, Madigan, T, Burguera, B, et al. Brief report: treatment of insulin-resistant diabetic ketoacidosis with insulin-like growth factor I in an adolescent with insulin-dependent diabetes. N Engl J Med. 1992;327:853–857.
144. McGarry, JD, Foster, DW. Regulation of ketogenesis and clinical aspects of the ketotic state. Metabolism. 1972;21:471–489.
145. Fulop, M, Murthy, V, Michilli, A, et al. Serum beta-hydroxybutyrate measurement in patients with uncontrolled diabetes mellitus. Arch Intern Med. 1999;159:381–384.
146. Beigelman, PM. Potassium in severe diabetic ketoacidosis. Am J Med. 1973;54:419–420.
147. Carroll, P, Matz, R. Uncontrolled diabetes mellitus in adults. Experience in treating diabetic ketoacidosis and hyperosmolar nonketotic coma with low-dose insulin and a uniform treatment regimen. Diabetes Care. 1983;6:579–585.
148. Malone, JI, Brodsky, SJ. The value of electrocardiogram monitoring in diabetic ketoacidosis. Diabetes Care. 1980;3:543–547.
149. Matz, R. Diabetic acidosis: rationale for not using bicarbonate. N Y State J Med. 1976;76:1299–1303.
150. Narins, RG, Cohen, JJ. Bicarbonate therapy for organic acidosis: the case for its continued use. Ann Intern Med. 1987;106:615–618.
151. Lever, E, Jaspan, JB. Sodium bicarbonate therapy in severe diabetic ketoacidosis. Am J Med. 1983;75:263–268.
152. Green, SM, Rothrock, SG, Ho, JD, et al. Failure of adjunctive bicarbonate to improve outcome in severe pediatric diabetic ketoacidosis. Ann Emerg Med. 1998;31:41–48.
153. Foster, DW. Diabetic ketoacidosis. In: Krieger DT, Bardin DW, eds. Current Therapy in Endocrinology and Metabolism. Toronto: BC Decker; 1985:268–270.
154. Connell, FA, Louden, JM. Diabetes mortality in persons under 45 years of age. Am J Public Health. 1983;73:1174–1177.
155. Bryan, CS, Reynolds, KL, Metzger, WT. Bacteremia in diabetic patients: comparison of incidence and mortality with nondiabetic patients. Diabetes Care. 1985;8:244–249.
156. Winegrad, AI, Kern, EFO, Simmons, DA. Cerebral edema in diabetic ketoacidosis. N Engl J Med. 1985;312:1184–1185.
157. Rosenbloom, AL. Intracerebral crises during treatment of diabetic ketoacidosis. Diabetes Care. 1990;13:22–33.
158. Marcin, JP, Glaser, N, Barnett, P, et al. Factors associated with adverse outcomes in children with diabetic ketoacidosis-related cerebral edema. J Pediatr. 2002;141:793–797.
159. Hanas, R, Lindgren, F, Lindblad, B. Diabetic ketoacidosis and cerebral edema in Sweden: A 2-year pediatric population study. Diabet Med. 2007;24:1080–1085.
160. Arieff, AL, Kleeman, CR. Studies on mechanisms of cerebral edema in diabetic comas: effects of hyperglycemia and rapid lowering of plasma glucose in normal rabbits. J Clin Invest. 1973;52:571–583.
161. Fein, IA, Rackow, EC, Sprung, CL, et al. Relation of colloid osmotic pressure to arterial hypoxemia and cerebral edema during crystalloid volume loading of patients with diabetic ketoacidosis. Ann Intern Med. 1982;96:570–574.
162. Krane, EJ, Rockoff, MA, Wallman, JK, et al. Subclinical brain swelling in children during treatment of diabetic ketoacidosis. N Engl J Med. 1985;312:1147–1151.
163. Durr, JA, Hoffman, WH, Sklar, AH, et al. Correlates of brain edema in uncontrolled IDDM. Diabetes. 1992;41:627–632.
164. Clements, RS, Jr., Blumenthal, SA, Morrison, AD, et al. Increased cerebrospinal-fluid pressure during treatment of diabetic ketosis. Lancet. 1971;2:671–675.
165. Carlotti, AP, Bohn, D, Halperin, ML. Importance of timing of risk factors for cerebral edema during therapy for diabetic ketoacidosis. Arch Dis Child. 2003;88(2):170–173.
166. Levin, DL. Cerebral edema in diabetic ketoacidosis. Pediatr Crit Care Med. 2008;9:320–329.
167. Artis, WM, Fountain, JA, Delcher, HK, et al. A mechanism of susceptibility to mucormycosis in diabetic ketoacidosis: transferrin and iron availability. Diabetes. 1982;31:1109–1114.
168. Weprin, BE, Hall, WA, Goodman, J, et al. Long-term survival in rhinocerebral mucormycosis. Case report. J Neurosurg. 1998;88:570–575.
169. Timperley, WR, Preston, FE, Ward, JD. Cerebral intravascular coagulation in diabetic ketoacidosis. Lancet. 1974;1:952–956.
170. McLaren, EH, Cullen, DR, Brown, MJ. Coagulation abnormalities in diabetic coma before and 24 hours after treatment. Diabetologia. 1979;17:345–349.
171. Paton, RC. Hemostatic changes in diabetic coma. Diabetologia. 1981;21:172–177.
172. Pasi, KJ, Enayat, MS, Horrocks, PM, et al. Qualitative and quantitative abnormalities of von Willebrand antigen in patients with diabetes mellitus. Thromb Res. 1990;59:581–591.
173. Kwaan, HC, Colwell, JA, Suwanwela, N. Disseminated intravascular coagulation in diabetes mellitus, with reference to the role of increased platelet aggregation. Diabetes. 1972;21:108–113.
174. Tschoepe, D, Rauch, U, Schwippert, B. Platelet-leukocyte cross-talk in diabetes mellitus. Horm Metab Res. 1997;29:631–635.
175. Maiello, M, Boeri, D, Podesta, F, et al. Increased expression of tissue plasminogen activator and its inhibitor and reduced fibrinolytic potential of human endothelial cells cultured in elevated glucose. Diabetes. 1992;41:1009–1015.
176. Takahashi, K, Ghatei, MA, Lam, H-C. Elevated plasma endothelin in patients with diabetes mellitus. Diabetologia. 1990;33:306–310.
177. Saenz de Tejada, I, Goldstein, I, Azadzoi, K, et al. Impaired neurogenic and endothelium-mediated relaxation of penile smooth muscle from diabetic men with impotence. N Engl J Med. 1989;320:1025–1030.
178. Hogan, M, Cerami A, Bucala, R. Advanced glycosylation end products block the antiproliferative effect of nitric oxide. J Clin Invest. 1992;90:1110–1115.
179. Carl, GF, Hoffman, WH, Passmore, GG, et al. Diabetic ketoacidosis promotes a prothrombotic state. Endocr Res. 2003;29:73–82.
180. Sobel, BE, Neimane, D, Mack, WJ, et al. The ratio of plasminogen activator inhibitor type-1 activity to the concentration of plasminogen activator inhibitor type-1 protein in diabetes: adding insult to injury. Coron Artery Dis. 2002;13:275–281.
181. Lapolla, A, Piarulli, F, Sartore, G, et al. Peripheral artery disease in type 2 diabetes: the role of fibrinolysis. Thromb Haemost. 2003;89:91–96.
182. He, G, Pedersen, SB, Brunn, JM, et al. Metformin, but not thiazolidinediones, inhibits plasminogen activator inhibitor-1 production in human adipose tissue in vitro. Horm Metab Res. 2003;35:18–23.
183. Carroll, P, Matz, R. Adult respiratory distress syndrome complicating severely uncontrolled diabetes mellitus: report of nine cases and a review of the literature. Diabetes Care. 1982;5:574–580.
184. Foster, DW. Insulin deficiency and hyperosmolar coma. Adv Intern Med. 1974;19:159–173.
185. Vinik, A, Seftel, H, Joffe, BI. Metabolic findings in hyperosmolar, non-ketotic diabetic stupor. Lancet. 1970;2:797–798.
186. Lindsey, CA, Faloona, GR, Unger, RH. Plasma glucagon in non-ketotic hyperosmolar coma. JAMA. 1974;229:1771–1773.
187. Gerich, JE, Martin, MM, Recant, L. Clinical and metabolic characteristics of hyperosmolar nonketotic coma. Diabetes. 1971;20:228–238.
188. Arieff, AI, Carroll, HJ. Nonketotic hyperosmolar coma with hyperglycemia: clinical features, pathophysiology, renal function, acid-base balance, plasma-cerebrospinal fluid equilibria and the effects of therapy in 37 cases. Medicine (Baltimore). 1972;51:73–94.
189. Knowles, HC, Jr. Syrupy blood. Diabetes. 1966;15:760–761.
190. Podolsky, S. Hyperosmolar nonketotic coma: death can be prevented. Geriatrics. 1979;34:29–33.
191. McKenna, K, Morris, AD, Azam, H, et al. Exaggerated vasopressin secretion and attenuated osmoregulated thirst in human survivors of hyperosmolar coma. Diabetologia. 1999;42:534–538.
192. Yen, TT, Stamm, NB, Fuller, RW, et al. Hepatic insensitivity to glucagon in ob/ob mice. Res Commun Chem Pathol Pharmacol. 1980;30:29–40.
193. Azain, MJ, Fukada, N, Chao, F-F, et al. Contributions of fatty acid and sterol synthesis to triglyceride and cholesterol secretion by the perfused rat liver in genetic hyperlipemia and obesity. J Biol Chem. 1985;260:174–181.
194. Begin-Heick, N. Absence of the inhibitory effect of guanine nucleotides on adenylate cyclase activity in white adipocyte membranes of the ob/ob mouse: effect of the ob gene. J Biol Chem. 1985;260:6187–6193.
195. Goldman, SL. Hyperglycemic hyperosmolar coma in a 9-month-old child. Am J Dis Child. 1979;133:181–183.
196. McCurdy, DK. Hyperosmolar hyperglycemic nonketotic diabetic coma. Med Clin North Am. 1970;54:683–699.
197. Maccario, M, Messis, CP, Vastola, EF. Focal seizures as a manifestation of hyperglycemia without ketoacidosis: a report of seven cases with review of the literature. Neurology. 1965;15:195–206.
198. Guisado, R, Arieff, AI. Neurologic manifestations of diabetic comas: correlation with biochemical alterations in the brain. Metabolism. 1975;24:665–679.
199. Maccario, M. Neurological dysfunction associated with nonketotic hyperglycemia. Arch Neurol. 1968;19:525–534.
200. Daugirdas, JT, Kronfol, NO, Tzamaloukas, AH. Hyperosmolar coma: cellular dehydration and the serum sodium concentration. Ann Intern Med. 1989;110:855–857.
201. Bewsher, PD, Petrie, JC, Worth, HGJ. Serum lipid levels in hyperosmolar nonketotic diabetic coma. Br Med J. 1970;3:82–84.
202. Rosenthal, NR, Barrett, EJ. An assessment of insulin action in hyperosmolar hyperglycemic nonketotic diabetic patients. J Clin Endocrinol Metab. 1985;60:607–610.
203. Maccario, M, Messis, CP. Cerebral edema complicating treated nonketotic hyperglycemia. Lancet. 1969;2:352–353.
204. Scharf, Y, Nahir, M, Tatarsky, I, et al. Fatal venous thrombosis in hyperosmolar coma. Diabetes. 1971;20:308–309.
205. Schlepphorst, E, Levin, ME. Rhabdomyolysis associated with hyperosmolar nonketotic coma. Diabetes Care. 1985;8:198–200.