CHAPTER 27 Integration of Signals
T his chapter summarizes how a variety of well-characterized signal transduction pathways work at the cellular and molecular levels. These examples illustrate diverse mechanisms, but common strategies, for carrying information about changing environmental conditions into cells and for eliciting adaptive responses. Chapters 24 to 26 describe the molecular hardware used in these pathways. Here, the focus is on the flow of information, including examples of branching and converging pathways. For each pathway, the key events are reception of the stimulus, transfer of the stimulus into the cell, amplification of a cytoplasmic signal, modulation of effector systems over time, and adaptation through negative feedback loops. Few signaling pathways operate in isolation; physiological responses usually depend on the integration of pathways.
Detection of Odors by the Olfactory System
Sensory Neurons
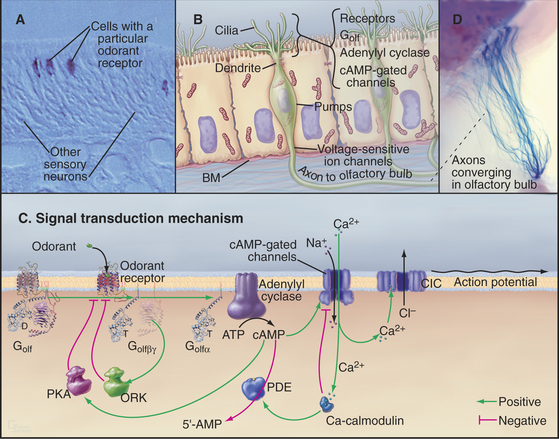
Olfactory sensory neurons located in the nasal epithelium detect specific odorants and respond by sending action potentials to the brain (Fig. 27-1). These neurons have three specialized zones. An apical dendrite extends to the surface of the epithelium and sprouts approximately 12 sensory cilia specialized for responding to particular extracellular odorants. The response depends on high concentrations of four proteins in the ciliary membrane: a single type of odorant receptor, the trimeric G-protein Golf, type III adenylyl cyclase, and cyclic nucleotide–gated ion channels. The cell body contains the nucleus, protein-synthesizing machinery, and plasma membrane pumps and channels that set the resting electrical potential of the plasma membrane. An axon projects from the base of each neuron to secondary neurons in the olfactory bulb at the front of the brain.
Overview of the Pathway
Odorant Receptors
The olfactory system uses a large family of seven-helix receptors to detect a wide range of ligands present at low concentrations in mucus. These receptors were identified by cloning their complementary DNAs (see Fig. 6-8 for cDNAs) from the olfactory epithelium. Genome sequencing established that mice have about 1000 functional odorant receptor genes (about 4% of total genes!), humans have about 350 functional genes, and fish have 100. Odorants are presumed to bind among the transmembrane helices, the most variable part of these proteins. Each sensory neuron typically expresses a single type of odorant receptor (Fig. 27-1A), using negative feedback from the receptor itself to suppress the expression of other types of odorant receptors. The 1000 cells that express each receptor are scattered in zones throughout the olfactory epithelium.
Cyclic Nucleotide–Gated Channels Depolarize the Plasma Membrane and Trigger an Action Potential
The role of cAMP in olfactory signaling was established by experiments on isolated olfactory neurons, in which the effects of odorants, membrane-permeant cyclic nucleotide analogs, and phosphodiesterase inhibitors were explored. Null mutations in mice confirmed the importance of cAMP-gated channels. Note that the role of cAMP in olfaction is distinctly different from its role in most other tissues, where the main target of cAMP is protein kinase A (PKA [see Fig. 25-3]).
Depolarization of the ciliary membrane initiates an action potential (see Fig. 11-6) by activating voltage-gated sodium channels (see Fig. 10-2) in the cell body. The action potential propagates along the axon to a chemical synapse with the second neuron in the olfactory bulb of the brain. The two stages of amplification downstream of the receptor allow a few active receptors to produce an action potential.
Adaptation
Desensitization—the waning of perceived odorant intensity despite its continued presence—results from a combination of central and peripheral processes. Peripheral processes that contribute to adaptation include modulation of each step in the signaling pathway following odorant binding (Fig. 27-1C). At the molecular level, this adaptation is reflected in the transient nature of G-protein activation, the self-limited increase in cAMP, and the limited duration of the membrane depolarization, all of which occur with constant exposure to odorant. Importantly, the sequential nature of many of these feedback circuits implies that they have intrinsic delays and therefore serve not only to alter the magnitude of the response but also to shape its time course.
G-protein-coupled receptors are desensitized by protein kinases that phosphorylate the receptor and by proteins called arrestins that bind phosphorylated receptors (see Fig. 24-3). These modifications inhibit the interaction of activated receptors with G-proteins and provide negative feedback at the first stage of signal amplification. Negative feedback is coupled to receptor stimulation, because the olfactory receptor kinase is brought to the plasma membrane by binding the Gβγ subunits released by receptor-induced G-protein dissociation.
Processing in the Central Nervous System
Mammals discriminate many more odorants than the number of available receptors by combining information from multiple types of receptors in their central nervous systems. While the sensory neurons that express any single odor receptor are broadly distributed across the olfactory epithelium, the axons from this family of like sensory neurons converge on only two to three targets in the olfactory bulb. The target, a glomerulus, is a dense area with synapses between axons of olfactory sensory neurons and dendrites of the second neurons in the pathway. Because each glomerulus receives input only from axons that express the same odor receptor, the molecular specificity established in the olfactory epithelium is preserved. Given approximately 1000 odor receptors in the mouse, each mouse olfactory bulb has approximately 2000 glomeruli (Fig. 27-1D). Of special interest, the odor receptor itself is an important determinant of axon targeting to the glomeruli. Substitution of odor receptors results in the axons selecting new glomerular targets. About 50 secondary neurons receive synaptic input within a glomerulus. Most of these neurons send their axons to higher levels, where they terminate in a combinatorial manner on cortical neurons.
The discrimination of a particular odorant is achieved in two stages: At the first stage, each odorant activates several different receptors, and each receptor can bind a group of related odorants. Therefore, each odorant activates a particular pattern of olfactory sensory neurons and their coupled glomeruli. At the next level, neurons in the cerebral cortex receive information from a combination of glomeruli, leading to eventual discrimination of many different smells at higher levels of the brain. See Box 27-1 for information on our second olfactory system.
BOX 27-1 Sex and the Second Olfactory System
Animals use olfaction to find their mates, identify their offspring, and mark their territories. Some of the odorants that are used for these social interactions are volatile chemicals that stimulate the main olfactory system. A second accessory olfactory system detects other social odorants. Some are volatile chemicals found in urine; others are not volatile, including MHC class II peptide complexes that are shed from the surfaces of cells into the urine and other secretions. Accessory sensory neurons are located in a special part of the epithelium lining nasal cavity called the vomeronasal organ. Each of these neurons expresses one of about 300 seven-helix receptors from a different family than the main odorant receptors. Odorant binding activates a signal transduction pathway distinct from main olfactory neurons, dependent on a Trp channel (see Fig. 10-9) rather than a cyclic nucleotide–gated channel. The axons project to the accessory olfactory bulb in the brain.
Photon Detection by the Vertebrate Retina
Overview of Visual Signal Processing
Photons are energetic but unconventional agonists. They are tiny, move very fast, and penetrate most biochemical materials. These properties create a formidable challenge for detecting photons and transducing their properties (intensity and wavelength) into a signal that can be transmitted to the brain. Nevertheless, vertebrate photoreceptor cells capture single photons and convert this energy into a highly amplified electrical response (Fig. 27-2). Phototransduction is the best-understood eukaryotic sensory process because the system is amenable to sophisticated biophysical, biochemical, and physiological analysis. Single-cell organisms use similar mechanisms to respond to light (see Fig. 38-19).
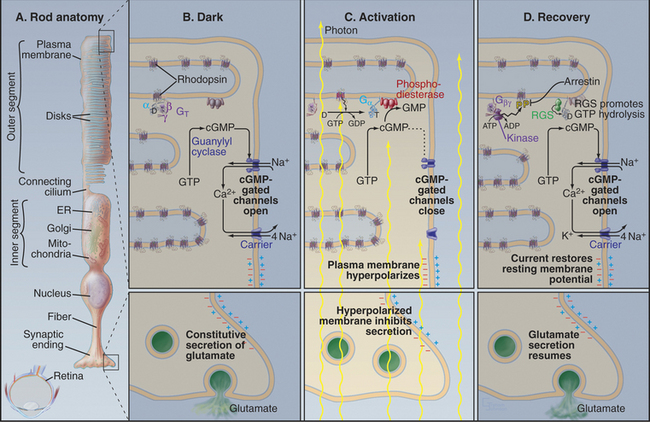
The response of photoreceptor cells depends on the intensity of the light, that is, the flux of photons. Vertebrate retinas detect light with intensities that range over 10 orders of magnitude. Rod photoreceptors (Fig. 27-2A) detect low levels of light from about 0.01 photon per μm2per second (dim stars) to 10 photons per μm2per second but do not discriminate light of different colors. Cone photoreceptors (cones) respond to more intense light, up to about 109photons per μm2per second (full sunlight). Three classes of cones with chromophores that are sensitive to different wavelengths of light allow humans to encode wavelength and color vision to operate (Box 27-2).
Absorption of a photon activates rhodopsin and initiates a signaling cascade (Fig. 27-2) involving a trimeric G-protein and a cGMP phosphodiesterase, both attached to the cytoplasmic face of the disk membrane by covalent lipid groups. Active phosphodiesterase lowers the cytoplasmic concentration of cGMP and closes cGMP-gated channels in the plasma membrane. Closing these channels reduces the release of glutamate at the synapse with the next neuron in the visual circuit. Signals flow through the system as follows:
Feedback loops operate at every level in this signal transduction pathway, turning off the response to a flash of light. The following sections explain how these reactions achieve their spectacular sensitivity in rods.
Rhodopsin
Rhodopsin, the photoreceptor protein of rods, is a seven-helix, G-protein-coupled receptor with a light-absorbing chromophore, 11-cis retinal, covalently attached to lysine 296 through a protonated Schiff base (see Fig. 24-2B). Although 11-cis retinal is bound to a site in the bundle of transmembrane helices similar to sites where ligands bind other seven-helix receptors, this form of rhodopsin is inactive with respect to catalyzing nucleotide exchange on its trimeric G-protein. Thus, rhodopsin is a seven-helix receptor with a covalently attached, but inactive, ligand.
Absorption of light initiates the signal transduction pathway. Picoseconds after the 11-cis retinal chromophore absorbs a photon, the energy isomerizes it to all-trans retinal. This change initiates a cascade of intramolecular reactions that activates rhodopsin by changing its conformation. Metarhodopsin II, the stable active conformation, has rearranged cytoplasmic loops that catalyze nucleotide exchange on transducin, its trimeric G-protein partner (see Fig. 25-9). The signal initiated by absorption of light is amplified by two successive enzymatic reactions and by closing ion channels. Following activation, rhodopsin is inactivated by hydrolysis of the Schiff base linking all-trans retinal to the protein and dissociation of the chromophore. Rhodopsin is regenerated by binding a fresh molecule of 11-cis retinal, derived from vitamin A.
The Positive Arm of the Signal Cascade
As the concentration of cGMP falls, cGMP-gated cation channels in the plasma membrane close. These channels (see Fig. 10-10) are very sensitive to the concentration of cGMP. Binding of four cGMPs opens a channel, whereas the loss of one cGMP closes a channel. Amplification in this pathway is spectacular. Within 1 second after absorption of a single photon, rhodopsin activates 1000 transducins and a similar number of phosphodiesterases, which break down 50,000cGMPs. This change in concentration closes hundreds of cGMP-gated channels, each of which blocks the entry of more than 10,000 cations. Box 27-3 provides more details about the electrical circuit in the rod cell.
Recovery and Adaptation
GTP hydrolysis dissipates the light-activated burst in transducin α-GTP. The low GTPase activity of transducin is activated by association with phosphodiesterase and by an RGS protein (regulator of G-protein signaling; see Fig. 25-8), inactivating transducin in less than 1 second. Humans with mutations that disable the retinal RGS protein cannot adapt to rapid changes in light, so they are blinded for several seconds when they step out of a dark room into full sunlight. Dissociation of transducin α-GDP from phosphodiesterase inhibitory subunits terminates cGMP breakdown.
The reduction in cytoplasmic Ca2+ that accompanies closure of cGMP-gated cation channels stimulates the guanylyl cyclase that rapidly restores the cGMP concentration. This change opens the cation channels and returns the membrane potential to the resting level. See Box 27-4 for information on our second visual system.
Regulation of Metabolism through the β-adrenergic Receptor
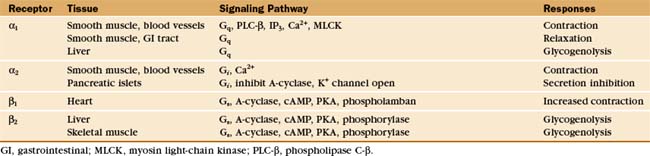
Epinephrine, a catecholamine that is also called adrenaline (Fig. 27-3), is secreted by the neuroendocrine cells of the adrenal gland and other tissues when an animal is startled, is stressed, or otherwise needs to respond vigorously. Norepinephrine, a closely related catecholamine, is secreted by sympathetic neurons, including those that regulate the contractility of the heart. These hormones flow through the blood and stimulate cells of many types throughout the body to heighten their metabolic activity. Skeletal muscle and liver cells respond by breaking down glycogen to glucose to provide energy. Smooth muscle cells of arteries relax to facilitate blood flow. Norepinephrine stimulates heart cells to contract more frequently and with greater force (see Fig. 11-12) and stimulates brown fat cells to dissipate energy as heat (see Fig. 28-6). The variety of physiological responses depends on selective expression of a family of nine adrenergic receptors and their associated signaling hardware in particular differentiated cells (Table 27-1).
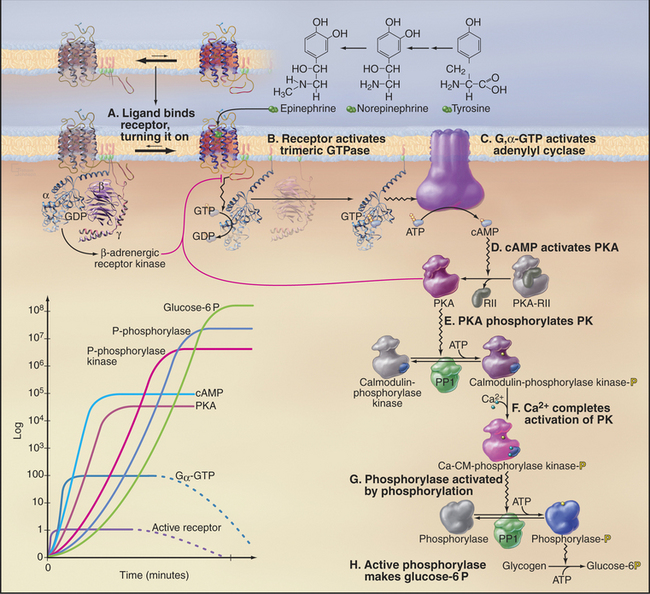
Epinephrine binding to the β-adrenergic receptor is the classic example of a pathway utilizing a seven-helix receptor (see Fig. 24-2), a trimeric G-protein (see Fig. 25-9), and adenylyl cyclase (see Fig. 26-2) to produce cAMP. This second messenger mediates a wide variety of cellular responses by activating protein kinase A (PKA; see Fig. 25-3), which changes the activity of many different cellular proteins by phosphorylation. Differentiated cells vary in their responses to epinephrine and norepinephrine, because they express different targets for PKA. In the heart, PKA phosphorylates voltage-gated Ca-channels, increasing Ca2+ release, and phospholamban, a small membrane protein that stimulates the Ca2+ pump of the smooth endoplasmic reticulum to clear Ca2+ from the cytoplasm (see Fig. 39-15). These changes strengthen contraction. Smooth muscle PKA phosphorylates and inhibits myosin light chain kinase, preventing it from initiating contraction and increasing blood flow (see Fig. 39-21). Liver PKA activates enzymes that break down glycogen, releasing glucose into the circulation.
This section explains how β-adrenergic receptors regulate the production of glucose-6 phosphate from glycogen (Fig. 27-3). As with vision and olfaction, the response to epinephrine is sensitive, highly amplified, and subject to negative feedback control. Five stages of amplification along the seven-step pathway allow binding of a single molecule of epinephrine to a re-ceptor to activate millions of enzyme molecules that produce many million molecules of glucose-6 phosphate:
Activating steps are reversed in several different ways. Epinephrine dissociates rapidly from receptors, so if the plasma concentration of epinephrine declines, the b-receptor equilibrium shifts promptly toward the inactive state. Activated GTP-Gsα hydrolyzes its bound nucleotide slowly, at a rate of about 0.05s−1. GDP-Gsα then rebinds Gβγ, returning the complex to its inactive state. cAMP is degraded to 5′AMP by a phosphodiesterase, an enzyme activated by Ca2+-calmodulin. This convergence allows signaling pathways that release Ca2+ (see Fig. 26-12) to modulate the β-adrenergic pathway.
The negative feedback loops operate on a range of time scales. Gγ is anchored to the membrane lipid bilayer by a C-terminal C-20 geranylgeranyl group, so Gβγ subunits released from Gsα provide a membrane-binding site for cytoplasmic β-adrenergic receptor kinase (now called GRK2). Over seconds to minutes, membrane-associated GRK2 phosphorylates serines in the C-terminal cytoplasmic tail of active receptors. β-arrestin binding to phosphorylated receptors has three negative effects: It blocks interactions of the active receptor with G-proteins, attracts cAMP phosphodiesterase to the membrane, and on a time scale of many minutes, its interactions with β-arrestin, clathrin, and adapter proteins (see Fig. 22-10) mediates removal of receptors from the cell surface by endocytosis. Prolonged stimulation results in receptor ubiquitination (see Fig. 23-2), endocytosis, and degradation. Active PKA produced by the pathway independently phosphorylates the receptor with the same negative consequences as phosphorylation by GRK2.
In addition to these effects on glucose metabolism, active β-adrenergic receptors produce at least two other signals. Gβγ subunits activate calcium channels in some cells. This Ca2+ can augment glycogen breakdown at the phosphorylase kinase step. In addition to its negative effects, β-arrestin binding to phosphorylated receptors can initiate a positive signal: activation of the mitogen-activated protein (MAP) kinase pathway (see Fig. 27-6). β-arrestin serves as a membrane-anchoring site for the cytoplasmic tyrosine kinase, c-Src, which initiates signaling to the MAP kinase cascade.
Signaling Pathways Influencing Gene Expression
Many extracellular ligands influence gene expression, all through just three kinds of generic pathways (Fig. 27-4). The ligands for the first generic pathway are small and hydrophobic, such as steroids, vitamin A, and thyroid hormone. These ligands penetrate the plasma membrane and bind nuclear receptors in the cytoplasm. The ligands for the other two generic pathways include small charged molecules, peptides, and proteins that cannot penetrate the plasma membrane. Therefore, they must bind receptors on the cell surface to initiate pathways that activate transcription factors. In all cases, activated transcription factors cooperate with other nuclear proteins to regulate the expression of specific genes:
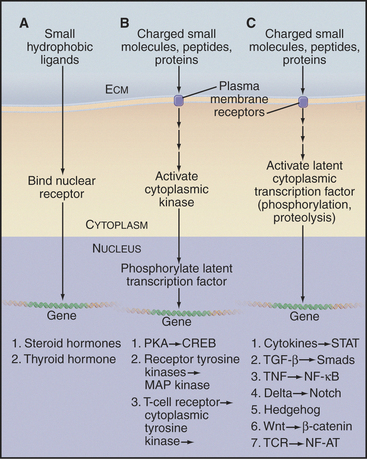
Figure 27-4 the three signaling pathways by which extracellular ligands influence gene expression. A, Nuclear receptor pathway for small hydrophobic ligands that penetrate the plasma membrane (see Fig. 15-22A for an example).B, Pathways employing a plasma membrane receptor and a cytoplasmic protein kinase that enters the nucleus to activate a latent transcription factor. (See Fig. 15-22 for the PKA pathway, Fig. 27-6 for a receptor tyrosine kinase pathway, and Fig. 27-8 for a cytoplasmic tyrosine kinase pathway.)C, Pathways employing a plasma membrane receptor and activating a latent transcription factor in the cytoplasm. The list includes six known pathways of this type. (See Fig. 27-8 for NF-AT, Fig. 27-9 for a STAT pathway, Fig. 27-10 for a Smad pathway, Fig. 15-22 for the NF-kB pathway, Chapter 24 for the Notch and Hedgehog pathways, and Fig. 30-8 for the β-catenin pathway.) CREB, cAMP response element–binding protein; ECM, extracellular matrix; TCR, T-cell receptor; TNF, tumor necrosis factor.
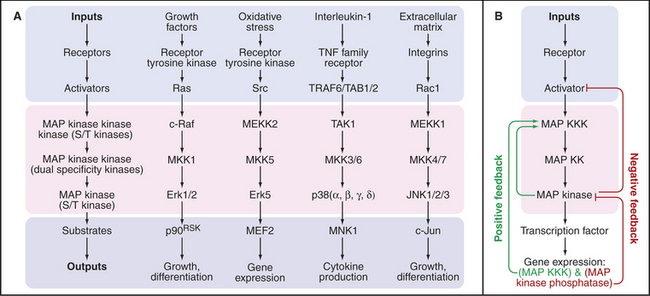
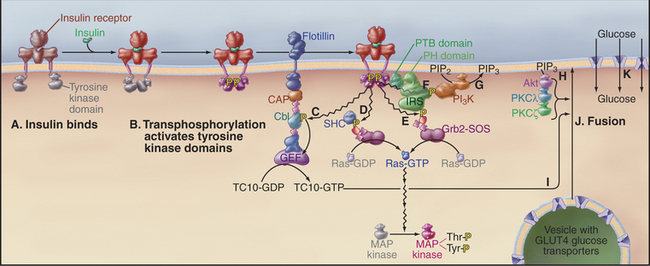
Figure 27-7 insulin signaling pathways in an adipose cell. Active components are shown in bright colors.A, Insulin binds the preformed dimeric receptor, bringing together the tyrosine kinase domains in the cytoplasm.B, The tyrosine kinase domains activate each other by transphosphorylation of activation loops (Fig. 27-3F). Receptor kinases then phosphorylate a variety of downstream targets: the adapter protein Cbl, which activates a nucleotide exchange protein (GEF), which activates the small GTPase TC10 (C); the adapter protein SHC, which binds Grb2-SOS and slowly initiates the MAP kinase pathway (D); the adapter protein IRS, which binds Grb2-SOS and rapidly initiates the MAP kinase pathway (E); and another IRS phosphotyrosine, which binds phosphatidylinositol 3-kinase (PI3K)(F). G, PI3K phosphorylates PIP2 to make PIP3.H, PIP3 binds and activates several protein kinases: Akt (PKB), PKCl, and PKCz.I, These kinases, together with activated TC10, stimulate fusion (J) of vesicles carrying the glucose transporter GLUT4 with the plasma membrane.K, GLUT4 transports glucose into the cell. CAP binds Cbl to the plasma membrane protein flotillin. The PTB domain of IRS binds phosphotyrosine and the PH domain binds PIP3.
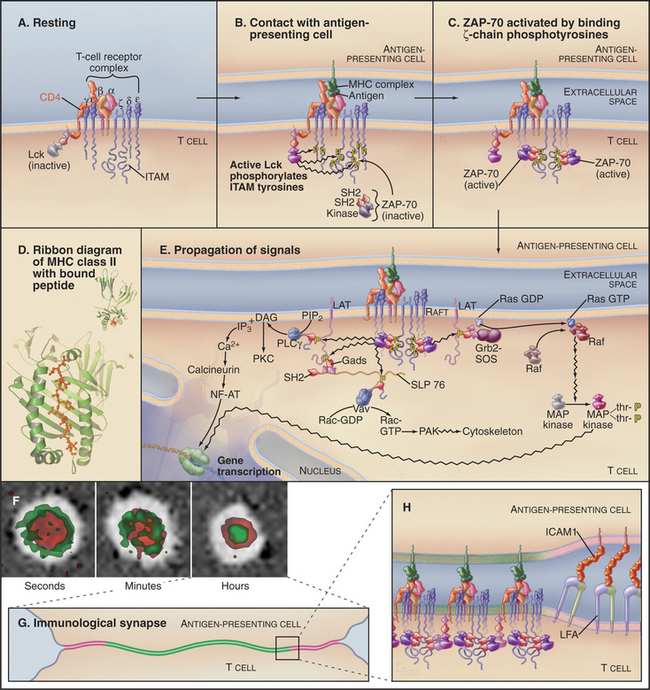
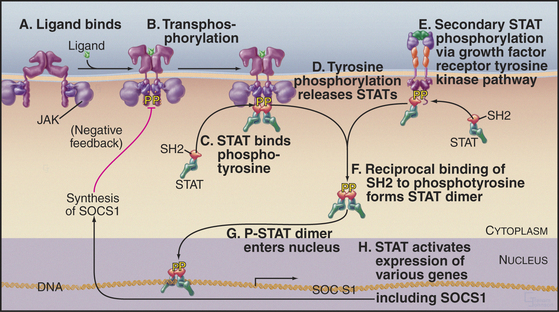
Figure 27-9 cytokine jak/stat signaling pathway. A, Cytokine binds a preformed receptor dimer (Fig. 24-7), bringing together the cytoplasmic domains with a bound tyrosine kinase, JAK.B, JAKs activate each other by transphosphorylation and then phosphorylate other tyrosines on the receptor.C, The SH2 domain of the latent transcription factor STAT binds a receptor phosphotyrosine.D, JAK phosphorylates the STATs, which then dissociate from the receptor.E, Growth factor receptor tyrosine kinases can also activate STATs.F, The STATs form an active dimer by reciprocal SH2-phosphotyrosine interactions.G, The STAT dimer enters the nucleus.H, The STAT dimer activates the expression of various genes. One of these genes encodes SOCS1, which creates negative feedback by inhibiting further STAT activation.
MAP Kinase Pathways to the Nucleus
Cascades of three protein kinases terminating in a MAP kinase (mitogen-activated protein kinase) relay signals from diverse stimuli and receptors to the nucleus (Fig. 27-5). The first kinase activates the second kinase by phosphorylating serine residues. The second kinase activates MAP kinase by phosphorylating both a tyrosine and a serine residue in the activation loop (see Fig. 25-3E). Active MAP kinase enters the nucleus and phosphorylates transcription factors, which regulate gene expression. Key targets include genes that advance or restrain the cell cycle, depending on the system. MAP kinases also regulate the synthesis of nucleotides required for making RNA and DNA.
A variety of cell surface receptors initiate pathways that activate MAP kinase cascades. Many of these pathways pass through the small guanosine triphosphatase (GTPase) Ras, allowing cells to integrate diverse growth-promoting signals to control the cell cycle (see Fig. 41-8). Receptor tyrosine kinases for growth factors (Fig. 27-6) and insulin (Fig. 27-7) send signals through Ras. Other receptors use nonreceptor tyrosine kinases coupled to Ras and MAP kinase, such as T-lymphocyte receptors via zeta-associated protein kinase (ZAP-kinase) (Fig. 27-8). Seven-helix receptors can also activate MAP kinase pathways. For example, β-arrestin not only inactivates β-adrenergic receptors but also couples them to a MAP kinase pathway. Budding yeast activates MAP kinase pathways in two ways. Mating pheromones bind seven-helix receptors that release Gβγ subunits of trimeric G-proteins, which activate the first kinase in the cascade. On the other hand, osmotic shock activates a two-component receptor (Fig. 27-11) upstream of another MAP kinase pathway that regulates the synthesis of glycerol, which is used to adjust cytoplasmic osmolarity.
Animal cells have multiple MAP kinase cascades with particular isoforms of the three kinases linked in series and leading to different effectors (Fig. 27-5). The kinases that make up these pathways are expressed selectively in various cells and tissues. However, deletion of single MAP kinases in mice is generally not lethal, so cross talk between pathways is likely to be extensive.
A cascade of kinases provides opportunities to integrate inputs from converging pathways and to amplify signals. Amplification can be so strong that a MAP kinase cascade acts like an all-or-nothing switch. For example, frog oocytes that are arrested in the G2 stage of the cell cycle react to the hormone progesterone by either remaining arrested or entering the cell cycle. Progesterone activates a MAP kinase cascade consisting of Mos, MEK1, and the p42 MAP kinase. In individual cells, the MAP kinase is either unphosphorylated and inactive or doubly phosphorylated and fully active. This switch-like response depends in part on the fact that both MEK1 and MAP kinase require two independent phosphorylation events for activation. In addition, active MAP kinase provides two types of positive feedback (Fig. 27-5B). MAP ki-nase not only activates Mos by phosphorylation but also drives Mos expression. Consequently, a marginal stimulus turns some cells on strongly and others not at all rather than producing a graded response in all of the cells.
Growth Factor Receptor Tyrosine Kinase Pathway through Ras to Map Kinase
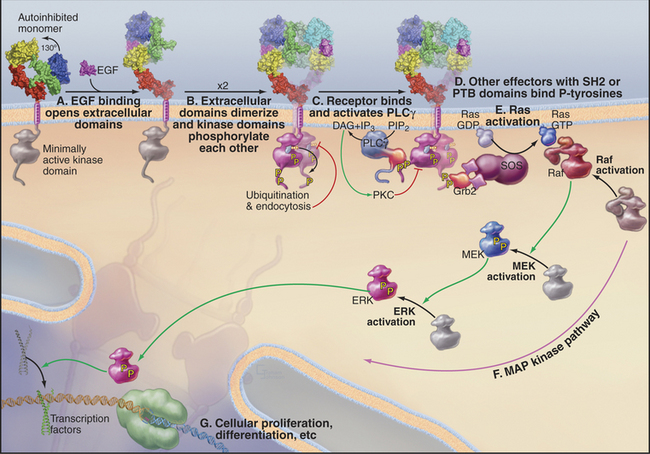
Protein and polypeptide growth factors control the expression of genes required for growth and development. For example, the protein epidermal growth factor (EGF) controls proliferation and differentiation of epithelial cells in vertebrates. Platelet-derived growth factor (PDGF) stimulates the proliferation of connective tissue cells required to heal wounds (see Fig. 32-11). Similar proteins specify the differentiation of cells in fly eyes and the reproductive tract of nematode worms.
Growth factor signaling pathways transfer information from the cell surface through at least eight different protein molecules to the nucleus (Fig. 27-6). Conservation of the main features of the mechanism in vertebrates, worms, and flies made it possible to piece together this complex pathway by pooling information from different systems. Genetic tests identified the components and established the order of their interactions. Many components were identified independently as oncogenes and by biochemical isolation and reconstitution of individual steps.
Information flows from growth factors to the nucleus as follows:
The routes from the cell surface through Ras and MAP kinase to nuclear transcription factors are not simple linear pathways. The signal is amplified at some steps and influenced by both positive and negative feedback loops at multiple levels. For example, pathways through phospholipase Cγ1 and phosphatidylinositol-3 kinase produce Ca2+ and lipid second messengers that activate PKC isoforms (see Fig. 26-6), which provide negative feedback by phosphorylating growth factor receptors. Active receptors are also modified by addition of a single ubiquitin, a signal for inactivation by endocytosis (see Fig. 23-2).
Growth factor pathways are double-edged swords. They are essential for normal growth and development, but malfunctions cause disease by inappropriate cellular proliferation. One example is the release of PDGF at the sites of blood vessel injury. Normally, PDGF stimulates wound repair (see Fig. 32-11), but excess stimulation of the proliferation of smooth muscle cells in the walls of injured blood vessels is an early event in the development of arteriosclerosis.
Many components of growth factor signaling pathways were discovered during the search for genes that cause cancer. As Jean Marx put it, “growth pathways are liberally paved with oncogene products.”*Several of the genes were identified in cancer-causing viruses as oncogenes that are capable of transforming cells in tissue culture. Oncogenes include sis, a retroviral homolog of PDGF; erbB, a homolog of the EGF receptor; and raf kinase. Subsequently, the normal homologs of these genes were found to have mutations in human can-cers. Cancer-causing mutations typically make the protein constitutively active, producing a positive sig-nal for growth in the absence of external stimuli (see Fig. 41-10).
Insulin Pathways to GLUT4 and MAP Kinase
The insulin receptor tyrosine kinase not only stimulates the MAP kinase cascade but also triggers the acute response of muscle and adipose cells to the elevation of blood glucose following a meal (Fig. 27-7). High blood glucose levels stimulate β cells in the islets of Langerhans in the pancreas to secrete insulin, a small protein hormone. Insulin receptors are found on many cells, particularly muscle and fat cells. The insulin receptor is a stable dimer of two identical subunits, each consisting of two polypeptides covalently linked by a disulfide bond. One polypeptide forms the insulin-binding extracellular domain. The other has a single transmembrane helix connected to a cytoplasmic tyrosine kinase domain. Insulin binding changes the conformation of the extracellular domains in a way that brings together the tyrosine kinase domains on the other side of the membrane. Transphosphorylation of the juxtaposed kinase domains (see Fig. 25-3E) stimulates their kinase activities (Fig. 27-7D). The kinases propagate the signal by phosphorylating adapter proteins including IRS (insulin receptor substrates, isoforms 1 to 4), SHC (for SH2 and collagen-like), and Cbl. Each plays a distinct role in the ensuing response. This strategy differs from growth factor receptors, which use phosphotyrosine on the receptor itself to dock SH2-domain effector enzymes.
The best-known effects of insulin are to stimulate glucose uptake from blood (particularly into skeletal muscle and white fat) and the synthesis of glycogen, protein, and lipid. Glucose uptake is accomplished by the glucose carrier, GLUT4 (see Fig. 9-5). Resting cells store the GLUT4 uniporter in the membranes of cytoplasmic vesicles. Insulin stimulates fusion of these vesicles with the plasma membrane, making GLUT4 avail-able to transport glucose into the cell. This membrane fusion event requires two separate signals, both of which are downstream from the insulin receptor. Binding of PI-3 kinase to a particular phosphotyrosine on IRS initiates one signal. PI-3 kinase synthesizes PIP3, which activates the protein kinases PKB/Akt, PKCg, and PKCγ. Phosphorylation of the adapter protein Cbl initiates the second signal. Cbl activates a nucleotide exchange protein (guanine nucleotide exchange factor [GEF]), which activates the small GTPase TC10. Within minutes of insulin stimulation, the three kinases and TC10-GTP cooperate to release GLUT4 vesicles from intracellular tethers and promote their fusion with the plasma membrane. PKB also stimulates the conversion of the newly acquired glucose to its storage form, glycogen, by releasing glycogen synthase (the enzyme that makes glycogen) from inhibition by glycogen synthase kinase (GSK) 3. The importance of PKB in the response to insulin was verified by the discovery that an inactivating mutation of PKB causes a rare form of diabetes.
T-Lymphocyte Pathways through Nonreceptor Tyrosine Kinases
Some signaling pathways that control cellular growth and differentiation operate through cytoplasmic protein tyrosine kinases separate from the plasma membrane receptors. The best-characterized path-ways control the development and activation of lymphocytes in the immune system. T lymphocytes are the example in this section. T lymphocytes defend against intracellular pathogens, such as viruses, and assist B lymphocytes in producing antibodies (see Fig. 28-9).
T cells are activated during interactions of recep-tors (called T-cell receptors or TCRs) and accessory proteins on their surface with peptide antigens bound to histocompatibility proteins on the surface of an antigen-presenting cell (Fig. 27-8). Some interactions of T cells with the antigen-presenting cells are generic; others are specific. These interactions on the surface of the T lymphocyte trigger a network of interactions among protein tyrosine kinases, adapter proteins, and effector proteins on the inner surface of the plasma membrane. Tyrosine phosphorylation of multiple membrane and cytoplasmic proteins activates three separate pathways to the nucleus. Two activate cytoplasmic transcription factors; the third uses the Ras/MAP kinase pathway to activate transcription factors in the nucleus.
The T-cell antigen receptor is a complex of eight transmembrane polypeptides (Fig. 27-8A). The α and β chains, each with two extracellular immunoglobulin-like domains, provide antigen-binding specificity. Similar to antibodies, one of these immunoglobulin domains is constant and one is variable in sequence. The genes for T-cell receptors are assembled from separate parts, similar to the rearrangement of antibody genes (see Fig. 28-10). Genomic sequences for variable domains are spliced together randomly in developing lymphocytes from a panel of sequences, each encoding a small part of the protein. This combinatorial strategy creates a diversity of T-cell antigen receptors, with one type expressed on any given T cell. Variable sequences of α and β chains provide binding sites for a wide range of different peptide antigens bound to proteins, collectively termed the major histocompatibility complex (MHC) antigens, and presented on the surface of cells (Fig. 27-8D). These peptides are fragments of viral proteins or other foreign matter that have been degraded inside the cell, inserted into compatible MHC molecules during their assembly in the endoplasmic reticulum, and transported to the cell surface. Assembly of T-cell receptors in the endoplasmic reticulum requires six additional transmembrane polypeptides, each with one or more short sequence motifs, called immunoreceptor tyrosine activation motifs (ITAMs), in their cytoplasmic domains.
The expression of single types of α and β chains provides individual T cells with specificity for a particular peptide. Although T-cell antigen receptors bind specifically, their affinity for the complex of peptide and MHC is low (Kd in the range of 10μM). Given the small number (hundreds) of unique MHC-peptide complexes found on the target cell surface, this low affinity would not be sufficient for a lymphocyte to form a stable complex with an antigen-presenting cell. Accessory proteins called coreceptors, such as CD4 (also the receptor for human immunodeficiency virus [HIV]) and CD8 (see Fig. 30-3), bind directly to any MHC protein and reinforce interaction of the two cells.
Two classes of protein tyrosine kinases are required to transmit a signal from the engaged TCR to effector systems. The first class of kinases, including Lck and Fyn, are relatives of the product of the Src gene (see Fig. 25-3C), the first oncogene to be characterized (Box 27-5). These tyrosine kinases are anchored to the plasma membrane by myristolated N-terminal glycines and inhibited by a phosphotyrosine near the C-terminus (see Fig. 25-3C). This tyrosine is phosphorylated by a kinase, Csk, and dephosphorylated by the transmembrane protein tyrosine phosphatase, CD45 (see Fig. 25-6B). Apparently, CD45 keeps Lck partially dephosphorylated and therefore partially active in resting lymphocytes. Zeta-associated protein–70 kD (ZAP-70) is the most important of the second class of protein tyrosine kinases. Two SH2 domains allow ZAP-70 to bind tyrosine-phosphorylated ITAMs on ζ chains.
BOX 27-5 Src Family of Protein Tyrosine Kinases
The family of Src-like proteins shares a common structure (see Fig. 25-3C). Five functionally distinct segments are recognized in the sequences. An N-terminal myristic acid anchors the protein to the plasma membrane. Without this modification, the protein is inactive. The next domains are the founding examples of Src homology domains SH3, which bind proline-rich peptides, and SH2, which bind peptides containing a phosphorylated tyrosine (Fig. 25-10). The kinase domain is followed by a tyrosine near the C-terminus. Phosphorylation of this tyrosine and its intramolecular binding to the SH2 domain lock the kinase in an inactive conformation. Dephosphorylation of the C-terminal tyrosine and phosphorylation of the activation loop activate the kinase.
Expression of c-Src is highest in brain and platelets, but a null mutation in mice produces relatively few defects, except in bones, where a failure of osteoclasts to remodel bone leads to overgrowth, a condition called osteopetrosis (see Fig. 32-6).
When a T cell recognizes an antigen-presenting cell with an appropriate peptide bound to MHC on its surface, the TCRs and adhesion proteins in the interface between the cells rearrange to form an “immunologic synapse” (Fig. 27-8F). TCRs initially gather around a region of contact between integrins (LFA) on the T cell and immunoglobulin-cellular adhesion molecules (ICAMs) on the antigen-presenting cell. With time, these zones reverse positions, yielding a stable immuno-logic synapse, with a ring of adhesion molecules (Fig. 27-8G-H) around a central region with concentrated MHCs and TCRs. In this crowded central region, even a few specific MHC-peptides can activate multiple TCRs in serial fashion. Each active TCR generates a signal to the nucleus and is then internalized and degraded.
The response to T cell receptor activation depends on the particular state of differentiation of the T cell that encounters its partner antigenic peptide. Stimulation causes some T cells to secrete toxic peptides that kill the antigen-presenting cell, others to synthesize and secrete lymphokines (immune system hormones), others to proliferate and differentiate, and yet others to commit to apoptosis (see Fig. 46-8).
Cytokine Receptor, JAK/STAT Pathways
Many polypeptide hormones and growth factors (collectively called cytokines; see Fig. 24-6) regulate gene expression through a three-protein relay without a second messenger—the most direct signal transduction pathway from extracellular ligands to the nucleus (Fig. 27-9). Growth hormone uses this mechanism to drive overall growth of the body, erythropoietin directs the proliferation and maturation of red blood cell precursors, and several interferons and interleukins mediate antiviral and immune responses. Slime molds and animals use these pathways, but these proteins are not present in fungi or plants.
The three components in these pathways are a plas-ma membrane receptor that lacks intrinsic enzymatic activity, an associated tyrosine kinase (JAK), and a latent, cytoplasmic transcription factor called a STAT (signal transducer and activator of transcription). Crystal structures of the extracellular domain of the human erythropoietin receptor (see Fig. 24-6) suggest that the inactive receptor is preformed dimer in the membrane. Most of these receptors use two fibronectin III domains to bind their ligands.
JAKs were originally given the lighthearted name “just another kinase.” In view of their role between diverse receptors and transcription factors, the revisionist name “Janus kinase” (for the Greek god who opens doors) has been suggested. The tyrosine kinase domain is located near the C-terminus next to an inactive kinase-like domain. The N-terminal half of these proteins and kinase-like domain mediate the association of JAKs with receptors. Some cytokine receptors bind and activate a single type of JAK; others are promiscuous (see Fig. 24-6).
Serine/Threonine Kinase Receptor Pathways through Smads
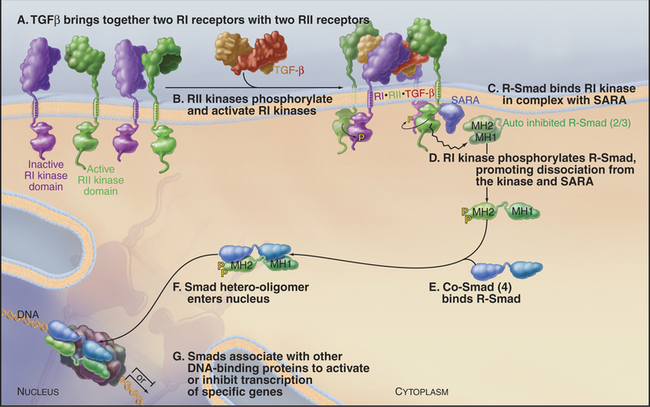
Metazoans use a family of dimeric polypeptide growth factors related to transforming growth factor-β(TGF-β [see Fig. 24-8]) to specify developmental fates during embryogenesis and to control cellular differentiation in adults. More than 40 genes in this family are divided into two classes: (i) those related to TGF-β and activins and (ii) a large family of bone morphogenetic proteins. All activate a short pathway consisting of receptor serine/threonine kinases and a family of eight mobile transcription factors called Smads. The receptors consist of two types of subunits called RI and RII.
Ligand binding brings together two RI and two RII receptors, allowing the RII receptors to activate the RI receptors by transphosphorylation. Active RI receptors phosphorylate “regulated Smads” (R-Smads), such as Smad2 and Smad3. Phosphorylated R-Smads form active heterodimers with Smad4, called a co-Smad, because it is not subjected to phosphorylation itself. Other Smads regulate these pathways by inhibiting phosphorylation of R-Smads. After activation of a receptor, information is transmitted to the nucleus as follows (Fig. 27-10):
The Smad pathway activated by TGF-β regulates cellular proliferation and differentiation of many cell types, including epithelial and hematopoietic cells. Although its name implies that it should drive transformation, TGF-β actually stops the cell cycle in G1 by promoting expression of negative regulators of cyclin-dependent kinases (see Fig. 41-3).
Two-Component Phosphotransfer Systems
Prokaryotes, fungi, and plants transduce stimuli ranging from nutrients to osmotic pressure using signaling systems consisting of as few as two proteins, a receptor-linked histidine kinase, and a “response regulator” activated by phosphorylation of an aspartic acid (Box 27-6 and Fig. 27-11). Such “two-component” systems from bacteria are one of the few signaling pathways in which the dynamics of information transfer are well understood. Extensive collections of mutants in these pathways and sensitive single-cell assays for responses, such as flagellar rotation, provide tools for rigorous tests of concepts and mathematical models derived from biochemical experiments on isolated components.
BOX 27-6 Two-Component Signaling
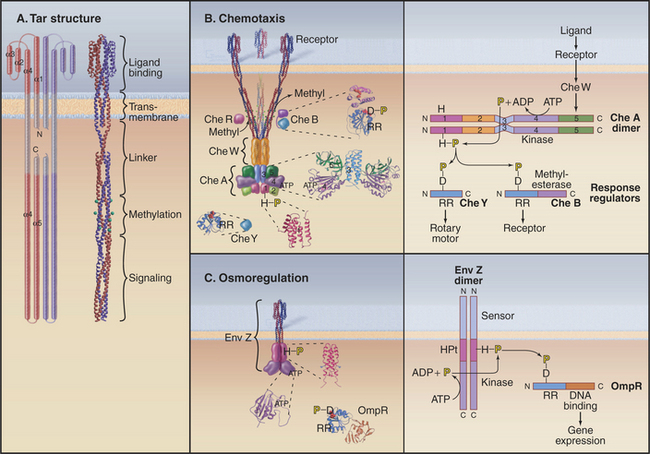
Two-component receptors either may include a cytoplasmic histidine kinase domain (Fig. 27-11C) or may bind a separate histidine kinase, such as the aspartate chemotactic receptor Tar (Fig. 27-11B). Tar consists of two identical subunits. Three of these dimers are thought to be anchored at their bases in the cytoplasm (Fig. 27-11B). Binding of aspartic acid between the extracellular domains of two subunits changes their orientation by a few degrees. Transmission of this conformational change across the membrane alters the activity of CheA, a histidine kinase that is associated with the most distal cytoplasmic domains of the receptor.
Histidine kinases have a conserved catalytic domain of about 350 residues that is structurally unrelated to eukaryotic serine/threonine/tyrosine kinases (shown in Fig. 25-3). Another domain allows them to form homodimers. Histidine kinases are incorporated into a wide variety of proteins, including transmembrane receptors (Fig. 27-11C) and cytoplasmic proteins with a variety of accessory domains such as CheA (Fig. 27-11B). The catalytic domain transfers the γ-phosphate from ATP to just one substrate, a histidine residue of its homodimeric partner. This histidine is usually located in the dimerization domain.
All response regulators have a domain of about 120 residues folded like CheY (Fig 27-11B; also see Fig. 3-7). Transfer of phosphate from the phosphohistidine of a kinase to an invariant aspartic acid changes the conformation of the response regulator. Most response regulators such as CheB (Fig. 27-11B) and OmpR (Fig. 27-11C) are larger than CheY, having C-terminal effector domains. Many effector domains, including OmpR, bind DNA and regulate transcription of specific genes when the response regulator is activated by aspartate phosphorylation. Other response regulators are included as a domain of the histidine kinase itself.
ATP + kinase-his  ADP + kinase-his∼P
kinase-his∼P + RR-asp  kinase-his + RR*-asp∼P
RR*-asp∼P + H2O  RR-asp + phosphate
Phosphorylation activates response regulators (RR*) by changing their conformation. Details differ depending on the response regulator. In the case of OmpR, phosphorylation relieves autoinhibition of the DNA-binding domain (Fig. 27-11C). Phosphorylation of CheY reveals a binding site for the flagellar rotor. The signal dissipates by dephosphorylation of the response regulator, either by autocatalysis or by stimulation by accessory proteins. Lifetimes of the high-energy aspartic acylphosphate vary from seconds to hours.
A minimal two-component system, such as a bacterial osmoregulatory pathway (Fig. 27-11C), consists of a dimeric plasma membrane receptor with a cytoplasmic histidine kinase domain and a cytoplasmic response regulator protein. Signal transduction is carried out in four steps. A change in osmolarity alters the conformation of the receptor, activating the kinase activity of its cytoplasmic domain. The kinase phosphorylates a histidine residue on the other subunit of the dimeric receptor. This phosphate is transferred from the receptor to an aspartic acid side chain of the response regulator protein OmpR. Phosphorylation changes the conformation of the response regulator domain of OmpR, allowing its DNA-binding domain to activate the expression of certain genes.
For years, two-component systems appeared to be restricted to prokaryotes, but response regulators eventually were discovered in yeast and plants. Bacteria have genes for up to 70 response regulators, with 32 response regulators and 30 histidine kinases in Escherichia coli. Archaea have genes for up to 24 response regulators. The slime mold Dictyostelium has more than 10 histidine kinases, whereas fungi have just one or two of these systems. Plants use a two-component system to regulate fruit ripening in response to the gas ethylene.
Bacterial Chemotaxis
The two-component system regulating bacterial chemotaxis (Fig. 27-12) is the best-understood signaling pathway of any kind. E. coli cells use five types of plasma membrane receptors to sense a variety of different chemicals. These receptors are also called methyl-accepting chemotaxis proteins, as they are regulated by methylation. The most abundant, with about 2000 copies per cell, is Tar (Fig. 27-11A-B), the receptor for the nutrients aspartic acid (Tar-D) and maltose, protons (as part of pH sensing), temperature, and the repellent nickel. A few thousand Tar molecules are concentrated at one end of the cell (Fig. 27-12A). Clustering facilitates interactions between receptor molecules, but this polarized distribution has nothing to do with sensing the direction of chemical gradients.
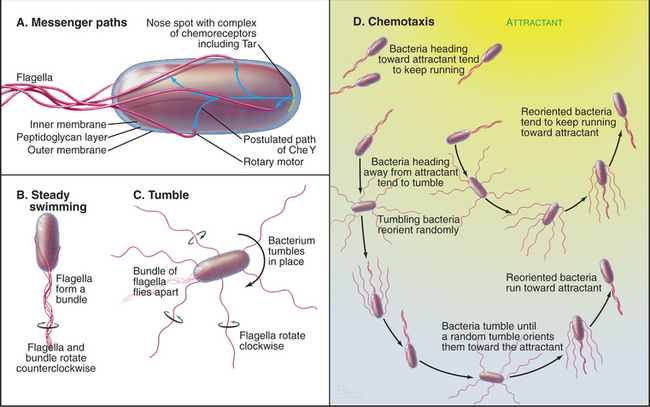
The chemotactic signaling system guides swimming bacteria toward attractive chemicals and away from repellents in a biased random walk. Environmental chemicals influence the behavior of the cell by biasing the direction that the rotary flagellar motor turns (see Figs. 38-23 and 38-24 for details on the motor itself). In its default mode, the motor turns counterclockwise, and the bacterium swims smoothly in a more or less linear path. When the flagella turn the other way, the bacterium tumbles about in one place. A tumble allows a bacterium to reorient its direction randomly, so when it resumes smooth swimming, it usually heads off in a new direction. In the absence of chemoattractants, bacteria swim for about 0.9s and then tumble for about 0.1s, allowing for random reorientations every second.
A gradient of chemical attractant promotes the length of runs up the gradient by suppressing tumbling if the concentration of attractant increases over time (Fig. 27-12D). A two-component signaling pathway senses the attractant and controls the frequency of tumbling. The degree of saturation of the flagellar motor with the response regulator CheY determines which way it rotates.
Ligand-free Tar stimulates the phosphorylation of the associated histidine kinase CheA. (“Che” refers to a gene required for chemotaxis, as most of these components were discovered by mutagenesis. A lowercase “p” represents the shorthand for phosphorylation in these bacterial systems.) CheAp activates the response regulator, CheY, by transferring phosphate from histidine to D57 of CheY. CheYp has a higher affinity for the flagellar motor than CheY, and ligand-free receptor maintains an equilibrium with the rotors partially saturated with CheYp. With several bound CheYps, the motor reverses from its free-running, counterclockwise state about 10% of the time, inducing a brief tumble about once per second.
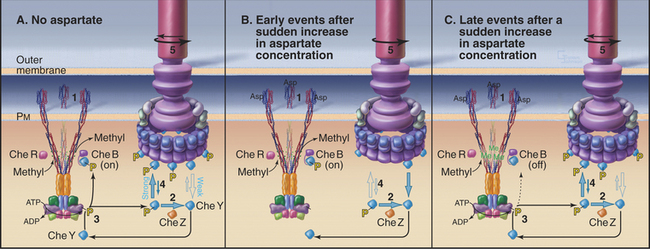
For the cell to respond to aspartate on a subsecond time scale, an accessory protein, CheZ, is required to increase the rate of CheYp dephosphorylation more than 100-fold from its slow spontaneous rate of 0.03s−1. Given this fast dissipation of CheYp, maintenance of a tumbling rate of about 1s−1, in the absence of an attractant, requires constant flow of phosphate from ATP to CheAp to CheYp (Fig. 27-13A). (In most other two-component pathways, dephosphorylation of the re-sponse regulator is much slower, allowing responses over a period of minutes rather than milliseconds.) The following sections examine chemotaxis on the system level, starting with the response to a rapid change in concentration of aspartate.
Temporal Sensing of Gradients
A sudden increase in the concentration of aspartate yields a smooth swimming response within 200μs due to rapid reequilibration of the concentrations of all of the cytoplasmic signaling components (Fig. 27-13B). Aspartate binds Tar and inhibits autophosphorylation of CheA. Because CheYp has a half-life less than 100μs, the concentrations of CheAp and CheYp decrease rapidly. CheYp dissociates from the flagellar motor and the motor persists in the counterclockwise, smooth swimming direction. If the concentration change with time is due to a gradient of aspartate, the bacterium tends to swim steadily up the gradient toward the source.
Adaptation
After a step change in aspartate, bacteria respond quickly with smooth swimming, but within tens of seconds to minutes, they return to their normal pattern of intermittent tumbling. In fact, the steady-state tumbling frequency is independent of the concentration of aspartate. This remarkable capacity to adapt is accomplished by a negative feedback loop provided by reversible methylation of the receptor (Fig. 27-13C). Methylated Tar has a somewhat lower affinity for aspartate than unmethylated Tar, but Me-Tar with bound aspartate is more effective at stimulating CheA phosphorylation than Tar with bound aspartate.
Two relatively slow enzymes determine the level of Tar methylation (Fig. 27-11B). CheR adds methyls to four glutamic acid residues on each receptor polypeptide, whereas CheB removes them. CheR is constitutively active but sensitive to the overall metabolic state of the cell, as it depends on the concentration of S-adenosyl methionine, a methyl donor that is used in many metabolic reactions.
Adaptation occurs because aspartate binding to Tar activates two different pathways on different time scales. On a millisecond time scale, the concentrations of both CheAp and CheYp decline, CheYp dissociates from the motor, and the cell swims smoothly. The rapid reduction in CheAp also reduces the concentration of CheBp, but on a second time scale, as the rate of CheBp dephosphorylation is only 0.1s−1. The slow decline in CheBp gradually reduces methylesterase activity and results in a higher level of Tar methylation. This, in turn, allows the receptor, still saturated with aspartate, to reactivate CheA phosphorylation. Remarkably, the cell returns exactly to its prestimulus frequencies of runs and tumbles. This robust adaptation mechanism is an integral feedback system, just like a thermostat on a heater. Both methylation and demethylation are sensitive to the conformation of the receptor, so another level of complexity contributes to the capacity of the system to adapt.
Aaronson DS, Horvath CM. A road map for those who don’t know JAK-STAT. Science. 2002;296:1653-1655.
American Association for the Advancement of Science. Signal Transduction Knowledge Environment. Available at http:/stke.sciencemag.org.
Armitage JP. Bacterial tactic responses. Adv Microb Physiol. 1999;41:229-289.
Attisano L, Wrana JL. Signal transduction by the TGF-b superfamily. Science. 2002;296:1646-1647.
Bray D, Duke T. Conformational spread: The propagation of allosteric states in large multiprotein complexes. Annu Rev Biophys Biomol Struct. 2004;33:53-73.
Call ME, Wucherpfennig KW. The T cell receptor: Critical role of the membrane environment in receptor assembly and function. Annu Rev Immunol. 2005;23:101-125.
Chang L, Karin M. Mammalian MAP kinase signalling cascades. Nature. 2001;410:37-40.
Davis M, Krogsgaard M, Huppa JB, et al. Dynamics of cell surface molecules during T-cell recognition. Annu Rev Biochem. 2003;72:717-742.
Derynck R, Zhang YE. Smad-dependent and Smad-independent pathways in TGF-b signalling. Nature. 2003;425:577-584.
Ferrell JEJr. Self-perpetuating states in signal transduction: Positive feedback, double-negative feedback and bistability. Curr Opin Cell Biol. 2002;14:140-148.
Ihle JN. The Stat family in cytokine signaling. Curr Opin Cell Biol. 2001;13:211-217.
Johnson GL, Lapadat R. Mitogen-activated protein kinase pathways mediated by ERK, JNK and p38 protein kinases. Science. 2002;298:1911-1912.
Lefkowitz RJ, Shenoy SK. Transduction of receptor signals by b-arrestins. Science. 2005;308:512-517.
Mombaerts P. Seven-transmembrane proteins as odorant and chemosensory receptors. Science. 1999;286:707-711. [See also related articles in same issue.]
Mombaerts P. Genes and ligands for odorant, vomeronasal and taste receptors. Nat Rev Neurosci. 2004;5:263-278.
Ottensmeyer FP, Beniac DR, Luo R Z-T, Yip C. Mechanism of transmembrane signaling: Insulin binding and the insulin receptor. Biochemistry. 2000;39:12103-12112.
Ptashne M, Gann A. Imposing specificity on kinases [MAP kinase cascades]. Science. 2003;299:1025-1027.
Rana BK, Shiina T, Insel PA. Genetic variations and polymorphisms of G protein-coupled receptors: Functional and therapeutic implications. Annu Rev Pharmacol Toxicol. 2001;41:593-624.
Ridge KD, Abdulaev NG, Sousa M, Palczewski K. Phototransduction: Crystal clear. Trends Biochem Sci. 2003;28:479-487.
Rieke F, Baylor DA. Single photon detection by rod cells of the retina. Rev Mod Phys. 1998;70:1027-1036.
Saltiel AR, Kahn R. Insulin signalling and the regulation of glucose and lipid metabolism. Nature. 2001;414:799-806.
Shi Y, Massague J. Mechanisms of TGF-b signaling from cell membranes to the nucleus. Cell. 2003;113:685-700.
Shimizu TS, Aksenov AV, Bray D. A spatially extended stochastic model of the bacterial chemotaxis signalling pathway. J Molec Biol. 2003;329:291-309.
Stock AM, Robinson VL, Goudreau PN. Two-component signal transduction. Annu Rev Biochem. 2000;69:183-215.
ten Dijke P, Hill CS. New insights into TGF-Smad signalling. Trends Biochem Sci. 2004;29:265-273.
Wadhams GH, Armitage JP. Making sense of it all: Bacterial chemotaxis. Nat Rev Mol Cell Biol. 2004;5:1024-1037.
Whitehead JP, Clark SF, Urso B, James DE. Signalling through the insulin receptor. Curr Opin Cell Biol. 2000;12:222-228.
Wiley HS, Shvartsman SY, Lauffenburger DA. Computational modeling of the EGF-receptor system: A paradigm for systems biology. Trends Cell Biol. 2003;13:43-50.