CHAPTER 31 Hemostasis
Principles of investigation
Introduction
Hemostatic tests retain unique features and problems in interpretation. Even coagulation screening tests (the only commonly requested tests that require explicit coreporting of control experiments) are complex bioassays in miniature. An abnormal value can have diametrically opposed meanings for patient care depending on the clinical context. Expressing clinical pretest probability in an intelligible way and using test results to modify this probability is the best way of avoiding potential confusion and error.1
The application of meta-analysis of randomized studies (‘evidence-based medicine’) to diagnostic laboratory testing has been limited,2 and hemostatic testing is no exception. It is therefore not possible yet to claim evidence-based validation, in its strict sense, for many of the principles discussed below. However, the writings of many expert clinician–scientists over the years are the best guide we have to these principles, and should certainly form a starting-point for further analyses.
Physiology of hemostasis applied to diagnosis
To assist this diagnostic thinking, it helps to keep in mind a simplified map of the hemostatic system, whatever knowledge of its complexity one possesses (or not, as the case may be). These simple maps are caricatures: readers are referred to fuller versions3,4 and to other chapters in this volume.
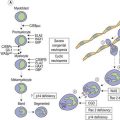
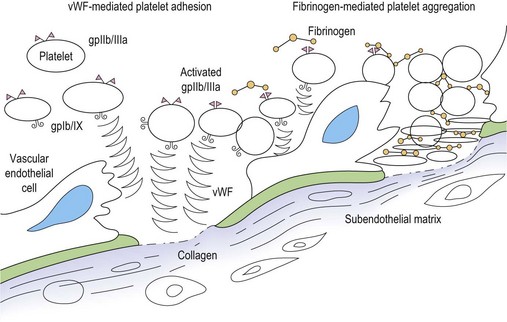
Primary hemostasis: formation of the platelet plug5 (Fig. 31.1)
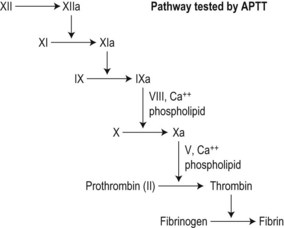
Secondary hemostasis: generation of fibrin clot by the coagulation pathway (Fig. 31.2)
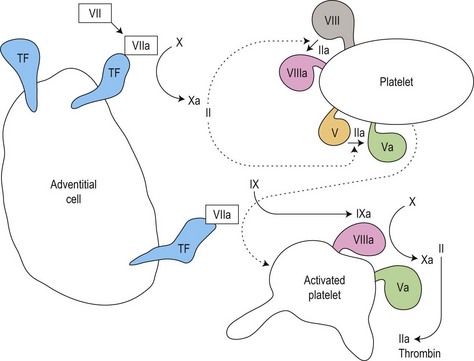
Fig. 31.2 Thrombin generation in vivo: coagulation factor interactions mediated by cell surfaces (schematic).
Clot regulation and removal: the protein C and fibrinolytic pathways
Two further systems regulate and eventually remove the clot (in the context of tissue repair and neoangiogenesis) (also see Chapter 28):
Clot regulation: the protein C system6 and antithrombin
Thrombin activity is restricted to the platelet surface and the fibrin matrix of the clot by a conformation-dependent inhibitor, antithrombin (AT)7 that inactivates fluid-phase thrombin. To work efficiently, AT must bind to heparin-like proteoglycans on healthy endothelial cells.
Fibrinolysis: the plasmin system8
Clots contain the seeds of their own destruction in the form of a clot-bound protein, plasminogen. This is cleaved by tissue plasminogen activator (tPA) secreted by healthy vascular endothelial cells, or urokinase on the surface of macrophages, to the fibrinolytic enzyme plasmin. Plasmin cleaves fibrin into fibrin degradation products, notably the D-dimer fragment specific to cleavage of cross-linked fibrin.9 This removes the clot, and activates matrix metalloproteinases that initiate remodeling of vessels (angiogenesis).
The clinical approach to the patient with a possible hemostatic disorder
Experts writing about the investigation of possible bleeding disorders unanimously stress the importance of a carefully taken history.10–12 They also recommend specific questions, answers to which alter the pretest probability of a bleeding disorder. The discussion below draws on this consensus. Similarly, key findings on clinical examination may aid the diagnostic process, although they are less frequent than narrative clues.
It must be conceded that these narrative and clinical signs have not been formally tested, either singly or in clusters, for their relative value in predicting the presence of hemostatic disorders. Such testing has refined and simplified the use of clinical clues in other contexts,13 and may be of future benefit in hemostasis. Until such clarification becomes available, the shared insight of experienced clinicians is our best guide.
Key questions
Surgical challenges
Dental surgery
Surgical trauma to the incompressible tooth socket sitting in the fibrinolytic milieu of the oral cavity is a stiff challenge to the hemostatic system. Useful questions about the effect of extractions focus on the duration of bleeding and the actions compelled by it. Compare the two accounts in Box 31.1. The second account gives a much clearer indication of excessive blood loss. Most people (in the UK, at least) are disinclined to make an early return to the dentist without a pressing reason.
Bruising
A patient complaining of easy bruising who cannot show a single bruise at the time of the consultation, or one who agrees that there are fewer days with bruises than days without,11 is less likely to have a bleeding disorder. Thrombocytopenic purpura crop around the ankles, where venous pressure is highest, and are more likely to be perceived as ‘a rash’ than as bruises.
Drug history
A full list of all prescribed or over-the-counter medication (including herbal and other complementary medicines) taken by the individual should be compiled. Aspirin remains the most prevalent agent causing bleeding symptoms and abnormal platelet function test results: in addition to being prescribed widely for its antithrombotic effect, it is a component of many preparations on sale to the public. Some of these preparations have names that advertize the presence of aspirin (e.g. Aspro®) while others (e.g. Nurse Sykes’ Powders®) do not: a full list of such products is given in the British National Formulary.14 Other non-steroidal anti-inflammatory agents share the aspirin effect. Antibiotics, major tranquillizers and antidepressive agents may all be associated with bleeding via antiplatelet function effects. Platelet function testing should be performed first with the patient taking the drug, then 2 weeks after stopping, in order to demonstrate its effect.
Clinical examination
Musculoskeletal system
Joints should be examined for warmth, effusion, synovitis, reduced range of movement and misalignment. Muscle groups should be examined for wasting and contractures. These signs of cumulative damage due to hemarthrosis and intramuscular hematomas are characteristic of the hemophilias, but are also seen in rare disorders such as type 3 von Willebrand disease (vWD), deficiency or severe recessive disorders such as homozygous factor XIII, factor VII or factor X deficiency. Intramedullary hemorrhage of the long bones is a feature of afibrinogenemia and α2-antiplasmin deficiency, both very rare: it mimics lytic bone disease.15
On defining the pretest probability of a bleeding disorder
Using information from the history and examination the clinician can work out a broad pretest probability (e.g. low, moderate or high) that the patient has a clinical bleeding disorder. The accuracy and precision of the history and examination described above in defining this pretest probability have not been tested by methods that have provided such information in other contexts.13 Such studies are feasible and desirable in bleeding disorders, but even in their absence, a rational estimate of pretest probability is a crucial step towards interpreting the results of laboratory testing. Without it, tests of hemostasis can be frankly misleading.
Laboratory investigation of hemostasis
Tests of primary hemostasis
Screening tests
The platelet count
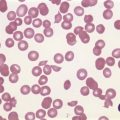
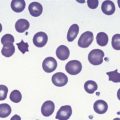
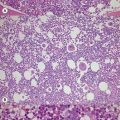
The validity of the platelet count accordingly depends on instrument standardization, calibration and quality control: details of these procedures can be found elsewhere.15 Because instruments count particles by size, blast cell fragments (in acute leukemia) or schistocytic red cells (in thrombotic thrombocytopenic purpura) may lead to overestimation, and large platelets (in immune thrombocytopenia or myelofibrosis) to underestimation, of the true platelet count.
Normal and abnormal platelet counts. The normal (‘Gaussian’) reference range for the concentration of platelets in venous blood (’the platelet count’) is 150–400 × 109/l. By definition, 5% of normal individuals have platelet counts outside this range. To regard and investigate asymptomatic individuals with isolated, stable, mild thrombocytopenia (100–150 × 109/l) as if they had a disease may be to confound ‘Gaussian’ and ‘diagnostic’ concepts of normality.1 However, evidence to justify abandoning this seemingly unproductive practice is lacking.
Platelet function testing
If a history of excess bleeding suggests a defect in primary hemostasis but the platelet count is normal, or insufficiently reduced to account for it (>100 × 109/l), tests of platelet function are indicated. Recent technological developments have changed the range and sequence of tests applied for this purpose. It is logical first to perform ‘global’ tests of platelet function: skin bleeding time and whole blood platelet function analysis. If either or both give results consistent with abnormal platelet function, further definition of the defect by platelet aggregometry and other tests should be attempted. The limited sensitivity of these methods, and the myriad defects that can occur in the platelet’s parallel activation, transduction and secretion systems,16 often mean that no definitive diagnosis can be made outside a research laboratory. A degree of diagnostic uncertainty is tolerable, however, because therapeutic modalities for disorders of primary hemostasis tend to be broadly applicable across them all.
Whole blood platelet function analysis. Many workers have attempted to develop devices that mimic (and therefore test) the linked phases of platelet adhesion and aggregation in uncentrifuged whole blood.17 Recent automated devices appear to accomplish this in a valid and reproducible way. By eliminating the need to prepare platelet-rich plasma, they reduce both sample volume and the time needed to do the test. These methods appear to be more sensitive to subtle platelet function defects, possibly because they eliminate ex vivo platelet activation during centrifugation.
The most widely used device is the PFA-100® (Dade-Behring)18 which draws a citrated blood sample through paired filters impregnated with platelet agonists and measures the time taken by resulting platelet aggregates to occlude them, providing two numerical end-points. One filter contains collagen and adenosine diphosphate (ADP): occlusion of this (at the high shear rate achieved by the device) is dependent on vWF–platelet gpIb/IX interaction and therefore the vWF content of the blood sample. The second filter combines collagen with epinephrine, and the rate of occlusion tests platelet granule function and signal transduction. Occlusion of the collagen/epinephrine filter is also very sensitive to the effect of aspirin and other antiplatelet agents. Use of this device is now widespread in laboratories testing for vWD and platelet function disorders. PFA-100 analysis, where available, is also tending to replace the skin bleeding time for evaluating the response of primary bleeding disorders to therapy with desmopressin, sources of vWF, or platelet concentrates.18
The skin bleeding time (SBT)
Previously a major criterion for the diagnosis of defects in primary hemostasis, prolongation of the skin bleeding time (even in its most reliable form, the Ivy template method) lost some of this status after being shown to lack sensitivity, reproducibility and operator-independence19 in general use. In expert hands it can still produce useful evidence in equivocal cases,11 and it remains part of the constellation of tests helpful in the diagnosis of vWD, although PFA-100 analysis is probably more sensitive.18
Diagnostic tests
Classical platelet aggregometry
This elegant but demanding technique was introduced by Born.20 Platelet-rich plasma (PRP) prepared by centrifugation of citrated blood is subsampled into warmed plastic cuvettes, stirred, and exposed to platelet agonists in doses that provoke aggregation of normal platelets. Consequent aggregation (or the lack of it) is detected by increasing light transmission through the cuvette, the time-course and extent of which are recorded on paper in the form of a curve. Interpretation combines inspection of the shape of this curve with a value for % aggregation, 100% being taken as the difference in light transmission between stirred PRP and buffer solution (‘blank’).
Coagulation tests
Coagulation screening tests
Prothrombin time (PT) and the international normalized ratio
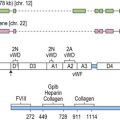
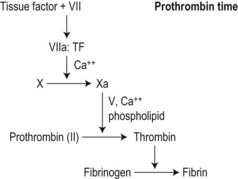
As invented by Quick,21 a source of tissue factor (’thromboplastin’: an aqueous extract of mammalian brain or, increasingly, a recombinant version)22 is added to citrated test plasma at 37°C and the mixture recalcified. Maximal stimulation of the clot initiation (‘extrinsic’) pathway results in clot formation in 12–15 s.
The PT depends on: 1) concentrations and activity of coagulation factors VII, X, V, II and fibrinogen in the test plasma; and 2) the sensitivity of the chosen thromboplastin to these activities and their inhibition. The PT is more sensitive to early-acting factors, particularly FVII, than to FII and fibrinogen (Fig. 31.3).
The PT is reported as a time (the control time coreported) or, increasingly, as a ratio (PT test plasma: PT normal plasma). Ratios obtained with different thromboplastins are transformed (‘normalized’) by the international sensitivity index (ISI) assigned to the test thromboplastin to correct for its sensitivity to factors VII, X and II by comparing its performance to that of an international reference thromboplastin.23 The transformed ratio is reported as the international normalized ratio (INR):
where MNPT = the geometric mean PT of the population (in practice, 20 normal plasma samples).
Interactions between thromboplastins and automated coagulometers performing the PT introduce more complexity. A large laboratory should not only determine its own reference range for the INR/PTDr, but also the ‘system ISI’ of its coagulometer/thromboplastin combination(s).24
INR >1.2 indicates a defect in the TF/VII clot initiation pathway to thrombin. This could be due to deficiency or inhibition (anticoagulant or antibody) of any or all of factors VII, X, V, II, or fibrinogen (if <1 g/l) (Box 31.2). Coumarin therapy rapidly reduces FVII levels and the INR is sensitive to FVII. The INR is therefore used to monitor coumarin therapy (therapeutic range 2–4).
Activated partial thromboplastin time (APTT)
This mini-assay of the clot amplification (‘intrinsic’) pathway was introduced by Langdell et al.25 A phospholipid reagent that mimics the activated platelet surface (i.e. rich in PS,26 although to supraphysiologic levels)27 is incubated with test plasma at 37°C. Erratic contact activation is over-ridden by adding a strong activator such as kaolin, and the mixture recalcified. Sequential reactions provoked by contact activation in the presence of PS result in clot formation in 30–40 s.
This end-point depends on: 1) the concentrations and activities of contact factors prekallikrein, high-molecular-weight kininogen (HMWK) and factor XII; 2) the concentrations and activities of coagulation factors XI, IX, VIII, X, V, II and fibrinogen; and 3) the sensitivity of the whole test system to these activities and their inhibition. The APTT is more sensitive to contact and early-acting coagulation factors than to prothrombin and fibrinogen (Fig. 31.4). Elevated acute-phase proteins (factor VIII and fibrinogen) shorten the APTT and may obscure the effect of mild deficiencies and inhibitors in pregnancy and sepsis.
APTT correction tests
‘Correction’ has been defined as the APTT of the mixture ‘being near to that of normal’28 but using current reagents, most authors imply that correction of the APTT in a 50 : 50 mix means ‘to normal’12,29,30 (i.e. APTTr <1.2). As with all coagulation tests, local criteria based on the performance of reagents and coagulometers and the experience of expert laboratory staff should be determined and applied. Since full, partial or absent correction (i.e. all possible results of the test) will all lead to more sensitive assays of coagulation factors and inhibitors, correction tests only indicate where to start.
If the clinical situation and/or screening tests suggest a possible factor VIII inhibitor, a modified method reflects inhibitor kinetics and identifies mild but clinically significant inhibitors. Unlike phospholipid-dependent antibodies, allo- and autoimmune anti-FVIII antibodies may need incubation with the target proteins for up to 2 h at 37°C to inhibit them. Extended incubation of the mixture therefore avoids illusory correction of a slow-acting inhibitor. An extra control (test and normal plasmas incubated separately and mixed just before testing) corrects for loss of factor VIII activity due to incubation alone.31
Classic mixing experiments
Correction studies employing absorbed plasma reagents, aged serum, or plasmas from patients with severe deficiencies, are popular thought experiments in practical examinations in hematology. Laboratories that have the time, staff and expertise to prepare, store, and maintain stringent quality control of a library of such reagents still find their differential correction of patient APTT a rapid route to specific diagnosis.11 However, these requirements, and incompatibility with the automated coagulometers used to confirm the specific diagnosis of coagulation factor deficiencies, mean that they are no longer part of current routine practice. In any event, findings in classic mixing experiments must always be confirmed by specific factor assays.
Diagnostically misleading APTT prolongation
APTT sensitivity extends to components of the test plasma that are clinically irrelevant (prekallikrein, HMWK and factor XII) and the frequent contamination of coagulation samples with heparin from intravenous lines. The APTT is therefore prone to diagnostic false positives when used as an indiscriminate screening test in hospital practice, potentially causing delay and cost while the cause of a long APTT is tracked down. For these reasons, and its sensitivity both to states causing severe bleeding (hemophilia) and dangerous thrombosis (lupus anticoagulant), the APTT can only be interpreted in the light of the clinical history (Box 31.3).
Thrombin time (TT)
This simple test (Fig. 31.5) adds thrombin to test plasma and times the resulting clot end-point. TT is expressed in seconds and compared to a normal control range (e.g. TT 15 s, control = 11 s). An abnormal TT (>15 s) is due to: 1) deficiency of fibrinogen; 2) an inhibitor capable of inhibiting exogenous thrombin (e.g. heparin, hirudin); or 3) inhibition of fibrinogen polymerization due to an abnormal fibrinogen molecule (dysfibrinogenemia) or interfering substances (fibrin/fibrinogen degradation products, paraproteins) (Box 31.4). Some laboratories add calcium to the thrombin solution used in the TT to narrow the normal range and improve reproducibility, but this entails a loss of sensitivity to dysfibrinogens and is not recommended.

Fibrinogen assay
Measuring the concentration of fibrinogen in plasma can be regarded as an extension of the initial coagulation screen: the PT and APTT are relatively insensitive to moderate hypofibrinogenemia and a prolonged TT requires explanation if heparin contamination has been excluded by a reptilase time. The most reliable method for the automated routine laboratory is the Clauss method,32 a parallel-line bioassay based on the TT performed on serial dilutions of patient plasma and control. Fibrinogen estimates ‘derived’ from automated PT or APTT analysis can be misleading in the very states (e.g. DIC) in which fibrinogen assay is most useful, and are not recommended.
Fibrin–fibrinogen degradation products (FDPs) and D-dimer assay
Recently developed assays employ monoclonal antibodies that recognize the D-dimer fragment produced by plasmin digestion of cross-linked fibrin (i.e. thrombus).11 The increased sensitivity and specificity of this assay allows detection of the relatively low levels of D-dimer circulating in the presence of deep vein thrombosis and pulmonary embolism (venous thromboembolic disease, VTED). D-dimer assay combined with the pretest probability estimate derived from a clinical scoring system is useful in the diagnosis of VTED.33 Since the D-dimer assay retains sensitivity to DIC and uses the citrated coagulation screen sample it has largely replaced older polyspecific assays for serum FDP.
Logical use of the coagulation screen
Combining the results of the PT, APTT and TT tests, and using them as a logical ‘circuit tester’ (see Fig. 31.6) maximizes the information provided by the coagulation screen, particularly when considered with the platelet count. The logic of the coagulation screen combined with platelet testing has been expressed in algorithmic form34 and as a web-based interactive computer program,35 but is probably straightforward enough to keep in one’s head.
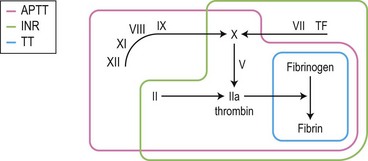
For example, if the APTT ratio is increased and corrects to normal with 50 : 50 normal plasma, but the INR, TT and platelet count are normal, the probable deficiency is restricted to one of the factors tested only by the APTT: FXII, FXI, FIX or FVIII. The exact deficiency is determined by specific assays of single factors, starting with a factor VIII assay because this is the commonest cause of severe hemophilia (see Box 31.5).
Box 31.5 Logical use of the clotting screen and pretest probability
APTTr ↑ (1.9) corrects with 50 : 50 normal plasma.
Result: FVIII:C = 190 IU/dl (normal 50–150 IU/dl)
A single gene lesion typically reduces the function of a single coagulation factor, and therefore usually prolongs a single coagulation screen test. Exceptions to this rule of thumb are, in the first case, genetic disorders causing combined factor deficiencies (e.g. FV + FVIII deficiency),36 and in the second case, severe FX, FV, prothrombin or fibrinogen deficiencies; these are all rarities.
Disorders of hemostasis that may not affect screening tests
Mild but clinically significant deficiencies of coagulation factors. Depending on reagent/coagulometer system sensitivities, mild deficiencies (i.e. factor levels 10–40 IU/dl) may not be detected by the APTT. When normal coagulation screening tests and platelet function are found in the context of a high pretest likelihood of a clinical bleeding disorder, exclusion of factor VIII, factor IX and factor XI deficiencies finally depends on specific assays (see Box 31.6).
Diagnostic coagulation tests
Functional bioassays
The manual method plots clotting times on the vertical axis against dilution on the horizontal axis, using logarithmic graph paper. This results in two ‘curves’ (which should form parallel straight lines) – a standard curve and an unknown (patient) curve. From the standard curve, a horizontal line (‘of equal potency’) is drawn to where it intercepts the unknown curve: a vertical line dropped to the horizontal axis from this point marks the potency of the patient plasma relative to the standard. Full descriptions of this method, including the requirements for parallelism on which its validity rests, can be found elsewhere.37–39
Even when controlled and standardized, it remains a bioassay with irreducible limits on precision and reproducibility. A single assay can only be relied upon to give an answer within 20% of the ‘true’ value (the idealized mean value of an infinite number of tests). This is one basis (the other being the variation of plasma FVIII levels in individuals) of the common rule that at least three assays (reducing the error to ± 10%) are required to define the severity of hemophilia. To reduce the error to ± 2.5% would theoretically require 64 assays.37 These sources of within-laboratory error are compounded by inter-laboratory variance, which in external quality control exercises can give a CV (coefficient of variation) of 30–50%.40
Chromogenic assays. Rather than using a clotting end-point in a two-stage assay as above, the availability of synthetic amidolytic substrates sensitive to factor Xa enable the use of a color reaction detectable and quantifiable by spectrophotometry. This chromogenic method has been adapted to measure several hemostatic enzymes and their inhibitors, and is highly compatible with automation.41 One theoretical advantage of the chromogenic method is that it directly measures the first product (FXa) of the FVIII/FIX interaction, rather than requiring the participation of several other factors in the production of a clotting end-point. This increases the precision and reproducibility of the assay. In addition, lack of dependence on phospholipid reagents makes the chromogenic method more reliable in the assay of therapeutic concentrates, both in the vial and in the patient.27
Immunoassays
The ability to stick purified monoclonal antibodies to plastic or latex surfaces, together with ubiquitous chromogenic reactions derived from the alkaline phosphatase/anti-alkaline phosphatase (APAAP) method, have transformed immunoassay technology. Enzyme-linked immunosorption assay (ELISA) and recent latex agglutination assays are rapidly supplanting the older radiometric and immunoelectrophoretic methods (e.g. Laurell electroimmunoassay).42 Such immunoassays are most often used in the diagnosis of vWD and thrombophilia.
The problem of testing the fibrinolytic system
The fibrinolytic system is of vital importance to the organism, and scientific investigation and exploitation of its components has led to important therapeutic agents with major impact in common life-threatening thrombotic disorders. None the less, it remains the ‘Cinderella’ of hemostatic testing.43 Partly, this is due to the evanescent nature of most clinical disturbances of fibrinolysis. Compared to chronic disorders of coagulation, the fibrinolytic system rarely ‘sits still’ for long enough to study it. In addition, a fibrinolytic equivalent to the coagulation screen does not really exist: the euglobulin clot lysis time (ECLT) is insensitive and poorly reproducible. Immunoassays of key fibrinolytic enzymes and inhibitors are available, but interpreting their results in thrombotic syndromes is difficult and currently unproductive.43 In acute clinical situations fibrinogen and D-dimer assays will give clues to the presence of hyperfibrinolysis. α2-Antiplasmin deficiency, the only well-documented inherited bleeding disorder attributed to chronic excess plasmin activity, does not declare itself in any screening test: clinical suspicion should lead to measurement of α2-antiplasmin by ELISA.44
Calibrated automated thrombin generation measurement
In the calibrated automated thrombin (CAT) assay, a fluorogenic thrombin substrate is incubated with test plasma and coagulation is activated by tissue factor. After recalcification, a computer converts automated continuous measurements of fluorescence into a quantitative dynamic profile of thrombin generation (Fig. 31.7).
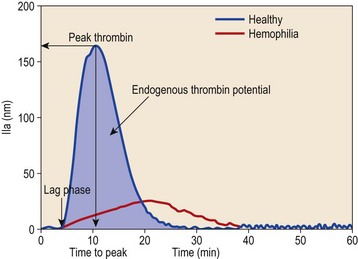
Interpretation and clinical feasibility
Three informative variables can be measured from the thrombin generation curve: lag time, time to peak thrombin and endogenous thrombin potential (Fig. 31.7). The course of thrombin generation comprises an initiation phase before the first thrombin is detected (the lag time), and an amplification phase during which the maximum rate of thrombin generation occurs.
Whole blood thromboelastometry
Thrombelastography (TEG®) and thromboelastometry (ROTEM®) provide a visualization of continuous viscoelastic changes occurring during whole blood clot formation. Both devices consist of a cup into which the sample (whole blood, platelet-rich or -poor plasma) and reagents are placed and a pin which sits in the centre of the cup when the device is running. Reduced movement of the pin during clot formation is registered with specialized computer software and visualized on a computer providing a coagulation signal similar to that of traditional thrombelastography (Fig. 31.8A).
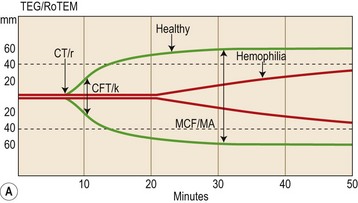
Interpretation and clinical feasibility
Traditional thrombelastographic parameters include clotting time (r, CT), clot formation time (k, CFT), and maximal clot formation (MA, MCF) as depicted in Fig. 31.8. Thromboelastometry also assesses clot strength and fibrinolysis levels of MA/MCF (Fig. 31.8).
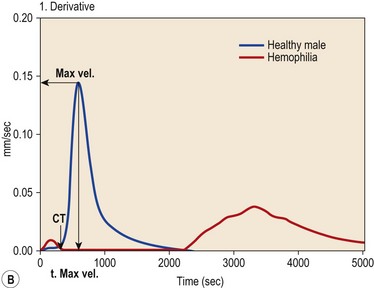
The digital raw signal from the TEG or ROTEM analyzers can be differentiated to velocity profiles of whole blood clot formation and dynamic coagulation parameters illustrating the propagation phase of clotting can be derived (Fig. 31.8B) such as the maximum velocity (MaxVel) of clot formation and the time until the occurrence of the maximum value (t, MaxVel).
Minimizing error in hemostatic testing, interpretation and process
Test reagents and calibration: the hierarchy of standards. Bioassays impose a requirement for reference materials, including thromboplastin reagents, assay standards40 and drugs. Plasma or concentrate standards are freeze-dried aliquots of plasma or concentrate with a certified content of the factor in question. These secondary standards are in turn assayed (calibrated) against primary International Standard materials held by national biological standards agencies such as the National Institute for Biological Standards and Controls in the UK, and ultimately the World Health Organization and other international bodies.45 Tracing a calibration trail through this hierarchy of standards ensures that results obtained in different laboratories and in different countries are comparable.
Maximizing the clinical utility of hemostatic testing
Combining test results with clinical scoring systems. Clinical scoring systems can be used to refine the crude pretest probability estimate described above. The most striking example of this in current practice is the combination of a simple but validated clinical risk assessment with laboratory measurement of the D-dimer concentration in a blood sample. The predictive power of this combination allows secure diagnosis and treatment of venous thromboembolic disease.33 It is likely that similar combinations of clinical and laboratory methods would be valuable in other contexts. Validated clinical decision rules have great potential value in medicine,1 and hemostatic testing stands to gain considerable value by inclusion in similar models.
1 Sackett DL, Straus SE, Richardson WS, et al. Diagnosis and screening. In: Sackett DL, Straus SE, Richardson WS, et al, editors. Evidence-Based Medicine. 2nd ed. Edinburgh: Churchill Livingstone; 2000:67-93.
2 Deeks JJ. Systematic reviews of evaluations of diagnostic and screening tests. British Medical Journal. 2001;323:157-162.
3 Mann KG. Biochemistry and physiology of blood coagulation. Thrombosis and Haemostasis. 1999;82(2):165-174.
4 Hoffman M, Monroe DM. A cell-based model of haemostasis. Thrombosis and Haemostasis. 2001;85:958-965.
5 Ruggeri ZM. Mechanisms initiating platelet thrombus formation. Thrombosis and Haemostasis. 1997;78(1):611-616.
6 Esmon CT. Protein C, protein S, and thrombomodulin. In: Colman RW, Hirsh J, Marder VJ, et al, editors. Hemostasis and Thrombosis: Basic Principles and Clinical Practice. 4th ed. Philadelphia: Lippincott Williams & Wilkins; 2001:335-353.
7 Carrell RW, Huntington JA, Mushunje A, Zhou A. The conformational basis of thrombosis. Thrombosis and Haemostasis. 2001;86:14-22.
8 Bachmann F. Plasminogen–plasmin enzyme system. In: Colman RW, Hirsh J, Marder VJ, et al, editors. Hemostasis and Thrombosis: Basic Principles and Clinical Practice. 4th ed. Philadelphia: Lippincott Williams & Wilkins; 2001:275-320.
9 Bounameaux H, de Moerloose P, Perrier A, Reber G. Plasma measurement of D-dimer as a diagnostic aid in suspected venous thromboembolism: an overview. Thrombosis and Haemostasis. 1994;71:1-6.
10 Nilsson I-M. Assessment of blood coagulation and general haemostasis. In: Bloom AL, Thomas DP, editors. Haemostasis and Thrombosis. 2nd ed. Edinburgh: Churchill Livingstone; 1987:922-932.
11 Bowie EJW, Owen CA. Clinical and laboratory diagnosis of hemorrhagic disorders. In: Ratnoff OD, Forbes CD, editors. Disorders of Hemostasis. 3rd ed. Philadelphia: WB Saunders; 1996:53-78.
12 Greaves M, Preston FE. Approach to the bleeding patient. In: Colman RW, Hirsh J, Marder VJ, et al, editors. Hemostasis and Thrombosis: Basic Principles and Clinical Practice. 4th ed. Philadelphia: Lippincott Williams & Wilkins; 2001:783-793.
13 Richardson WS, Wilson MC, Guyatt GH, et al. Users’ guides to the medical literature: XV. How to use an article about disease probability for differential diagnosis. Journal of the American Medical Association. 1999;281:1214-1219.
14 Tossetto A, Castaman G, Rodighiero F. Assessing bleeding in von Willebrand disease with bleeding score. Blood Reviews. 2007;21(2):89-97.
14 British National Formulary 42. London: British Medical Association and Royal Pharmaceutical Society of Great Britain, 2001. p. 210
15 Groner W, Simson E. Standardization. In: Groner W, Simson E, editors. Practical Guide to Modern Hematology Analyzers. Chichester: John Wiley; 1995:95-117.
16 Rao AK. Congenital disorders of platelet secretion and signal transduction. In: Colman RW, Hirsh J, Marder VJ, et al, editors. Hemostasis and Thrombosis: Basic Principles and Clinical Practice. 4th ed. Philadelphia: Lippincott Williams & Wilkins; 2001:893-904.
17 Salzman EW. Measurement of platelet adhesiveness: a simple in vitro technique demonstrating an abnormality in von Willebrand’s disease. Journal of Laboratory and Clinical Medicine. 1963;62:724-735.
18 Jilma B. Platelet function analyser (PFA-100): a tool to quantify congenital or acquired platelet dysfunction. Journal of Laboratory and Clinical Medicine. 2001;138:152-163.
19 Rodgers RPC, Leven J. A critical reappraisal of the bleeding time. Seminars in Thrombosis and Hemostasis. 1990;16:1-20.
20 Born GVR, Cross MJ. The aggregation of blood platelets. Journal of Physiology (London). 1963;168:178-195.
21 Quick AJ. The thromboplastin reagent for the determination of prothrombin. Science. 1940;92:113-114.
22 Tripodi A, Arbini A, Chantarangkul V, Mannucci PM. Recombinant tissue factor as a substitute for conventional thromboplastin in the prothrombin time test. Thrombosis and Haemostasis. 1992;67:42-45.
23 WHO Expert Committee on Biological Standardization (1999) Guidelines for thromboplastins and plasma used to control oral anticoagulant therapy. Technical Report Series 889, forty-eighth report, Geneva, Switzerland.
24 Chantarangkul V, Tripodi A, Mannucci PM. The effect of instrumentation on thromboplastin calibration. Thrombosis and Haemostasis. 1992;67:588-589.
25 Langdell RD, Wagner RH, Brinkhous KM. Effect of antihemophilic factor in one-stage clotting tests. A presumptive test for hemophilia and simple one-stage hemophilic factor assay procedure. Journal of Laboratory and Clinical Medicine. 1953;41(4):637-647.
26 Kelsey PR, Stevenson KG, Poller L. The diagnosis of lupus anticoagulants by the activated partial thromboplastin time – the central role of phosphatidyl serine. Thrombosis and Haemostasis. 1984;52:172-175.
27 Mikaelson M, Oswaldson U, Jankowski MA. Measurement of Factor VIII activity of B-domain deleted recombinant Factor VIII. Seminars in Haematology. 2001;38(2) (suppl 4):13-23.
28 Austen DEG, Rhymes IL. Laboratory diagnosis of blood coagulation disorders. In: Biggs R, Rizza CR, editors. Human Blood Coagulation, Haemostasis and Thrombosis. 3rd ed. Oxford: Blackwell Scientific; 1984:175.
29 Giddings JC. The investigation of hereditary coagulation disorders. In: Thompson JM, editor. Blood Coagulation and Haemostasis: A Practical Guide. 2nd ed. Edinburgh: Churchill Livingstone; 1980:48-116.
30 Greaves M, Cohen H, Machin SJ, Mackie I. Guidelines on the investigation and management of the antiphospholipid syndrome. British Journal of Haematology. 2000;109:704-715.
31 Kaspar CK, Ewing NP. Measurement of inhibitor to factor VIIIC (and IXC). In: Bloom AL, editor. The Hemophilias. Edinburgh: Churchill Livingstone; 1982:39-50.
32 Clauss A. Gerrinnungsphysiologische schnellmethode zur bestimmung des fibrinogens. Acta Haematologica. 1957;17:237-246.
33 Wells PS, Anderson DR, Rodger M, et al. Excluding pulmonary embolism at the bedside without diagnostic imaging: management of patients with suspected pulmonary embolism presenting to the emergency department by using a simple clinical model and D-dimer. Annals of Internal Medicine. 2001;135:98-107.
34 Favoloro EJ. Assessment of haemostatic function: follow up evaluation of abnormal screening coagulation tests and possible outcomes. Australian Journal of Medical Science. 1994;15:39-45.
35 Nguyen AND, Uthman MO, Johnson KA. A web-based teaching program for laboratory diagnosis of coagulation disorders. Archives of Pathology and Laboratory Medicine. 2000;124:588-593.
36 Seligsohn U, Zivelin A, Zwang E. Combined factor V and factor VIII deficiency among non-Ashkenazi Jews. New England Journal of Medicine. 1982;307:1191-1195.
37 Rizza CR, Rhymes IL. Coagulation assay of VIIIC and IXC. In: Bloom AL, editor. The Hemophilias. Edinburgh: Churchill Livingstone; 1982:18-38.
38 Barrowcliffe TW, Curtis AD. Principles of bioassay. In: Bloom AL, Thomas DP, editors. Haemostasis and Thrombosis. 2nd ed. Edinburgh: Churchill Livingstone; 1987:996-1004.
39 Mannucci PM, Tripodi A. Factor VIII clotting activity. In: Jespersen J, Bertina RN, Haverkate F, editors. E.C.A.T. Assay Procedures. 2nd ed. London: Kluwer Academic; 1999:107-119.
40 Barrowcliffe TW. Standardization of assays of factor VIII and factor IX. Ricerca in Clinica e in Laboratorio. 1990;20(2):155-165.
41 Hutton L. Chromogenic substrates in haemostasis. Blood Reviews. 1987;1:201-206.
42 Giddings JC. Immunoanalysis of haemostatic components. In: Bloom AL, Thomas DP, editors. Haemostasis and Thrombosis. 2nd ed. Edinburgh: Churchill Livingstone; 1987:982-995.
43 Bauer KA. Conventional fibrinolytic assays for the evaluation of patients with venous thrombosis: don’t bother. Thrombosis and Haemostasis. 2001;85:377-378.
44 Favier R, Aoki N, de Moerloose P. Congenital α2-antiplasmin deficiencies: a review. British Journal of Haematology. 2001;114:4-10.
45 Hubbard AR, Rigsby P, Barrowcliffe TW. Standardization of factor VIII and von Willebrand factor in plasma: callibration of the 4th International Standard (97/586). Thrombosis and Haemostasis. 2001;85(4):634-638.