[level-membership-for-neonatal-and-perinatal-medicine-category]Chapter 9
Fluid, Electrolyte, Acid–Base, and Renal-Developmental Physiology and Disorders
During fetal life the placenta is responsible for fetal water and electrolyte homeostasis. The principal function of the fetal kidney is the continuous excretion of water and electrolytes into the amniotic cavity, which is essential for maintenance of amniotic fluid volume. Normal amniotic fluid volume is essential for normal lung development. After birth the kidneys assume responsibility for maintenance of appropriate total body water and electrolyte homeostasis ( Fig. 9-1).
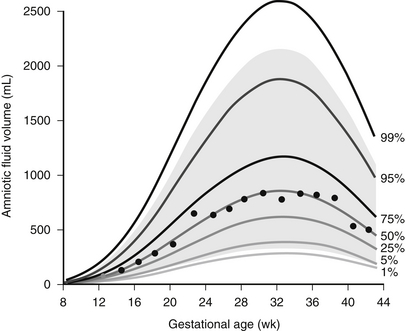
Figure 9-1 Normal range of amniotic fluid volume in human gestation. (From Brace RA, Wolf EJ. Normal amniotic fluid volume changes throughout pregnancy. Am J Obstet Gynecol 1989;161:382–8.)
Urine is made by the fetus in increasing amounts as gestation advances. In fact, fetal urine output is quite high—in the range of 25% of body weight per day, approximately 750 to 1000 mL per day near term. Fetal urine, along with pulmonary secretions, is an important contributor to amniotic fluid. The process is dynamic, with amniotic fluid being produced continuously, then swallowed and reabsorbed from the gastrointestinal tract ( Fig. 9-2). Fetal oliguria may produce oligohydramnios. Obstruction in the gastrointestinal tract or neurologic impairment of swallowing may result in polyhydramnios.
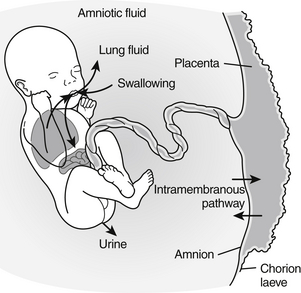
Figure 9-2 Circulation between the fetus and amniotic fluid (AF). The major sources of AF water are fetal urine and lung liquid; the routes of absorption are through fetal swallowing and intramembranous flow. (From Beall MH, van den Wijingarrd JPHM, van Germert M, et al. Placenta and fetal water flux. In: Oh W, Guignard J-P, Baumgart S, editors: Nephrology and fluid/electrolyte physiology: neonatology questions and controversies. 2nd ed. Philadelphia: Saunders; 2012. p 6.)
By 22 weeks’ gestation 95% of fetal kidneys are detectable.
Fetal GFR slowly increases during fetal life until approximately 36 weeks, when nephrogenesis is complete. Thereafter little increase occurs until birth, at which time there is a dramatic increase in GFR. The increase in GFR with birth is less dramatic in preterm infants ( Fig. 9-3).
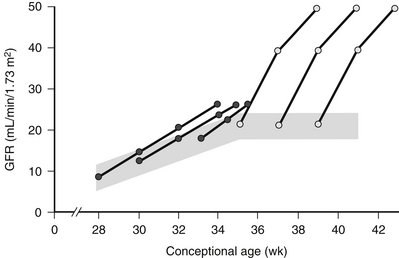
Figure 9-3 Development of glomerular filtration rate (GFR) as a function of conceptional age during the last 3 months of gestation and the first month of postnatal life. The shaded area represents the range of normal values. The postnatal increase in GFR observed in preterm ( ) and term neonates (
 ) is schematically represented. (Modified from Guignard JP, John EG. Renal function in the tiny, premature infant. Clin Perinatol 1986;13:377.)
8. What are the factors that cause the postnatal increase in GFR?


The answer to this question is complicated. In fact, it is the change in serum [Cr]—not a single value—after birth that is relevant. At birth serum [Cr] is largely a function of maternal serum [Cr]. The subsequent change varies with gestational age. In infants younger than 30 weeks’ gestation, serum [Cr] either does not change or it increases 30% to 40% before declining to the birth level during the first 5 to 8 days of age, then subsequently declines before reaching a steady state by 7 to 10 weeks of age. The duration of the plateau is inversely related to gestational age; the rate of decline is directly related to gestational age. In infants at 30 weeks’ gestation or older, serum [Cr] declines from birth to reach a steady value at 3 to 6 weeks of age. The rate of decline is directly related to gestational age.
12. What are the important differences in the regulation of sodium ion (Na+) and potassium ion (K+) balance?


Potassium uptake by cells is stimulated by the following:


Potassium movement from the intracellular to extracellular space is stimulated by the following:


 Their proximal tubular capacity for sodium reabsorption is limited.
 Their distal tubular response to aldosterone is diminished ( Fig. 9-4).
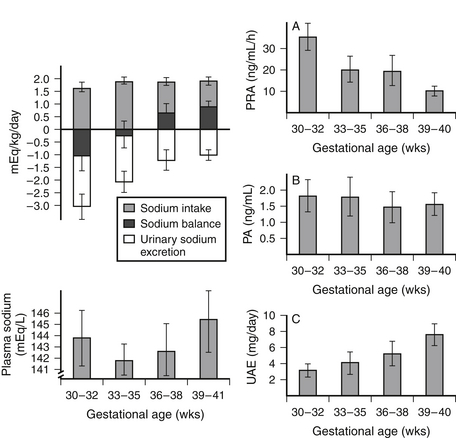
Figure 9-4 Sodium balance and the activity of the renin-angiotensin-aldosterone system in 1-week-old newborn infants with gestational ages of 30 to 41 weeks. PA, Plasma aldosterone concentration; PRA, plasma renin activity; UAE, urinary aldosterone excretion. (From Sulyok E, Németh M, Tényi J, et al. Relationship between maturity, electrolyte balance and the function of the renin-angiotension-aldosterone system in newborn infants. Biol Neonate 1979;35:60–5.)
15. If preterm infants have a limited capacity to conserve sodium, is their ability to excrete a sodium load enhanced?
No. Their ability to excrete a sodium load is limited by their low GFR.
16. How does the concentrating capacity of the preterm and term infant compare to that of the adult?
Concentrating ability is limited in infants for several reasons. Protein intake by the infant is used to make new cells during this period of rapid growth, and relatively little nitrogen is diverted to urea. Urea is an important component of the tonicity of the medullary interstitium and the osmolality of urine. Additional factors include (1) the relatively short loops of Henle in the neonatal nephrons that limit the surface area available for equilibration with the interstitium and (2) a high level of prostaglandins that can increase medullary blood flow and “wash out” the medullary concentration gradient. The maximum urine concentration in the preterm infant is approximately 600 mOsm/L, in the full term infant is 800 mOsm/L, and in the adult is 1500 mOsm/L.
17. Preterm infants have a limited capacity to excrete a free water load. Is this because they cannot dilute their urine as much as full-term infants?
 A relative paucity of K+ channels in the apical membrane of principal cells in the distal nephron
 Lower flow delivery to the distal tubule as the result of lower GFR

Fluid and Electrolyte Management
Ninety-seven percent of infants pass urine in the first 24 hours of life and 100% by 48 hours. During the first 2 days of life, infants urinate two to six times per day ( Table 9-2).
TABLE 9-2
TIME OF FIRST VOID IN 500 INFANTS ∗
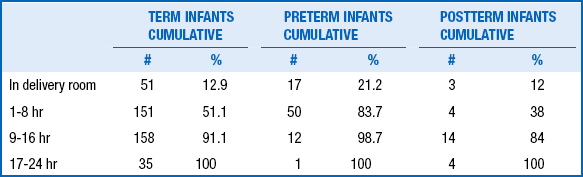
∗In 395 term infants, 80 preterm infants, and 25 postterm infants.
Adapted from Clark DA. Time of first void and first stool in 500 newborns. Pediatrics 1977;60:457.
21. Why is the reduction in ECW volume in preterm infants considered physiologic?


22. Which should be used, birth weight or daily weight, to calculate water and sodium requirements during the first week of life?
The clinician should use what the attending physician requests. After the first day of life, however, it is important to understand that it is the absolute fluid and electrolyte intake (milliliters or millimoles per day) relative to that in the previous 8 to 24 hours that is relevant. In other words, should the absolute fluid or electrolyte intake be more or less than it was previously? The answer depends on what fluid and electrolyte balances resulted from the previous intakes and on what water and electrolyte losses are anticipated. There is no magic amount of water per kg/day that is appropriate for all infants, even infants at the same weight, gestational age, postnatal age, and in the same environment. If the infant loses more water (and therefore weight) than you judge to be appropriate and you anticipate that water losses will remain approximately the same, the absolute amount of water (milliliters per day) given should be increased. However, if the current weight is used to calculate fluid requirements, the absolute amount of water administered may be only slightly more or even less than the amount given the day before. For example, an 860-g infant loses 110 g (approximately 13% of birth weight) in the first day of life after receiving 100 mL/kg/day (86 mL/day). You decide this rate of weight loss is too great and increase water intake by 20% to 120 mL/kg/day. Based on the current weight of 750 gm, however, this is only 90 mL/day, which is barely more than that given the previous day. If water losses remain the same, weight loss will be only slightly less over the next 24 hours despite an increase in water intake per kilogram current body weight.
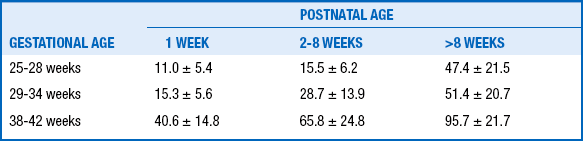
The most important determinants of IWL are gestational age, postnatal age, antenatal steroids, and environment. IWL decreases with increasing gestational and postnatal age ( Fig. 9-5), exposure to antenatal steroids, and increasing ambient humidity.
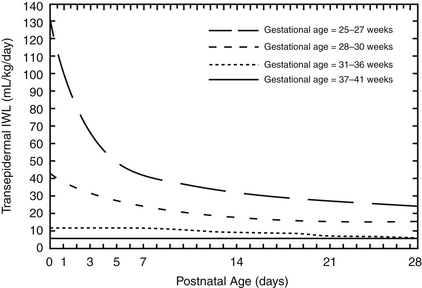
Figure 9-5 Transdermal loss as a function of gestational and postnatal age in naked, appropriate-for-gestational-age infants in a neutral thermal environment in incubators with 50% ambient humidity. (From Hammarlund K, Sedin G, Strömberg B. Transepidermal water loss in newborn infants. Part VIII: relation to gestational and post-natal age in appropriate and small-for-gestational-age infants. Acta Pediatr Scand 1983;72:721–8.)
24. Why is accurate estimation of IWL so important in estimating fluid administration rate in preterms?


26. Once the fluid administration rate is determined, how can the dextrose concentration necessary to provide a target dextrose administration rate be calculated?

27. Is there a simple way to calculate the dextrose administration rate that will be provided with a given dextrose concentration and administration rate of the intravenous fluid?

28. The specimen used for bedside glucose measurement by point of care (POC) analyzers is whole blood. Is it necessary to “correct” the glucose concentration determined with point of care analyzers to reflect the plasma concentration?
The main route of potassium loss is in the urine. Urine potassium losses are low initially because GFR and urine output are relatively low after birth. Moreover, serum potassium concentration ([K+]) may rise in extremely premature infants even in the absence of exogenous potassium. Therefore potassium should be withheld until it can be ascertained that renal function is normal and, in extremely premature babies, the serum [K+] is normal and not increasing.
31. Baby R is a 22-hour-old, 25-weeks’-gestation male infant in a humidified incubator. He has received 150 mL/kg/day of fluid during the first day of life. Serum sodium concentration ([Na]) is 128 mmol/L. Should sodium intake be increased?
Not necessarily. Serum [Na] is the concentration, not the amount, of sodium in the ECF space. If it is abnormally low, the amount of sodium in the ECF space is “insufficient” for the amount of water in the ECF space. Thus serum [Na] may be low because there is too little extracellular sodium, too much ECW, or both. The most common cause of hyponatremia in neonates in the first 1 or 2 days of life is excessive fluid administration. In such situations free water intake should be restricted. 789101112131415161718192021222324252627282930313233343536
 KEY POINTS: FLUIDS AND ELECTROLYTES
1. Like the lung, the premature renal function is immature; there is a diminished capacity to excrete a free water load, to maintain plasma electrolyte homeostasis, to acidify the urine, and to concentrate the urine.
2. All premature neonates lose weight after birth. This results from a physiologic postnatal decrease in ECW volume. However, when more than 10% to 15% of body weight is lost in the first week of life, the possible pathophysiologic process should be considered and investigated.
3. Sodium and potassium should not usually be given on the first day of life, but glucose is necessary. Preterm infants may also require calcium.
Nonoliguric Hyperkalemia in Premature Infants
Hyperkalemia is caused by perturbations in internal or external K+ balance:

 Positive external K+ balance caused by either impaired renal potassium excretion or (less commonly) excessive intake. Increased K+ intake of a magnitude sufficiently severe to cause hyperkalemia is usually the result of a dosing error.
When originally reported in the literature in the early 1980s, the prevalence of nonoliguric hyperkalemia ranged from 25% to 50% of infants below 1000 g birth weight or younger than 28 weeks’ gestational age. However, it is much less common now, even in infants younger than 25 weeks’ gestational age. This is probably the result of the increased prevalence of antenatal steroid therapy and more aggressive nutrition, which have been shown to reduce the risk of nonoliguric hyperkalemia.
Nonoliguric hyperkalemia is managed in the following ways:
 By antagonizing the arrythmagenic effect of hyperkalemia
 0.5 to 1 mEq/kg elemental calcium (1 to 2 mL/kg of 10% calcium gluconate solution) by slow intravenous push

 By stimulating cellular uptake of potassium


 By increasing renal potassium secretion

 Peritoneal dialysis is rarely required except with hyperkalemia caused by renal failure.
40. Is the use of a cation exchange resin (e.g., Kayexalate) an effective and safe way to treat hyperkalemia?
Use of this method to treat hyperkalemia is no longer considered safe and effective.
 KEY POINTS: HYPERKALEMIA
1. Nonoliguric hyperkalemia (potassium >6.7 mEq/L in plasma from a nonhemolyzed whole blood specimen) still occurs in extremely premature infants, but the current prevalence is less than originally reported (15% to 50%). This probably results from the increased prevalence of antenatal steroid exposure. Therefore the clinician should be particularly vigilant in checking for nonoliguric hyperkalemia in extremely preterm infants whose mothers have not received antenatal steroids before their birth.
2. Other causes of hyperkalemia of which to be cognizant are oliguric acute renal failure and drugs that inhibit K excretion (e.g., spironolactone and enalapril).
3. Hyperkalemia may be a life-threatening emergency. In this circumstance inhalation treatment with albuterol is most rapidly effective.
Acid–Base Balance
 is not measured; it is calculated from the Henderson–Hasselbalch equation:
 can be calculated from the measured pH and measured pCO2 as follows:
The equation uses pK′ (the apparent pK), to account for the equilibrium between dissolved CO2 and  . The pK′ for H2CO3 dissociation in adult human plasma is 6.1.
 , plasma proteins,
  in red blood cells, and hemoglobin (Hgb). The effect of these buffers is to establish and stabilize a pH of blood at approximately 7.4.
 and BE are both measures of metabolic acid–base status. Which is better?
This has been subject of some debate for some time. However, BE is easier to interpret than serum  because it is less dependent on pCO2. When an increase in [H+] is not due to an increase in respiratory acid (i.e., carbonic acid produced from the combination of CO2 and H2O), the added H+ is bound by the buffer anions and base excess falls in direct proportion to the added H+. However, when an increase in [H+] is due to an increase in CO2, serum
  increases (because it is in equilibrium with CO2) and the other buffer anions decrease in direct proportion; thus BE remains unchanged. Therefore at a pH of 7.4, what serum
  is normal depends on the measured pCO2 ( Table 9-3).
TABLE 9-3
RELATION OF pCO2 AND SERUM  IN ADULTS WHEN pH IS 7.40 IN THE ADULT AND THERE IS NO CHANGE IN TOTAL BUFFER BASE
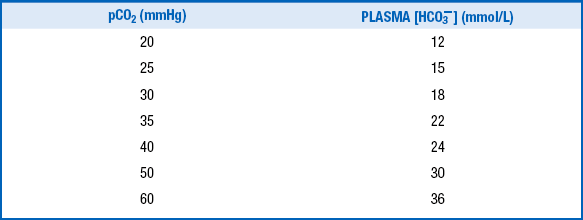
44. Why is serum  lower (and BE mildly negative) in newborns compared with that of the adult under baseline conditions? What serum
  is considered normal?
The serum  in preterm infants is normally 17 ± 1.2 mEq/L, with two standard deviations encompassing values as low as 14.5 mEq/L. During the first week of life, term infants have a serum
  of 20 ± 2.8 mEq/L. During the first year of life, the serum
  is still only approximately 22 ± 1.9 mEq/L, compared with 23 ± 1 mEq/L and 26 ± 1 mEq/L in older children and adults.
45. Do infants excrete more or less titratable acid and ammonia per kilogram of body weight compared with older children?
48. In acid–base disorders in human biology, in which body compartment are measurements made? What is the significance of this?
 is calculated from pH and pCO2, it represents the plasma concentration of
  . As calculated by blood gas autoanalyzers, the reported BE reflects the difference between the normal and actual buffer base concentrations. However, intracellular acid–base status cannot be measured in clinical practice. Because CO2 diffuses across cell membranes much more rapidly than
  , it is possible for rapid changes in pCO2 to change the acid–base profile of the two compartments in different directions and at different rates. When attempting to treat acid-base disorders, the clinician must consider the possible consequences, such as worsening intracellular acidosis in the face of alkalinization of the ECF with infusions of bicarbonate.
 A pCO2 greater than 40 indicates respiratory acidosis; a pCO2 less than 40 indicates respiratory alkalosis.

50. What are the principal mechanisms whereby infants compensate for abnormal acid–base abnormalities?


 (mEq) = 0.3 × weight (kg) × base deficit (mEq/L). The usual dosage is 1 to 2 mEq/kg/dose.
54. What do we know about the efficacy of the therapeutic use of sodium bicarbonate to correct acidemia in pediatric patients?
As a general rule, replacement of bicarbonate when body losses of bicarbonate are excessive (e.g., through the stool or urine) is appropriate. On the other hand, there is minimal evidence documenting the value of sodium bicarbonate infusions to correct acidemia resulting from many, if not most, other causes (e.g. lactic acidosis). In fact, data in animals, children, and adults suggest that correction of lactic acidosis with sodium bicarbonate infusions may be detrimental. Although it is relatively easy to make the pH of the ECF change in the desired direction, it is much more difficult to know in what direction the associated change in intracellular pH will be, which is the relevant issue for cell function. Moreover, if the cause of the acidemia is ongoing, the improvement in pH will be temporary; the primary cause of the acidemia must be corrected. Therefore sodium bicarbonate treatment should be used cautiously, if at all. 464748495051525354
 KEY POINTS: ACID–BASE BALANCE
1. A primary acid–base disturbance is always defined by the pH. A pH less than 7.3 indicates a primary acidemia, whereas a pH greater than 7.5 indicates a primary alkalemia.
2. The clinician must then turn to the pCO2,  , or base excess, and the underlying clinical situation to define the the primary disturbance.
3. Sodium bicarbonate should be used sparingly to treat acidemia. The clinician should never administer bicarbonate until the ability to excrete carbon dioxide is ensured; otherwise, the clinical acid–base disturbance may be worsened.
Diuretics
55. Diuretics therapy may be complicated by hyponatremia. How should hyponatremia be managed in this situation?
56. What damage can chronic administrative loop diuretics inflict on the kidneys, urinary tract, or both?
57. What is the best way to treat the hypokalemic, hypochloremic metabolic alkalosis that occurs in newborns who receive chronic diuretic therapy?
Diuretics cause metabolic alkalosis by increasing potassium secretion. This results from the increased delivery of water and sodium to the distal tubule and is treated with potassium chloride (KCl) supplementation. Diuretic therapy also induces a reduction in effective intraarterial volume and thereby activates the renin-angiotensin-aldosterone system, which stimulates secretion of potassium in the distal tubule. Blocking the effect of aldosterone on the distal tubule therefore counteracts the metabolic consequences of pharmacologic diuresis. Accordingly, adding spironolactone, a competitive inhibitor of aldosterone, to the diuretic regimen may prevent or improve derangements in serum bicarbonate and potassium concentrations. Caution should be used in adding spironolactone to the diuretic regimen and supplementing with KCl. 100
 KEY POINTS: DIURETICS
1. Infants receiving loop diuretics may require increased potassium and chloride intake to prevent potassium depletion and metabolic alkalosis.
2. Loop diuretics tend to be more effective in neonates but cause calciuresis, which can result in osteopenia, nephrocalcinosis, renal stone formation, or a combination of these.
3. Routine use of diuretic therapy has not been shown to significantly alter the course of bronchopulmonary dysplasia, although it may provide some immediate assistance in improving ventilation. The benefits should be carefully weighed against the risks of metabolic, bone, and renal complications.
Differential Diagnosis and Evaluation of Oliguria
58. The nurse reports that a 3-day-old infant is oliguric. You wonder, “How does she know the infant is oliguric?” What qualifies as oliguria?
59. If an infant is found to be oliguric, what are the possible causes? How should it be evaluated and treated?
 Dehydration. Dehydration is defined as an inappropriately negative decrease in total body water, sodium, or both caused by insufficient water and sodium intake. If urine can be obtained for analysis, urine [Na+] will be low and urine osmolality will be high with dehydration. Treatment depends on the cause but always includes replenishment of total body water and sodium.
 Acute renal failure (ARF). Renal failure by definition is a decrease in GFR below normal for gestational and postnatal age. Evaluation of serum [Cr] is required to judge whether GFR is reduced. However, a single value, especially in the first days of life when serum [Cr] is largely a function of maternal serum [Cr], will not be sufficient. The pattern of change over time, taking into account gestational and postnatal age, is more relevant. Treatment of ARF depends on the underlying etiology, but the principles of management are shown in Table 9-4.
TABLE 9-4
PRINCIPLES OF MANAGEMENT FOR ACUTE RENAL FAILURE
Monitor weight.
Monitor urine output and fluid balance.
Monitor serum electrolytes, blood urea nitrogen, and creatinine.
Remove potassium from intravenous fluids until renal output is adequate.
Adjust doses of drugs excreted by the kidney.
Provide adequate nutrition.
Adjust protein intake based on blood urea nitrogen to avoid overload.
Add calories as carbohydrate and fat.
Correct acidosis with supplemental acetate, citrate, or bicarbonate.
Attempt a trial of furosemide to promote and maintain urine output.
Support blood pressure with dopamine.
Attempt dialysis, if necessary.
From Ringer SA. Acute renal failure in the newborn. Neoreviews 2010;11:e243.

It is important to note that all the aforementioned causes may occur without associated oliguria, but urine output should be relatively low. There is an extensive differential diagnosis for each of these primary causes, and the clinical context is important in narrowing the differential diagnosis.
60. An oliguric term infant had a serum creatinine of 0.7 mg/dL at birth and 1 mg/dL at 48 hours of life. How do you interpret these levels?
This would be consistent with ARF because serum [Cr] should fall after birth in a term newborn.
61. In the face of an abnormal change in serum [Cr], how may the urine sodium concentration be helpful in evaluating oliguria?

In prerenal failure in which renal tubular function is normal, FENa is 2.5% to 3%. A FENa above 2.5% to 3% indicates intrarenal ARF with associated renal tubular injury. Because of overlap between the two groups, specificity is limited. Note that during postnatal natriuretic diuresis or extracellular volume (ECV) expansion, FENa will be high; in this case, however, urine output should also be high. However, in the polyuric phase of ARF, urine output and FENa are abnormally high. The former and the latter can be differentiated by urine osmolality. With ECV expansion the urine is hypoosmolar; in the polyuric phase of ARF the urine is isoosmolar ( Table 9-5).
TABLE 9-5
URINE INDICES IN PRERENAL AND INTRINSIC RENAL FAILURE
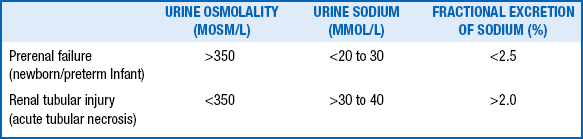
Data from Ringer SA. Acute renal failure in the newborn. Neoreviews 2010;11:e243
62. A 2-day-old baby is requiring significant ventilator support. His condition is complicated by bilateral pneumothoraces, and he has been anuric since birth. In reviewing his chart, you note that his mother had oligohydramnios. The baby is defined as “funny looking” in the admission note. Can you formulate an armchair differential diagnosis before going to see the baby?
The most likely diagnosis is oligohydramnios sequence.
The most helpful initial test would be abdominal sonography concentrating on the kidneys, ureters, and bladder. 555657585960
Differential Diagnosis and Evaluation of Polyuria
A urine flow rate greater than 4 to 5 mL/kg/h qualifies as polyuria.
Polyuria can be physiologic in response to excessive water and sodium intake or ECV expansion.
Pathologic causes of polyuria include the following:
 Impaired reabsorption of Na+ by the kidney. This is often the result of renal tubular injury or disease.


66. A newborn male infant is found to have renal failure caused by obstructive uropathy as the result of posterior urethral valves. A catheter is inserted into the bladder through the urethra. There is a large diuresis. The ARF gradually subsides with normalization of the serum creatinine level. Months later, the mother complains that her infant requires many more changes of diapers than did her other children. What is the likely explanation?
67. An infant born prematurely to a mother who had polyhydramnios required mechanical ventilation for 1 week. At 6 days of life he had a rising serum creatinine level, hypotension with cool extremities, hyponatremia, and mild hypokalemia. Despite the appearance of ARF and hypovolemia, the infant had a large urine output with a high urinary concentration of sodium.
Treatment with a prostaglandin synthetase inhibitor (e.g., indomethacin, ibuprofen) reverses many of the abnormalities. Salt-losing adrenal insufficiency must be excluded, but it is usually associated with hyperkalemia and acidosis. 61
 KEY POINTS: OLIGURIA AND POLYURIA
1. Oliguria is common in neonates during the first day of life because glomerular filtration is reduced. Nearly all babies will void, however, by 24 hours of life.
2. The creatinine measurement on the first day of life reflects the mother’s creatinine level, whereas the change in creatinine over time, which varies with gestational age, is the best measure of the glomerular filtration rate in the newborn.
3. Normal urine output should exceed about 1 mL/kg/day in the neonatal period. Below that level can be considered oliguria after the first day of life. Polyuria can be considered when urine output exceeds 4 to 5 mL/kg/day.
Renal Tubular Acidosis


All four types are associated with a hyperchloremic, normal anion gap acidosis.


Obstructive Uropathy


In fetal hydronephrosis 50% of cases improve, 40% remain stable, and 10% progress.
74. What criteria justify prenatal intervention for fetal hydronephrosis? What are the goals of therapy?
Criteria for prenatal intervention are as follows:
 Significant diminution of amniotic fluid volume (bilateral hydronephrosis)

 Renal dysfunction reversible to some degree
 No ultrasonographic evidence of irreversible renal dysplasia

Prenatal intervention is generally limited to males with posterior urethral valves.
75. How should an infant with an abnormal genitourinary prenatal ultrasound be evaluated? When should the studies be done?
A ureterocele is a cystic dilation of the distal end of the ureter. It is obstructive because it may extend through the bladder neck (ectopic), but it may remain entirely within the bladder (intravesical). This condition affects girls more often than boys and is usually associated with the upper pole of a completely duplicated collecting system. Ultrasound commonly shows hydronephrosis in the upper pole, a dilated ureter, and a ureterocele in the bladder. 6465666768697071
Posterior Urethral Valves
PUV is usually caused by an obstructing membrane extending from the verumontanum at the base of the prostatic urethra to the more distal anterior portion of the membranous urethra. This membrane contains only a small opening through which urine can pass; as the urine flows, the membrane billows out in a windsock fashion as a one-way flap valve, causing obstruction. The degree of obstruction varies depending on the size of the opening of the membrane.
79. Which conditions can be confused with PUV on fetal ultrasound?


80. What is the most common presentation for an infant with PUV?
81. What are the short- and long-term consequences of PUV?
 Glomerular and renal tubular dysfunction causing renal insufficiency, poor urinary concentrating ability, and polyuria

 Vesicoureteral reflux, which is found in one third to one half of boys with valves

82. Does intervention after fetal diagnosis ultimately improve renal function?
Conditions that allow decompression of the urinary tract (i.e., “pop-off” mechanism) have a better prognosis. Such conditions include bladder diverticular formation, urinary ascites, and unilateral vesiculoureteral reflux dysplasia (VURD) syndrome. Urinary ascites is caused by transudation of urine across a renal calyceal fornix into the peritoneal cavity; this transudation relieves the obstruction. VURD syndrome occurs when one kidney refluxes with subsequent renal dysplasia on that side, offering protection for the contralateral kidney. 7273
 KEY POINTS: OBSTRUCTIVE UROPATHY
Hematuria
No. Hematuria is never physiologic, but it can be a common finding in sick premature infants.
Hematuria is defined as more than five red blood cells per high power field.
86. What are the causes of hematuria in the newborn infant?

 Renovascular accident (renal vein or renal artery thrombosis)


 Trauma (usually suprapubic aspiration)
 Congenital malformation of the kidney or urinary tract (or both), including polycystic disease
87. How should infants with hematuria be evaluated?
 Exclude other causes of red urine, such as urates, porphyrins, bile pigments, myoglobin, and hemoglobin.


 Exclude extraurinary sources of blood, such as vaginal, rectal, or perineal sources.
 Obtain a urine culture if infection is suspected.
 Perform a renal ultrasound study if hematuria is persistent.


Congenital Nephrotic Syndrome
89. Newborns may have proteinuria that occurs without complete nephrotic syndrome. How does the clinician interpret isolated proteinuria?
Abnormal proteinuria is defined as urine protein excretion greater than 100 mg/m2 body surface area/24 h, calculated from a timed urine collection, or a ratio of urine protein (mg/dL)/urine creatinine (mg/dL) greater than 0.5, calculated from a single-spot urine specimen. Preterm infants are more likely to exhibit proteinuria than are term infants. Abnormal proteinuria can occur in newborns as a result of various pathologic processes, including chronic volume depletion, congestive heart failure, and interstitial nephritis caused by antibiotic administration. However, nephrotic-range proteinuria, as defined previously, suggests significant damage to glomerular epithelial cells caused by some pathologic process. Therefore discovery of nephrotic-range proteinuria, even in the absence of the full nephrotic syndrome, should prompt an evaluation.
91. What prenatal or perinatal abnormalities should alert the perinatologist to the possibility that a newborn may have or develop congenital nephrotic syndrome?
As a group, patients who develop nephrotic syndrome in the newborn period have a guarded prognosis. With the initiation of renal replacement therapy (usually peritoneal dialysis) in these neonates, the long-term survival rates have increased dramatically in the past few decades. Possible causes of increased morbidity and mortality in this population include the development of bacterial infections, developmental delay, growth failure, thrombotic events, acute or chronic renal failure, complications of renal transplantation, and Wilms tumor among patients with Denys–Drash syndrome. 75
Nephrocalcinosis
95. A 6-week-old premature infant of 28 weeks’ gestation with bronchopulmonary dysplasia is found to have nephrocalcinosis. The infant has been treated for several weeks with furosemide. Is chronic treatment with furosemide the most likely diagnosis in this case?
Yes. The association of long-term furosemide therapy and nephrocalcinosis has been well recognized since the original description by Hufnagle et al. in 1982. There are, however, other diagnostic considerations for infants with nephrocalcinosis, which are outlined in Table 9-6.
TABLE 9-6
DIFFERENTIAL DIAGNOSIS OF NEPHROCALCINOSIS IN INFANTS
| NORMOCALCEMIC | HYPERCALCEMIC | NORMOCALCIURIC |
| HYPERCALCIURIA | HYPERCALCIURIA | NEPHROCALCINOSIS |
| Furosemide therapy | Hyperparathyroidism | Primary hyperoxaluria |
| Bartter syndrome | Hypophosphatasia | Enteric hyperoxaluria |
| Distal renal tubular acidosis | Williams syndrome | Renal candidiasis |
| Hyperprostaglandin E | Idiopathic infantile | Long-term hypercalcemia |
| Subcutaneous fat necrosis | Acetazolamide therapy Dystrophic calcifications |
Adapted from Karlowicz MG, Adelman RD. Renal calcification in the first year of life. Pediatr Clin North Am 1995;42:1397–1413.
96. Hypercalciuria is an important diagnostic consideration in an infant with nephrocalcinosis. What is the normal range for calcium excretion in infants?
Treatment of the primary cause can be important in cases not caused by long-term furosemide therapy. In infants being given furosemide, substitution of a thiazide diuretic for furosemide can decrease the calcium excretion and result in shrinkage of calculi and improvement of the medullary nephrocalcinosis. The long-term prognosis has been correlated with the course of the urinary calcium excretion.
Long-term studies of premature infants with nephrocalcinosis have suggested that 30% to 50% of the children continue to have evidence of renal calcification up to 5 years after diagnosis. There is some evidence of a slightly decreased GFR in patients with nephrocalcinosis, but these findings may be the result of prematurity and not specific for the history of nephrocalcinosis. 76777879
Hypertension
99. What are the environmental and technical factors that can affect blood pressure measurements in the newborn?
The diagnosis of hypertension should be made only if the systolic and diastolic blood pressures are above the 95th percentile on at least three separate blood pressure measurements recorded at 2-minute intervals during a time when the infant is quiet and otherwise undisturbed ( Table 9-7).
TABLE 9-7
NEONATAL AND INFANT BP NORMATIVE DATA AFTER 2 WEEKS’ CHRONOLOGICAL AGE BASED ON POSTMENSTRUAL AGE (GESTATIONAL AGE + CHRONOLOGICAL AGE)
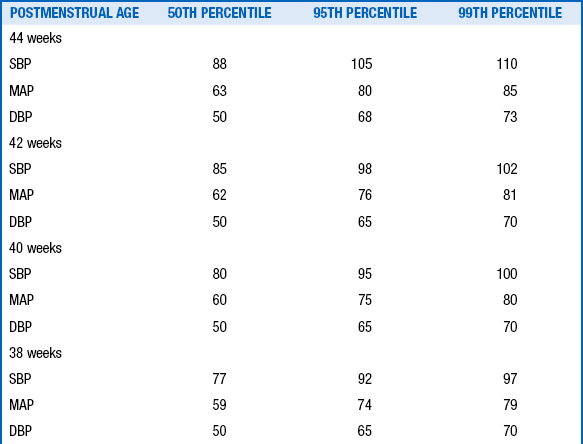
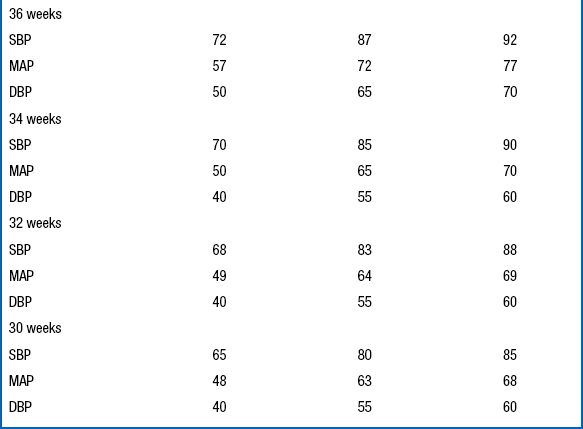
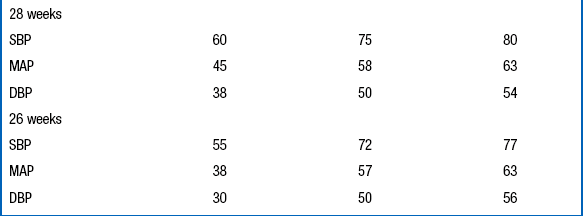
Data From Dionne JM, Arbitol CL, Flynn JT. Hypertension in infancy: Diagnosis, management and outcome. Pediatr Nephrol 2012;27:17–32.
Extremely-low-birth-weight infants with bronchopulmonary dysplasia appear to develop hypertension in the absence of clear evidence of renal artery occlusion at a rate higher than that seen with renal thrombosis. The etiology in many of these cases cannot be determined, although it is postulated that hypoxemia might be involved. Over 50% of these infants with bronchopulmonary dysplasia develop elevated blood pressures after discharge from the NICU. Extremely-low-birth-weight infants who have been hospitalized for a prolonged period should therefore have routine blood pressure measurements made during their well-baby visits throughout the first year of life. Blood pressure measurement is often neglected by pediatricians because of the difficulty in obtaining an accurate determination in these tiny babies. Other causes of neonatal hypertension are listed in Table 9-8.
TABLE 9-8
DIFFERENTIAL DIAGNOSIS OF NEONATAL HYPERTENSION
AORTIC OBSTRUCTION
Coarctation of the aorta
Aortic arch interruption
Descending aorta thrombosis
RENAL AND RENOVASCULAR PROBLEMS
Renal artery thrombosis or embolus
Renal artery stenosis
Renal vein thrombosis (late)
Cystic renal disease
Obstructive uropathy
PHARMACOLOGIC ADVERSE EFFECTS
Catecholamines
Cocaine
Dexamethasone
Theophylline
OTHER CAUSES
Exogenous fluid administration
Environmental cold or noise stress
Seizures
Chronic lung disease
103. What is the blood pressure profile of a patient whose hypertension is caused by a complication related to a UAC?
Most patients who develop hypertension as a result of complications from a UAC are normotensive until the UAC is pulled. When the UAC is removed, hypertension often develops abruptly. The onset of hypertension in this situation coincides with the embolization of renal vessels by clots that are sheared from the tip of the catheter during its withdrawal. Hypertension associated with UAC thrombosis usually resolves by 2 years of age.
104. What is the treatment of choice for newborns with hypertension related to a complication from the UAC?
UAC-related hypertension is generated by high circulating concentrations of angiotensin II. Angiotensin II production can be blocked by use of drugs that inhibit angiotensin-converting enzyme (ACE) inhibitors. Captopril is usually the ACE inhibitor of choice, with a starting dose of 0.01 to 0.5 mg/kg/dose given three times a day. The daily dose may be increased to a maximum of 6 mg/kg/day, if needed. Other ACE inhibitors such as enalapril or lisinopril may be used with equally beneficial effects, but dosing of these drugs for very small patients may be problematic for pharmacists. The use of ACE inhibitors is somewhat controversial because they may cause an exaggerated fall in blood pressure in the preterm infant. In addition, ACE inhibitors may hinder the final stages of renal maturation. For both those reasons, some clinicians do not use an ACE inhibitor until the infant has reached 44 weeks’ postmenstrual age. For other causes of hypertension, calcium channel blockers are recommended. Table 9-9 summarizes the dosing for the commonly used antihypertensive agents.
TABLE 9-9
DOSING OF SELECTED ANTIHYPERTENSIVE AGENTS IN NEONATES
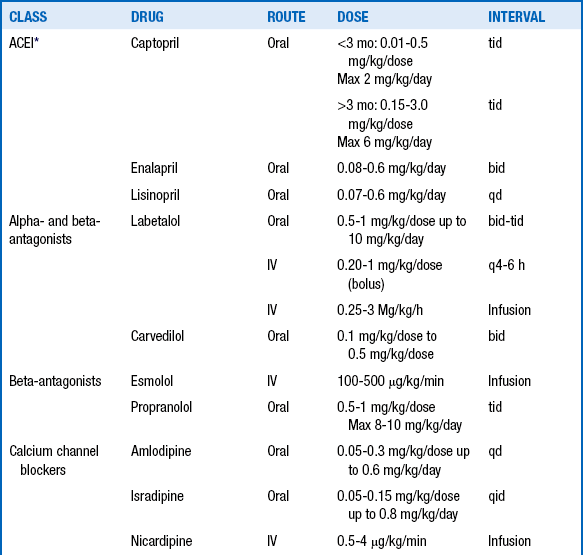
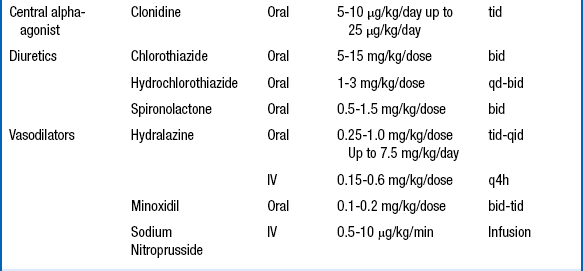
∗Avoid use in preterm infants until 44 weeks’ postmenstrual age
Data from Dione JM, Flynn JT. Hypertension in the neonate. Neoreviews 2012;13:e401.
106. What abnormality of the physical examination of a hypertensive infant suggests that coarctation of the aorta may be the cause of the elevated blood pressure?
Despite the conventional wisdom that coarctation of the aorta is associated with a cardiac murmur and absent femoral pulses, many newborns with aortic coarctation do not fit the mold. In hypertensive infants measurement of blood pressure in both upper and lower extremities is crucial. Coarctation of the aorta should be suspected if the systolic pressure in the leg is more than 10 mmHg lower than the systolic pressure in the arms. It is also important to note that hypertension may persist in these infants even after the coarctation has been surgically repaired. 808182
 KEY POINTS: HYPERTENSION
1. Neonatal hypertension during or after NICU hospitalization is not rare and should be monitored in all patients.
2. Hypertension related to umbilical catheterization usually occurs during treatment or immediately after removal of the catheter.
3. Hypertension unrelated to catheters typically appears later during NICU hospitalization in an extremely-low-birth-weight infant with chronic lung disease.
4. Coarctation of the aorta should be considered in any neonate with hypertension.
Renal Vein Thrombosis
107. What are some maternal and infant factors that increase the risk of renal vein thrombosis (RVT) in the newborn infant?
Because RVT may be caused by serum hyperosmolarity, intravenous administration of hypertonic radiocontrast agents may be ill-advised. Therefore the clinician should not order studies that may require administration of intravenous contrast agents (e.g., intravenous pyelography, computed tomography).
 Oliguria, fluid retention, and hyponatremia

 Hyperphosphatemia and hypocalcemia
111. Is there a role for thrombectomy or nephrectomy in infants with RVT?
112. Is thrombolytic (e.g., urokinase, tissue plasminogen activator) or anticoagulant therapy useful in neonates with RVT?
Anticoagulant intervention that aims to prevent extension of RVT into previously uninvolved venous structures may be appropriate for some patients, particularly those who have congenital thrombophilic disorders. The prothrombotic factors that lead to RVT formation and propagation in most newborns can be eliminated without anticoagulant therapy (e.g., hyperosmolarity, dehydration). However, anticoagulants may protect infants with intrinsic abnormalities of the coagulation cascade from experiencing secondary thrombotic events. 83
Prune-Belly Syndrome
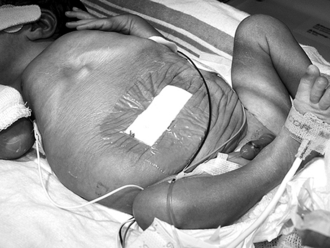
Prune-belly syndrome is a rare congenital anomaly that consists of genital (usually undescended testes) and urinary tract abnormalities with absent or decreased abdominal wall musculature ( Fig. 9-6). Prune-belly syndrome is caused by urethral outlet obstruction early in development.
114. What are the most common urinary tract anomalies that occur in patients with prune-belly syndrome?
From bottom to top, the most common urinary tract anomalies are as follows:

 The bladder is capacious. The bladder wall may be thickened, but the internal contour of the bladder is smooth, without trabeculations or diverticuli. Often the bladder communicates with a patent urachus.

 The kidneys are often small, with or without dilation of the collecting system.
115. What other anomalies occur outside the genitourinary system in infants with prune-belly syndrome? What are their causes?
116. Which diagnostic studies assist the neonatologist in evaluating a child with prune-belly syndrome?
The initial work-up should include (1) abdominal and pelvic ultrasonography to provide a basic road map of the genitourinary anomalies and (2) voiding cystourethrography to diagnose vesicoureteral reflux and reflux into a patent urachus. Either of these two diagnoses mandates initiation of antibiotic prophylaxis. If the infant is stable enough to be transported, other imaging studies significantly enhance understanding of the genitourinary pathology. Computerized axial tomograms of the abdomen, performed before and after intravenous administration of radiocontrast material, will usually reveal more anatomic detail than ultrasound; in addition, they provide a qualitative assessment of comparative renal function (i.e., right versus left kidney). A renal scan using DTPA or MAG3 will localize any points of obstruction between the kidneys and the bladder and provides a quantitative estimate of the comparative function of the two kidneys.
Surgical plication of the lax abdominal musculature is important for the psychological well-being of patients with prune-belly syndrome, but this cosmetic reconstruction should probably not be performed in a newborn. 848586
Cystic Kidney Disease
121. Describe the management of autosomal recessive polycystic kidney disease in a neonate.
 Treat the hypertension (usually requires multiple antihypertensive agents, one of which should be an ACE inhibitor).
 Ventilate; drain pneumothoraces.

 Order peritoneal dialysis in cases of chronic renal failure.
122. What are some complications that can occur in infants with autosomal recessive polycystic disease?

 Bleeding from gastroesophageal varices
 Hypersplenism with combinations of anemia, leukopenia, and thrombocytopenia


123. Can autosomal dominant polycystic kidney disease occur in the neonate?
125. In which conditions is congenital hepatic fibrosis associated with renal disorders?
 Congenital hepatic fibrosis and polycystic kidneys (autosomal recessive and dominant)
 Hereditary tubulointerstitial nephritis


 Jeune syndrome (asphyxiating thoracic chondrodystrophy)
 Congenital hepatic fibrosis and hereditary renal dysplasia


 Renal-hepatic-pancreatic cystic dysplasia (Ivemark syndrome)

ExStrophy of the Bladder
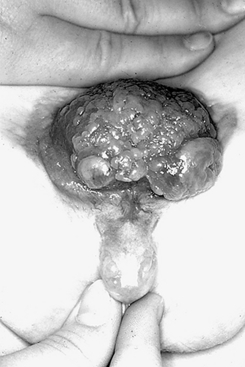
The correct terms for the developmental defect shown in Figure 9-7 are bladder exstrophy and epispadias.
Bladder closure takes place between the sixth and eighth weeks of fetal life.
Bladder exstrophy should be closed in the first 48 hours of life to ensure the best possible technical results for achieving long-term continence.
129. Should the clinician be concerned with upper urinary tract anomalies in children with bladder exstrophy?
The risk is no greater than that for the general population, which is 1:50,000 live births.
The reasons are not entirely clear; however, it appears that the widespread use of prenatal ultrasonography and elective termination have had a significant impact on the incidence of bladder exstrophy worldwide. 9293
Hypospadias
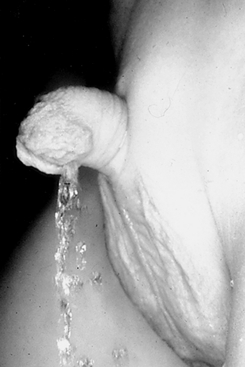
The developmental defect shown in Figure 9-8 is called hypospadias.
133. Does the child shown in Figure 9-8 need immediate surgical attention?
No. Surgical correction is best done somewhere between 6 and 12 months of life, assuming there are no additional medical issues.
Penile development takes place between 12 and 15 weeks of gestation.
The incidence of hypospadias is increasing nationwide. The reason is not entirely clear, but it may have to do with increased use of in vitro fertilization or exposure to environmental estrogens and antiandrogens. 94959697
1Beall MH, van den Wijngaard J, van Germet M, et al. Water flux and amniotic fluid volume: understanding fetal water flow. In: Oh W, Guignard J-P, Baumgart S, editors. Nephrology and fluid/electrolyte physiology: neonatology questions and controversies. 2nd ed. Philadelphia: Saunders; 2012. p. 3–18.
2Gallini F, Maggio L, Romagnoli C, et al. Progression of renal function in preterm neonates with gestational age < or = 32 weeks. Pediatr Nephrol 2000;15:119–124.
3Gasser B, Mauss Y, Ghnassia JP, et al. A quantitative study of normal nephrogenesis in the human fetus: its implications in the natural history of kidney changes due to low obstructive uropathies. Fetal Diagn Ther 1993;8:371–84.
4Guignard J-P, Gouyon J-B. Glomerular filtration rate in neonates. In: Oh W, Guignard J-P, Baumgart S, editors. Nephrology and fluid/electrolyte physiology: neonatology questions and controversies. 2nd ed. Philadelphia: Saunders; 2012. p. 117–35.
5Lorenz JM. Potassium metabolism. In: Oh W, Guignard J-P, Baumgart S, editors. Nephrology and fluid/electrolyte physiology: neonatology questions and controversies. 2nd ed. Philadelphia: Saunders; 2012. p. 61–73.
6Sulyok E. Renal aspects of sodium metabolism in the fetus and neonate. In: Oh W, Guignard J-P, Baumgart S, editors. Nephrology and fluid/electrolyte physiology: neonatology questions and controversies. 2nd ed. Philadelphia: Saunders; 2012, p. 31–59.
7Agren J, Sjors G, Sedin G. Transepidermal water loss in infants born at 24 and 25 weeks of gestation. Acta Paediatr 1998;87:1185–90.
8American Academy of Pediatrics. Clinical report—postnatal glucose homeostasis in late-preterm and term infants. Pediatr 2011;127:575–79.
9Bauer K, Boverman G, Roithmaier A, et al. Body composition, nutrition, and fluid balance during the first two weeks of life in preterm neonates weighing less than 1500 grams. J Pediatr 1991;118:615–20.
10Bauer K, Versmold H. Postnatal weight loss in preterm neonates < 1599 g is due to isotonic dehydration of the extracellular volume. Acta Paediatr Scand Suppl 1989;360:37–42.
11Bell EF, Acarregui MJ. Restricted versus liberal water intake for preventing morbidity and mortality in preterm infants. Cochrane Database Syst Rev 2008;1:CD000503.
12Bell EF, Warburton D, Stonestreet BS, et al. Effect of fluid administration on the development of symptomatic patent ductus arteriosus and congestive heart failure in premature infants. N Engl J Med 1980;302:598–604.
13Bell EF, Warburton D, Stonestreet BS, et al. High-volume intake predisposes premature infants to necrotizing enterocolitis [letter]. Lancet 1979;2:90.
14Clark DA. Time of first void and first stool in 500 newborns. Pediatrics 1977;60:457–59.
15Costarino AT, Gruskay JA, Corcoran L, et al. Sodium restriction versus daily maintenance replacement in very low birth weight premature neonates: a randomized, blind therapeutic trial. J Pediatr 1992;120:99–106.
16Dimitriou G, Kavvadia V, Marcou M, et al. Antenatal steroids and fluid balance in very low birthweight infants. Arch Dis Child 2005;90:F509–F513.
17Guignard J-P, Drukker A. Why do newborns have elevated plasma creatinine? Pediatr 1999;103:e49. www.pediatrics.org/cgi/content/full/103/4/e49.
18Hammarlund K, Nilsson GE, Öberg PA, et al. Transepidermal water loss in the newborn I. Relation to ambient humidity and site of measurement and estimation of total transepidermal water loss. Acta Paediatr Scand 1977;66:553–62.
19Hammarlund K, Sedin G, Strömberg B. Transepidermal water loss in newborn infants VIII. Relation to gestational age and post-natal age in appropriate and small for gestational age infants. Acta Paediatr Scand 1983;72:7.
20Hartnoll G, Bétrémieux P, Modi N. Randomized controlled trial of postnatal sodium supplementation on body composition in 25 to 30 week gestation age infants. Arch Dis Child 2000;82:F24–F28.
21Hawdon JM, Ward Platt MP, Aynsley-Green A. Prevention and management of neonatal hypoglycemia. Arch Dis Child 1994;70:F54–F65.
22Heimler R, Doumas BT, Jendrzejcak BM, et al. Relationship between nutrition, weight change, and fluid compartments in preterm infants during the first week of life. J Pediatr 1993;122:110–14.
23Kavvadia V, Greenough A, Dimitriou G, Forsling ML. Randomized trial of two levels of fluid input in the perinatal period—effect on fluid balance, electrolyte and metabolic disturbances in ventilated VLBW infants. Acta Paediatrica 2000;89:237–41.
24Kelly LK, Seri I. Renal developmental physiology: relevance to clinical care. Neoreviews 2008;9:e150–e161.
25Lorenz JM. Fluid and electrolyte therapy in the very low birth weight neonate. NeoReviews. 2008;9:e102–e108.
26Lorenz JM, Kleinman LI, Ahmed G, et al. Phases of fluid and electrolyte homeostasis in the extremely low birth weight infant. Pediatr 1995;96:484–89.
27Lorenz JM, Kleinman LI, Kotagal UR, et al. Water balance in very low birth weight infants: relationship to water and sodium intake and effect on outcome. J Pediatr 1982;101:423–32.
28Omar SA, DeCristofaro JD, Agarwal BI, et al. Effect of prenatal steroids on water and sodium homeostasis in extremely low birth weight infants. Pediatr 1999;104:482–8.
29Shaffer SG, Bradt SK, Hall RT. Postnatal changes in total body water and extracellular volume in preterm infants with respiratory distress syndrome. J Pediatr 1986;109:509–14.
30Singhi S, Sood VI, Bhakoo NK, et al. Composition of postnatal weight loss and subsequent weight gain in preterm infants. Indian J Med Res 1995;101:157–62.
31Stonestreet BS, Bell EF, Warburton D, et al. Renal response in low-birth-weight neonates: results of prolonged intake of two different amounts of fluid and sodium. Am J Dis Child 1983;137:215–19.
32Shaffer SG, Bradt SK, Meade VM, et al. Extracellular fluid volume changes in very low birth weight infants during the first 2 postnatal months. J Pediatr 1987;111:124–8.
33Shaffer SG, Meade VM. Sodium balance and extracellular volume regulation in very low birth weight infants. J Pediatr 1989;115:285–90.
34Tammela OKT, Koivisto ME. Fluid restriction for preventing bronchopulmonary dysplasia? Reduced fluid intake during the first weeks of life improves the outcome of low-birth-weight infants. Acta Paediatrica 1992;81:207–12.
35Van der Wagen A, Okken A, Zweens J, et al. Composition of postnatal weight loss and subsequent weight gain in small for dates newborn infants. Acta Paediatr Scand 1985;74:57–61.
36Verma RP, Shibil S, Fang H, et al. Clinical determinants and utility of early postnatal maximum weight loss in fluid management of extremely low birth weight infants. Early Hum Dev 2009;85:59–64.
37Fukuda Y, Kojima T, Ono A, et al. Factors causing hyperkalemia in premature infants. Am J Perinatol 1989;6:76–9.
38Hu PS, Su BH and Peng CT, et al. Glucose and insulin infusion versus kayexalate for early treatment of non-oliguric hyperkalemia in very-low-birth-weight infants. Acta Paediatr Taiwan 1999;40:314.
39Lorenz JM, Kleinman LI, Markarian K. Potassium metabolism in extremely low birth weight infants in the first week of life. J Pediatr 1997;131:81.
40Malone TA. Glucose and insulin versus cation-exchange resin for the treatment of hyperkalemia in very low birth weight infants. J Pediatr 1991;118:121–3.
41O’Hare FM, Molloy EJ. What is the best treatment for hyperkalemia in a preterm infant? Arch Dis Child 2008;93;174–6.
42Omar SA, DeCristofaro JD, Agarwal BI, et al. Effect of prenatal steroids on potassium balance in extremely low birth weight neonates. Pediatr 2000;106:561–7.
43Sato K, Kondo T, Iwao H, et al. Internal potassium shift in premature infants: cause of nonoliguric hyperkalemia. J Pediatr 1995;126:109–13.
44Singh DS, Sadiq HF, Noguchi A, et al. Efficacy of albuterol inhalation in treatment of hyperkalemia in premature infants. J Pediatr 2002;141:16–20.
45Yaseen H, Khalaf M, Dana A, et al. Salbutamol versus cation-exchange resin (Kayexalate) for the treatment of nonoliguric hyperkalemia in preterm infants. Am J Perinatol 2008;25:193–8.
46Ammari AN, Schulze KF. Uses and abuses of sodium bicarbonate in the neonatal intensive care unit. Curr Opin Pediatr 2002;14:151–6.
47Aschner J, Poland RL. Sodium bicarbonate: basically useless therapy. Pediatr 2008;122(4):831–5.
48Berg CS, Barnette AR, Myers BJ, et al. Sodium bicarbonate administration and outcome in preterm infants. J Pediatr 2010;157:684–7.
49Higgins C. An introduction to acid-base balance in health and disease. June 2004. Available at http://www.acutecaretesting.org/en/articles/an-introduction-to-acidbase-balance-in-health-and-disease. Accessed August 4, 2012.
50Higgins C. Lactate and lactic acid. Oct 2007. Available at http://acutecaretesting.org/en/articles/lactate-and-lactic-acidosisosis. Accessed Aug 4, 2012.
51Kecskes ZB, Davies MW. Rapid correction of early metabolic acidaemia in comparison with placebo, no intervention or slow correction in LBW infants. Cochrane Database Sys Rev. 2009;CD002976.
52Kofstad J. All about base excess—to BE or not to BE. July 2003. http://www.acutecaretesting.org/en/articles/all-about-base-excess–to-be-or-not-to-be. Accessed August 4, 2012.
53Lorenz JM, Kleinman LI, Markarian K, et al. Serum anion gap in the differential diagnosis of metabolic acidosis in critically ill newborns. J Pediatr 1999;135:751–5.
54Seri I. Acid-base homeostasis in the fetus and newborn. In: Oh W, Guignard J-P, Baumgart S, editors. Nephrology and fluid/electrolyte physiology: neonatology questions and controversies. 2nd ed. Philadelphia: Saunders; 2012. p. 105–12.
100Guignard J-P, Gouyon J-B. Use of diuretics in the newborn. In: Oh W, Guignard J-P, Baumgart S, editors. Nephrology and fluid/electrolyte physiology: neonatology questions and controversies. 2nd ed. Philadelphia: Saunders; 2012. p. 233–50.
55Andreoli SP. Kidney injury in the neonate. In: Oh W, Guignard J-P, Baumgart S, editors. Nephrology and fluid/electrolyte physiology: neonatology questions and controversies. 2nd ed. Philadelphia: Saunders; 2012. p. 285–303.
56Ellis EN, Arnold WC. Use of urinary indexes in renal failure in the newborn. Am J Dis Child 1982;136:615–7.
57Miall LS, Henderson MJ, Turner AJ, et al. Plasma creatinine rises dramatically in the first 48 hours of life in preterm infants. Pediatr 1999;104:e76. Available at www.pediatrics.org.cgi.content/full/104/6/e76. Accessed July 28, 2012.
58Mathew OP, Jones AS, James E, et al. Neonatal renal failure: usefulness of diagnostic indices. Pediatrics 1980;65:57–60.
59Pitkin RM, Reynolds A. Creatinine exchange between mother, fetus, and amniotic fluid. Am J Physiol 1975;228:231–7.
60Rudd PT, Hughes EA, Placzek MM, et al. Reference ranges for plasma creatinine during the first month of life. Arch Dis Child 1983;58:212–5.
61Simon DB, Lifton RP. The molecular basis of inherited hypokalemic alkalosis: Bartter’s and Gitelman’s syndrome. Am J Physiol 1996;271:F961–F966.
62Roth KS, Chan JC. Renal tubular acidosis: a new look at an old problem. Clin Pediatr 2001;40:533–43.
64Chevalier RL. Perinatal obstructive nephropathy. Sem Perinatol 2004;28:124–31.
65Chevalier RL. Obstructive uropathy: assessment of renal function in the fetus. In: Oh W, de Bruyn R, Marks SD, editors. Postnatal investigation of fetal renal disease. Sem Fetal Neonat Med 2008;13:133–41.
66Guignard J-P, Baumgart S, editors. Nephrology and fluid/electrolyte physiology: neonatology questions and controversies. 2nd ed. Philadelphia: Saunders; 2012. p. 335–60.
67EK S, Lidefeldt K-J, Varricio L. Fetal hydronephrosis: prevalence, natural history, and postnatal consequences in an unselected population. Acta Obstet et Gynecol Scand 2007;86:1463–6.
68Estrada CR. Prenatal hydronephrosis: early evaluation. Curr Opin Urol 2008;18:401–3.
69Sidhu G, Beyene J, Rosenblum ND. Outcome of isolated antenatal hydronephrosis: a systematic review and meta-analysis. 2006;21:218–24.
70Yiee J, Wilcox D. Management of fetal hydronephrosis. Pediatr Nephrol 2008;23:347–53.
71Lee RS, Cebdron M, Kinnamon DD, et al. Antenatal hydronephrosis as a predictor of postnatal outcome: a meta-analysis. Pediatr 2006;118:586–93.
72Gatti JM, Kirsch AJ. Posterior urethral valves: pre- and postnatal management. Curr Urol Report. 2001;2:138–45.
73Jee LD, Rickwood AM, Turnock RR. Posterior urethral valves: does prenatal diagnosis influence prognosis? Br J Urol 1993;72:830–3.
74Emanuel B, Aronson N. Neonatal hematuria. Am J Dis Child 1974;128:204–6.
75Penaflor G. Congenital nephrotic syndrome. Pediatr Rev 2001;22:32.
76Hufnagle KG, Khan SN, Penn D, et al. Renal calcifications: a complication of long-term furosemide therapy in preterm infants. Pediatrics 1982;70:360–3.
77Karlowicz MG, Adelman RD. Renal calcification in the first year of life. Pediatr Clin North Am 1995;42:1397–1413.
78Porter E, McKie A, Beattie TJ, et al. Neonatal nephrocalcinosis: long term follow up. Arch Dis Child Fetal Neonatal Ed 2006;91;333–6
79Sargent JD, Stukel TA, Kresel J, et al. Normal values for random urinary calcium to creatinine ratios in infancy. J Pediatr 1993;123:393–7.
80Flynn JT. Neonatal hypertension: diagnosis and management. In: Oh W, Guignard J-P, Baumgart S, editors. Nephrology and fluid/electrolyte physiology: neonatology questions and controversies. 2nd ed. Philadelphia: Saunders; 2012. p. 251–65.
81Nawankwo MU, Lorenz JM, Gardiner JC. A standard protocol for blood pressure measurement in the newborn. Pediatrics 1997;99:E10.
82Tan KL. Blood pressure in very low birth weight infants in the first 70 days of life. J Pediatr 1988;112:266–70.
83Rosendaal FR. Thrombosis in the young: epidemiology and risk factors. A focus on venous thrombosis. Thromb Haemost 1977;78:1–6.
84Hassett S, Smith GH, Holland AJ. Prune belly syndrome. Pediatr Surg Int 2012;28:219–28.
85Lesavoy MA, Chang EI, Suliman A, et al. Long-term follow-up of total abdominal wall reconstruction for prune belly syndrome. Plast Reconstr Surg 2012;129:104e.
86Routh JC, Huang L, Retik AB, et al. Contemporary epidemiology and characterization of newborn male with Prune Belly Syndrome. Urology 2010;76:44–8.
87Avni FE, Hall M. Renal cystic diseases in children: new concepts. Pediatr Radiol 2010;40:939–46.
88Fick GM, Gabow PA. Hereditary and acquired cystic disease of the kidney. Kidney Int 1994;46:961–4.
89Kaplan BS, Fay J, Shah V, et al. TM autosomal recessive polycystic kidney disease. Pediatr Nephrol 3:1989;43–9.
90Ogborn MR. Polycystic kidney disease—a truly pediatric problem. Pediatr Nephrol 1994;8:762–7.
91Roy S, Dillon MJ, Trompeter RS, et al. Autosomal recessive polycystic kidney disease: Long-term outcome of neonatal survivors. Pediatr Nephrol 1997;11:302–6.
92Phillips TM. Spectrum of cloacal exstrophy. Semin Pediatr Surg 2011;20:113–8.
93Woo LL, Thomas JC, Brock JW. Cloacal exstrophy: a comprehensive review of an uncommon problem. J Pediatr Urol 2010;6:102–11.
94Erickson JD. Epidemiology of hypospadias. Adv Exper Med Biol 2004;545:25–9.
95Kalfa N, Philibert P, Sultan C. Is hypospadias a genetic, endocrine or environmental disease, or still an unexplained malformation? Int J Androl 2008; 32:187–97.
96Silver RI. Endocrine abnormalities in boys with hypospadias. Adv Exper Med Biol. 2004;545:45–72.
97Snodgrass WT. Consultation with the specialist: hypospadias [Review]. Pediatr Rev 2004;25:63–7.
[/level-membership-for-neonatal-and-perinatal-medicine-category][not-level-membership-for-neonatal-and-perinatal-medicine-category]Chapter 9
Fluid, Electrolyte, Acid–Base, and Renal-Developmental Physiology and Disorders
During fetal life the placenta is responsible for fetal water and electrolyte homeostasis. The principal function of the fetal kidney is the continuous excretion of water and electrolytes into the amniotic cavity, which is essential for maintenance of amniotic fluid volume. Normal amniotic fluid volume is essential for normal lung development. After birth the kidneys assume responsibility for maintenance of appropriate total body water and electrolyte homeostasis ( Fig. 9-1).
Figure 9-1 Normal range of amniotic fluid volume in human gestation. (From Brace RA, Wolf EJ. Normal amniotic fluid volume changes throughout pregnancy. Am J Obstet Gynecol 1989;161:382–8.)
Urine is made by the fetus in increasing amounts as gestation advances. In fact, fetal urine output is quite high—in the range of 25% of body weight per day, approximately 750 to 1000 mL per day near term. Fetal urine, along with pulmonary secretions, is an important contributor to amniotic fluid. The process is dynamic, with amniotic fluid being produced continuously, then swallowed and reabsorbed from the gastrointestinal tract ( Fig. 9-2). Fetal oliguria may produce oligohydramnios. Obstruction in the gastrointestinal tract or neurologic impairment of swallowing may result in polyhydramnios.
Figure 9-2 Circulation between the fetus and amniotic fluid (AF). The major sources of AF water are fetal urine and lung liquid; the routes of absorption are through fetal swallowing and intramembranous flow. (From Beall MH, van den Wijingarrd JPHM, van Germert M, et al. Placenta and fetal water flux. In: Oh W, Guignard J-P, Baumgart S, editors: Nephrology and fluid/electrolyte physiology: neonatology questions and controversies. 2nd ed. Philadelphia: Saunders; 2012. p 6.)
By 22 weeks’ gestation 95% of fetal kidneys are detectable.
Fetal GFR slowly increases during fetal life until approximately 36 weeks, when nephrogenesis is complete. Thereafter little increase occurs until birth, at which time there is a dramatic increase in GFR. The increase in GFR with birth is less dramatic in preterm infants ( Fig. 9-3).
Figure 9-3 Development of glomerular filtration rate (GFR) as a function of conceptional age during the last 3 months of gestation and the first month of postnatal life. The shaded area represents the range of normal values. The postnatal increase in GFR observed in preterm () and term neonates () is schematically represented. (Modified from Guignard JP, John EG. Renal function in the tiny, premature infant. Clin Perinatol 1986;13:377.)
8. What are the factors that cause the postnatal increase in GFR?
The answer to this question is complicated. In fact, it is the change in serum [Cr]—not a single value—after birth that is relevant. At birth serum [Cr] is largely a function of maternal serum [Cr]. The subsequent change varies with gestational age. In infants younger than 30 weeks’ gestation, serum [Cr] either does not change or it increases 30% to 40% before declining to the birth level during the first 5 to 8 days of age, then subsequently declines before reaching a steady state by 7 to 10 weeks of age. The duration of the plateau is inversely related to gestational age; the rate of decline is directly related to gestational age. In infants at 30 weeks’ gestation or older, serum [Cr] declines from birth to reach a steady value at 3 to 6 weeks of age. The rate of decline is directly related to gestational age.
12. What are the important differences in the regulation of sodium ion (Na+) and potassium ion (K+) balance?
Potassium uptake by cells is stimulated by the following:
Potassium movement from the intracellular to extracellular space is stimulated by the following:
Their proximal tubular capacity for sodium reabsorption is limited.
Their distal tubular response to aldosterone is diminished ( Fig. 9-4).
Figure 9-4 Sodium balance and the activity of the renin-angiotensin-aldosterone system in 1-week-old newborn infants with gestational ages of 30 to 41 weeks. PA, Plasma aldosterone concentration; PRA, plasma renin activity; UAE, urinary aldosterone excretion. (From Sulyok E, Németh M, Tényi J, et al. Relationship between maturity, electrolyte balance and the function of the renin-angiotension-aldosterone system in newborn infants. Biol Neonate 1979;35:60–5.)
15. If preterm infants have a limited capacity to conserve sodium, is their ability to excrete a sodium load enhanced?
No. Their ability to excrete a sodium load is limited by their low GFR.
16. How does the concentrating capacity of the preterm and term infant compare to that of the adult?
Concentrating ability is limited in infants for several reasons. Protein intake by the infant is used to make new cells during this period of rapid growth, and relatively little nitrogen is diverted to urea. Urea is an important component of the tonicity of the medullary interstitium and the osmolality of urine. Additional factors include (1) the relatively short loops of Henle in the neonatal nephrons that limit the surface area available for equilibration with the interstitium and (2) a high level of prostaglandins that can increase medullary blood flow and “wash out” the medullary concentration gradient. The maximum urine concentration in the preterm infant is approximately 600 mOsm/L, in the full term infant is 800 mOsm/L, and in the adult is 1500 mOsm/L.
17. Preterm infants have a limited capacity to excrete a free water load. Is this because they cannot dilute their urine as much as full-term infants?
A relative paucity of K+ channels in the apical membrane of principal cells in the distal nephron
Lower flow delivery to the distal tubule as the result of lower GFR
Fluid and Electrolyte Management
Ninety-seven percent of infants pass urine in the first 24 hours of life and 100% by 48 hours. During the first 2 days of life, infants urinate two to six times per day ( Table 9-2).
TABLE 9-2
TIME OF FIRST VOID IN 500 INFANTS ∗
∗In 395 term infants, 80 preterm infants, and 25 postterm infants.
Adapted from Clark DA. Time of first void and first stool in 500 newborns. Pediatrics 1977;60:457.
21. Why is the reduction in ECW volume in preterm infants considered physiologic?
22. Which should be used, birth weight or daily weight, to calculate water and sodium requirements during the first week of life?
The clinician should use what the attending physician requests. After the first day of life, however, it is important to understand that it is the absolute fluid and electrolyte intake (milliliters or millimoles per day) relative to that in the previous 8 to 24 hours that is relevant. In other words, should the absolute fluid or electrolyte intake be more or less than it was previously? The answer depends on what fluid and electrolyte balances resulted from the previous intakes and on what water and electrolyte losses are anticipated. There is no magic amount of water per kg/day that is appropriate for all infants, even infants at the same weight, gestational age, postnatal age, and in the same environment. If the infant loses more water (and therefore weight) than you judge to be appropriate and you anticipate that water losses will remain approximately the same, the absolute amount of water (milliliters per day) given should be increased. However, if the current weight is used to calculate fluid requirements, the absolute amount of water administered may be only slightly more or even less than the amount given the day before. For example, an 860-g infant loses 110 g (approximately 13% of birth weight) in the first day of life after receiving 100 mL/kg/day (86 mL/day). You decide this rate of weight loss is too great and increase water intake by 20% to 120 mL/kg/day. Based on the current weight of 750 gm, however, this is only 90 mL/day, which is barely more than that given the previous day. If water losses remain the same, weight loss will be only slightly less over the next 24 hours despite an increase in water intake per kilogram current body weight.
The most important determinants of IWL are gestational age, postnatal age, antenatal steroids, and environment. IWL decreases with increasing gestational and postnatal age ( Fig. 9-5), exposure to antenatal steroids, and increasing ambient humidity.
Figure 9-5 Transdermal loss as a function of gestational and postnatal age in naked, appropriate-for-gestational-age infants in a neutral thermal environment in incubators with 50% ambient humidity. (From Hammarlund K, Sedin G, Strömberg B. Transepidermal water loss in newborn infants. Part VIII: relation to gestational and post-natal age in appropriate and small-for-gestational-age infants. Acta Pediatr Scand 1983;72:721–8.)
24. Why is accurate estimation of IWL so important in estimating fluid administration rate in preterms?
26. Once the fluid administration rate is determined, how can the dextrose concentration necessary to provide a target dextrose administration rate be calculated?
27. Is there a simple way to calculate the dextrose administration rate that will be provided with a given dextrose concentration and administration rate of the intravenous fluid?
28. The specimen used for bedside glucose measurement by point of care (POC) analyzers is whole blood. Is it necessary to “correct” the glucose concentration determined with point of care analyzers to reflect the plasma concentration?
The main route of potassium loss is in the urine. Urine potassium losses are low initially because GFR and urine output are relatively low after birth. Moreover, serum potassium concentration ([K+]) may rise in extremely premature infants even in the absence of exogenous potassium. Therefore potassium should be withheld until it can be ascertained that renal function is normal and, in extremely premature babies, the serum [K+] is normal and not increasing.
31. Baby R is a 22-hour-old, 25-weeks’-gestation male infant in a humidified incubator. He has received 150 mL/kg/day of fluid during the first day of life. Serum sodium concentration ([Na]) is 128 mmol/L. Should sodium intake be increased?
Not necessarily. Serum [Na] is the concentration, not the amount, of sodium in the ECF space. If it is abnormally low, the amount of sodium in the ECF space is “insufficient” for the amount of water in the ECF space. Thus serum [Na] may be low because there is too little extracellular sodium, too much ECW, or both. The most common cause of hyponatremia in neonates in the first 1 or 2 days of life is excessive fluid administration. In such situations free water intake should be restricted. 789101112131415161718192021222324252627282930313233343536
KEY POINTS: FLUIDS AND ELECTROLYTES
1. Like the lung, the premature renal function is immature; there is a diminished capacity to excrete a free water load, to maintain plasma electrolyte homeostasis, to acidify the urine, and to concentrate the urine.
2. All premature neonates lose weight after birth. This results from a physiologic postnatal decrease in ECW volume. However, when more than 10% to 15% of body weight is lost in the first week of life, the possible pathophysiologic process should be considered and investigated.
3. Sodium and potassium should not usually be given on the first day of life, but glucose is necessary. Preterm infants may also require calcium.
Nonoliguric Hyperkalemia in Premature Infants
Hyperkalemia is caused by perturbations in internal or external K+ balance:
Positive external K+ balance caused by either impaired renal potassium excretion or (less commonly) excessive intake. Increased K+ intake of a magnitude sufficiently severe to cause hyperkalemia is usually the result of a dosing error.
When originally reported in the literature in the early 1980s, the prevalence of nonoliguric hyperkalemia ranged from 25% to 50% of infants below 1000 g birth weight or younger than 28 weeks’ gestational age. However, it is much less common now, even in infants younger than 25 weeks’ gestational age. This is probably the result of the increased prevalence of antenatal steroid therapy and more aggressive nutrition, which have been shown to reduce the risk of nonoliguric hyperkalemia.
Nonoliguric hyperkalemia is managed in the following ways:
By antagonizing the arrythmagenic effect of hyperkalemia
0.5 to 1 mEq/kg elemental calcium (1 to 2 mL/kg of 10% calcium gluconate solution) by slow intravenous push
By stimulating cellular uptake of potassium
By increasing renal potassium secretion
Peritoneal dialysis is rarely required except with hyperkalemia caused by renal failure.
40. Is the use of a cation exchange resin (e.g., Kayexalate) an effective and safe way to treat hyperkalemia?
Use of this method to treat hyperkalemia is no longer considered safe and effective.
KEY POINTS: HYPERKALEMIA
1. Nonoliguric hyperkalemia (potassium >6.7 mEq/L in plasma from a nonhemolyzed whole blood specimen) still occurs in extremely premature infants, but the current prevalence is less than originally reported (15% to 50%). This probably results from the increased prevalence of antenatal steroid exposure. Therefore the clinician should be particularly vigilant in checking for nonoliguric hyperkalemia in extremely preterm infants whose mothers have not received antenatal steroids before their birth.
2. Other causes of hyperkalemia of which to be cognizant are oliguric acute renal failure and drugs that inhibit K excretion (e.g., spironolactone and enalapril).
3. Hyperkalemia may be a life-threatening emergency. In this circumstance inhalation treatment with albuterol is most rapidly effective.
Acid–Base Balance
The equation uses pK′ (the apparent pK), to account for the equilibrium between dissolved CO2 and . The pK′ for H2CO3 dissociation in adult human plasma is 6.1.
This has been subject of some debate for some time. However, BE is easier to interpret than serum because it is less dependent on pCO2. When an increase in [H+] is not due to an increase in respiratory acid (i.e., carbonic acid produced from the combination of CO2 and H2O), the added H+ is bound by the buffer anions and base excess falls in direct proportion to the added H+. However, when an increase in [H+] is due to an increase in CO2, serum increases (because it is in equilibrium with CO2) and the other buffer anions decrease in direct proportion; thus BE remains unchanged. Therefore at a pH of 7.4, what serum is normal depends on the measured pCO2 ( Table 9-3).
TABLE 9-3
RELATION OF pCO2 AND SERUM IN ADULTS WHEN pH IS 7.40 IN THE ADULT AND THERE IS NO CHANGE IN TOTAL BUFFER BASE
44. Why is serum lower (and BE mildly negative) in newborns compared with that of the adult under baseline conditions? What serum is considered normal?
The serum in preterm infants is normally 17 ± 1.2 mEq/L, with two standard deviations encompassing values as low as 14.5 mEq/L. During the first week of life, term infants have a serum of 20 ± 2.8 mEq/L. During the first year of life, the serum is still only approximately 22 ± 1.9 mEq/L, compared with 23 ± 1 mEq/L and 26 ± 1 mEq/L in older children and adults.
45. Do infants excrete more or less titratable acid and ammonia per kilogram of body weight compared with older children?
48. In acid–base disorders in human biology, in which body compartment are measurements made? What is the significance of this?
A pCO2 greater than 40 indicates respiratory acidosis; a pCO2 less than 40 indicates respiratory alkalosis.
50. What are the principal mechanisms whereby infants compensate for abnormal acid–base abnormalities?
[/not-level-membership-for-neonatal-and-perinatal-medicine-category]
