[level-membership-for-cardiovascular-category]
Chapter 4 Electrophysiological Testing
Periprocedural Management
Urinary Problems
Urinary retention can occur during lengthy EP procedures, particularly in combination with sedation, fluid administration, and tachycardia-related diuresis. When such situations are anticipated, it is useful to insert a urinary drainage catheter before the procedure.
Anticoagulation
Periprocedural anticoagulation for catheter ablation of persistent AFL or AF is necessary to minimize thromboembolic stroke risk; LA stunning and increased spontaneous echo contrast within the LA can occur following cardioversion or ablation of these arrhythmias. Similarly, patients with mechanical valvular prosthesis require uninterrupted anticoagulation. A perception of increased bleeding risks of invasive procedures in patients taking therapeutic warfarin doses led many operators to adopt a “bridging” strategy of conversion to enoxaparin to allow ablation and subsequent hemostasis to be performed during a pause in anticoagulation.1 This strategy involves discontinuation of warfarin at least 3 to 5 days prior to ablation, and starting heparin or enoxaparin after cessation of warfarin until the evening prior to the ablation procedure. Both enoxaparin and warfarin are then reinitiated within 4 to 6 hours after ablation and sheath removal, and enoxaparin is maintained until an optimal INR level is achieved.
An alternative strategy of uninterrupted oral anticoagulation during these procedures was found to be safe and feasible and more cost-effective for ablation of typical AFL or AF, without increasing hemorrhagic complications. However, INR testing is required on the day of the procedure to confirm therapeutic anticoagulation. Transesophageal echocardiography is performed in patients with a subtherapeutic INR in the 3 weeks prior to the procedure. Another potential advantage of this strategy is the ability to reverse warfarin effects rapidly in the setting of a bleeding complication (e.g., pericardial bleeding) by using synthetic clotting factor concentrates or fresh frozen plasma infusion, whereas enoxaparin effects remain difficult to reverse; protamine has only a partial effect on its action. This anticoagulation strategy can potentially be used routinely for EP studies and ablation of right-sided arrhythmias for which anticoagulation is required.2–4
Catheterization Techniques
Electrode Catheters
Electrode catheters come in different sizes (3 to 8 Fr). In adults, sizes 5, 6, and 7 Fr catheters are the most commonly used. Recordings derived from electrodes can be unipolar (one pole) or bipolar (two poles). The electrodes are typically 1 to 2 mm in length. The interelectrode distance can range from 1 to 10 mm or more. The greater the interelectrode spacing is on a conventional bipolar electrode, the more the recorded electrogram resembles a unipolar recording. Catheters with a 2- or 5-mm interelectrode distance are most commonly used.5
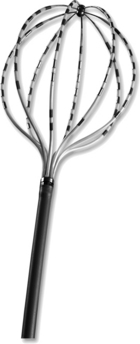
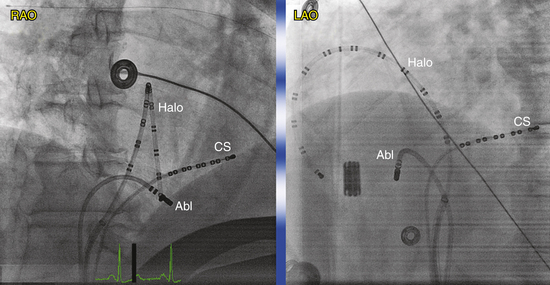
Many multipolar electrode catheters have been developed to facilitate placement of the catheter in the desired place and to fulfill various recording requirements. Bipolar or quadripolar electrode catheters are used to record and pace from specific sites of interest within the atria or ventricles. These catheters come with a variety of preformed distal curve shapes and sizes (Fig. 4-1). Multipolar recording electrode catheters are placed within the coronary sinus (CS) or along the crista terminalis in the right atrium (RA). The Halo catheter is a multipolar catheter used to map atrial electrical activity around the tricuspid annulus during atrial tachycardias, as well as for locating right-sided bypass tracts (BTs) (Fig. 4-2). A decapolar catheter with a distal ring configuration (Lasso catheter) is used to record electrical activity from the pulmonary vein (PV; Fig. 4-3). Basket catheters capable of conforming to the chamber size and shape have also been used for mapping atrial and ventricular arrhythmias (Fig. 4-4). Special catheters are also used to record LA and left ventricular (LV) epicardial activity from the CS branches.5
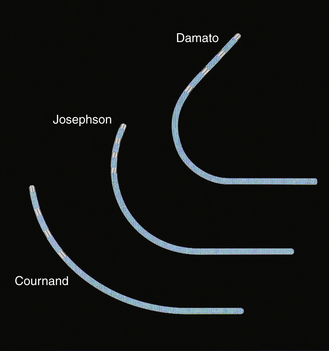
FIGURE 4-1 Multipolar electrode catheters with different preformed curve shapes.
(Courtesy of Boston Scientific, Boston.)
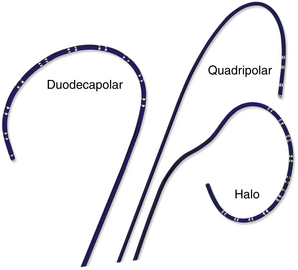
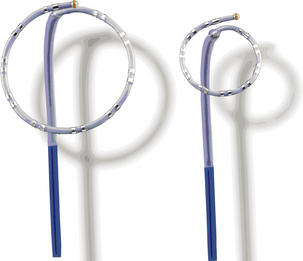
FIGURE 4-3 Lasso catheter with two different loop sizes.
(Courtesy of Biosense Webster, Inc., Diamond Bar, Calif.; www.BiosenseWebster.com.)
Catheters can have a fixed or deflectable tip. Steerable catheters allow deflection of the tip of the catheter in one or two directions in a single plane; some of these catheters have asymmetrical bidirectional deflectable curves (Fig. 4-5).
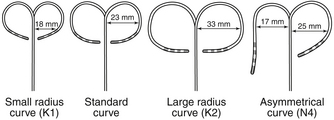
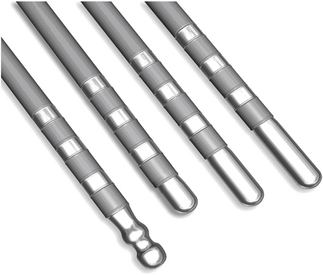
FIGURE 4-5 Deflectable multipolar electrode catheters with different curve sizes and shapes.
(Courtesy of Boston Scientific, Boston.)
Ablation catheters have tip electrodes that are conventionally 4 mm long and are available in sizes up to 10 mm in length (Fig. 4-6). The larger tip electrodes on ablation catheters reduce the resolution of a map obtained using recordings from the distal pair of electrodes.
Catheter Positioning
The percutaneous technique is used almost exclusively. RA, His bundle (HB), and right ventricular (RV) electrograms are most commonly recorded using catheters inserted via a femoral vein. Some other areas (e.g., the CS) are more easily reached through the superior vena cava (SVC), although the femoral approach can be adequate in most cases. Insertion sites can also include the antecubital, jugular, and subclavian veins. Femoral arterial access can be required for mapping of the LV or mitral annulus or for invasive blood pressure monitoring. Occasionally, an epicardial approach is required to map and ablate certain VTs and BTs as well as the sinus node. For this purpose, the epicardial surface is accessed via the CS and its branches or percutaneously (subxiphoid puncture).6
Fluoroscopy is conventionally used to guide intracardiac positioning of the catheters. It is important to remember that catheters can be withdrawn without fluoroscopy, but they should always be advanced under fluoroscopy guidance. More recently, newer navigation systems have been tested to guide catheter positioning in an effort to limit radiation exposure (see Chap. 6).
Transcaval Approach
The modified Seldinger technique is used to obtain multiple venous accesses. The femoral approach is most common, but the subclavian, internal jugular, or brachial approaches may be used, most often for the placement of a catheter in the CS.6
Right AtriAL Catheter
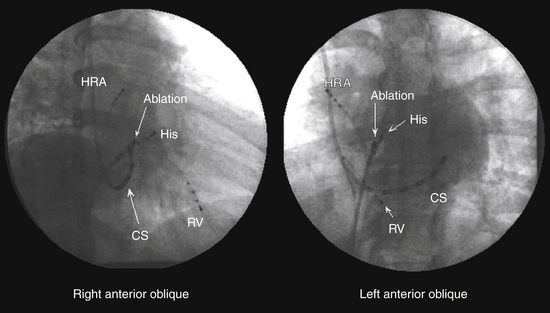
A fixed-tip, 5 or 6 Fr quadripolar electrode catheter is typically used. The RA may be entered from the IVC or SVC. The femoral veins are the usual entry sites. Most commonly, stimulation and recording from the RA is performed by placing the RA catheter tip at the high posterolateral wall at the SVC-RA junction in the region of the sinus node or in the RA appendage (Fig. 4-7).
Right VentricULAR Catheter
A fixed-tip, 5 or 6 Fr quadripolar electrode catheter is typically used. All sites in the RV are accessible from any venous approach. The RV apex is most commonly chosen for stimulation and recording because of stability and reproducibility (see Fig. 4-7).
His Bundle Catheter
A fixed- or deflectable-tip, 6 Fr quadripolar electrode catheter is typically used. The catheter is passed via the femoral vein into the RA and across the tricuspid annulus until it is clearly in the RV (under fluoroscopic monitoring, using the right anterior oblique [RAO] view; see Fig. 4-7). It is then withdrawn across the tricuspid orifice while maintaining a slight clockwise torque for good contact with the septum until a His potential is recorded. Initially, a large ventricular electrogram can be observed, then, as the catheter is withdrawn, the right bundle branch (RB) potential can appear (manifesting as a narrow spike less than 30 milliseconds before the ventricular electrogram). When the catheter is further withdrawn, the atrial electrogram appears and grows larger. The His potential usually appears once the atrial and ventricular electrograms are approximately equal in size and is manifest as a biphasic or triphasic deflection interposed between the local atrial and ventricular electrograms. If the first pass was unsuccessful, the catheter should be passed again into the RV and withdrawn with a slightly different rotation. If, after several attempts, a His potential cannot be recorded using a fixed-tip catheter, the catheter should be withdrawn and reshaped, or it may be exchanged with a deflectable-tip catheter. Once the catheter is in place, a stable recording can usually be obtained. Occasionally, continued clockwise torque on the catheter shaft is required to obtain a stable HB recording, which can be accomplished by looping the catheter shaft remaining outside the body and fixing the loop by placing a couple of towels on it, or by twisting the connection cable in the opposite direction so that it maintains a gentle torque on the catheter.
Coronary Sinus Catheter
The standardized RAO and left anterior oblique (LAO) fluoroscopic views are used to guide placement of catheters in the CS. Although the CS cannot be directly visualized with standard fluoroscopy, the epicardial fat found in the posteroseptal space just posterior to the CS os can be visualized as a characteristic radiolucency on cine fluoroscopy in the RAO projection, where the cardiac and diaphragmatic silhouettes meet.7
When cannulating the CS from the SVC approach, the LAO view is used, the catheter tip is directed to the left of the patient, and the catheter is advanced with some clockwise torque to engage the CS os; electrodes should resemble rectangles rather than ovals when the catheter tip is properly oriented to advance into the CS. Once the CS os is engaged, the catheter is further advanced gently into the CS, so that the most proximal electrodes lie at the CS os (see Fig. 4-7).
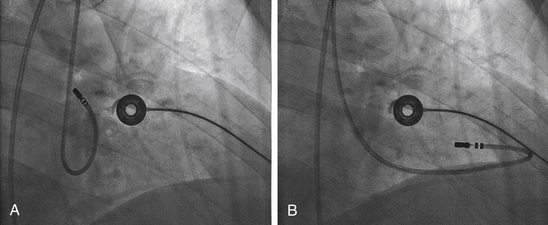
During cannulation of the CS from the IVC approach, the tip of the catheter is first placed into the RV, in the RAO fluoroscopy view, and flexed downward toward the RV inferior wall (Video 2  ). Subsequently, the catheter is withdrawn until it lies at the inferoseptal aspect of the tricuspid annulus. In the LAO or RAO view, the catheter is then withdrawn gently with clockwise rotation until the tip of the catheter drops into the CS os. Afterward, the catheter is advanced into the CS concomitantly with gradual release of the catheter curve (Fig. 4-8). Alternatively, the tip of the catheter is directed toward the posterolateral RA wall and advanced with a tight curve to form a loop in the RA, in the LAO view, with the tip directed toward the inferomedial RA. The tip is then advanced with gentle up-down, right-left manipulation using the LAO and RAO views to cannulate the CS. In the RAO view, the atrioventricular (AV) fat pad (containing the CS) appears as more radiolucent than surrounding heart tissue.
Transaortic Approach
This approach is generally used for mapping the LV and mitral annulus (for VT and left-sided BTs). The right femoral artery is most commonly used. The mapping-ablation catheter is passed to the descending aorta, and, in this position, a tight J curve is formed with the catheter tip before passage to the aortic root to minimize catheter manipulation in the arch. In a 30-degree RAO view, the curved catheter is advanced through the aortic valve with the J curve opening to the right, so the catheter passes into the LV oriented anterolaterally (Fig. 4-9; Video 3  ). The straight catheter tip must never be used to cross the aortic valve because of the risk of leaflet damage or perforation and also because the catheter tip can slip into the left or right coronary artery or a coronary bypass graft, thus mimicking entry to the LV and causing damage to these structures.
Transseptal Approach
Mapping and ablation in the LA are performed through a transseptal approach. Knowledge of septal anatomy and its relationship with adjacent structures is essential to ensure safe and effective access to the LA. Many apparent septal structures are not truly septal. The true interatrial septum is limited to the floor of the fossa ovalis, the flap valve, and the anteroinferior rim of the fossa. Therefore, the floor of the fossa (with an average diameter of 18.5 ± 6.9 mm [vertically] and 10.0 ± 2.4 mm [horizontally] and 2 mm thickness) is the target for atrial septal crossing. The area between the superior border of the fossa and the mouth of the SVC is an infolding of the atrial wall filled with adipose tissue. Although this area is often referred to as the septum secundum, it is not really a true septum, and puncture in this region would lead to exiting of the heart. The infolded groove ends at the superior margin (superior rim) of the fossa ovalis. Anterior and superior to the fossa ovalis, the RA wall overlies the aortic root. Advancing the transseptal needle in this area can puncture the aorta.
 ).
). ). However, the usefulness of transesophageal echocardiography is limited by the fact that the probe obstructs the fluoroscopic field, and it is impractical in the nonanesthetized patient. ICE, which provides similar information on septal anatomy, can be used for the conscious patient and does not impede fluoroscopy.
Fluoroscopy-Guided Transseptal Catheterization
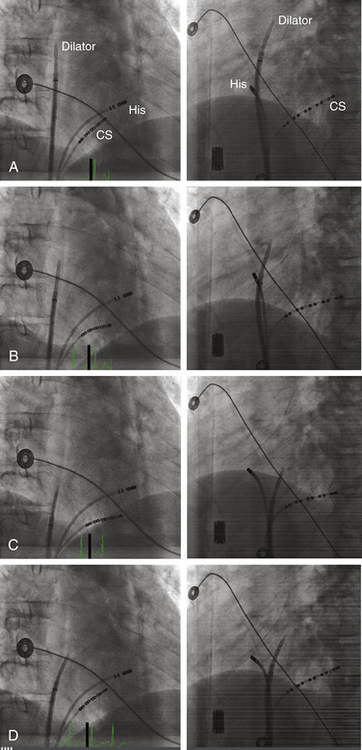
The Brockenbrough needle is advanced into the dilator until the needle tip is within 1 to 2 cm of the dilator tip. The needle tip must be kept within the dilator at all times, except during actual septal puncture. The curves of the dilator, sheath, and needle should be aligned so that they are all in agreement and not contradicting each other. The sheath, dilator, and needle assembly is then rotated leftward and posteriorly (usually with the Brockenbrough needle arrow pointing at the 3 to 6 o’clock position relative to its shaft) and retracted caudally as a single unit (while maintaining the relative positions of its components) to engage the tip of the dilator into the fossa ovalis. Under fluoroscopy monitoring (30-degree LAO view), the dilator tip moves slightly leftward on entering the RA and then leftward again while descending below the aortic root. A third abrupt leftward movement (“jump”) below the aortic root indicates passage over the limbus into the fossa ovalis (Fig. 4-10). This jump generally occurs at the level of the HB region (marked by an EP catheter recording the HB potential). If the sheath and dilator assembly is pulled back farther than intended (i.e., below the level of the fossa and HB region), the needle should be withdrawn and the guidewire placed through the dilator into the SVC. The sheath and dilator assembly is then advanced over the guidewire into the SVC and repositioning attempted, as described earlier. The sheath and dilator assembly should never be advanced without the guidewire at any point during the procedure.
Several fluoroscopic markers are used to confirm the position of the dilator tip at the fossa ovalis. As noted, an abrupt leftward movement (jump) of the dilator tip below the aortic knob is observed as the tip passes under the muscular atrial septum onto the fossa ovalis (see Video 4  ). In addition, the posterior extent of the aortic root can be marked by a pigtail catheter positioned through the femoral artery in the noncoronary cusp or by the HB catheter (recording a stable proximal HB potential), which lies at the level of the fibrous trigone opposite and caudal to the noncoronary aortic cusp. When the dilator tip lies against the fossa ovalis, it is directed posteroinferiorly to the proximal HB electrode (or pigtail catheter) in the RAO view and to the left of the proximal HB electrode (or pigtail catheter) in the LAO view (see Fig. 4-10). Another method that can be used to ensure that the tip is against the fossa ovalis is injection of 3 to 5 mL of radiopaque contrast through the Brockenbrough needle to visualize the interatrial septum. The needle tip then can be seen tenting the fossa ovalis membrane with small movements of the entire transseptal apparatus. Typically, septal staining remains visible after contrast injection, which allows for real-time septal visualization while monitoring the pressure during transseptal puncture.
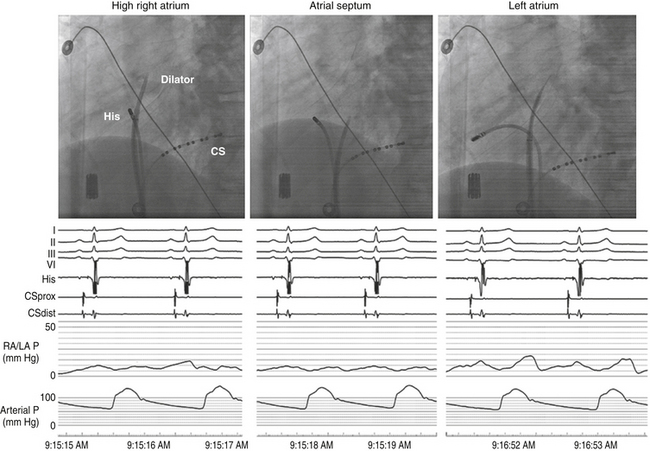
Once the position of the dilator tip is confirmed at the fossa ovalis, the needle, dilator, and sheath assembly is pushed slightly against the interatrial septum, and the needle is then briskly advanced to protrude outside the dilator in the LAO view during continuous pressure monitoring. If excessive force is applied without a palpable “pop” to the fossa, then the Brockenbrough needle likely is not in proper position. After passage through the fossa ovale and before advancing the dilator and sheath, an intraatrial position of the needle tip within the LA, rather than the ascending aorta or posteriorly into the pericardial space, needs to be confirmed. Recording an LA pressure waveform from the needle tip confirms an intraatrial location (Fig. 4-11). An arterial pressure waveform indicates intraaortic position of the needle. Absence of a pressure wave recording can indicate needle passage into the pericardial space or sliding up and not puncturing through the atrial septum. A second method is injection of contrast through the needle to assess the position of the needle tip. Opacification of the LA (rather than the pericardium or the aorta) verifies the successful transseptal access. Alternatively, passing a 0.014-inch floppy guidewire through the Brockenbrough needle into a left-sided PV (beyond the cardiac silhouette in the LAO fluoroscopy view) helps verify that needle tip position is within the LA (see Video 4  ). If the guidewire cannot be advanced beyond the fluoroscopic border of the heart, pericardial puncture should be suspected. In addition, aortic puncture should be suspected if the guidewire seems to follow the course of the aorta. In these situations, contrast should be injected to assess the position of the Brockenbrough needle before advancing the transseptal dilator. Sometimes, the guidewire enters the LA appendage rather than a PV; in this setting, a clockwise torque of the sheath and dilator assembly can help direct the guidewire posteriorly toward the ostium of the left superior or left inferior PV.
Once the position of the needle tip is confirmed to be in the LA, both the sheath and dilator are advanced as a single unit over the needle by using one hand while fixing the Brockenbrough needle in position with the other hand (to prevent any further advancement of the needle). Preferably, the sheath and dilator assembly is advanced into the LA over a guidewire placed distally into a left-sided PV, which helps direct the path of the assembly as it enters the LA and minimize the risk of inadvertent puncture of the lateral LA wall. Once the dilator tip is advanced into the LA over the needle tip, the needle and dilator are firmly stabilized as a unit—to prevent any further advancement of the needle and dilator—and the sheath is advanced over the dilator into the LA. Once the transseptal sheath tip is within the LA, the dilator and needle are withdrawn slowly during continuous flushing through the needle or while suction is maintained through a syringe placed on the sheath side port to minimize the risk of air embolism and while fixing the sheath with the other hand to prevent dislodgment outside the LA. The sheath should be aspirated until blood appears without further bubbles; this usually requires aspiration of approximately 5 mL. The sheath is then flushed with heparinized saline at a flow rate of 3 mL/min during the entire procedure.
Intracardiac Echocardiography–Guided Transseptal Catheterization
Two types of ICE imaging systems are currently available, the electronic phased-array ultrasound catheter and the mechanical ultrasound catheter.8 The electronic phased-array ultrasound catheter sector imaging system (AcuNav, Siemens Medical Solutions, Malvern, Pa.) uses an 8 or 10 Fr catheter that has a forward-facing 64-element vector phased-array transducer scanning in the longitudinal plane. The catheter has a four-way steerable tip (160-degree anteroposterior or left-right deflections). The catheter images a sector field oriented in the plane of the catheter. The mechanical ultrasound catheter radial imaging system (Ultra ICE, EP Technologies, Boston Scientific, San Jose, Calif.) uses a 9-MHz catheter-based ultrasound transducer contained within a 9 Fr (110-cm length) catheter shaft. It has a single rotating crystal ultrasound transducer that images circumferentially for 360 degrees in the horizontal plane. The catheter is not freely deflectable.
When using the mechanical radial ICE imaging system, a 9 Fr sheath, preferably a long, preshaped sheath, for the ICE catheter is advanced via a femoral venous access. To enhance image quality, all air must be eliminated from the distal tip of the ICE catheter by flushing vigorously with 5 to 10 mL of sterile water. The catheter then is connected to the ultrasound console and advanced until the tip of the rotary ICE catheter images the fossa ovalis. Satisfactory imaging of the fossa ovalis for guiding transseptal puncture is viewed from the mid-RA (Fig. 4-12).8
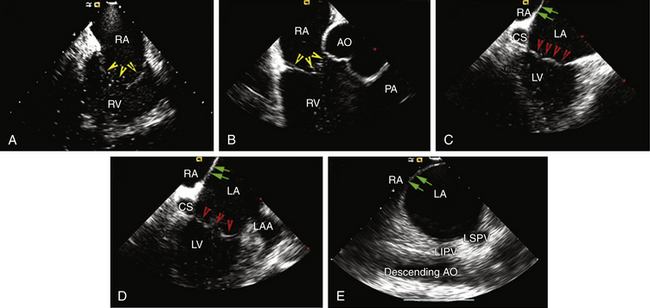
The AcuNav ICE catheter is introduced under fluoroscopy guidance through a 23-cm femoral venous sheath. Once the catheter is advanced into the mid-RA with the catheter tension controls in neutral position (the ultrasound transducer oriented anteriorly and to the left), the RA, tricuspid valve, and RV are viewed. This is called the home view (Fig. 4-13A; see Video 5  ). Gradual clockwise rotation of a straight catheter from the home view allows sequential visualization of the aortic root and the pulmonary artery (see Fig. 4-13B), followed by the CS, the mitral valve, the LA appendage orifice, and a cross-sectional view of the fossa ovalis (see Fig. 4-13C and D). The mitral valve and interatrial septum are usually seen in the same plane as the LA appendage. Posterior deflection or right-left steering of the imaging tip in the RA, or both, is occasionally required to optimize visualization of the fossa ovalis; the tension knob (lock function) can then be used to hold the catheter tip in position. Further clockwise rotation beyond this location demonstrates images of the left PV ostia (see Fig. 4-13E). The optimal ICE image to guide transseptal puncture demonstrates adequate space behind the interatrial septum on the LA side and clearly identify adjacent structures, but it does not include the aortic root because it would be too anterior for the interatrial septum to be punctured safely. In patients with an enlarged LA, a cross-sectional view that includes the LA appendage is also optimal if adequate space exists behind the atrial septum on the LA side.8
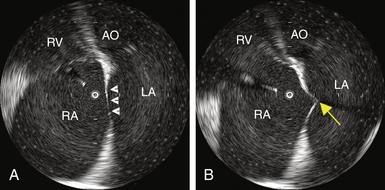
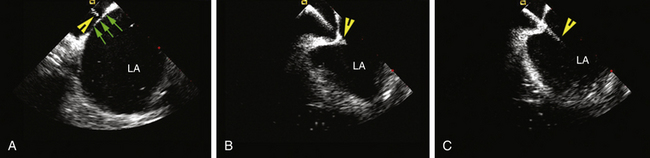
The sheath, dilator, and needle assembly is introduced into the RA, and the dilator tip is positioned against the fossa ovale, as described earlier. Before advancing the Brockenbrough needle, continuous ICE imaging should direct further adjustments in the dilator tip position until ICE confirms that the tip is in intimate contact with the middle of the fossa, confirms proper lateral movement of the dilator toward the fossa, and excludes inadvertent superior displacement toward the muscular septum and aortic valve. With further advancement of the dilator, ICE demonstrates tenting of the fossa (Fig. 4-14 and see Fig. 4-12). If the distance from the tented fossa to the LA free wall is small, minor adjustments in the dilator tip position can be made to maximize the space. The Brockenbrough needle is then advanced. With successful transseptal puncture, a palpable pop is felt, and sudden collapse of the tented fossa is observed (see Fig. 4-14). Advancement of the needle is then immediately stopped. Saline infusion through the needle is visualized on ICE as bubbles in the LA, thus confirming successful septal puncture (see Video 6  ). With no change in position of the Brockenbrough needle, the transseptal dilator and sheath are advanced over the guidewire into the LA, as described earlier.
Alternative Methods for Difficult Transseptal Catheterization
In some cases, the conventional approach using a Brockenbrough needle sheath fails to pierce the septum because of the presence of a small fossa area, a thick interatrial septum, fibrosis and scarring of the septum from previous interventions, or an aneurysmal septum with excessive laxity. Applying excessive force to the needle, dilator, and sheath assembly against a resistant septum (which can be seen as bending and buckling of the assembly in the RA) can lead to building pressure of the needle tip on the septum, which can potentially lead to an uncontrolled sudden jump of the assembly once across the stiff or fibrotic fossa ovalis, thus perforating the opposing lateral LA wall. Similarly, excessive tenting of the interatrial septum (beyond halfway into the LA) can bring it in close proximity to the lateral LA wall, so that the needle can potentially puncture the lateral LA wall once across the septum. Some of these difficulties can sometimes be overcome by manual reshaping of the curvature of the Brockenbrough needle tip, applying slight rotation on the needle and sheath assembly to puncture a different point on the fossa ovalis, using a sharper transseptal needle type (BRK-1 extra sharp), or utilizing a 0.014-inch, sharp-tipped, J-shaped transseptal guidewire (Safe Sept, Pressure Products, Inc., San Pedro, Calif.).9–13
Other techniques to facilitate transseptal puncture include radiofrequency (RF) perforation of the fossa ovalis and the application of pulses of electrosurgical cautery or RF energy to the proximal end of the Brockenbrough needle. Once the position of the dilator tip is confirmed at the fossa ovalis (under ICE guidance), the needle is advanced beyond the tip of the dilator in contact with the septum until resistance is met. RF energy (5 to 30 W for 1 to 11 seconds) can be applied through a conventional ablation catheter electrode brought manually in contact with the proximal hub of the transseptal needle. Typically, the fossa is punctured almost instantaneously (within 1 to 2 seconds) following RF application. Alternatively, electrosurgical cautery (set to 15 to 20 W for a 1- to 2-second pulse of cut-mode cautery) is applied to the proximal hub of the needle as its tip is advanced out of the dilator. Importantly, the cautery should be initiated on the needle handle prior to pushing the needle tip beyond the dilator tip to help minimize the power needed to puncture the septum, and it should be stopped as soon as the needle is pushed out fully.14–16
Additionally, a specialized, electrically insulated RF-powered needle (Baylis Medical Company, Inc., Montreal) has been developed to facilitate transseptal puncture. The needle is connected to a proprietary RF generator (RFP-100 RF Puncture Generator, Baylis Medical), which delivers RF energy to the rounded, closed tip of the needle positioned at the interatrial septum. Once septal tenting is visualized on the ICE, RF energy is applied at 10 W for 2 seconds. The RF perforation generators apply a higher voltage for short durations, resulting in a high-energy electric field and an almost instantaneous temperature rise to 100°C, leading to steam popping and septal perforation with minimal collateral tissue damage. In contrast, conventional RF generators deliver a higher power with a lower voltage and impedance range for longer periods of time, with resulting thermal destruction of the local tissue around the needle tip, rather than perforation.17,18
These methods help minimize pressure application to the needle as it crosses the septum and tenting of the septum, which can potentially reduce the chances of sudden advancement through the lateral LA as the needle crosses the septum. Nonetheless, the powered needle can potentially be more traumatic at the puncture site than a standard needle, and it is possible that the transseptal puncture site created with a powered needle is less likely to close spontaneously. Similarly, inadvertent cardiac perforation occurring in the setting of powered needles can potentially be associated with greater consequences. Whether RF is more likely to cause a thrombus at the puncture site compared with a standard needle is unknown.17–19
Complications of Atrial Transseptal Puncture
Injury to cardiac and extracardiac structures is the most feared complication. Because of its stiffness and large caliber, the transseptal dilator should never be advanced until the position of the Brockenbrough needle is confirmed with confidence. Advancing the dilator into an improper position can be fatal. Therefore, many operators recommend the use of ICE-guided transseptal puncture, especially for patients with normal atrial size.19
Another potential complication is embolism of thrombus or air. To avoid air embolism, catheters must be advanced and withdrawn slowly so as not to introduce air into the assembly. Sheaths must be aspirated with a syringe on a stopcock to the amount of their volume (e.g., an 8 Fr sheath contains 5 mL when filled) to remove any retained air. Thromboembolic complications can be avoided by flushing all sheaths and guidewire with heparinized saline and maintaining the ACT at longer than 300 seconds. In addition, a guidewire should not be left in the LA for more than 1 minute, especially if no systemic heparin has been administered. Administration of heparin before, rather than after, the atrial septal puncture can also help reduce thromboembolism.19
In patients with atrial septal defect closure devices, puncture is preferably performed at the portion of the septum located inferior and posterior to the closure device and not through the device itself. In patients with a septal stitch or pericardial or Dacron patch, puncture can be achieved through the thickened septum or the patch. However, transseptal access is typically not achievable through a Gore-Tex patch (W.L. Gore & Associates, Flagstaff, Ariz.) because of its resistant texture; instead, puncture can be performed directly through neighboring native interatrial tissue. When the patch is wide, sufficient free septal tissue for transseptal puncture may not be available, in which setting transseptal access to the LA may not be feasible.19,20
Epicardial Approach
Coronary veins can be used to perform epicardial mapping, but manipulation of the mapping catheter is limited by the anatomical distribution of these vessels. Therefore, the subxiphoid percutaneous approach to the epicardial space is the only technique currently available that allows extensive and unrestricted mapping of the epicardial surface of both ventricles, and it has been used most commonly for VT mapping and ablation. The epicardial approach for mapping and ablation is discussed in Chapter 27.6
Baseline Measurements
Intracardiac Electrograms
Whereas the surface ECG records a summation of the electrical activity of the entire heart, intracardiac electrograms recorded by the electrode catheter represent only the electrical activity (phase 0 of the action potential) of the local cardiac tissue in the immediate vicinity of the catheter’s electrodes. Cardiac electrograms are generated by the potential (voltage) differences recorded at two recording electrodes during the cardiac cycle. All clinical electrogram recordings are differential recordings from one source that is connected to the anodal (positive) input of the recording amplifier and a second source that is connected to the cathodal (negative) input.21
Analog Versus Digital Recordings
Intracardiac electrograms are recorded with amplifiers that have high-input impedances (more than 1010 Ω), to decrease unwanted electrical interference and ensure high-quality recordings.21 Analog recording systems directly amplify the potential from the recording electrodes, plot the potential on a display oscilloscope, and write it to recording paper or store it on magnetic tape, or both. Analog systems have largely been replaced by digital recording systems that use an analog to digital (A/D) converter that converts the amplitude of the potential recorded at each point in time to a number that is stored.
The quality of digital data is influenced by the sampling frequency and precision of the amplitude measurement.21 The most common digital recording systems sample the signal approximately every 1 millisecond (i.e., 1000 Hz), which is generally adequate for practical purposes of activation mapping. However, higher sampling frequencies can be required for high-quality recording of high-frequency, rapid potentials that can originate from the Purkinje system or areas of infarction. The faster sampling places greater demands on the computer processor and increases the size of the stored data files.
Unipolar Recordings
A unipolar electrogram is the voltage difference recorded between an intracardiac electrode in close association with cardiac tissue and a distant indifferent (reference) electrode patch applied to the body surface (so that the indifferent electrode has little or no cardiac signal). The precordial ECG leads, for example, are unipolar recordings that use an indifferent electrode created by connecting the arms and left leg electrodes through high-impedance resistors.22
By convention, the exploring electrode in contact with the cardiac tissue is connected to the positive input of the recording amplifier. In this configuration, an approaching wavefront creates a positive deflection that quickly reverses itself as the wavefront passes directly under the electrode, thus generating an RS complex. In normal homogeneous tissue, the maximum negative slope (dV/dt) of the signal coincides with the arrival of the depolarization wavefront directly beneath the electrode, because the maximal negative dV/dt corresponds to the maximum sodium (Na+) channel conductance; Fig. 4-15). This is true for filtered and unfiltered unipolar electrograms.21,23
The unfiltered unipolar recordings provide information about the direction of impulse propagation; positive deflections (R waves) are generated by propagation toward the recording electrode, and negative deflections (QS complexes) are generated by propagation away from the electrode. Therefore, a wavefront of depolarization traveling past a unipolar electrode results in a biphasic electrogram (positive then negative) representing the approach and recession of the activation wavefront.22
Unipolar recordings also allow pacing and recording at the same location while eliminating a possible anodal contribution to depolarization that is sometimes seen with bipolar pacing at high output.21 However, one of the disadvantages of unipolar recording is the inability to record an undisturbed electrogram during or immediately after pacing.
The major disadvantage of unipolar recordings is that they contain substantial far-field signals generated by depolarization of tissue remote from the recording electrode, because the unipolar electrode records a potential difference between widely spaced electrodes.23 Noise can be reduced by using an indifferent electrode in the IVC. The unipolar electrograms are generally unfiltered (0.05 to 300 Hz or more), but are usually filtered at settings comparable to those of bipolar electrograms (10 to 40 to 300 Hz or more) when an abnormal tissue (scars or infarct areas) is studied, where local electrograms can have very low amplitude and can be masked by larger far-field signals. Filtering the unipolar electrograms can help eliminate far-field signals; however, the filtered unipolar recordings lose the ability to provide directional information.
Bipolar Recordings
Bipolar recordings are obtained by connecting two electrodes that are exploring the area of interest to the recording amplifier. At each point in time, the potential generated is the sum of the potential from the positive input and the potential at the negative input. The potential at the negative input is inverted; this is subtracted from the potential at the positive input so that the final recording is the difference between the two.21
Unlike unipolar recordings, bipolar electrodes with short interpolar distances are relatively unaffected by far-field events. The bipolar electrogram is simply the difference between the two unipolar electrograms recorded at the two poles. Because the far-field signal is similar at each instant in time, it is largely subtracted out, thus leaving the local signal. Therefore, compared with unipolar recordings, bipolar recordings provide an improved signal-to-noise ratio, and high-frequency components are more accurately seen.6,23
Although local activation is less precisely defined, in a homogeneous sheet of tissue the initial peak (or nadir) of a filtered (10 to 40 to 300 Hz or more) bipolar recording coincides with depolarization beneath the recording electrode and corresponds to the maximal negative dV/dt of the unipolar recording (see Fig. 4-15).
Several factors can affect bipolar electrogram amplitude and width, including conduction velocity (the greater the velocity, the higher the peak amplitude of the filtered bipolar electrogram), the mass of the activated tissue, the distance between the electrode and the propagating wavefront, the direction of propagation relative to the bipoles, the interelectrode distance, the amplifier gain, and other signal-processing techniques that can introduce artifacts. To acquire true local electrical activity, a bipolar electrogram with an interelectrode distance of less than 1 cm is desirable.23
The direction of wavefront propagation cannot be reliably inferred from the morphology of the bipolar signal. Moreover, bipolar recordings do not allow simultaneous pacing and recording from the same location. To pace and record simultaneously in bipolar fashion at endocardial sites as close together as possible, electrodes 1 and 3 of the quadripolar mapping catheter are used for bipolar pacing, and electrodes 2 and 4 are used for recording.23
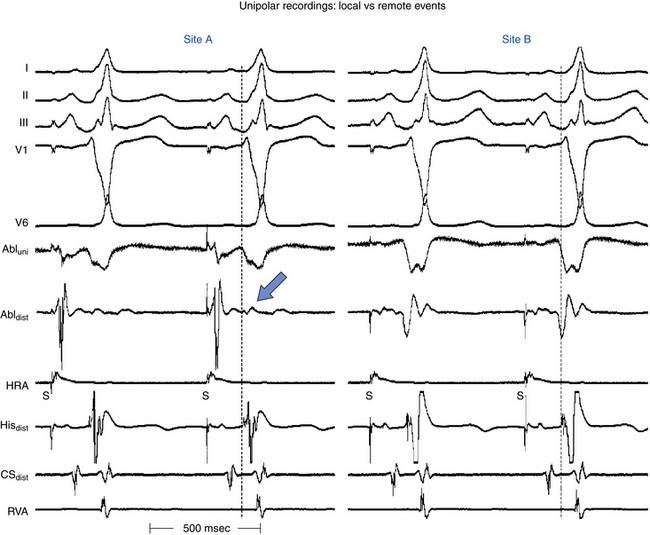
The differences in unipolar and bipolar recordings can be used to assist in mapping by simultaneously recording bipolar and unipolar signals from the mapping catheter.21 Although bipolar recordings provide sufficient information for most mapping purposes in clinical EP laboratories, simultaneous unipolar recordings can provide an indication of the direction of wavefront propagation and a more precise measure of the timing of local activation.23
Signal Filtering
The surface ECG is usually filtered at 0.1 to 100.0 Hz. The bulk of the energy is in the 0.1- to 20.0-Hz range. Because of interference from alternating current (AC), muscle twitches, and similar relatively high-frequency interference, it is sometimes necessary to record the surface ECG over a lower frequency range or to use notch filters.6
High-Pass Filtering
For bipolar electrograms, high-pass filters with corner frequencies between 10 and 50 Hz are commonly used. Filtering can distort the electrogram morphology and reduce its amplitude. The bipolar signal becomes more complex, and additional peaks are introduced. In general, high-pass filtering can be viewed as differentiating the signal, so that the height of the signal is proportional to the rate of change of the signal, rather than only the amplitude.22
Unipolar signals are commonly filtered at 0.05 to 0.5 Hz to remove baseline drift. Filtering at higher corner frequencies (e.g., 30 Hz) alters the morphology of the signal so that the morphology of the unipolar signal is no longer an indication of the direction of wavefront propagation and the presence or absence of a QS complex cannot be used to infer proximity to the site of earliest activation. However, filtering the unipolar signal does not affect its usefulness as a measure of the local activation time.5 As mentioned earlier, during mapping of areas with infarcts or scars, where local electrograms can have very low amplitude and can be masked by larger far-field signals, high-pass filtering of a unipolar signal (at 30 Hz) can help reduce the far-field signal and improve detection of the lower amplitude local signals.22
Low-Pass Filtering
Low-pass filters attenuate frequencies that are faster than the specified corner frequency (usually 250 to 500 Hz). This approach is useful for reducing high-frequency noise without substantially affecting electrograms recorded with clinical systems because most of the signal content is lower than 300 Hz.22
Timing of Local Events
As noted, with an unfiltered unipolar electrogram, a wavefront of depolarization that is propagating toward the exploring electrode generates a positive deflection (an R wave). As the wavefront reaches the electrode and propagates away, the deflection sweeps steeply negative. This rapid reversal constitutes the intrinsic deflection of the electrogram and represents the timing of the most local event (i.e., at the site of the electrode). The maximum negative slope (dV/dt) of the signal coincides with the arrival of the depolarization wavefront directly beneath the electrode (see Fig. 4-15).22
Filtering the unipolar signal does not affect its usefulness as a measure of the local activation time. The slew rate or dV/dt of the filtered electrogram is so rapid in normal heart tissue that the difference between the peak and the nadir of the deflection is 5 milliseconds or less. Identification of the local event is therefore easy with filtered or unfiltered electrograms in normal tissue. On the other hand, diseased myocardium can conduct very slowly with fractionated electrograms, and this makes local events harder to identify.
To acquire true local electrical activity, a bipolar electrogram with an interelectrode distance of less than 1 cm is preferable. Smaller interelectrode distances record increasingly local events. In normal homogeneous tissue, the initial peak of a filtered (30 to 300 Hz or more) bipolar recording coincides with depolarization beneath the recording electrode and corresponds to the maximal negative dV/dt of the unipolar recording (see Fig. 4-15). However, in the setting of complex multicomponent bipolar electrograms, such as those with marked fractionation and prolonged duration seen in regions with complex conduction patterns, determination of local activation time becomes problematic.6
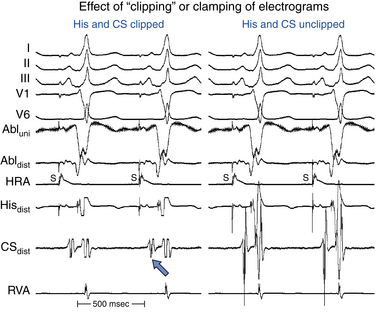
When the intracardiac electrogram of interest is small relative to the size of surrounding electrograms (e.g., His deflection), and the gain must be markedly increased to produce a measurable deflection, clipping the signals can help eliminate the highly amplified surrounding signals to allow concentration on the deflection of interest (Fig. 4-16). It is important to recognize, however, that clippers eliminate the ability to determine the amplitude and timing of the intrinsic deflection (local timing) of the signals being clipped.5
Choices of Surface and Intracardiac Signals
Intracardiac leads can be placed strategically at various locations within the cardiac chambers to record local events in the region of the lead. A classic display would include three to five surface ECG leads, high RA recording, HB recording, CS recording, and RV apex recording (Fig. 4-17). Depending on the type of study and information sought, stimulation and recording from other sites can be appropriate and can include RB recording, LV recording, transseptal LA recording, and atrial and ventricular mapping catheter tracings for EP mapping and ablation.21
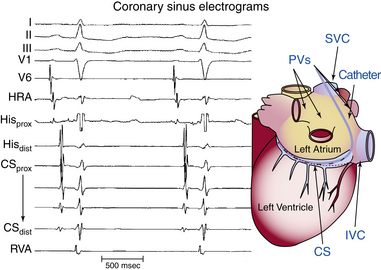
The intracardiac electrograms are generally displayed in the order of normal cardiac activation. The first intracardiac tracing is a recording from the high RA close to the sinus node. The next intracardiac tracing is the HB recording, obtained from a catheter positioned at the HB, which shows low septal RA, HB, and high septal RV depolarizations. One to five recordings may be obtained from the CS, which reflects LA activation, followed by a recording from the RV catheter (see Fig. 4-17).6
Coronary Sinus Electrogram
Because the CS lies in the AV groove, in close contact to both the LA and the LV, the CS catheter records both atrial and ventricular electrograms. However, the CS has a variable relationship with the mitral annulus. The CS lies 2 cm superior to the annulus as it crosses from the RA to the LA. More distally, the CS frequently overrides the LV. Consequently, the most proximal CS electrodes (located at the CS os) are closer to the atrium and typically show a local sharp, large atrial electrogram and a smaller, far-field ventricular electrogram. The more distal CS electrodes, lying closer to the LV than the LA, record progressively smaller, less sharp, far-field atrial electrograms and larger, sharper, near-field ventricular electrograms (see Fig. 4-17).
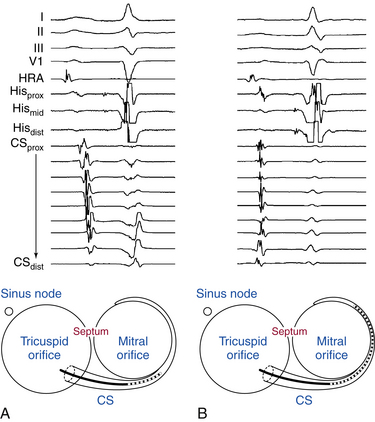
During normal sinus rhythm (NSR), the atrial activation sequence proceeds from the CS os distally. However, if the CS catheter is deeply seated in the CS, so that the most proximal electrodes are distal to the CS os and the most distal electrodes are anterolateral on the mitral annulus, then both proximal and distal electrodes can be activated at the same time (Fig. 4-18).
His Bundle Electrogram
The HB catheter is positioned at the junction of the RA and RV. Therefore, it records electrograms from local activation of the adjacent atrial, HB, and ventricular tissues (Fig. 4-19). Using a 5- to 10-mm bipolar recording, the His potential appears as a rapid biphasic spike, 15 to 25 milliseconds in duration, interposed between local atrial and ventricular electrograms. The use of a quadripolar catheter allows simultaneous recording of three bipolar pairs.24
Before measuring conduction intervals within the HB electrogram, it is important to verify that the spike recorded between the atrial and ventricular electrograms on the HB catheter actually represents activation of the most proximal HB and not the distal HB or RB. The most proximal electrodes displaying the His potential should be chosen, and a large atrial electrogram should accompany the proximal His potential. Anatomically, the proximal portion of the HB originates in the atrial side of the tricuspid annulus; thus, the most proximal HB deflection is the one associated with the largest atrial electrogram. Recording of a His potential associated with a small atrial electrogram can reflect recording of the distal HB or RB and therefore would miss important intra-His conduction abnormalities and falsely shorten the measured HB-ventricular (HV) interval (see Fig. 4-19). Even if a large His potential is recorded in association with a small atrial electrogram, the catheter should be withdrawn to obtain a His potential associated with a larger atrial electrogram. Using a multipolar (three or more) electrode catheter to record simultaneously proximal and distal HB electrograms (e.g., a quadripolar catheter records three bipolar electrograms over a 1.5-cm distance) can help evaluate intra-His conduction.5
Validation of the HB recording can be accomplished by assessment of the HV interval and establishing the relationship between the His potential and other electrograms.24 The HV interval should be 35 milliseconds or longer (in the absence of preexcitation). In contrast, the RB potential invariably occurs within 30 milliseconds before ventricular activation. Atrial pacing can be necessary to distinguish a true His potential from a multicomponent atrial electrogram. With a true His potential, the atrial-HB (AH) interval should increase with incremental pacing rates. HB pacing can also be a valuable means for validating HB recording. The ability to pace the HB through the recording electrode and obtain HB capture (i.e., QRS identical to that during NSR and stimulus-to-QRS interval identical to the HV interval during NSR) provides the strongest evidence validating the His potential. However, this technique is inconsistent in accomplishing HB capture, especially at low current output. Higher output can result in nonselective HB capture. The use of closely spaced electrodes and the reversal of current polarity (i.e., anodal stimulation) can facilitate HB capture. Failure to capture the HB selectively does not necessarily imply that the recorded potential is from the RB.
Other measures that can be used, although rarely required, to validate the HB recording include recording of pressure simultaneously with a luminal electrode catheter (which should reveal atrial pressure wave when the catheter is at the proximal His electrogram position) and simultaneous left and right recording of the His potential. The His potential can be recorded in the noncoronary sinus of Valsalva (just above the aortic valve) or in the LVOT along the interventricular septum (just below the aortic valve). Because these sites are at the level of the central fibrous body, the proximal penetrating portion of the HB is recorded and can be used to time the His potential recorded via the standard venous route. Recording the HB from the noncoronary cusp (versus the LVOT) is preferred because only a true His potential can be recorded from that site.25
Baseline Intervals
P Wave–Atrial Interval
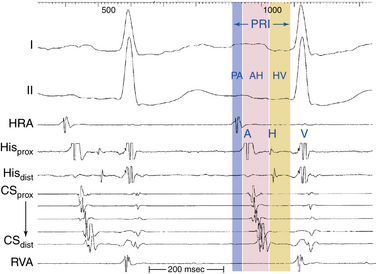
The P wave–atrial (PA) interval is measured from the first evidence of sinus node depolarization, whether on the intracardiac or surface ECG, to the atrial deflection as recorded in the HB lead. It represents conduction through the RA to the inferoposterior interatrial septum (in the region of the AV node [AVN] and HB; see Fig. 4-19).
Atrial–His Bundle Interval
The AH interval is measured from the first rapid deflection of the atrial deflection in the HB recording to the first evidence of HB depolarization in the HB recording (see Fig. 4-19). The AH interval is an approximation of the AVN conduction time, because it represents conduction time from the low RA at the interatrial septum through the AVN to the HB.
The response of the AH interval to atrial pacing or drugs often provides more meaningful information about AVN function than an isolated measurement of the AH interval. Autonomic blockade with atropine (0.04 mg/kg) and propranolol (0.02 mg/kg) can be used to evaluate AVN function in the absence of autonomic influences. Not enough data, however, are available to define normal responses under these circumstances.24
His Bundle–Ventricular Interval
The HV interval is measured from the onset of the His potential to the onset of the earliest registered surface or intracardiac ventricular activation. It represents conduction time from the proximal HB through the distal His-Purkinje system (HPS) to the ventricular myocardium (see Fig. 4-19).24
Programmed Electrical Stimulation
Stimulators
A typical stimulator has a constant current source and is capable of pacing at a wide range of CLs and variable current strengths (0.1 to 10 mA) and pulse widths (0.1 to 10 milliseconds). Additionally, current stimulators have at least two different channels of stimulation (preferably four) and allow delivery of multiple extrastimuli (three or more) and synchronization of the pacing stimuli to selected electrograms during intrinsic or paced rhythms.
Pacing Techniques
Pacing Output
Stimulation is usually carried out using an isolated constant current source that delivers a rectangular impulse. Pacing output at twice (2×) diastolic threshold is generally used. Pacing threshold is defined as the lowest current required for consistent capture determined in late diastole. The pacing threshold can be influenced by the pacing cycle length (CL); therefore, the threshold should be determined at each pacing CL used. In general, refractory periods are somewhat longer when determined using 2× threshold (as opposed to higher outputs), and this can reduce the incidence of induction of nonclinical tachyarrhythmias.24 Additionally, diastolic excitability can be influenced by drug administration; re-evaluation of the pacing threshold and adjustment of the pacing output (2× threshold) are therefore required in such situations. A pulse duration of 1 or 2 milliseconds is generally used.
Extrastimulus Technique
S1, S2, S3, . . . SN.
Two methods are in common clinical use for decreasing the coupling intervals during delivery of multiple extrastimuli. In the simple sequential method, the S1-S2 coupling interval is decreased until it fails to capture, at which time the coupling interval is increased until it captures (usually within 10 to 20 milliseconds). The S1-S2 coupling interval is then held constant while the S2-S3 interval is decreased similarly to that used for S1-S2, and then the same is done for S3-S4. In the tandem method, the S1-S2 coupling interval is decreased until S2 fails to capture, and then the S1-S2 coupling interval is increased by 40 to 50 milliseconds and held there. S3 is then introduced and the S2-S3 interval decreased until S3 fails to capture. At that point, the S1-S2 interval is decreased, and S3 is retested to see whether it captures. From that point on, the S1-S2 and S2-S3 intervals are decreased in tandem until refractory. As compared with the simple sequential method, the tandem method allows relatively longer intervals and provides a larger number of stimulation runs before moving on to the next extrastimulus. Prospective studies comparing the two methods have shown no differences between the two methods in any of the outcomes assessed.
Conduction and Refractoriness
Conduction
During depolarization, the electrical impulse spreads along each cardiac cell, and rapidly from cell to cell, because each myocyte is connected to its neighbors through low resistance gap junctions. As discussed in Chapter 1, conduction velocity refers to the speed of propagation of an electrical impulse through cardiac tissue, which is dependent on both the active membrane properties of the individual cardiac myocyte that generates the action potential (i.e., electrical excitability or refractoriness, or both) and passive properties governing the flow of current between cardiac cells (cell-to-cell coupling and tissue geometry).26,27
Conduction can be assessed by observing the propagation of wavefronts during pacing at progressively incremental rates. Rate-incremental pacing is delivered to a selected site in the heart while propagation to a selected distal point is assessed. Conduction velocity is assessed by measuring the time it takes for an impulse to travel from one intracardiac location to another. During tests of conduction, it is usual for capture to be maintained at the site of stimulation and block to occur at a distal point.6
Refractoriness
As discussed in Chapter 1, during a cardiac cycle, once an action potential is initiated, the cardiac cell is unexcitable to stimulation (i.e., unable to initiate another action potential in response to a stimulus of threshold intensity) for some duration of time (which is slightly shorter than the “true” action potential duration) until its membrane has repolarized to a certain level.28–30
Measurements of Refractory Periods
Refractoriness (or, more appropriately, excitability) is defined by the response of a tissue to premature stimulation.31,32 Refractory periods are analyzed by the extrastimulus technique, with progressively premature extrastimuli delivered after a train of 8 to 10 paced beats at a fixed pacing CL to allow for reasonable (more than 95%) stabilization of refractoriness, which is usually accomplished after 3 or 4 paced beats.
Several variables are considered in the assessment of refractory periods, including the stimulus amplitude and the drive rate or CL. Longer CLs are generally associated with longer refractory periods, but refractory periods of different parts of the conducting system do not respond comparably with changes in the drive CLs.30
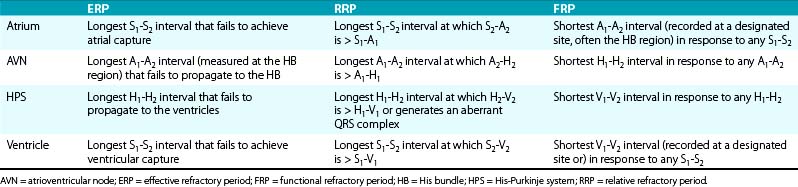
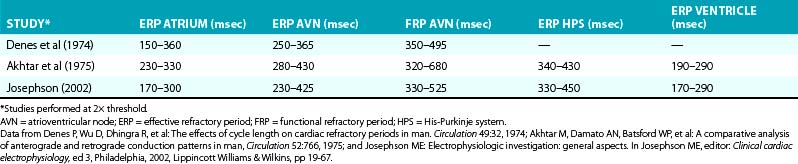
It is important that measurements of refractory periods be taken at specific sites. Measurements of atrial and ventricular ERP are taken at the site of stimulation. Measurements of AVN ERP and HPS ERP are taken from responses in the HB electrogram.24
Cycle Lengths Responsiveness of Refractory Periods
Normally, refractoriness of the atrial, HPS, and ventricular tissue is directly related to the basic drive CL (i.e., the ERP shortens with decreasing basic drive CL). This phenomenon (termed peeling of refractoriness) results from rate-related shortening of the action potential duration and is most marked in the HPS.32 Abrupt changes in the CL also affect refractoriness of these tissues. A change from a long- to short-drive CL (e.g., with introduction of an extrastimulus [S2] following a pacing drive [S1] with a long CL) shortens the ERP of the HPS and atrium, whereas a change from a short to a long drive CL markedly prolongs the HPS ERP but alters the ventricular ERP little, if at all. Refractoriness of the atrial, HPS, and ventricular tissue appears relatively independent of autonomic tone; however, data have shown that increased vagal tone reduces atrial ERP and increases ventricular ERP.30
In contrast, the AVN ERP increases with increasing basic drive CL in response to the fatigue phenomenon, which most likely results because AVN refractoriness is time-dependent and exceeds its action potential duration (unlike HPS refractoriness). Additionally, AVN refractory periods are labile and can be markedly affected by the autonomic tone. On the other hand, the response of AVN FRP to changes in pacing CL is variable, but it tends to decrease with decreasing pacing CL.32 This paradox occurs because the FRP is not a true measure of refractoriness encountered by an atrial extrastimulus (AES; A2); it is significantly determined by the AVN conduction time of the basic drive beat (A1-H1); the longer the A1-H1 is, the shorter the calculated FRP will be at any A2-H2.33
Limitations of Tests of Conduction and Refractoriness
It is unusual to be able to collect a complete set of measurements. With refractory period testing, the atrial ERP is often longer than the AVN ERP, so that atrial refractoriness is encountered before AVN refractoriness, thus limiting the ability to assess the latter. Moreover, an AES cannot be used to test the HPS if conduction is blocked at the AVN level. This is a limitation that applies to most patients undergoing conduction or refractory period testing.31 On the other hand, it is possible to assess anterograde conduction and refractoriness distal to the AVN by direct pacing of the HB. This is not part of the routine EP evaluation, however, and is reserved for cases in which the information is particularly desired.6
A wide range of normal values has been reported for refractory periods (Table 4-2). However, it is difficult to interpret these so-called normal values because they come from pooled data using different standards (different pacing CLs, stimulus strengths, and pulse widths).24,31,32
Atrial Stimulation
Technical Aspects
During stepwise rate-incremental pacing, pacing should be continued long enough (usually 15 to 60 seconds) at each pacing CL to ensure stability of conduction intervals and to overcome two factors that significantly influence the development of a steady state: the phenomenon of accommodation and the effects of autonomic tone. During rate-incremental pacing, if the coupling interval of the first beat of the drive is not synchronized, it can be shorter, longer, or equal to the subsequent pacing CL. Therefore, one can observe an increasing, decreasing, or stable AH interval pattern for several cycles, and the initial AH interval can be different from the steady-state AH interval. Oscillations of the AH interval, which dampen to a steady level, or AVN Wenckebach can occur under these circumstances. With regard to influence of the autonomic tone on AVN conduction, rapid pacing can produce variations in AVN conduction, depending on the patient’s immediate autonomic state. Rapid pacing can also provoke symptoms or hypotension in patients who then produce neurohumoral responses that can alter results. Therefore, for assessment of AV conduction, ramp pacing is often an attractive alternative to the stepwise method. The pacing rate is slowly increased at 2 to 4 beats/min/sec (or the pacing CL is decreased by 10 milliseconds every several paced beats) until block occurs.24
Normal Response to Rate-Incremental Atrial Pacing
Atrioventricular Node Response to Atrial Pacing
The normal AVN response to rate-incremental atrial pacing is for the PR and AH intervals to increase gradually as the pacing CL decreases until AVN Wenckebach block appears (Fig. 4-20). With further decrease in the pacing CL, higher degrees of AV block (2:1 or 3:1) can appear. Infranodal conduction (HV interval) generally remains unaffected.
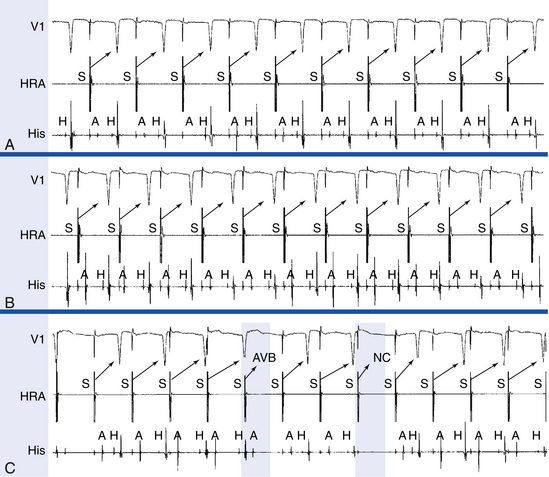
Wenckebach block is frequently atypical; that is, the AH interval does not increase gradually in decreasing increments but stabilizes for several beats before the block, or it can show its greatest increment in the last conducted beat. The incidence of atypical Wenckebach block is highest during long Wenckebach cycles (longer than 6.5). It is important to distinguish atypical Wenckebach periodicity from Mobitz II AV block. Additionally, it is important to ensure that the ventricular pauses observed during atrial pacing are not secondary to loss of atrial capture or the occurrence of AVN echo beats (pseudoblock; see Fig. 4-20).
At short pacing CLs (less than 350 milliseconds), infranodal block can occasionally occur in patients with a normal baseline HV interval and QRS. This occurs especially when atrial pacing is started during NSR with the first or second paced impulses acting as a long-short sequence. The HPS can also show accommodation following the initiation of pacing. Prolongation of the HV interval or infranodal block at a pacing CL longer than 400 milliseconds is abnormal and indicates infranodal conduction abnormalities.
Normal Response to Atrial Premature Stimulation
Sinus Node Response to Atrial Extrastimulation
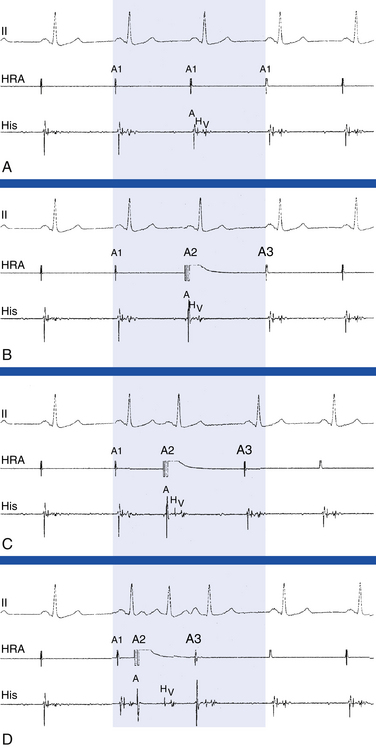
Four zones of response of the sinus node to AES have been identified: the zone of collision, the zone of reset, the zone of interpolation, and the zone of reentry (Fig. 4-21).
Zone I.
A late-coupled AES with very long A1-A2 intervals (with A2 falling in the last 20% to 30% of the sinus CL) collides with the impulse already emerging from the sinus node, resulting in fusion of atrial activation (fusion between the AES [A2] with the spontaneous sinus impulse [A1]) or paced-only atrial activation sequence; it fails to affect the timing of the next sinus beat, thus producing a fully compensatory pause. This zone, also known as the zone of collision, zone of interference, and nonreset zone, is defined by the range of A1-A2 at which A2-A3 is fully compensatory (see Fig. 4-21).24
Zone II.
An earlier coupled AES results in penetration of the sinus node with resetting so that the resulting pause is less than compensatory (i.e., A1-A3 is < 2×[A1-A1]), but without changing sinus node automaticity. The range of A1-A2 at which resetting of the sinus pacemaker occurs, resulting in a less than compensatory pause, defines zone II, also known as the zone of reset (see Fig. 4-21). This zone is typically of long duration (40% to 50% of the sinus CL). In most patients, A2-A3 remains constant throughout zone II, thus producing a plateau in the curve because, although A2 penetrates and resets the sinus node, it does so without changing the sinus pacemaker automaticity. Hence, A2-A3 should equal the spontaneous sinus CL (A1-A1) plus the time it takes the AES (A2) to enter and exit the sinus node. The difference between A2-A3 and A1-A1 therefore has been taken as an estimate of total sinoatrial conduction time.24
Zone III.
A very early coupled AES encounters a refractory sinus node (following the last sinus discharge) and fails to enter or reset the sinus node. The next sinus discharge is on time because the atrium is already fully recovered following that early AES. The range of A1-A2 coupling intervals at which A2-A3 is less than A1-A1, and A1-A3 is less than 2× (A1-A1), defines zone III, also known as the zone of interpolation (see Fig. 4-21). The A1-A2 coupling intervals at which incomplete interpolation is first observed define the RRP of the perinodal tissue. Some refer to this as the sinus node refractory period. In this case, A3 represents delay of A1 exiting the sinus node, which has not been affected.34 The A1-A2 coupling interval at which complete interpolation is observed probably defines the ERP of the most peripheral of the perinodal tissue because the sinus impulse does not encounter refractory tissue on its exit from the sinus node. In this case, (A1-A2) + (A2-A3) = A1-A1 and sinus node entrance block is said to exist.34
Atrioventricular Nodal Response to Atrial Extrasimulation
Progressively premature AES results in prolongation of PR and AH intervals, with inverse relationship between the AES coupling interval (A1-A2) and the AH interval (A2-H2). The shorter the coupling interval of the AES is, the longer the A2-H2 interval will be (see Fig. 4-21). More premature AES can block in the AVN with no conduction to the ventricle (defining AVN ERP). Occasionally, conduction delay and block occur in the HPS, especially when the AES is delivered following long basic drive CLs, because HPS refractoriness frequently exceeds the AVN FRP at long pacing CLs.
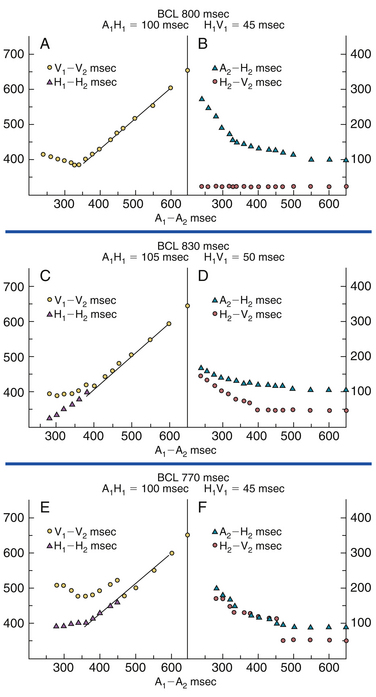
The patterns of AV conduction can be expressed by plotting refractory period relating the A1-A2 interval to the responses of the AVN and HPS. Plotting the A1-A2 interval versus the H1-H2 and V1-V2 intervals illustrates the functional input-output relationship between the basic drive beat and the AES and provides an assessment of the FRP of the AV conduction system. In contrast, plotting the A2-H2 interval (AVN conduction time of the AES) and the H2-V2 interval (HPS conduction time of the AES) versus the A1-A2 interval (the AES coupling interval) allows determination of the conduction times through the various components of the AV conduction system.32
Type I Response.
In this type, the progressively premature AES encounters progressive delay in the AVN without any changes in the HPS. Therefore, refractoriness of the AVN determines the FRP of the entire AV conduction, and the ERP of the AV conduction system is determined at the atrial or AVN level. This response is characterized by initial shortening of the H1-H2 and V1-V2 intervals as the AES coupling interval (A1-A2) shortens, whereas AVN conduction (A2-H2) and HPS conduction (H2-V2) remain stable (Fig. 4-22). With further shortening of the A1-A2 interval, the RRP of the AVN is encountered, resulting in progressive delay in AVN conduction (manifesting as progressive prolongation of the A2-H2 interval) accompanied by stable HPS conduction (H2-V2) and a progressive but identical prolongation of both the H1-H2 and V1-V2 intervals, until the AES is blocked within the AVN (AVN ERP) or until the atrial ERP is reached. The minimum H1-H2 and V1-V2 intervals attained define the FRP of the AVN and entire AV conduction system. AVN conduction (A2-H2) usually increases by 2 to 3× baseline values before block.24
Type II Response.
In type II response, conduction delay occurs initially in the AVN; however, with further shortening of the AES coupling interval, progressive delay develops in the HPS. Therefore, refractoriness of the HPS determines the FRP of the entire AV conduction system, and the ERP of the AV conduction system is determined at any level. At longer A1-A2 intervals, type II response is similar to type I response; however, as the A1-A2 interval shortens, conduction delay develops initially in the AVN (manifesting as progressive prolongation of the A2-H2 interval) but then in the HPS (manifesting as aberrant QRS conduction and progressive prolongation of the H2-V2 interval) as the RRP of the HPS is encountered. Therefore, in contrast to type I response, both A2-H2 and H2-V2 intervals prolong in response to progressively shorter A1-A2, resulting in divergence in the H1-H2 and V1-V2 curves until the AES is blocked within the AVN (AVN ERP), in the HPS (HPS ERP), or until the atrial ERP is reached (see Fig. 4-22). Block usually occurs in the AVN, but it can occur in the atrium and occasionally in the HPS (modified type II response). AVN conduction (A2-H2) usually increases only modestly (by less than 2× baseline values before block).24
Type III Response.
In type III response, conduction delay occurs initially in the AVN; however, at a critical AES coupling interval, sudden and marked delay develops in the HPS. Therefore, refractoriness of the HPS determines the FRP of the entire AV conduction system, and the ERP of the AV conduction system is determined at any level. However, in contrast to type II response, the HPS is invariably the first site of block. At longer A1-A2 intervals, type II response is similar to type I response; however, as the A1-A2 interval shortens, progressive delay is noted initially in the AVN (manifest as progressive prolongation in the A2-H2 interval), but then a sudden delay of conduction in the HPS occurs (manifesting as aberrant QRS conduction and a sudden jump in the H2-V2 interval). This results in a break in the V1-V2 curve, which subsequently descends until, at a critical A1-A2 interval, the impulse blocks in the AVN or HPS (see Fig. 4–22). The FRP of the HPS occurs just before the marked jump in H2-V2. AVN conduction (A2-H2) usually increases by less than 2× baseline values before block.24
The ERP of the atrium is not infrequently reached earlier than that of the AVN, especially when the basic drive is slow (which increases atrial ERP and decreases AVN ERP) or when the patient is agitated, which increases sympathetic tone and decreases AVN ERP. The first site of block is in the AVN in most patients (45%), in the atrium in 40%, and in the HPS in 15%.31
Atrial Response to Atrial Extrastimulation
Early AESs can impinge on the atrial RRP, with resulting local latency (i.e., long interval between the pacing artifact and the atrial electrogram on the pacing electrode).31 A very early AES delivered during the atrial ERP fails to capture the atrium. The atrial ERP can be longer or shorter than the AVN ERP, especially at long basic drive CLs or in cases of enhanced AVN conduction secondary to autonomic influences.
Repetitive Atrial Responses
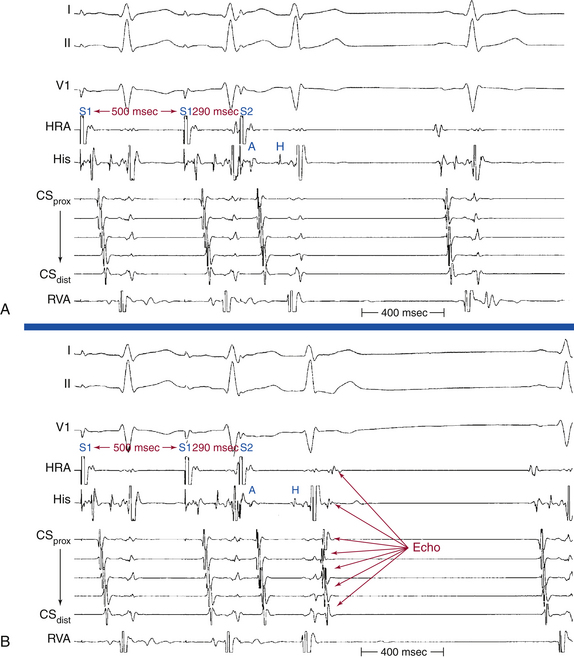
Repetitive atrial responses can also be caused by reentry in the AVN. These patients have anterograde dual AVN physiology, and the last paced beat conducts slowly down the slow AVN pathway and then retrogradely up the fast pathway to produce the echo beat (Fig. 4-23). Atrial activation sequence is consistent with retrograde conduction over the fast AVN pathway, earliest in the HB catheter recording. Atrial and ventricular activations occur simultaneously.
Ventricular Stimulation
Technical Aspects
Ventricular stimulation is used to assess retrograde (ventricular-atrial [VA]) conduction and refractory periods, retrograde atrial activation patterns, including sequences that can indicate the presence of a BT, and vulnerability to inducible ventricular arrhythmias.31
Stepwise rate-incremental ventricular pacing or ramp pacing is used in the assessment of VA conduction. It is unusual to provoke ventricular arrhythmias with these tests, even in patients with known ventricular arrhythmia. Rate-incremental ventricular pacing is usually started at a pacing CL just shorter than the sinus CL, and the pacing CL is then gradually decreased (in 10- to 20-millisecond decrements) down to 300 milliseconds. Shorter pacing CL may be used to assess rapid conduction in patients with supraventricular tachycardia (SVT) or to induce VT. With ramp pacing, the pacing rate is slowly increased at 2 to 4 beats/min/sec (or the pacing CL is decreased by 10 milliseconds every several paced beats) until VA block occurs.
Ventricular extrastimulus (VES) testing is used to assess ventricular, HPS, and AVN refractory periods and to induce arrhythmias.31 During programmed stimulation, a sequence of eight paced stimuli is delivered at a constant rate (the S1 drive), which allows stable VA conduction. Following these eight beats, a VES (S2) is delivered. This stimulation sequence is repeated at progressively shorter S1-S2 intervals, thus allowing the response of the HPS and AVN to be recorded across a range of premature test stimuli.
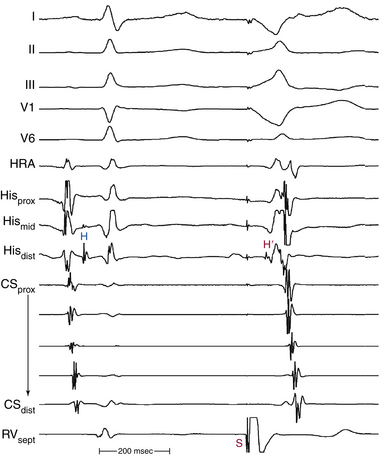
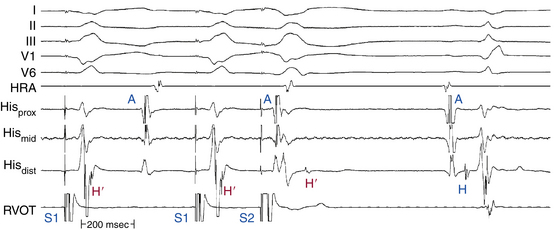
During ventricular stimulation, the HB electrogram shows a retrograde His potential in 85% of patients with a normal QRS during NSR.24 Ventricular pacing at the base of the heart close to the AV junction facilitates recording a retrograde His potential because it allows the ventricles to be activated much earlier relative to the HB (Fig. 4-24). The ventricular-HB (VH) or stimulus-HB (S-H) interval always exceeds the anterograde HV interval by the time it takes for the impulse to travel from the stimulation site to the ipsilateral bundle branch. In patients with normal HV intervals, a retrograde His potential can usually be seen before the ventricular electrogram in the HB recording during RV apical pacing. In contrast, when ipsilateral bundle branch block (BBB) is present, especially with long HV intervals, a retrograde His potential is less frequently seen; when it is seen, it is usually inscribed after the QRS when pacing from the ipsilateral ventricle (Fig. 4-25).
Ventricular stimulation is relatively safe; however, induction of clinically irrelevant serious arrhythmias, including VF, can occur in patients with normal hearts and those who have not had spontaneous ventricular arrhythmias. The induction of these arrhythmias is directly related to the aggressiveness of the ventricular stimulation protocol. Thus, the stimulation protocol is usually limited to single or double VES in patients without a clinical history consistent with malignant ventricular arrhythmias.24 The use of high pacing output can also increase the risk of such arrhythmias. Therefore, ventricular stimulation at 2× diastolic threshold and 1-millisecond pulse width is preferable.
Normal Response to Rate-Incremental Ventricular Pacing
Ventricular pacing provides information about VA conduction, which is present in 40% to 90% of patients, depending on the population studied. Absence of VA conduction at any paced rate is common and normal. There is no difference in the capability of VA conduction regarding the site of ventricular stimulation in patients with a normal HPS. When present, normal VA conduction uses the normal AV conduction system, with the earliest atrial activation site usually in the septal region in proximity to the AVN. In some cases, the slow posterior AVN pathway is preferentially engaged so that the earliest atrial activation site is somewhat posterior to the AVN, closer to the CS os.24
The normal AVN response to rate-incremental ventricular pacing is a gradual delay of VA conduction (manifest as gradual prolongation of the HA interval) as the pacing CL decreases. Retrograde VA Wenckebach block and a higher degree of block appear at shorter pacing CLs. Occasionally, VA Wenckebach cycles are terminated with ventricular echo beats secondary to retrograde dual AVN physiology. When a retrograde His potential is visible, a relatively constant VH interval at a rapid pacing rate, despite the development of retrograde VA block, localizes the site of block to the AVN (Fig. 4-26). When a retrograde His potential is not visible during ventricular pacing, the site of VA block, when it occurs, must be inferred from the effect of paced impulses on conduction of spontaneous or stimulated atrial beats (i.e., by analyzing the level of retrograde concealment; see Fig. 4-26). If the AH interval of the atrial beat is independent of the time relationship of the paced impulse, the site of block is in the HPS (infranodal). On the other hand, if the AH interval varies according to the coupling interval of the atrial beat to the paced QRS, or if the atrial beat fails to depolarize the HB, the site of block is in the AVN. Moreover, drugs that enhance AVN (but not HPS) conduction (e.g., atropine) improve VA conduction if the site of block is in the AVN, but they do not affect VA conduction if the site of block is in the HPS.
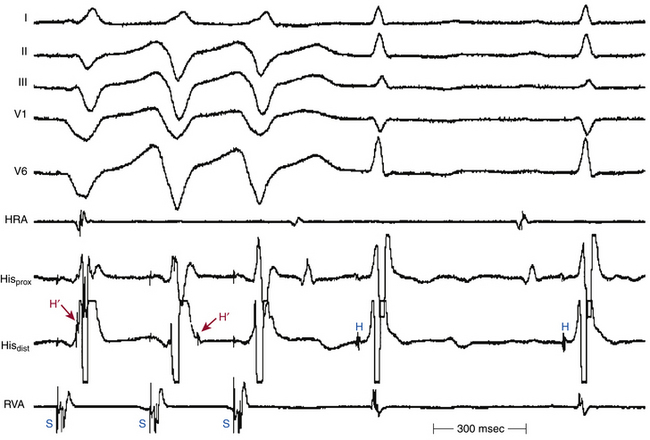
At comparable pacing CLs, anterograde AV conduction is better than retrograde VA conduction in most patients. AVN conduction is the major determinant of retrograde VA conduction. Patients with prolonged PR intervals are much less likely to demonstrate retrograde VA conduction.31 Furthermore, patients with prolonged AVN conduction are less capable of VA conduction than patients with infranodal conduction delay. Anterograde AV block in the AVN is almost universally associated with retrograde VA block. On the other hand, anterograde AV block in the HPS is associated with some degree of VA conduction in up to 40% of cases. However, the exact comparison between anterograde and retrograde AVN conduction can be limited by the absence of a visible retrograde His potential during ventricular stimulation. Consequently, localization of the exact site of conduction delay or block (AVN versus HPS) may not be feasible. The response to rate-incremental pacing at two different pacing CLs may differ because of the opposite effects of the pacing CL on AVN and HPS refractoriness.24
Rapid ventricular pacing can result in ipsilateral retrograde BBB, with subsequent impulse propagation across the septum, retrogradely up the contralateral bundle branch, and then to the HB. Such an event can manifest as sudden prolongation of the HV interval during pacing. This can be followed by resumption of VA conduction after a period of VA block in the AVN when the VH interval is short, because the delay in the HPS allows recovery of the AVN (the gap phenomenon). This occurrence can permit better visualization of the His potential, and, by comparing the ventricular electrogram in the HB recording when the His potential is clearly delayed with that with normal retrograde ipsilateral bundle branch conduction, a previously unappreciated His potential within that electrogram can then be visualized (see Fig. 4-26).
To exclude the presence of a nondecremental retrogradely conducting BT, the VES technique is usually more effective than rate-incremental ventricular pacing for demonstrating normal prolongation of the VA interval. If uncertainty continues to exist, adenosine can be extremely helpful, which is much more likely to block AVN conduction than BT.
Normal Response to Ventricular Premature Stimulation
Typically, VA conduction proceeds over the RB or left bundle branch (LB), and then to the HB, AVN, and atrium. With a progressively premature VES, the initial delay occurs in the HPS, and the most common site of retrograde VA block is in the HPS. Delay or block in the AVN can occur but is less common.31
The typical response can be graphically displayed by plotting the S1-S2 interval versus S2-H2, S2-A2, and H2-A2 intervals, as well as the S1-S2 interval versus S1-H2 and A1-A2 intervals.31 At long S1-S2 intervals, no delay occurs in the retrograde conduction (S2-A2). Further shortening of the S1-S2 intervals results in prolongation in the S2-A2 intervals, and localization of the exact site of S2-A2 delay may not be feasible unless a retrograde His potential is visible (Fig. 4-27A and B). During RV pacing, the initial delay usually occurs in retrograde RB conduction. At a critical coupling interval (S1-S2), block in the RB occurs, and retrograde conduction proceeds over the LB. A retrograde His potential (H2) eventually becomes visible after the ventricular electrogram in the HB recording (see Fig. 4-27D). Once a retrograde His potential is seen, progressive prolongation in the S2-H2 interval (HPS conduction delay) occurs as the S1-S2 interval shortens, and the VA conduction time (S2-A2) is determined by the HPS conduction delay (S2-H2), as demonstrated by parallel S2-A2 and S2-H2 curves. The degree of prolongation of the S2-H2 interval varies, but it can exceed 300 milliseconds.24
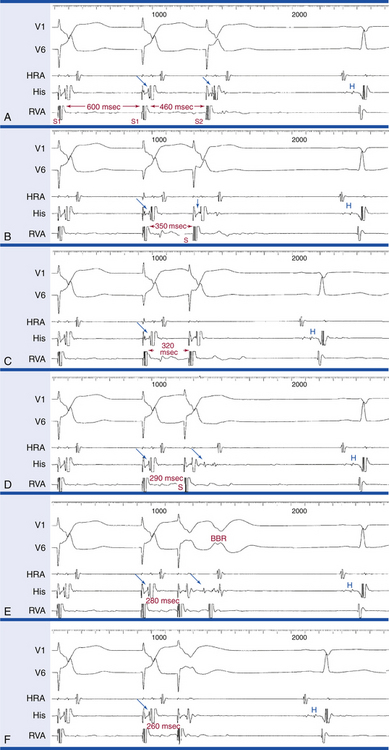
In patients with preexistent BBB, retrograde block in the same bundle is common. This is suggested by a prolonged VH interval during a constant paced drive CL or late VES from the ventricle ipsilateral to the BBB, so that a retrograde His potential is usually seen after the ventricular electrogram in the HB tracing (see Fig. 4-25).
In most cases, once a retrograde His potential is visible, the S1-H2 curve becomes almost horizontal because the increase in the S2-H2 interval is similar to the decrease in the S1-S2 interval. This response results in a relatively constant input to the AVN (as determined by measuring the S1-H2 interval) and consequently a fixed H2-A2 interval. Occasionally, the increase in the S2-H2 interval greatly exceeds the decrease in the S1-S2 interval, thus giving rise to an ascending limb on the curve, with a subsequent decrease in the AVN conduction time (H2-A2) because of decreased input to the AVN. As the S1-S2 interval is further shortened, block within the HPS appears, or ventricular ERP is reached.24
Repetitive Ventricular Responses
Bundle Branch Reentry Beats
The longest refractory periods in the HPS are found most distally, at or near the Purkinje-myocardial junction. This creates a distal gate that inhibits retrograde conduction of early VES. Thus, when an early VES is delivered to the RV apex, the nearby distal gate of the RB can still be refractory. The results are progressive retrograde conduction delay and block occurring in the distal RB, with subsequent transseptal conduction of the impulse to the LV, leading to retrograde conduction up the LB to the HB (see Fig. 4-27D). At this point, the His potential usually follows the local ventricular electrogram in the HB recording, and retrograde atrial stimulation, if present, follows the His potential. Further decrease in the VES coupling interval produces progressive delay in retrograde HPS conduction. When a critical degree of HPS delay (S2-H2) is attained, the impulse can return down the initially blocked RB, thus producing a QRS with a typical LBBB pattern and left-axis deviation, because ventricular activation originates solely from conduction over the RB (see Fig. 4-27E). This beat is called a BBR beat or V3 phenomenon.24
Ventricular Echo Beats
This is the second most common response and can occur in 15% to 30% of normal individuals. It is caused by reentry in the AVN, and it appears when a critical degree of retrograde AVN delay is achieved. These patients have retrograde dual AVN physiology, and the last paced beat conducts slowly retrogradely up the slow AVN pathway and then anterogradely down the fast pathway to produce the echo beat (Fig. 4-28). In most cases, this delay is achieved before the appearance of a retrograde His potential beyond the local ventricular electrogram. At a critical H2-A2 interval (or V2-A2 interval, when the His potential cannot be seen), an extra beat with a normal anterograde QRS morphology results. Atrial activity also precedes the His potential before the echo beat.
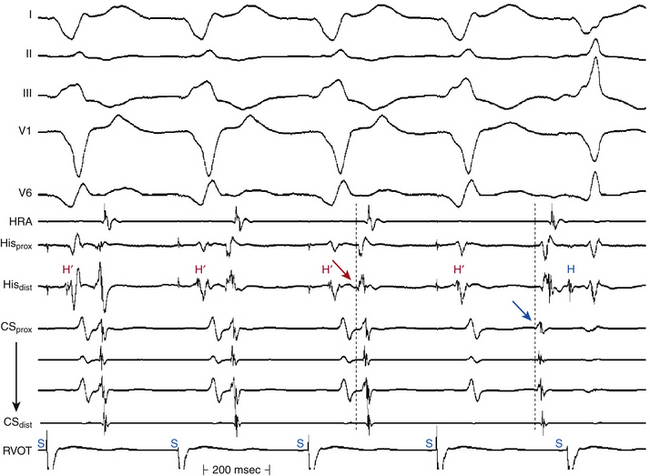
Intraventricular Reentrant Beats
This response usually occurs in the setting of a cardiac pathological condition, especially coronary artery disease with a prior myocardial infarction (MI). It usually occurs at short coupling intervals and can have any morphology, but more often RBBB than LBBB in patients with a prior MI. Such beats occur in fewer than 15% of normal patients with a single VES at 2× diastolic threshold and in 24% with double VESs. In contrast, intraventricular reentrant beats occur following single or double VESs in 70% to 75% of patients with prior VT or VF and cardiac disease. The incidence of this response increases with increasing the number of VESs, basic drive CLs, and stimulation sites used. These responses are usually nonsustained (1 to 30 complexes) and typically polymorphic. In patients without prior clinical arrhythmias, such responses are of no clinical significance.
Miscellaneous Electrophysiological Phenomena
Concealed Conduction
Concealed conduction can be defined as the propagation of an impulse within the specialized conduction system of the heart that can be recognized only from its effect on the subsequent impulse, interval, or cycle.35 This phenomenon can occur in any portion of the AV conduction system. As long as the cardiac impulse is traveling in the specialized conduction system, the amount of electrical current generated is too small to be recorded on the surface ECG. However, if this impulse travels only a limited distance—incomplete anterograde or retrograde penetration—within the system, it can interfere with the formation or propagation of another impulse. When this interference can be recognized in the tracing because of an unexpected behavior of the subsequent impulse, unexpected in the sense that the event cannot be explained on the basis of readily apparent physiological or pathophysiological processes, it is known as concealed conduction.25,35,36
Ventricular Response During Atrial Fibrillation
Repetitive concealed conduction is the mechanism of a slow ventricular rate during AF and AFL, with varying degrees of penetration into the AVN.25,35,36 During AF, the irregular ventricular response is caused by the varying depth of penetration of the numerous wavefronts approaching the AVN. Although the AVN would be expected to conduct whenever it recovers excitability after the last conducted atrial impulse, which would then be at regular intervals, the ventricular response is irregularly irregular because some fibrillatory impulses penetrate the AVN incompletely and block, thus leaving it refractory in the presence of subsequent atrial impulses.
Unexpected Prolongation or Failure of Conduction
Prolongation of the PR (and AH) interval or AVN block can occur secondary to a nonconducted premature depolarization of any origin (atrium, ventricle, or HB). The premature impulse incompletely penetrates the AVN (anterogradely or retrogradely), resets its refractoriness, and can make it fully or partially refractory in the presence of the next sinus beat, which may then be blocked or may conduct with longer PR interval (see Fig. 4-26). For example, concealed junctional (HB) impulses can manifest as isolated PR interval prolongation, pseudo–type I AV block, or pseudo–type II AV block. ECG clues to concealed junctional extrasystoles causing such unexpected events include abrupt unexplained prolongation of the PR interval, the presence of apparent type II AV block in the presence of a normal QRS, the presence of types I and II AV block in the same tracing, and the presence of manifest junctional extrasystoles elsewhere in the tracing.
Unexpected Facilitation of Conduction
When a premature impulse penetrates the AV conduction system, it can result in facilitation of AV conduction and normalization of a previously present AV block or BBB by one of two mechanisms: (1) preexciting parts of the conduction system so that its refractory period ends earlier than expected (i.e., peeling back the refractory period of that tissue, thus allowing more time to recover excitability), or (2) causing CL-dependent shortening of refractoriness of tissues (i.e., atria, HPS, and ventricles) by decreasing the CL preceding the subsequent spontaneous impulse.25, 35, 36 Abrupt normalization of the aberration by a PVC, the finding of which proves retrograde concealment as the mechanism for perpetuation of aberration, is based on these principles.
Gap Phenomenon
The term gap in AVN conduction was originally used to define a zone in the cardiac cycle during which PACs failed to evoke ventricular responses, whereas PACs of greater or lesser prematurity conducted to the ventricles. The physiological basis of the gap phenomenon depends on a distal area with a long refractory period and a proximal site with a shorter refractory period. During the gap phenomenon, initial block occurs distally. With earlier impulses, proximal conduction delay is encountered, which allows the distal site of early block to recover excitability and resume conduction.35–37
An example of the most common type of gap phenomenon is an AES (A2) conducting with modest delay through the AVN that finds the HB still refractory, thus causing block. With increasing prematurity of the AES, the AES travels more slowly through the AVN (i.e., the A2-H2 interval prolongs further), so that the H1-H2 interval now exceeds the refractory period of the HB. By the time the impulse traverses the AVN, the HB has completed its ERP and conduction resumes (Fig. 4-29).
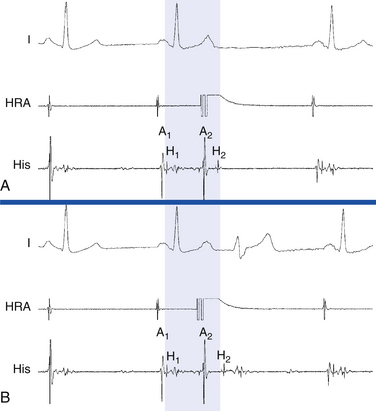
Other types of the gap phenomenon are described in which the required conduction delay is in the HB, proximal AVN, or atria. The gap phenomenon depends on the relationship between the EP properties of two sites; any pair of structures in the AV conduction system that has the appropriate physiological relationship can exhibit the gap phenomenon (e.g., AVN-HB, HB-HPS, atrium-AVN, atrium-HPS, proximal AVN–distal AVN, proximal HPS–distal HPS), and gap can occur during anterograde or retrograde stimulation. Therefore, there are almost endless possibilities for gaps, all based on the fundamental precept of “proximal delay allows distal recovery” (see Fig. 4-27C and D).35,36
Supernormality
Supernormal conduction implies conduction that is better than anticipated or conduction that occurs when block is expected. Electrocardiographically, however, supernormal conduction is not better than normal conduction, only better than expected. Conduction is better earlier in the cycle than later and occurs when block is expected. When an alteration in conduction can be explained in terms of known physiological events, true supernormal conduction need not be invoked.35
Supernormal conduction is dependent on supernormal excitability, a condition that exists during a brief period of repolarization, at the end of phase 3. During the supernormal period, excitation is possible in response to an otherwise subthreshold stimulus; that same stimulus fails to elicit a response earlier or later than the supernormal period.35,36,38 Two factors are responsible for supernormality: the availability of fast Na+ channels and the proximity of the membrane potential to threshold potential. During the supernormal phase of excitability, the cell has recovered enough to respond to a stimulus. However, because the membrane potential is still reduced, it requires only a little additional depolarization to bring the fiber to threshold; thus, a smaller stimulus than is normally required elicits an action potential. Supernormality has been demonstrated in the HPS, Bachmann bundle in the dog, and working myocardium of the atrium and ventricle, but not in the AVN.
1. Paradoxical normalization of bundle branch conduction at an R-R interval shorter than that with BBB. This can occur with a premature atrial complex conducting with a normal QRS during baseline NSR with BBB or with acceleration-dependent BBB that normalizes at even faster rates.
2. Intermittent AV conduction during periods of high-degree AV block. Only the P waves falling on or just after the terminal part of the T wave are conducted, whereas other timed P waves fail to conduct.
3. A failing pacemaker captures just at the end of the T wave, but not elsewhere in the cardiac cycle.
Although supernormal conduction is a proven property of the HPS and has been demonstrated in vitro, it is uncertain whether true supernormal conduction is a clinically important phenomenon. Other physiological mechanisms can be invoked to explain almost all reported examples of supernormal conduction in humans. Causes of apparent or pseudosupernormal conduction include the gap phenomenon (the most common mechanism of pseudosupernormal conduction), peeling back of refractoriness, shortening of refractoriness by changing the preceding CL, Wenckebach phenomena in the bundle branches, bradycardia-dependent (phase 4) block, summation, dual AVN physiology, reentry with ventricular echo beats, and concealed junctional extrasystoles.35,36,38
Complications
Risks and Complications
The addition of left-heart access or therapeutic maneuvers (e.g., ablation) to the procedure increases the incidence of complications, especially with the increasing use of extensive ablation to treat AF and ischemic VT. In the 1998 North American Society for Pacing and Electrophysiology (NASPE) Prospective Catheter Ablation Registry, 3357 patients were treated with RF ablation for a variety of cardiac arrhythmias. Major complications were reported in 1% to 4%, with procedure-related deaths in approximately 0.2%. There was no significant difference in the incidence of complications comparing patients older than 60 with those younger than 60 years of age or comparing large-volume centers (more than 100 ablation procedures/year) with lower-volume centers or between teaching and nonteaching hospitals.2 Complications following specific ablation procedures are discussed in subsequent chapters.
1. Calkins H., Brugada J., Packer D.L., et al. HRS/EHRA/ECAS expert Consensus Statement on catheter and surgical ablation of atrial fibrillation: recommendations for personnel, policy, procedures and follow-up. A report of the Heart Rhythm Society (HRS) Task Force on catheter and surgical ablation of atrial fibrillation. Heart Rhythm. 2007;4:816-861.
2. Finlay M., Sawhney V., Schilling R., et al. Uninterrupted warfarin for periprocedural anticoagulation in catheter ablation of typical atrial flutter: a safe and cost-effective strategy. J Cardiovasc Electrophysiol. 2010;21:150-154.
3. Hussein A.A., Martin D.O., Saliba W., et al. Radiofrequency ablation of atrial fibrillation under therapeutic international normalized ratio: a safe and efficacious periprocedural anticoagulation strategy. Heart Rhythm. 2009;6:1425-1429.
4. Kwak J.J., Pak H.N., Jang J.K., et al. Safety and convenience of continuous warfarin strategy during the periprocedural period in patients who underwent catheter ablation of atrial fibrillation. J Cardiovasc Electrophysiol. 2010;21:620-625.
5. Josephson M. Electrophysiologic investigation: technical aspects. In: Josephson M.E., editor. Clinical cardiac electrophysiology. ed 4. Philadelphia: Lippincott Williams & Wilkins; 2008:1-19.
6. Markides V., Koa-Wing M., Peters N. Mapping and imaging. In: Zipes D.P., Jalife J., editors. Cardiac electrophysiology: from cell to bedside. ed 5. Philadelphia: Saunders; 2009:897-904.
7. Habib A., Lachman N., Christensen K.N., Asirvatham S.J. The anatomy of the coronary sinus venous system for the cardiac electrophysiologist. Europace. 2009;11(Suppl 5):v15-v21.
8. Ren J.F., Callans D.J. Utility of intracardiac echocardiographic imaging for catheterization. In: Ren J.F., Marchlinski F.E., Callans D.J., Schwartsman D., editors. Practical intracardiac echocardiography in electrophysiology. Malden, Mass: Wiley-Blackwell; 2006:56-73.
9. de Asmundis C., Chierchia G.B., Sarkozy A., et al. Novel trans-septal approach using a Safe Sept J-shaped guidewire in difficult left atrial access during atrial fibrillation ablation. Europace. 2009;11:657-659.
10. Betensky B.P., Park R.E., Marchlinski F.E., et al. The v(2) transition ratio: a new electrocardiographic criterion for distinguishing left from right ventricular outflow tract tachycardia origin. J Am Coll Cardiol. 2011;57:2255-2262.
11. Tomlinson D.R., Sabharwal N., Bashir Y., Betts T.R. Interatrial septum thickness and difficulty with transseptal puncture during redo catheter ablation of atrial fibrillation. Pacing Clin Electrophysiol. 2008;31:1606-1611.
12. De P.R., Cappato R., Curnis A., et al. Trans-septal catheterization in the electrophysiology laboratory: data from a multicenter survey spanning 12 years. J Am Coll Cardiol. 2006;47:1037-1042.
13. Hu Y.F., Tai C.T., Lin Y.J., et al. The change in the fluoroscopy-guided transseptal puncture site and difficult punctures in catheter ablation of recurrent atrial fibrillation. Europace. 2008;10:276-279.
14. McWilliams M.J., Tchou P. The use of a standard radiofrequency energy delivery system to facilitate transseptal puncture. J Cardiovasc Electrophysiol. 2009;20:238-240.
15. Bidart C., Vaseghi M., Cesario D.A., et al. Radiofrequency current delivery via transseptal needle to facilitate septal puncture. Heart Rhythm. 2007;4:1573-1576.
16. Knecht S., Jais P., Nault I., et al. Radiofrequency puncture of the fossa ovalis for resistant transseptal access. Circ Arrhythm Electrophysiol. 2008;1:169-174.
17. Smelley M.P., Shah D.P., Weisberg I., et al. Initial experience using a radiofrequency powered transseptal needle. J Cardiovasc Electrophysiol. 2010;21:423-427.
18. Winkle R.A., Mead R.H., Engel G., Patrawala R.A. The use of a radiofrequency needle improves the safety and efficacy of transseptal puncture for atrial fibrillation ablation. Heart Rhythm. 2011;8:1411-1415.
19. Tzeis S., Andrikopoulos G., Deisenhofer I., et al. Transseptal catheterization: considerations and caveats. Pacing Clin Electrophysiol. 2010;33:231-242.
20. Lakkireddy D., Rangisetty U., Prasad S., et al. Intracardiac echo-guided radiofrequency catheter ablation of atrial fibrillation in patients with atrial septal defect or patent foramen ovale repair: a feasibility, safety, and efficacy study. J Cardiovasc Electrophysiol. 2008;19:1137-1142.
21. Stevenson W.G., Soejima K. Recording techniques for clinical electrophysiology. J Cardiovasc Electrophysiol. 2005;16:1017-1022.
22. Tedrow U.B., Stevenson W.G. Recording and interpreting unipolar electrograms to guide catheter ablation. Heart Rhythm. 2011;8:791-796.
23. Arora R., Kadish A. Fundamental of intracardiac mapping. In: Huang S.K.S., Wilber D.H., editors. Catheter ablation of cardiac arrhythmias. Philadelphia: Saunders; 2006:107-134.
24. Josephson M. Electrophysiologic investigation: general aspects. In: Josephson M.E., editor. Clinical cardiac electrophysiology. ed 4. Philadelphia: Lippincott Williams & Wilkins; 2008:20-68.
25. Fisch C., Knoebel S.B. Concealed conduction. In: Fisch C., Knoebel S.B., editors. Electrocardiography of clinical arrhythmias. Armonk, NY: Futura; 2000:153-172.
26. Grant A.O. Cardiac ion channels. Circ Arrhythm Electrophysiol. 2009;2:185-194.
27. Noorman M., van der Heyden M.A., van Veen T.A., et al. Cardiac cell-cell junctions in health and disease: electrical versus mechanical coupling. J Mol Cell Cardiol. 2009;47:23-31.
28. Nerbonne J.M., Kass R.S. Molecular physiology of cardiac repolarization. Physiol Rev. 2005;85:1205-1253.
29. Michael G., Xiao L., Qi X.Y., et al. Remodelling of cardiac repolarization: how homeostatic responses can lead to arrhythmogenesis. Cardiovasc Res. 2009;81:491-499.
30. Hanson B., Sutton P., Elameri N., et al. Interaction of activation-repolarization coupling and restitution properties in humans. Circ Arrhythm Electrophysiol. 2009;2:162-170.
31. Akhtar M., Damato A.N., Batsford W.P., et al. A comparative analysis of antegrade and retrograde conduction patterns in man. Circulation. 1975;52:766-778.
32. Denes P., Wu D., Dhingra R., et al. The effects of cycle length on cardiac refractory periods in man. Circulation. 1974;49:32-41.
33. Tadros R., Billette J. Rate-dependent AV nodal refractoriness: a new functional framework based on concurrent effects of basic and pretest cycle length. Am J Physiol Heart Circ Physiol. 2009;297:H2136-H2143.
34. Chinitz L.A., Sethi J.S. How to perform noncontact mapping. Heart Rhythm. 2006;3:120-123.
35. Josephson M.E. Miscellaneous phenomena related to atrioventricular conduction. In: Josephson M.E., editor. Clinical cardiac electrophysiology. ed 4. Philadelphia: Lippincott Williams & Wilkins; 2008:145-159.
36. Kilborn M.F. Electrocardiographic manifestations of supernormal conduction, concealed conduction, and exit block. In: Zipes D.P., Jalife J., editors. Cardiac electrophysiology: from cell to bedside. ed 4. Philadelphia: Saunders; 2004:733-738.
37. Fisch C., Knoebel S.B. Atrioventricular and ventriculoatrial conduction and blocks, gap, and overdrive suppression. In: Fisch C., Knoebel S.B., editors. Electrocardiography of clinical arrhythmias. Armonk, NY: Futura; 2000:315-344.
38. Fisch C., Knoebel S.B. Supernormal conduction and excitability. In: Fisch C., Knoebel S.B., editors. Electrocardiography of clinical arrhythmias. Armonk, NY: Futura; 2000:237-252.
[/level-membership-for-cardiovascular-category][not-level-membership-for-cardiovascular-category]
Chapter 4 Electrophysiological Testing
Periprocedural Management
Urinary Problems
Urinary retention can occur during lengthy EP procedures, particularly in combination with sedation, fluid administration, and tachycardia-related diuresis. When such situations are anticipated, it is useful to insert a urinary drainage catheter before the procedure.
Anticoagulation
Periprocedural anticoagulation for catheter ablation of persistent AFL or AF is necessary to minimize thromboembolic stroke risk; LA stunning and increased spontaneous echo contrast within the LA can occur following cardioversion or ablation of these arrhythmias. Similarly, patients with mechanical valvular prosthesis require uninterrupted anticoagulation. A perception of increased bleeding risks of invasive procedures in patients taking therapeutic warfarin doses led many operators to adopt a “bridging” strategy of conversion to enoxaparin to allow ablation and subsequent hemostasis to be performed during a pause in anticoagulation.1 This strategy involves discontinuation of warfarin at least 3 to 5 days prior to ablation, and starting heparin or enoxaparin after cessation of warfarin until the evening prior to the ablation procedure. Both enoxaparin and warfarin are then reinitiated within 4 to 6 hours after ablation and sheath removal, and enoxaparin is maintained until an optimal INR level is achieved.
An alternative strategy of uninterrupted oral anticoagulation during these procedures was found to be safe and feasible and more cost-effective for ablation of typical AFL or AF, without increasing hemorrhagic complications. However, INR testing is required on the day of the procedure to confirm therapeutic anticoagulation. Transesophageal echocardiography is performed in patients with a subtherapeutic INR in the 3 weeks prior to the procedure. Another potential advantage of this strategy is the ability to reverse warfarin effects rapidly in the setting of a bleeding complication (e.g., pericardial bleeding) by using synthetic clotting factor concentrates or fresh frozen plasma infusion, whereas enoxaparin effects remain difficult to reverse; protamine has only a partial effect on its action. This anticoagulation strategy can potentially be used routinely for EP studies and ablation of right-sided arrhythmias for which anticoagulation is required.2–4
Catheterization Techniques
Electrode Catheters
Electrode catheters come in different sizes (3 to 8 Fr). In adults, sizes 5, 6, and 7 Fr catheters are the most commonly used. Recordings derived from electrodes can be unipolar (one pole) or bipolar (two poles). The electrodes are typically 1 to 2 mm in length. The interelectrode distance can range from 1 to 10 mm or more. The greater the interelectrode spacing is on a conventional bipolar electrode, the more the recorded electrogram resembles a unipolar recording. Catheters with a 2- or 5-mm interelectrode distance are most commonly used.5
Many multipolar electrode catheters have been developed to facilitate placement of the catheter in the desired place and to fulfill various recording requirements. Bipolar or quadripolar electrode catheters are used to record and pace from specific sites of interest within the atria or ventricles. These catheters come with a variety of preformed distal curve shapes and sizes (Fig. 4-1). Multipolar recording electrode catheters are placed within the coronary sinus (CS) or along the crista terminalis in the right atrium (RA). The Halo catheter is a multipolar catheter used to map atrial electrical activity around the tricuspid annulus during atrial tachycardias, as well as for locating right-sided bypass tracts (BTs) (Fig. 4-2). A decapolar catheter with a distal ring configuration (Lasso catheter) is used to record electrical activity from the pulmonary vein (PV; Fig. 4-3). Basket catheters capable of conforming to the chamber size and shape have also been used for mapping atrial and ventricular arrhythmias (Fig. 4-4). Special catheters are also used to record LA and left ventricular (LV) epicardial activity from the CS branches.5
FIGURE 4-1 Multipolar electrode catheters with different preformed curve shapes.
(Courtesy of Boston Scientific, Boston.)
FIGURE 4-3 Lasso catheter with two different loop sizes.
(Courtesy of Biosense Webster, Inc., Diamond Bar, Calif.; www.BiosenseWebster.com.)
Catheters can have a fixed or deflectable tip. Steerable catheters allow deflection of the tip of the catheter in one or two directions in a single plane; some of these catheters have asymmetrical bidirectional deflectable curves (Fig. 4-5).
FIGURE 4-5 Deflectable multipolar electrode catheters with different curve sizes and shapes.
(Courtesy of Boston Scientific, Boston.)
Ablation catheters have tip electrodes that are conventionally 4 mm long and are available in sizes up to 10 mm in length (Fig. 4-6). The larger tip electrodes on ablation catheters reduce the resolution of a map obtained using recordings from the distal pair of electrodes.
Catheter Positioning
The percutaneous technique is used almost exclusively. RA, His bundle (HB), and right ventricular (RV) electrograms are most commonly recorded using catheters inserted via a femoral vein. Some other areas (e.g., the CS) are more easily reached through the superior vena cava (SVC), although the femoral approach can be adequate in most cases. Insertion sites can also include the antecubital, jugular, and subclavian veins. Femoral arterial access can be required for mapping of the LV or mitral annulus or for invasive blood pressure monitoring. Occasionally, an epicardial approach is required to map and ablate certain VTs and BTs as well as the sinus node. For this purpose, the epicardial surface is accessed via the CS and its branches or percutaneously (subxiphoid puncture).6
Fluoroscopy is conventionally used to guide intracardiac positioning of the catheters. It is important to remember that catheters can be withdrawn without fluoroscopy, but they should always be advanced under fluoroscopy guidance. More recently, newer navigation systems have been tested to guide catheter positioning in an effort to limit radiation exposure (see Chap. 6).
Transcaval Approach
The modified Seldinger technique is used to obtain multiple venous accesses. The femoral approach is most common, but the subclavian, internal jugular, or brachial approaches may be used, most often for the placement of a catheter in the CS.6
Right AtriAL Catheter
A fixed-tip, 5 or 6 Fr quadripolar electrode catheter is typically used. The RA may be entered from the IVC or SVC. The femoral veins are the usual entry sites. Most commonly, stimulation and recording from the RA is performed by placing the RA catheter tip at the high posterolateral wall at the SVC-RA junction in the region of the sinus node or in the RA appendage (Fig. 4-7).
Right VentricULAR Catheter
A fixed-tip, 5 or 6 Fr quadripolar electrode catheter is typically used. All sites in the RV are accessible from any venous approach. The RV apex is most commonly chosen for stimulation and recording because of stability and reproducibility (see Fig. 4-7).
His Bundle Catheter
A fixed- or deflectable-tip, 6 Fr quadripolar electrode catheter is typically used. The catheter is passed via the femoral vein into the RA and across the tricuspid annulus until it is clearly in the RV (under fluoroscopic monitoring, using the right anterior oblique [RAO] view; see Fig. 4-7). It is then withdrawn across the tricuspid orifice while maintaining a slight clockwise torque for good contact with the septum until a His potential is recorded. Initially, a large ventricular electrogram can be observed, then, as the catheter is withdrawn, the right bundle branch (RB) potential can appear (manifesting as a narrow spike less than 30 milliseconds before the ventricular electrogram). When the catheter is further withdrawn, the atrial electrogram appears and grows larger. The His potential usually appears once the atrial and ventricular electrograms are approximately equal in size and is manifest as a biphasic or triphasic deflection interposed between the local atrial and ventricular electrograms. If the first pass was unsuccessful, the catheter should be passed again into the RV and withdrawn with a slightly different rotation. If, after several attempts, a His potential cannot be recorded using a fixed-tip catheter, the catheter should be withdrawn and reshaped, or it may be exchanged with a deflectable-tip catheter. Once the catheter is in place, a stable recording can usually be obtained. Occasionally, continued clockwise torque on the catheter shaft is required to obtain a stable HB recording, which can be accomplished by looping the catheter shaft remaining outside the body and fixing the loop by placing a couple of towels on it, or by twisting the connection cable in the opposite direction so that it maintains a gentle torque on the catheter.
Coronary Sinus Catheter
The standardized RAO and left anterior oblique (LAO) fluoroscopic views are used to guide placement of catheters in the CS. Although the CS cannot be directly visualized with standard fluoroscopy, the epicardial fat found in the posteroseptal space just posterior to the CS os can be visualized as a characteristic radiolucency on cine fluoroscopy in the RAO projection, where the cardiac and diaphragmatic silhouettes meet.7
When cannulating the CS from the SVC approach, the LAO view is used, the catheter tip is directed to the left of the patient, and the catheter is advanced with some clockwise torque to engage the CS os; electrodes should resemble rectangles rather than ovals when the catheter tip is properly oriented to advance into the CS. Once the CS os is engaged, the catheter is further advanced gently into the CS, so that the most proximal electrodes lie at the CS os (see Fig. 4-7).
During cannulation of the CS from the IVC approach, the tip of the catheter is first placed into the RV, in the RAO fluoroscopy view, and flexed downward toward the RV inferior wall (Video 2 ). Subsequently, the catheter is withdrawn until it lies at the inferoseptal aspect of the tricuspid annulus. In the LAO or RAO view, the catheter is then withdrawn gently with clockwise rotation until the tip of the catheter drops into the CS os. Afterward, the catheter is advanced into the CS concomitantly with gradual release of the catheter curve (Fig. 4-8). Alternatively, the tip of the catheter is directed toward the posterolateral RA wall and advanced with a tight curve to form a loop in the RA, in the LAO view, with the tip directed toward the inferomedial RA. The tip is then advanced with gentle up-down, right-left manipulation using the LAO and RAO views to cannulate the CS. In the RAO view, the atrioventricular (AV) fat pad (containing the CS) appears as more radiolucent than surrounding heart tissue.
Transaortic Approach
This approach is generally used for mapping the LV and mitral annulus (for VT and left-sided BTs). The right femoral artery is most commonly used. The mapping-ablation catheter is passed to the descending aorta, and, in this position, a tight J curve is formed with the catheter tip before passage to the aortic root to minimize catheter manipulation in the arch. In a 30-degree RAO view, the curved catheter is advanced through the aortic valve with the J curve opening to the right, so the catheter passes into the LV oriented anterolaterally (Fig. 4-9; Video 3 ). The straight catheter tip must never be used to cross the aortic valve because of the risk of leaflet damage or perforation and also because the catheter tip can slip into the left or right coronary artery or a coronary bypass graft, thus mimicking entry to the LV and causing damage to these structures.
Transseptal Approach
Mapping and ablation in the LA are performed through a transseptal approach. Knowledge of septal anatomy and its relationship with adjacent structures is essential to ensure safe and effective access to the LA. Many apparent septal structures are not truly septal. The true interatrial septum is limited to the floor of the fossa ovalis, the flap valve, and the anteroinferior rim of the fossa. Therefore, the floor of the fossa (with an average diameter of 18.5 ± 6.9 mm [vertically] and 10.0 ± 2.4 mm [horizontally] and 2 mm thickness) is the target for atrial septal crossing. The area between the superior border of the fossa and the mouth of the SVC is an infolding of the atrial wall filled with adipose tissue. Although this area is often referred to as the septum secundum, it is not really a true septum, and puncture in this region would lead to exiting of the heart. The infolded groove ends at the superior margin (superior rim) of the fossa ovalis. Anterior and superior to the fossa ovalis, the RA wall overlies the aortic root. Advancing the transseptal needle in this area can puncture the aorta.
Fluoroscopy-Guided Transseptal Catheterization
The Brockenbrough needle is advanced into the dilator until the needle tip is within 1 to 2 cm of the dilator tip. The needle tip must be kept within the dilator at all times, except during actual septal puncture. The curves of the dilator, sheath, and needle should be aligned so that they are all in agreement and not contradicting each other. The sheath, dilator, and needle assembly is then rotated leftward and posteriorly (usually with the Brockenbrough needle arrow pointing at the 3 to 6 o’clock position relative to its shaft) and retracted caudally as a single unit (while maintaining the relative positions of its components) to engage the tip of the dilator into the fossa ovalis. Under fluoroscopy monitoring (30-degree LAO view), the dilator tip moves slightly leftward on entering the RA and then leftward again while descending below the aortic root. A third abrupt leftward movement (“jump”) below the aortic root indicates passage over the limbus into the fossa ovalis (Fig. 4-10). This jump generally occurs at the level of the HB region (marked by an EP catheter recording the HB potential). If the sheath and dilator assembly is pulled back farther than intended (i.e., below the level of the fossa and HB region), the needle should be withdrawn and the guidewire placed through the dilator into the SVC. The sheath and dilator assembly is then advanced over the guidewire into the SVC and repositioning attempted, as described earlier. The sheath and dilator assembly should never be advanced without the guidewire at any point during the procedure.
Several fluoroscopic markers are used to confirm the position of the dilator tip at the fossa ovalis. As noted, an abrupt leftward movement (jump) of the dilator tip below the aortic knob is observed as the tip passes under the muscular atrial septum onto the fossa ovalis (see Video 4 ). In addition, the posterior extent of the aortic root can be marked by a pigtail catheter positioned through the femoral artery in the noncoronary cusp or by the HB catheter (recording a stable proximal HB potential), which lies at the level of the fibrous trigone opposite and caudal to the noncoronary aortic cusp. When the dilator tip lies against the fossa ovalis, it is directed posteroinferiorly to the proximal HB electrode (or pigtail catheter) in the RAO view and to the left of the proximal HB electrode (or pigtail catheter) in the LAO view (see Fig. 4-10). Another method that can be used to ensure that the tip is against the fossa ovalis is injection of 3 to 5 mL of radiopaque contrast through the Brockenbrough needle to visualize the interatrial septum. The needle tip then can be seen tenting the fossa ovalis membrane with small movements of the entire transseptal apparatus. Typically, septal staining remains visible after contrast injection, which allows for real-time septal visualization while monitoring the pressure during transseptal puncture.
Once the position of the dilator tip is confirmed at the fossa ovalis, the needle, dilator, and sheath assembly is pushed slightly against the interatrial septum, and the needle is then briskly advanced to protrude outside the dilator in the LAO view during continuous pressure monitoring. If excessive force is applied without a palpable “pop” to the fossa, then the Brockenbrough needle likely is not in proper position. After passage through the fossa ovale and before advancing the dilator and sheath, an intraatrial position of the needle tip within the LA, rather than the ascending aorta or posteriorly into the pericardial space, needs to be confirmed. Recording an LA pressure waveform from the needle tip confirms an intraatrial location (Fig. 4-11). An arterial pressure waveform indicates intraaortic position of the needle. Absence of a pressure wave recording can indicate needle passage into the pericardial space or sliding up and not puncturing through the atrial septum. A second method is injection of contrast through the needle to assess the position of the needle tip. Opacification of the LA (rather than the pericardium or the aorta) verifies the successful transseptal access. Alternatively, passing a 0.014-inch floppy guidewire through the Brockenbrough needle into a left-sided PV (beyond the cardiac silhouette in the LAO fluoroscopy view) helps verify that needle tip position is within the LA (see Video 4 ). If the guidewire cannot be advanced beyond the fluoroscopic border of the heart, pericardial puncture should be suspected. In addition, aortic puncture should be suspected if the guidewire seems to follow the course of the aorta. In these situations, contrast should be injected to assess the position of the Brockenbrough needle before advancing the transseptal dilator. Sometimes, the guidewire enters the LA appendage rather than a PV; in this setting, a clockwise torque of the sheath and dilator assembly can help direct the guidewire posteriorly toward the ostium of the left superior or left inferior PV.
Once the position of the needle tip is confirmed to be in the LA, both the sheath and dilator are advanced as a single unit over the needle by using one hand while fixing the Brockenbrough needle in position with the other hand (to prevent any further advancement of the needle). Preferably, the sheath and dilator assembly is advanced into the LA over a guidewire placed distally into a left-sided PV, which helps direct the path of the assembly as it enters the LA and minimize the risk of inadvertent puncture of the lateral LA wall. Once the dilator tip is advanced into the LA over the needle tip, the needle and dilator are firmly stabilized as a unit—to prevent any further advancement of the needle and dilator—and the sheath is advanced over the dilator into the LA. Once the transseptal sheath tip is within the LA, the dilator and needle are withdrawn slowly during continuous flushing through the needle or while suction is maintained through a syringe placed on the sheath side port to minimize the risk of air embolism and while fixing the sheath with the other hand to prevent dislodgment outside the LA. The sheath should be aspirated until blood appears without further bubbles; this usually requires aspiration of approximately 5 mL. The sheath is then flushed with heparinized saline at a flow rate of 3 mL/min during the entire procedure.
Intracardiac Echocardiography–Guided Transseptal Catheterization
Two types of ICE imaging systems are currently available, the electronic phased-array ultrasound catheter and the mechanical ultrasound catheter.8 The electronic phased-array ultrasound catheter sector imaging system (AcuNav, Siemens Medical Solutions, Malvern, Pa.) uses an 8 or 10 Fr catheter that has a forward-facing 64-element vector phased-array transducer scanning in the longitudinal plane. The catheter has a four-way steerable tip (160-degree anteroposterior or left-right deflections). The catheter images a sector field oriented in the plane of the catheter. The mechanical ultrasound catheter radial imaging system (Ultra ICE, EP Technologies, Boston Scientific, San Jose, Calif.) uses a 9-MHz catheter-based ultrasound transducer contained within a 9 Fr (110-cm length) catheter shaft. It has a single rotating crystal ultrasound transducer that images circumferentially for 360 degrees in the horizontal plane. The catheter is not freely deflectable.
When using the mechanical radial ICE imaging system, a 9 Fr sheath, preferably a long, preshaped sheath, for the ICE catheter is advanced via a femoral venous access. To enhance image quality, all air must be eliminated from the distal tip of the ICE catheter by flushing vigorously with 5 to 10 mL of sterile water. The catheter then is connected to the ultrasound console and advanced until the tip of the rotary ICE catheter images the fossa ovalis. Satisfactory imaging of the fossa ovalis for guiding transseptal puncture is viewed from the mid-RA (Fig. 4-12).8
The AcuNav ICE catheter is introduced under fluoroscopy guidance through a 23-cm femoral venous sheath. Once the catheter is advanced into the mid-RA with the catheter tension controls in neutral position (the ultrasound transducer oriented anteriorly and to the left), the RA, tricuspid valve, and RV are viewed. This is called the home view (Fig. 4-13A; see Video 5 ). Gradual clockwise rotation of a straight catheter from the home view allows sequential visualization of the aortic root and the pulmonary artery (see Fig. 4-13B), followed by the CS, the mitral valve, the LA appendage orifice, and a cross-sectional view of the fossa ovalis (see Fig. 4-13C and D). The mitral valve and interatrial septum are usually seen in the same plane as the LA appendage. Posterior deflection or right-left steering of the imaging tip in the RA, or both, is occasionally required to optimize visualization of the fossa ovalis; the tension knob (lock function) can then be used to hold the catheter tip in position. Further clockwise rotation beyond this location demonstrates images of the left PV ostia (see Fig. 4-13E). The optimal ICE image to guide transseptal puncture demonstrates adequate space behind the interatrial septum on the LA side and clearly identify adjacent structures, but it does not include the aortic root because it would be too anterior for the interatrial septum to be punctured safely. In patients with an enlarged LA, a cross-sectional view that includes the LA appendage is also optimal if adequate space exists behind the atrial septum on the LA side.8
The sheath, dilator, and needle assembly is introduced into the RA, and the dilator tip is positioned against the fossa ovale, as described earlier. Before advancing the Brockenbrough needle, continuous ICE imaging should direct further adjustments in the dilator tip position until ICE confirms that the tip is in intimate contact with the middle of the fossa, confirms proper lateral movement of the dilator toward the fossa, and excludes inadvertent superior displacement toward the muscular septum and aortic valve. With further advancement of the dilator, ICE demonstrates tenting of the fossa (Fig. 4-14 and see Fig. 4-12). If the distance from the tented fossa to the LA free wall is small, minor adjustments in the dilator tip position can be made to maximize the space. The Brockenbrough needle is then advanced. With successful transseptal puncture, a palpable pop is felt, and sudden collapse of the tented fossa is observed (see Fig. 4-14). Advancement of the needle is then immediately stopped. Saline infusion through the needle is visualized on ICE as bubbles in the LA, thus confirming successful septal puncture (see Video 6 ). With no change in position of the Brockenbrough needle, the transseptal dilator and sheath are advanced over the guidewire into the LA, as described earlier.
Alternative Methods for Difficult Transseptal Catheterization
In some cases, the conventional approach using a Brockenbrough needle sheath fails to pierce the septum because of the presence of a small fossa area, a thick interatrial septum, fibrosis and scarring of the septum from previous interventions, or an aneurysmal septum with excessive laxity. Applying excessive force to the needle, dilator, and sheath assembly against a resistant septum (which can be seen as bending and buckling of the assembly in the RA) can lead to building pressure of the needle tip on the septum, which can potentially lead to an uncontrolled sudden jump of the assembly once across the stiff or fibrotic fossa ovalis, thus perforating the opposing lateral LA wall. Similarly, excessive tenting of the interatrial septum (beyond halfway into the LA) can bring it in close proximity to the lateral LA wall, so that the needle can potentially puncture the lateral LA wall once across the septum. Some of these difficulties can sometimes be overcome by manual reshaping of the curvature of the Brockenbrough needle tip, applying slight rotation on the needle and sheath assembly to puncture a different point on the fossa ovalis, using a sharper transseptal needle type (BRK-1 extra sharp), or utilizing a 0.014-inch, sharp-tipped, J-shaped transseptal guidewire (Safe Sept, Pressure Products, Inc., San Pedro, Calif.).9–13
Other techniques to facilitate transseptal puncture include radiofrequency (RF) perforation of the fossa ovalis and the application of pulses of electrosurgical cautery or RF energy to the proximal end of the Brockenbrough needle. Once the position of the dilator tip is confirmed at the fossa ovalis (under ICE guidance), the needle is advanced beyond the tip of the dilator in contact with the septum until resistance is met. RF energy (5 to 30 W for 1 to 11 seconds) can be applied through a conventional ablation catheter electrode brought manually in contact with the proximal hub of the transseptal needle. Typically, the fossa is punctured almost instantaneously (within 1 to 2 seconds) following RF application. Alternatively, electrosurgical cautery (set to 15 to 20 W for a 1- to 2-second pulse of cut-mode cautery) is applied to the proximal hub of the needle as its tip is advanced out of the dilator. Importantly, the cautery should be initiated on the needle handle prior to pushing the needle tip beyond the dilator tip to help minimize the power needed to puncture the septum, and it should be stopped as soon as the needle is pushed out fully.14–16
Additionally, a specialized, electrically insulated RF-powered needle (Baylis Medical Company, Inc., Montreal) has been developed to facilitate transseptal puncture. The needle is connected to a proprietary RF generator (RFP-100 RF Puncture Generator, Baylis Medical), which delivers RF energy to the rounded, closed tip of the needle positioned at the interatrial septum. Once septal tenting is visualized on the ICE, RF energy is applied at 10 W for 2 seconds. The RF perforation generators apply a higher voltage for short durations, resulting in a high-energy electric field and an almost instantaneous temperature rise to 100°C, leading to steam popping and septal perforation with minimal collateral tissue damage. In contrast, conventional RF generators deliver a higher power with a lower voltage and impedance range for longer periods of time, with resulting thermal destruction of the local tissue around the needle tip, rather than perforation.17,18
These methods help minimize pressure application to the needle as it crosses the septum and tenting of the septum, which can potentially reduce the chances of sudden advancement through the lateral LA as the needle crosses the septum. Nonetheless, the powered needle can potentially be more traumatic at the puncture site than a standard needle, and it is possible that the transseptal puncture site created with a powered needle is less likely to close spontaneously. Similarly, inadvertent cardiac perforation occurring in the setting of powered needles can potentially be associated with greater consequences. Whether RF is more likely to cause a thrombus at the puncture site compared with a standard needle is unknown.17–19
Complications of Atrial Transseptal Puncture
Injury to cardiac and extracardiac structures is the most feared complication. Because of its stiffness and large caliber, the transseptal dilator should never be advanced until the position of the Brockenbrough needle is confirmed with confidence. Advancing the dilator into an improper position can be fatal. Therefore, many operators recommend the use of ICE-guided transseptal puncture, especially for patients with normal atrial size.19
Another potential complication is embolism of thrombus or air. To avoid air embolism, catheters must be advanced and withdrawn slowly so as not to introduce air into the assembly. Sheaths must be aspirated with a syringe on a stopcock to the amount of their volume (e.g., an 8 Fr sheath contains 5 mL when filled) to remove any retained air. Thromboembolic complications can be avoided by flushing all sheaths and guidewire with heparinized saline and maintaining the ACT at longer than 300 seconds. In addition, a guidewire should not be left in the LA for more than 1 minute, especially if no systemic heparin has been administered. Administration of heparin before, rather than after, the atrial septal puncture can also help reduce thromboembolism.19
In patients with atrial septal defect closure devices, puncture is preferably performed at the portion of the septum located inferior and posterior to the closure device and not through the device itself. In patients with a septal stitch or pericardial or Dacron patch, puncture can be achieved through the thickened septum or the patch. However, transseptal access is typically not achievable through a Gore-Tex patch (W.L. Gore & Associates, Flagstaff, Ariz.) because of its resistant texture; instead, puncture can be performed directly through neighboring native interatrial tissue. When the patch is wide, sufficient free septal tissue for transseptal puncture may not be available, in which setting transseptal access to the LA may not be feasible.19,20
Epicardial Approach
Coronary veins can be used to perform epicardial mapping, but manipulation of the mapping catheter is limited by the anatomical distribution of these vessels. Therefore, the subxiphoid percutaneous approach to the epicardial space is the only technique currently available that allows extensive and unrestricted mapping of the epicardial surface of both ventricles, and it has been used most commonly for VT mapping and ablation. The epicardial approach for mapping and ablation is discussed in Chapter 27.6
Baseline Measurements
Intracardiac Electrograms
Whereas the surface ECG records a summation of the electrical activity of the entire heart, intracardiac electrograms recorded by the electrode catheter represent only the electrical activity (phase 0 of the action potential) of the local cardiac tissue in the immediate vicinity of the catheter’s electrodes. Cardiac electrograms are generated by the potential (voltage) differences recorded at two recording electrodes during the cardiac cycle. All clinical electrogram recordings are differential recordings from one source that is connected to the anodal (positive) input of the recording amplifier and a second source that is connected to the cathodal (negative) input.21
Analog Versus Digital Recordings
Intracardiac electrograms are recorded with amplifiers that have high-input impedances (more than 1010 Ω), to decrease unwanted electrical interference and ensure high-quality recordings.21 Analog recording systems directly amplify the potential from the recording electrodes, plot the potential on a display oscilloscope, and write it to recording paper or store it on magnetic tape, or both. Analog systems have largely been replaced by digital recording systems that use an analog to digital (A/D) converter that converts the amplitude of the potential recorded at each point in time to a number that is stored.
The quality of digital data is influenced by the sampling frequency and precision of the amplitude measurement.21
[/not-level-membership-for-cardiovascular-category]
