Chapter 34 Diseases Associated with Primary Abnormalities in Carbohydrate Metabolism
Abnormalities of Galactose Metabolism
Galactosemia
Galactosemia describes a family of autosomal-recessive disorders characterized by increased blood levels of galactose. Galactose cannot be used directly for glycolysis, and must be converted to glucose-1-phosphate. Five enzymes are involved in this interconversion in most species: galactose mutarotase, galactokinase, galactose-1-phosphate uridyltransferase, uridine diphosphogalactose-4-epimerase, and phosphoglucomutase [Sellick et al., 2008]. Mutations in the GALK, GALT, and GALE genes that encode the second, third, and fourth enzymes, respectively, cause deficiency or absence of these enzymes, with consequent galactosemia [Fridovich-Keil, 2006]. These enzymes comprise the Leloir pathway. Human galactose mutarotase deficiency has not been described.
Galactose-1-Phosphate Uridyltransferase Deficiency
Galactose-1-phosphate uridyltransferase (GALT) deficiency is by far the most common cause of galactosemia. The incidence of galactosemia in Western Europe varies between 1:23,000 and 1:44,000 [Bosch, 2006]. Neonatal screening programs have found population incidence rates as high as 1 in 19,700 in Estonia [Ounap et al., 2010].
Pathology
The precise link between the metabolic abnormality and the neuropathologic condition remains unknown. Galactose-1-phosphate uridyltransferase is present in the brain in low concentrations. Studies of rat brain reveal no significant site-specific differences in enzyme activity [Rogers et al., 1992]. Hypoglycemia may contribute significantly to the pathologic findings in many cases. The toxic effect of galactitol accumulation is not fully understood but is clearly relevant to adverse outcomes in the brain and lens. Animal data suggest that osmotic and oxidative stress in the lens activates the unfolded protein response [Mulhern et al., 2006]. Great variety and widespread distribution of the accompanying lesions have been documented.
Only two autopsy reports have been published; these were reviewed by Ridel et al. [2005]. The two patients were severely impaired and died at 8 and 25 years, respectively. In both cases, there was diffuse white matter gliosis, with focal areas of infarction. There was marked depletion of cerebellar Purkinje cells, with sparing of the granular layer and neuronal loss in the dentate nuclei and inferior olives. Cortical neuronal degeneration depleted the entire cerebral cortex, including Ammon’s horn, albeit to a variable extent and in different patterns. Spongiform changes are pronounced in some areas. Other findings included mild pigmentary changes in the surviving neurons, perineuronal satellitosis, and mild, diffuse microglial activation. Sclerotic and atrophic white matter were evident, as were dense accumulations of iron-containing and non-iron-containing pigment material in the reticular zone of the substantia nigra and the globus pallidus. Histochemical staining of the pigment indicated the presence of lipoprotein and polysaccharides. Pigment accumulation was accompanied by neuronal degeneration in the substantia nigra and dysmyelination in the globus pallidus. Bright pink eosinophilic hyaline-like bodies resembling axonal spheroids were present in the thalamus.
Biochemistry
The primary abnormality in galactosemia is the deficiency of activity of galactose-1-phosphate uridyltransferase (Figure 34-1) that leads to accumulation of galactose-1-phosphate in red blood cells, liver, and brain [Lai et al., 2009].
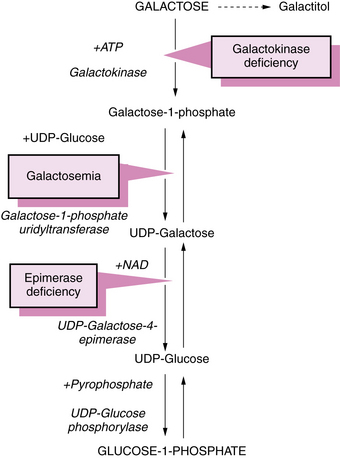
Fig. 34-1 Pathway of galactose metabolism depicting sites of metabolic block that lead to galactosemia.
ATP, adenosine triphosphate; NAD, nicotinamide adenine dinucleotide; UDP, uridine diphosphate.
Galactose is metabolized through the following four possible pathways [Fridovich-Keil, 2006]:
In classic galactosemia, the fourth pathway is obstructed; the other pathways function normally.
Shih and colleagues assigned the GALT locus to 9p13 by gene dosage [Shih et al., 1984]. A number of mutations produce abnormal enzymes with little or no galactose-1-phosphate uridyltransferase activity [Reichardt, 1991; Reichardt et al., 1992]. It is therefore not surprising that various genetic forms of galactosemia result from the presence of inefficient isoenzymes of galactose-1-phosphate uridyltransferase (Table 34-1). Most patients are compound heterozygotes, not true molecular homozygotes [Elsas et al., 1995].
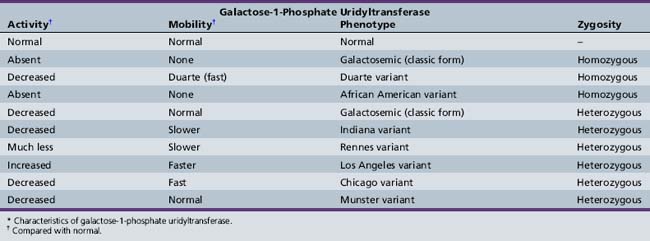
The isoenzymes are separated and identified by electrophoresis. Cross-reactivity patterns for the enzyme variants have been studied using rabbit antibodies to purify human placental galactose-1-phosphate uridyltransferase [Andersen et al., 1984]. Transferase activity is absent in homozygous classic galactosemia (Q188R – the most common mutation in the United States, arising in Western Europe about 20,000 years ago [Flanagan et al., 2010]) and the African American variant (S135L – accounting for 8.4 percent of U.S. cases [Lai and Elsas, 2001]), virtually absent in the Rennes variant [Schapira and Kaplan, 1969], and abnormally low in the Chicago, Indiana, and Duarte (N314D) variants [Beutler et al., 1965; Lai et al., 1998; Levy et al., 1978]. Activity is normal in the Los Angeles variant (L218L) [Applegarth et al., 1976; Ng et al., 1973]. A screening method utilizing a standard newborn screening blood spot has been described that detects the four most common GALT alleles (Q188R, S135L, K285N, and L195P) and the N314D Duarte variant with a turnaround time of less than 2 hours [Dobrowolski et al., 2003]. By January 2010, 239 sequence variants had been described in the GALT mutation database [Calderon et al., 2007], most of which were missense mutations. The precise molecular mechanisms of galactosemia are not yet known, but a computational biology approach has yielded insights into the structure–function relationships of many mutations [Facchiano and Marabotti, 2010].
Galactokinase or transferase activity appears to be lower than expected in many women who give birth to nongalactosemic children with cataracts [Harley et al., 1974].
Clinical Characteristics
Infants usually are normal at birth, except for a slight decrease in birth weight [Hsia and Walker, 1961]. Symptoms become apparent when milk feedings begin. Jaundice usually develops between 4 and 10 days of age and persists for a longer period than does physiologic jaundice [Donnell et al., 1967]. Progressive hepatic involvement in the first several weeks causes edema, hepatomegaly, and hypoprothrombinemia. Renal dysfunction is accompanied by generalized aminoaciduria, proteinuria, and acidosis. Escherichia coli sepsis is a common complication [Levy et al., 1977]. Mild hypoglycemia also is common [Donnell et al., 1967]. Cataracts appear between 4 and 8 weeks, reflecting the accumulation of galactose-1-phosphate or galactitol. Studies in animals show that apoptosis of lens epithelial cells and cataract formation are directly related to galactitol accumulation and are prevented by aldose reductase inhibitors [Murata et al., 2001]. Apoptosis may be triggered by altered p53 expression secondary to the accumulating metabolites [Takamura et al., 2003].
Central nervous system impairment is manifested by lethargy and hypotonia, often associated with cerebral edema [Huttenlocher et al., 1970; Welch and Milligan, 1987], and may be documented by computed tomography (CT) scanning [Belman et al., 1986]. Cerebral edema in an encephalopathic neonate with galactose-1-phosphate uridyltransferase deficiency has been correlated with increased brain galactitol on magnetic resonance (MR) spectroscopy [Berry et al., 2001]. A subgroup of patients may develop marked ataxia and tremor, which does not correlate with cognitive abilities or dietary restriction [Ridel et al., 2005]. Seizures have been reported in two siblings with galactosemia [Ridel et al., 2005], and chorea in a single case [Shah et al., 2009]. After the appearance of neurologic symptoms, the patient may experience anorexia, vomiting, or diarrhea.
Gonadal function in women with galactosemia is abnormal and usually manifests as primary ovarian failure. Both hypergonadotropic hypogonadism and abnormal response to gonadotropin-releasing hormone may be present. The mechanisms of ovarian failure are not yet fully understood, but likely include direct toxicity of galactose and its metabolites, incomplete galactosylation of glycoconjugates, oxidative stress and activation of apoptosis [Forges et al., 2006]. Some women with galactosemia do become pregnant; neither they nor their offspring seem to be affected by elevated levels of galactose, at least in the short term [Gubbels et al., 2008].
If treatment is not instituted, moderate to severe intellectual and motor retardation ensue in a majority of cases. Even in patients who are treated adequately, cognitive disability is common, but usually does not progress over time [Schadewaldt et al., 2010]. Language impairment is prominent [Hansen et al., 1996], and takes the form of verbal dyspraxia in about 50 percent of patients with galactose-1-phosphate uridyltransferase deficiency [Webb et al., 2003]. The risk of dyspraxia is associated with elevated mean galactose-6-phosphate and urinary galactitol concentrations, and with impaired total body galactose metabolism, as assessed by a carbon dioxide breath test [Hansen et al., 1996; Webb et al., 2003]. The characteristics of retardation resulting from untreated galactosemia are nonspecific. Pregnant women at risk of giving birth to galactosemic infants require strict restriction of galactose intake and close metabolic monitoring to prevent congenital cataracts in offspring. One study of 33 subjects aged 4–16 years found that children with galactosemia and speech disorders had a 4–6 times greater risk for language impairment than children with early speech disorders of unknown origin. Notwithstanding a negative effect of early dietary lactose exposure, the data suggested an antenatal origin of language disorder in most cases [Potter et al., 2008]. The incidence of speech and language disorders also appears to be increased in children with Duarte galactosemia, in whom galactose was restricted in the first 12 months [Powell et al., 2009].
Prenatal diagnosis is possible by means of galactose-1-phosphate uridyltransferase assay using cultured amniotic fluid cells or chorionic villus biopsy specimens, and by galactitol estimation in amniotic fluid supernatant [Holton et al., 1989]. When both mutations in an index case have been identified, direct molecular analysis is the preferred method of prenatal diagnosis [Elsas, 2001].
Occasional patients with genotypes and residual enzyme activity usually associated with severe phenotypes present with mild manifestations despite lack of dietary restriction. In one such case, the patient’s markedly reduced galactitol production, presumably reflecting limited aldose reductase activity, was identified as a major factor in preventing neurologic injury despite her classic Q188R missense mutations [Lee et al., 2003; Segal, 2004].
Clinical Laboratory Tests
Biochemical tests for galactosemia screen for elevated levels of small molecules and directly assay the enzymes in the Leloir pathway. Detailed protocols have been published outlining the methods, including their rationale and interpretation [Cuthbert et al., 2008].
A fluorescent spot test for erythrocyte transferase activity (the Beutler test) is quite sensitive [Beutler and Baluda, 1966], but can yield false-negative results if the subject has received a blood transfusion up to 120 days earlier, because of residual galactose-1-phosphate uridyltransferase activity in the transfused blood. Enzyme activity is relatively low in heterozygous persons; this phenomenon aids in identifying carriers.
Galactose tolerance testing is potentially dangerous and should be undertaken only for well-planned investigational purposes [Donnell et al., 1967]. Bedside urine testing is positive for reducing substances (Benedict’s test) but negative for glucose by the glucose oxidase method. Chromatography definitively identifies galactose as the abnormal metabolite.
Antibiotics may interfere with neonatal screening [Clemens et al., 1986]. Urinary galactose may be present in neonates with hepatic dysfunction in disorders other than galactosemia. Repeated attempts at detecting the reducing substance must be made because galactosuria may be inconstant as a result of fluctuating galactose or lactose ingestion. Generalized aminoaciduria, proteinuria, and abnormalities on liver function tests are common.
Screening tests that use E. coli bacteriophage assay of galactose and galactose-1-phosphate in dried blood samples are available and are useful for large-volume applications [Jinks et al., 1987; Schulpis et al., 1997].
Magnetic resonance imaging (MRI) in 67 transferase-deficient galactosemic patients revealed that 22 had mild cerebral atrophy, 8 had cerebellar atrophy, and 11 had multiple small hyperintense lesions in the cerebral white matter on T2-weighted images. The patients with classic galactosemia (those without measurable transferase activity) older than 1 year of age did not manifest the expected maturational decrease in peripheral white matter signal intensity on intermediate- and T2-weighted images. Interference with normal galactocerebroside formation may explain these findings [Nelson et al., 1992]. A study of MRI and MR spectroscopy in 14 sibling pairs found that delayed or absent myelination of the deep white matter was the most common finding; some individuals showed cerebellar atrophy, others ventricular dilatation [Hughes et al., 2009]. There was no correlation between dietary control or clinical status and the imaging findings. An infant was studied with MRI and MR spectroscopy, and was found to have increased signal in the cerebral white matter associated with increased diffusion. MR spectroscopy showed a peak at 3.7 ppm, consistent with galactitol. NAA/Cr, Cho/Cr, mI/Cr ratios were also decreased [Cakmakci et al., 2009].
Management
Because galactose is a nonessential nutrient, exclusion from the diet is relatively easy and without complication. Milk, the primary galactose-containing fluid, can be avoided by the use of vegetable product substitutes [Hansen, 1969]. Unfortunately, certain fruits and vegetables contain relatively high concentrations of galactose, including bell peppers, dates, tomatoes, papaya, and watermelon [Gross and Acosta, 1991]. Appropriate diets are available. The widespread use of cow’s milk in the newborn diet makes early diagnosis essential. Intellectual and personality impairment is most successfully prevented with early treatment [Fishler et al., 1972]. Studies of the long-term outcome of therapy have been relatively disappointing, particularly in regard to central nervous system and ovarian dysfunction [Widhalm et al., 1997]. A report based on a German cross-sectional study was more encouraging, suggesting that infants given appropriate treatment by 5 days of age achieved better outcomes than did those in whom treatment was begun later [Schweitzer-Krantz, 2003].
Most acute sequelae of the disease, including cirrhosis, are ameliorated with therapy, even if briefly delayed [Donnell et al., 1967]. Cataracts also may recede or disappear. Cataract formation in severely galactosemic rats has been prevented by inhibitors of aldose reductase. Signs or symptoms of sepsis should be investigated with blood, urine, and cerebrospinal fluid cultures to detect E. coli.
Because dietary therapy does not uniformly alleviate many of the sequelae of the disease, new strategies for therapy are necessary. The use of folic acid has been advocated as a supplement to galactose restriction to enhance transferase activity [Segal and Rogers, 1990]. Uridine administration demonstrated some promise in enhancing galactose transformation [Holton, 1990], but a trial of oral uridine did not reveal any evidence of benefit to neurocognitive functioning in treated versus untreated cases [Manis et al., 1997]. Neurologic complications may occur as late as the fourth decade of life [Friedman et al., 1989].
Unfortunately, galactose-1-phosphate appears to accumulate in the galactosemic fetus in spite of maternal milk restriction [Irons et al., 1985].
Uridine Diphosphogalactose Epimerase Deficiency
Uridine diphosphogalactose epimerase (GALE) deficiency has conventionally been separated into peripheral and generalized forms, implying a dichotomy between levels of enzyme activity in blood and other tissues. Ten children in a study were diagnosed with peripheral GALE deficiency as neonates were found to have a range of GALE activity in lymphoblasts (i.e., nonperipheral tissue), that was correlated with metabolic abnormalities in some patients, implying that this is a spectrum disorder, and not a binary condition as suggested in the older literature [Openo et al., 2006]. Children previously recognized with generalized (severe) deficiency of GALE (see Figure 34-1) [Bowling et al., 1986; Garibaldi et al., 1986; Sardharwalla et al., 1988; Walter et al., 1999] had manifestations resembling those in classic galactosemia. Most survivors were dysmorphic and deaf. The GALE locus is at 1p36–p35; the human GALE gene is about 4 kilobases (kb) in length and contains 11 exons [Maceratesi et al., 1998]. The coding sequence of the GALE gene and screening for mutations in epimerase-deficient persons have been reported by the same investigators. The patients are either homozygotes or compound heterozygotes for mutations. Two forms of enzyme deficiency were originally described, one type benign (with expression restricted to the lens) and the other severe [Quimby et al., 1997], but an intermediate form is now recognized [Openo et al., 2006]. Three mutations (S81R, T150M, and P293L) have been reported in children with this intermediate form of GALE deficiency [Chhay et al., 2008]. Patients with GALE deficiency require exogenous galactose for the synthesis of glycolipids and glycoproteins.
Galactokinase Deficiency
Galactokinase deficiency was first detected in the Bulgarian gypsy (Romany) population. Its birth incidence varies, ranging from a high of 1 in 52,000 in Bulgaria to 1 in 2,200,000 in Switzerland [Kalaydjieva et al., 1999]. Deficiency of galactokinase activity causes a clinical condition similar to that in classic galactosemia. Patients have cataracts and accumulation of galactose. As in galactosemia, galactitol, a reduction metabolite of galactose, is found in the urine and tissues [Egan and Wells, 1966]. The existence of two GALK genes is likely. The GALK1 gene is located at 17q24 [Bergsma et al., 1996]. GALK2 may reside on chromosome 15 [Lee et al., 1992]; its metabolic role is unknown, but it does not appear to be necessary for galactose metabolism. No mutations in GALK2 have been described. The structure of GALK1 has been solved and its relationship to other members of the GHMP kinase superfamily defined, as well as its role as an essential componenet of the ‘switch’ permitting expression of the Leloir pathway genes in the presence of galactose [Holden et al., 2004]. More than 20 mutations in GALK1 have been described, most in compound heterozygotes for private mutations [Sangiuolo et al., 2004]. Only one common mutation, P28T, has been recognized in the Romany population [Kalaydjieva et al., 1999].
Biochemistry
Galactokinase deficiency causes the accumulation of galactose, which eventually is metabolized to galactitol (see Figure 34-1). Enzyme activity is reduced rather than absent in erythrocytes [Xu et al., 1989]. Galactose-1-phosphate does not accumulate. Large amounts of circulating galactose result in urinary excretion of galactose, which causes positive results on copper sulfate screening tests for urinary reducing substances. Specific assays for galactose-1-phosphate or galactose-1-phosphate uridyltransferase are necessary to differentiate between deficiency of galactose-1-phosphate uridyltransferase and deficiency of galactokinase.
Clinical Characteristics
The clinical manifestations of 55 patients reported in the literature were reviewed in 2002 [Bosch et al., 2002]. Cataract was present in all cases, except for those detected by newborn screening. Thirty-five percent of the patients had other manifestations; only mental retardation and pseudotumor occurred in more than one patient in this series. The mental retardation was thought to be unrelated to the GALK deficiency. Forty percent of the patients were of Roma ancestry and 26 percent were the product of consanguineous unions. One child deteriorated following the onset of epilepsy at 17 years.
Abnormalities of Fructose Metabolism
Hereditary Fructose Intolerance
Biochemistry
Fructose is rapidly absorbed from the gut, facilitated by the glucose transporters GLUT 2 and GLUT5, and is metabolized in the liver by the fructokinase pathway, through which it is linked to glycolysis, gluconeogenesis, glycogenolysis, and lipid metabolism. Fructose can also be synthesized endogenously from sorbitol, an important point in management [Bouteldja and Timson, 2010]. Hereditary fructose intolerance was first described by Chambers and Pratt [1956]. This condition results from a deficiency of hepatic fructose-1-phosphate aldolase B [Hers and Joassin, 1961]. (Isoenzyme A is found in most vertebrate tissues and isoenzyme C in brain.) The gene encoding this enzyme maps to 9q22 [Henry et al., 1985]. Normal fructokinase activity results in the accumulation of large amounts of fructose-1-phosphate in the liver and kidneys. Fibroblasts from patients with hereditary fructose intolerance consume less glucose, produce less lactate, and contain less glycogen compared with control cells [Lemonnier et al., 1987]. A radioisotopic method for fructose-1-phosphate assay is available [Shin et al., 1983]. The enzyme deficiency is inherited as an autosomal-recessive trait and has an estimated prevalence in central Europe of 1:26,100 (95 percent confidence interval 1: 12,600–79,000) [Santer et al., 2005].
Clinical Characteristics and Differential Diagnosis
Patients with hereditary fructose intolerance who ingest fructose experience nausea and vomiting; with continued exposure, weight gain is poor. Hypoglycemia begins immediately and reaches its low point 30–90 minutes after ingestion [Froesch et al., 1963]. Subsequent clinical and neuropathologic alterations result primarily from the hypoglycemia. Immoderate fructose feedings lead to albuminuria, jaundice, and a generalized aminoaciduria. Examination reveals jaundice and hepatomegaly.
Neurologic impairment is relatively uncommon but may result from hypoglycemia, cardiovascular collapse, or liver failure. Central nervous system complications include seizures with subsequent epilepsy, increased intracranial pressure, mental retardation, quadriplegia, and deafness [Labrune et al., 1990; Rennert and Greer, 1970]. Imaging findings include cortical atrophy, hydrocephalus, and parenchymal hemorrhage [Labrune et al., 1990].
Clinical Laboratory Tests and Diagnosis
The diagnosis may be corroborated by intravenous fructose challenge (0.1–0.2 g/kg, with adequate precautions to manage hypoglycemia). A positive response includes hypoglycemia, hypomagnesemia, hypouricemia, and hyperphosphatemia. Assay of fructose-1-phosphate aldolase B in liver tissue permits definitive diagnosis, but liver biopsy may be avoided by direct genotyping in most patients. Although more than 20 mutations of the aldolase B gene have been described, two alleles (A149P and A174D) account for 70 percent or more of cases in Western Europe and North America, and may be readily detected in leukocytes by restriction fragment length polymorphism (RFLP) analysis [Kullberg-Lindh et al., 2002]. Fructosemia causes abnormal glycosylation of transferrin, leading to misdiagnosis of CDG1x on occasion [Quintana et al., 2009].
Fructose-1,6-Diphosphatase Deficiency
Another inborn error of metabolism, fructose-1,6-diphosphatase (i.e., fructose-1,6-bisphosphatase [FBPase]) deficiency, also is characterized by hypoglycemia after fructose ingestion [Baker and Winegrad, 1970; Hulsmann and Fernandes, 1971]. About half of the cases manifest in infants, with life-threatening episodes of hypoglycemia and metabolic acidosis. The causal relationship between the enzyme deficiency and hypoglycemia in this abnormality is not fully explained. Some data, however, suggest that α-glycerol phosphate, fructose-1-phosphate, and fructose-1,6-diphosphate all inhibit phosphorylase a activity [Kaufmann and Froesch, 1973]. This relationship may explain the hypoglycemic episodes in both hereditary fructose intolerance and fructose-1,6-diphosphatase deficiency. The role of the enzyme deficiency in glycolysis and gluconeogenesis requires further clarification [Adams et al., 1990].
The diagnosis can be established by measuring FBPase activity and mutational analysis in cultured monocytes, without the necessity for liver biopsy [Kikawa et al., 2002]. A retrospective study of Japanese patients with FBPase deficiency treated with intravenous glycerol, which contains fructose in Asian countries, found a relationship between the infusion of glycerol and the onset of cerebral edema in some patients [Hasegawa et al., 2003]. In one case FBPase deficiency was associated with a prolonged prothrombin time, which corrected with intravenous glucose and bicarbonate [Nitzan et al., 2004]. Another patient gave birth to normal children after three uncomplicated pregnancies, but developed subsequent hearing loss and cognitive impairments despite careful metabolic monitoring [Krishnamurthy et al., 2007].
Glycogen Storage Diseases
The biochemistry of the glycogen storage diseases (GSDs) illustrates the diverse effects of genetically determined enzymatic deficiencies along a single metabolic pathway. In spite of a few inconsistencies and a number of unexplained conditions, a logical approach to these diseases is practical. The GSDs are a family of diseases sui generis, with the exception of at least two disorders that can be included under the rubric of lysosomal storage diseases – Pompe’s disease and Danon’s disease. Indeed, the first lysosomal storage disease defined as such was Pompe’s disease [Hers, 1963]. General characteristics of this disease family are discussed in Chapter 36. Patients have also been described who accumulate glycogen in autophagic vacuoles but who do not appear to have an enzymatic deficiency [Danon et al., 1981]. This phenotype, named Danon’s disease, is known to result from deficiency of lysosomal-associated membrane protein 2 [Nishino et al., 2000]. This X-linked dominant disorder has multisystem effects, most consistently involving the heart and skeletal muscle [Sugie et al., 2002].
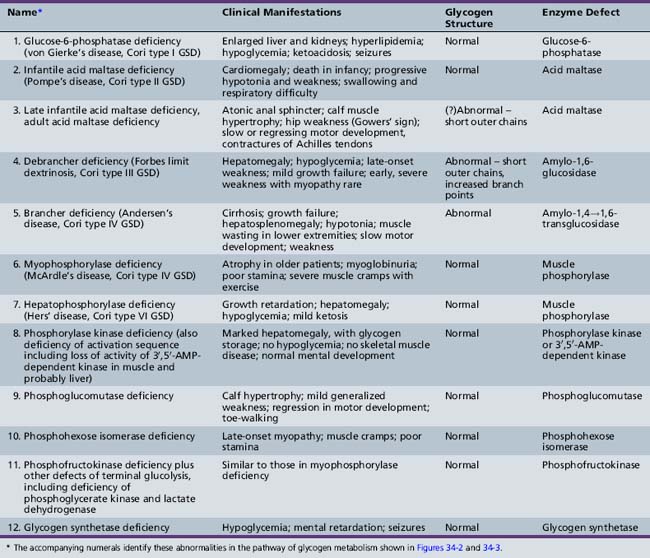
GSDs result in the accumulation in various tissues of increased concentrations of glycogen of normal or abnormal configuration (Table 34-2). These diseases result from a deficiency or absence of specific enzyme activity in the metabolic pathway of glycogen.
The glucose molecule is the prime building block in the multistep synthesis of glycogen (Figure 34-2; see also Table 34-2). Glycogen synthesis occurs in many tissues, predominantly in liver, kidney, and muscle. Glucose transported in the blood enters the cell, facilitated by a glucose transporter [Scheepers et al., 2004], is phosphorylated in a reaction catalyzed by the enzyme hexokinase, and becomes glucose-6-phosphate. In the next step, the enzyme phosphoglucomutase mediates the transformation to glucose-1-phosphate. Glucose-1-phosphate, in association with uridine triphosphate, is transformed to uridine diphosphate-glucose with the participation of uridine diphosphate glucose pyrophosphorylase. The glucose portion of this molecule is then attached by a 1,4 linkage to a terminal glucosyl unit. This reaction is facilitated by the active form of the enzyme glycogen synthase (uridine diphosphate–glucose-glycogen glucosyl transferase). Glycogenin is a protein primer that initiates glycogen synthesis by covalently attaching individual glucose residues to tyrosine 194. This process occurs by autoglycosylation to form a short priming chain of glucose residues that are a substrate for glycogen synthase [Hurley et al., 2006]. When the glucosyl chain becomes 6–12 units long, this section is transferred and affixed to another glucosyl chain by a 1,6linkage as a result of the action of the branching enzyme α-1,4-glucan: α-1,4-glucan-6-glucosyl transferase. A 1,6 linkage constitutes the branch point, a final stage in glycogen formation. Glycogen exists in the cell in association with proteins (including the enzymes described above) as organelles known as glycosomes. Glycosomes may occur free in the cytosol (lyoglycosomes) or in association with other structures (desmoglycosomes), including myofibers, mitochondria, and sarcoplasmic reticulum cisterna.
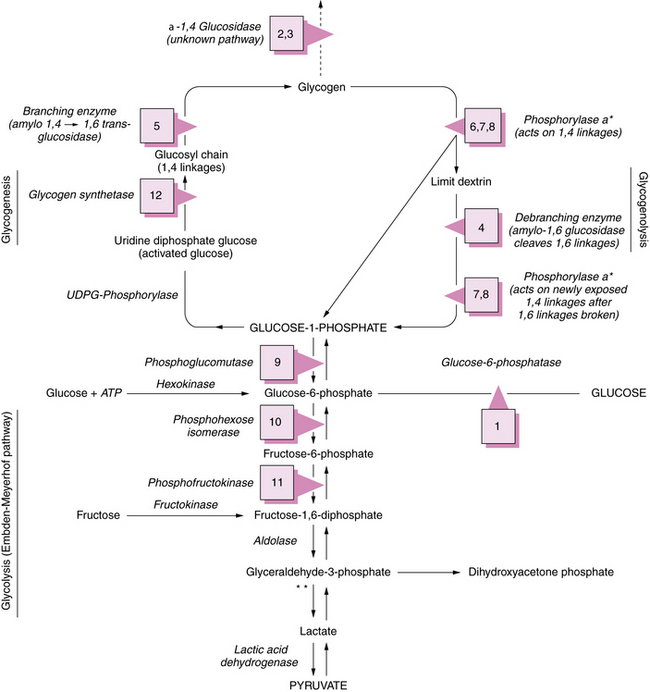
See Table 34-2 for description of abnormalities denoted by Arabic numerals enclosed in boxes. *See Figure 34-3 for phosphorylase activation sequence. **Other defects of terminal glycolysis.
During the degradation process, the phosphorylase enzymes split the 1,4 linkages, which results in formation of free glucose-1-phosphate molecules. Both muscle and hepatic phosphorylase isoenzymes exist. Activation of phosphorylase takes place through a cascade of reactions ultimately involving phosphorylase b kinase (Figure 34-3). As the cleavage of 1,4 bonds moves near the 1,6 branching point, “three-glucose” residues are removed in a block by oligo-1,4 alpha 1,4-glucan transferase, and the 1,6 linkage is disrupted by the debranching enzyme (amylo-1,6 glucosidase), with the resultant release of a free glucose molecule. Approximately 8 percent of glucose in glycogen is involved at 1,6 branch points and may be released in this free form. This process continues along the branches of the glycogen molecule. Therefore, both glucose-1-phosphate and free glucose molecules result from this series of degradation reactions.
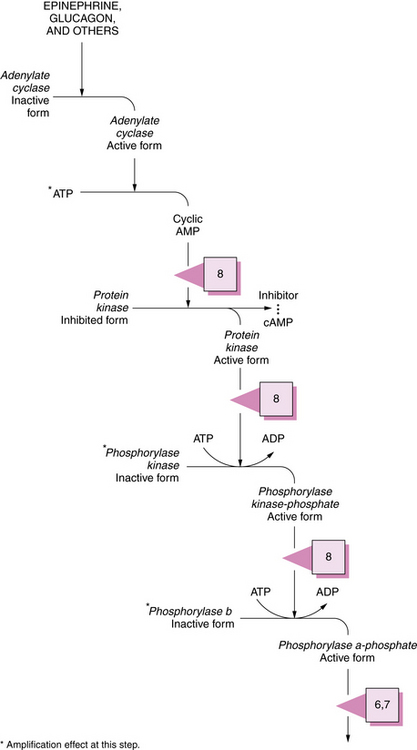
Fig. 34-3 Activation sequence of phosphorylase.
See Table 34-2 for description of abnormalities denoted by the Arabic numerals enclosed in boxes. ADP, adenosine diphosphate; ATP, adenosine triphosphate; cAMP, cyclic adenosine monophosphate.
(Modified from Goldberg NB. Vigilance against pathogens. Hosp Pract 1974;9:127.)
Glucose-6-Phosphatase Deficiency (Von Gierke’s Disease, Glycogen Storage Disease Type I, Hepatorenal Glycogenosis)
Pathology
In 1929, Von Gierke described the pathology of “hepatonephromegalia glycogenica,” and in 1952 the Coris described glucose-6-phosphatase deficiency as its cause (and established an enzyme deficiency as the cause of an inborn error of metabolism for the first time) [Moses 2002]. Patients with von Gierke’s disease, now known as glycogen storage disease type I, have hepatomegaly and renomegaly. Light microscopy reveals enormous amounts of glycogen in liver cells and in the cells of the renal convoluted tubules. No increase in the concentration of glycogen is found in skeletal muscle, tongue, or heart. Best’s stain marks the presence of glycogen. Tissue must be fixed in a nonaqueous medium such as absolute alcohol; otherwise, the glycogen dissolves, and only vacuolar spaces will remain to mark the areas of deposit.
Electron microscopy of glycogen storage disease type I liver reveals loss of microvilli of the membranes lining Disse’s spaces and bile canaliculi. Changes in endoplasmic reticulum include the development of doubly contoured vesicles that appear to help ribosomes only on the innermost surface of the inner membrane. Glucose-6-phosphatase is located in or on the membranes of endoplasmic reticulum, and these findings parallel a disturbance of the phospholipid environment of the enzyme as a consequence of the mutation that affects enzyme activity [Spycher and Gitzelmann, 1971].
Biochemistry
Two distinct subgroups of glycogen storage disease type I have been identified: those with primary glucose-6-phosphatase deficiency (type Ia) and those phenocopies with additional features of immune impairment (neutropenia and neutrophil adherence defects), now designated as glycogen storage disease type I non-a [Moses, 2002]. Glycogen storage disease type I non-a disorders originally were thought to result from defects in a multicomponent translocase system responsible for transporting glucose-6-phosphatase into microsomes [Annabi et al., 1998]. This model postulated three transport proteins, T1, T2, and T3, to chaperone glucose, glucose-6-phosphatase, phosphate, and pyrophosphate across the endoplasmic reticulum membrane. Cloning of the glucose-6-phosphatase translocase gene (G6PT) demonstrated that the previously proposed subtypes b, c, and d all were associated with mutations in G6PT, producing different kinetic variants [Matern et al., 2002; Moses and Parvari, 2002]. The G6PC gene that codes for glucose-6-phosphatase is located at 17q21 [Brody et al., 1995]. A number of allelic variants have been described. Glucose-6-phosphatase comprises at least five different polypeptides. The G6P locus is at 11q23 [Annabi et al., 1998]; several mutations have been characterized [Matern et al., 2002].
All forms share common clinical manifestations that are attributable to abnormal metabolism of glucose-6-phosphate. In type Ia, glucose-6-phosphatase deficiency results in storage of glycogen of normal configuration in the liver and kidneys. The glycogen concentration usually exceeds 4 percent by weight. The enzyme activity frequently is absent or extremely low [Cori and Cori, 1952]. Glucose-6-phosphatase is important in regulating the entry of free glucose into the circulation from the liver. Because of this pivotal role, deficiency of the enzyme produces hypoglycemia.
Ethanol causes decreased blood lactate and pyruvate content, presumably by diverting carbon to triglyceride formation [Sadeghi-Nejad et al., 1975]. A study of insulin secretion in five adult patients with glucose-6-phosphatase deficiency found that their capacity to increase blood insulin was significantly less than normal. As patients with this condition mature, they become normoglycemic and characteristically have abnormal glucose tolerance curves. These studies suggest that the increasing clinical stability noted with age and the associated tendency toward normoglycemia reflect a decrease in insulin responsiveness that may develop as an adaptive process [Lockwood et al., 1969]. Diabetes mellitus has been reported in GSD type 1 [Spiegel et al., 2005]. The intricacies of the glucose-6-phosphatase system and its role in glucose metabolism have been reviewed [Foster and Nordlie, 2002].
Clinical Characteristics
Hypoglycemia causes much of the morbidity during the first year of life. Seizures are frequent and almost invariably are the presenting complaint of affected children. Hypoglycemia may result in severe, chronic neurologic impairment, including hemiplegia [Fine et al., 1969]. Hepatomegaly and the failure to thrive syndrome are commonly present. An association with moyamoya disease has been described [Goutières et al., 1997]. A study of 19 patients with glycogen storage disease type I (median age 11 years) in one center found prevalence rates for epilepsy, deafness, and neuroradiologic abnormalities of 10.5 percent, 15 percent, and 57 percent, respectively, far in excess of the rates in the general population, or in children with other causes of neonatal hypoglycemia. MRI abnormalities included dilatation of occipital horns and/or hyperintensity of subcortical white matter in the occipital lobes in all patients [Melis et al., 2004]. Subcutaneous fat often is increased, especially over the buttocks, breasts, and cheeks. Xanthomas of the skin occur over the extensor surfaces of the limbs and at times over the buttocks [Hou et al., 1996; Hou and Wang, 2003]. Affected children frequently have a protuberant abdomen because of massive enlargement of the liver. Hepatomegaly may be present at birth. The liver edge is hard and not tender. Careful palpation may reveal enlarged kidneys. Hepatic adenomas develop in between one-half and three-quarters of adults with glycogen storage disease I; about 10 percent undergo malignant transformation. Some data suggest that lower frequencies are associated with better dietary control [Lee, 2002]. Hepatocellular carcinoma has been reported as complicating hepatic adenomas, and may reflect poor metabolic control [Franco et al., 2005]. Patients carrying mutations that cause relatively mild expression of the disease in childhood, often without hypoglycemia (such as 727 G>T), are associated with adult presentation of hepatocellular carcinoma [Matern et al., 2002].
Type I non-a patients typically have recurrent stomatitis, frequent infections, and chronic inflammatory bowel disease secondary to neutropenia and neutrophil dysfunction [de Parscau et al., 1988]. The neutropenia seen in GSD1b has been attributed to endoplasmic reticulum and oxidative stress secondary to the G6PT deficiency [Chou et al., 2010]. Seventy-five percent of 36 GSD type I non-a patients had chronic gastrointestinal complaints, and 28 percent had proven inflammatory bowel disease. A further 22 percent had a highly suggestive history [Dieckgraefe et al., 2002].
Clinical Laboratory Tests
The diagnosis can be made by assaying the enzyme activity in liver and peripheral white blood cells [Maire et al., 1991]. Direct assay of hepatic glucose-6-phosphatase activity in liver remains the definitive diagnostic procedure but can be replaced by mutational analysis in many patients. Just five mutant alleles account for almost 70 percent of cases of glucose-6-phosphatase deficiency, so that mutation screening is a reasonable initial diagnostic approach, avoiding the risks and discomfort of liver biopsy [Matern et al., 2002]. Molecular analysis of the G6P and G6PT genes permits rapid confirmation of the diagnosis in most cases [Janecke et al., 2001].
Hyperuricemia has often been documented, but is poorly understood. Adenosine triphosphate depletion has been postulated as a causative factor [Greene et al., 1978]. Ketoacidosis and hyperthermia during anesthesia in a child with GSD type I has been described [Edelstein and Hirshman, 1980]. Blood cholesterol, fatty acids, and triglycerides are elevated; overt lipemia may be present.
Management
The goal of therapy is to provide sufficient free glucose to maintain a normal blood glucose concentration. Continuous nocturnal intragastric infusion of glucose has been relatively successful [Greene et al., 1976]. Subsequently, the use of cornstarch suspensions given during the day obviated the need for nocturnal infusion in some children [Chen et al., 1984; Wolfsdorf et al., 1990]. The dietary carbohydrate must be monitored because excess glucose leads to glycogen storage in the liver and kidneys. Frequent small feedings of carbohydrates are provided. Severity of the disease reaches a plateau after the fourth or fifth year of life. Vigorous treatment is, therefore, worthwhile until the plateau is reached. A long-term study of 15 children with GSD type I, beginning in infancy, found that careful metabolic control, aiming for high to normal plasma glucose levels and normal urine lactate, was associated with normal growth and lowering, but not normalization, of plasma lipids. Hepatic adenomas or renal impairment developed in none of the patients who reached adolescence [Daublin et al., 2002; Weinstein et al., 2002].
Dietary substitution of medium-chain triglycerides for long-chain triglycerides was attempted in glucose-6-phosphatase deficiency, to alter the hyperlipemic state by means of the unique absorptive and metabolic properties of medium-chain triglycerides. The results suggested that substitution of medium-chain triglycerides for long-chain triglycerides in the diet, along with normal carbohydrate consumption, leads to significant decrease in serum lipid levels, disappearance of eruptive xanthomas, and decrease in liver mass [Cuttino et al., 1970].
The hyperglycemic agent diazoxide has been beneficial [Rennert and Mukhopadhyay, 1968]. The drug’s action is not well understood, but normal blood glucose concentration has been maintained with this drug. Phenytoin also has been used [Jubiz and Rallison, 1974].
Surgical treatment for glucose-6-phosphatase deficiency involves creation of a portacaval shunt, which increases the peripheral blood glucose by allowing portal blood to bypass the liver after absorption of glucose from the gut; excellent metabolic control can be achieved over the long term, and the operation does not preclude subsequent liver transplantation [Corbeel et al., 2000]. The postoperative course has been complicated by severe hypoglycemia, hypocalcemia, acidosis, and respiratory impairment, the last primarily because of hepatomegaly. Preoperative intravenous hyperalimentation appears to eliminate these metabolic problems, reduce the size of the liver, and provide a smoother and shorter postoperative course [Folkman et al., 1972]. Liver transplantation was reported to produce beneficial results [Malatack et al., 1983]. One report suggested that this procedure, usually indicated for management of multiple hepatic adenomas, does not itself benefit metabolic control, and indeed, careful systemic management is essential to prevent graft complications [Labrune, 2002]. A more recent report of living donor liver transplantation in four children with GSD1b described markedly improved quality of life [Kasahara et al., 2009]. Another case report described a 47-year-old woman with GSD1a, whose fasting tolerance was significantly improved after infusion of hepatocytes [Muraca et al., 2002].
Chronic inflammatory bowel disease similar to Crohn’s disease has been associated with GSD type I non-a [Dieckgraefe et al., 2002]. Initial studies suggested benefit from therapy with colony-stimulating factors [Roe et al., 1992]. A retrospective study of 57 patients with GSD type I non-a found evidence of less frequent infections and diminished severity of inflammatory bowel disease in those who received granulocyte colony-stimulating factor [Visser et al., 2002]. Splenomegaly was associated with granulocyte colony-stimulating factor therapy in this group. Renal disease also may ensue in older patients [Chen, 1991].
Brain abscess has been reported in a patient with type I non-a disease [Park et al., 1991]. Renal transplantation has been used for terminal renal failure, and occasionally, combined hepatic and renal grafting has been used. In both circumstances, meticulous systemic metabolic management is essential to successful outcome [Labrune, 2002].
Acid α-Glucosidase (GAA, Acid Maltase) Deficiency, Infantile Type (Pompe’s Disease, Idiopathic Generalized Glycogenosis, Glycogen Storage Disease Type II)
Pathology
Infants with GSD type II have a severe vacuolar myopathy, with accumulation of large amounts of periodic acid–Schiff-positive material within cardiac, skeletal, and smooth muscle fibers and in liver, renal tubules, lymphocytes, glial cells, anterior horn cells, and brainstem nuclei, in infantile cases. Storage in later-onset cases is largely restricted to skeletal muscle. Large amounts of metachromatic material are found within the muscle fibers in the infantile cases. Metachromasia is not seen as often in the adult cases. The metachromasia reflects glycolipid or glycoprotein accumulation. Glycogen also accumulates in anterior horn cells. Scattered, sparse, perivascular lymphocytic infiltrates are seen in the interstitial tissue [Hudgson and Fulthorpe, 1975].
Biochemistry
Hers [1963] first reported the deficiency of activity of the lysosomal enzyme acid maltase (α-1,4-glucosidase), located at 17q25.2–q25.3 [Kuo et al., 1996; Martiniuk et al., 1985]. Glycogen structure has consistently been normal, and its accumulation is restricted primarily to lysosomes, although lysosomal breakdown and cytoplasmic accumulation with disruption of muscle fibers occur in severe cases. Although direct injury of muscle fibers by glycogen leaking from lysosomes was thought to be the major cause of contractile dysfunction, experimental and pathological evidence suggests that the accumulation of autophagosomes is the major culprit, and that these pathologic orgenelles impair the effectiveness of enzyme replacement therapy by acting as a sink for infused enzyme [Shea and Raben, 2009; Raben et al., 2009]. Hypoglycemia is not a feature of this condition, but increased protein turnover with increased leucine flux and oxidation and increased resting energy expenditure has been found in late-onset cases [Bodamer et al., 2000].
Attempts have been made to differentiate biochemically among the infantile, late infantile, and adult-onset forms of acid maltase deficiency. Activity of α-1,4-glucosidase (acid maltase) at various pH values in infants, children, and adults with acid maltase deficiency has been studied. Only traces of neutral maltase are found in the heart, and significantly decreased neutral maltase activity was measured in the skeletal muscle and liver of an affected infant. In the late infantile form, neutral acid maltase activity is decreased only in the liver; in the adult form, neutral maltase is not deficient in any tissue. An absolute decrease of leukocyte acid maltase was found in four adults and a relative decrease in 1 of 5 adults with acid maltase deficiency. Decrease in the pH ratio of acid to neural maltase activity in leukocytes may be of diagnostic importance in adult acid maltase deficiency [Angelini and Engel, 1972].
A number of allelic variations have been described and may explain the differences in age at onset. The theoretical abnormalities that could result in a deficiency of α-glucosidase include synthesis of catalytically inactive protein, absence of messenger RNA (mRNA) for the enzyme, decreased synthesis of the precursor, lack of phosphorylation of the precursor, impaired conversion of the precursor to the mature enzyme, and synthesis of unstable precursor [Tager et al., 1987; Zhong et al., 1991]. In general, the location and nature of mutations predict the phenotype, but exceptional cases are described in which relatively mild phenotypes occur despite low levels of α-glucosidase expression in cultured cells and in the patient’s tissues [Hermans et al., 2004; Kroos et al., 2004]. Thus far, unidentified genetic modifiers and environmental factors are presumed to account for such variability.
Unexplained storage of increased neutral lipid is coupled with low carnitine concentration and reduced β-hydroxyacyl-CoA dehydrogenase in muscle [Verity, 1991].
Clinical Characteristics
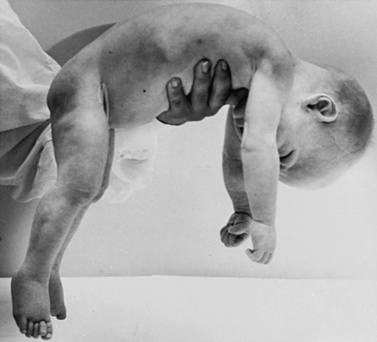
Development usually is normal for several weeks to several months; then the affected infant presents with feeding difficulties, weakness, or respiratory impairment. The median age at presentation was 1.6 and 1.9 months, respectively, in 20 Dutch patients and 133 patients described in the literature [Van den Hout et al., 2003] (Figure 34-4). Little spontaneous movement occurs, and the cry is short-lived and weak. Swallowing is grossly limited, and secretions pool in the posterior oropharynx. Respiratory difficulty reflects weakness of the accessory muscles of respiration [Tanaka et al., 1979]. Massive cardiomegaly develops, and a soft systolic murmur is often heard along the left sternal border [Pompe, 1932]. Obstruction to ventricular outflow and impairment of inflow may develop [Seifert et al., 1992], and serial echocardiography reveals progressive left ventricular posterior wall diastolic thickening [Van den Hout et al., 2003]. Hepatomegaly is almost universally present. The liver has a sharp edge and a firm consistency on palpation. Subcutaneous fat over all areas of the body is sparse, and the muscles are small and firm. The tongue often is enlarged and may protrude. Intermittent cyanosis reflects respiratory and cardiac embarrassment. Deep tendon reflexes are lost by the age of 6 months. Affected infants undergo progressive debilitation, and most die, at median ages of 6 and 7.7 months in the literature cases and Dutch series, respectively. Fewer than 10 percent survive beyond 1 year; only two patients have been described who survived 18 months [Van den Hout et al., 2003], and almost all die by 2 years. A subgroup of children has been described who present later in infancy, with lesser degrees of weakness and cardiac impairment, who have survived for periods as long as 13 years with ventilatory and nutritional support [Slonim et al., 2000].
Clinical Laboratory Tests
Both skin fibroblasts and amniotic fluid cells can be used for assay of acid maltase (α-1,4-glucosidase) activity [Butterworth and Broadhead, 1977; Leathwood and Ryman, 1971]. Prenatal diagnosis by biochemical study of uncultured amniotic fluid cells and chorionic villus biopsy material using maltose as a substrate have been reported [Hug et al., 1984; Park et al., 1992]. Mutational analysis has superseded these techniques in some cases, and complemented enzyme analysis and ultrasound examinations in others, as in a report of a fetus with this deficiency diagnosed in the second trimester, in which glycogen accumulation was detectable in muscle, as well as a visibly enlarged tongue on prenatal ultrasound examination [Chen et al., 2004].
A simple differential immunoprecipitation assay of urinary acid and neutral α-glucosidases has been developed [Tsuji et al., 1987].
The chest x-ray reveals massive cardiomegaly [Ruttenberg et al., 1964]. The electrocardiogram contains depressed ST segments, inverted T waves, and a shortened P-R interval. These changes may be confused with those of myocarditis. Electromyography (EMG) shows myopathic changes; polyphasic potentials and a reduced interference pattern with low voltage are the usual findings. Unusual high-frequency discharges, best described as myotonic-like, are very common [Gutman et al., 1967; Hogan et al., 1969]. Muscle and liver biopsy specimens contain large amounts of structurally normal glycogen when studied by both light and electron microscopy. Changes in peripheral nerve also have been reported [Araoz et al., 1974].
Genetics
GAA deficiency is inherited as an autosomal-recessive trait. The gene for human acid α-glucosidase is contained on chromosome 17 (segment q21–q23) [Martiniuk et al., 1986]. The structural gene for human acid α-glucosidase is undergoing intensive study; it is approximately 28 kb in length and contains 20 exons [Martiniuk et al., 1991]. Various mutations may result in the phenotype; missense mutations and failure of an allele to manifest mRNA expression have been reported [Zhong et al., 1991]. Prenatal diagnosis has been available since the 1970s [Hug et al., 1974]. The use of chorionic villus assay allows first-trimester diagnosis [Chowers et al., 1986]. Both adult-onset and infantile glycogenosis type II have been detected in one family. Two types of mutant alleles were identified; one leads to complete deficiency of the enzyme, and the other results in reduced net production of active α-glucosidase, resulting in partial enzyme deficiency [Hoefsloot et al., 1990].
Management
Before the advent of enzyme replacement therapy (ERT), no practical treatment was available. Therapies previously studied included epinephrine administration, which reduced liver, but not muscle, glycogen content to normal [Hug, 1974]. Dietary supplementation with l-alanine, designed to reduce the elevated protein turnover characteristic of acid maltase deficiency, has apparently slowed progression of weakness and even reversed cardiomyopathy in some patients with late infantile and juvenile forms [Bodamer et al., 1997, 2000, 2002].
Attempts to replace the deficient enzyme date back to 1964, but effective ERT was not possible until suitable sources of receptor-targeted human recombinant acid glucosidase became available in the late 1990s. This substance was derived from both rabbit milk and Chinese hamster ovary (CHO) cells. The first clinical trial began in 1998 [Reuser et al., 2002; Winkel et al., 2004], and in 2006, ERT received Food and Drug Administration (FDA) approval for treatment of acid maltase deficiency [Koeberl et al., 2007]. Infants who received treatment early in the course of their illness demonstrated improved strength and cardiac function, with survival now extending over several years. It has become apparent that ERT is most effective at reversing cardiomyopathy and extending the life span of infants, but that skeletal muscle disease is relatively resistant to this modality [Schoser et al., 2008]. The follow-up interval has been too short to determine if anterior horn cell and glial storage of glycogen will lead to chronic weakness and impairment of cerebral function in long-term survivors.
Late Infantile GAA Deficiency
A number of children have been reported who are deficient in acid maltase activity but without the phenotype of Pompe’s disease [Smith et al., 1966, 1967]. These children usually are asymptomatic during the first year of life and live beyond the age of 2 years. Most have slowly progressive weakness but no gross signs of overt deposits of glycogen in skeletal or heart muscle or in visceral organs.
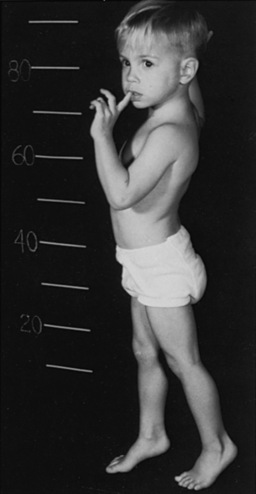
Symptoms and signs may mimic those of Duchenne muscular dystrophy. In this condition, the gastrocnemius and deltoid muscles may be firm and rubbery, with accompanying hypertrophy of the gastrocnemius muscle. Waddling gait, increased lumbar lordosis, and Gowers’ sign (Figure 34-5) are frequently present. Achilles tendon contractures result in equinus gait. Cardiomegaly is absent, and an intermittent soft, systolic murmur may be heard. Two patients had a patulous anal sphincter.
Clinical Laboratory Tests
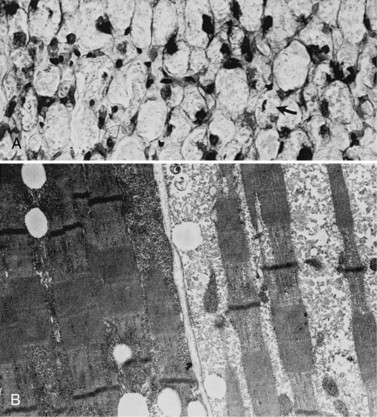
Light and electron microscopy of muscle biopsy material displays moderate glycogen storage (Figure 34-6). In muscles stained with hematoxylin and eosin, the glycogen-containing areas appear vacuolated. In one report, only type I fibers were involved [Papapetropoulos et al., 1984]. A few patients with glycogen storage in lysosomes have been described who appear to have normal acid maltase enzyme activity [Tachi et al., 1989].
Biochemistry
Aside from the accumulation of glycogen and its possible abnormal architecture, the most prominent abnormality described is a deficiency of acid maltase activity. Quantitation of glycogen reveals increased content. The liver may or may not contain increased glycogen stores [Smith et al., 1966, 1967]. Two patients have been described who had glycogen of abnormal configuration because of shortened outer chains.
Management
Attempts to manage patients by dietary means enjoyed modest success after initially disappointing results (see earlier) [Bodamer et al., 1997, 2000, 2002].
At present, ERT appears to offer the best hope for definitive treatment in this group of patients [Reuser et al., 2002]. Investigational studies are on-going.
Juvenile and Adult GAA Deficiency
A slowly progressive myopathy characterizes juvenile and adult GAA deficiency. The literature has been reviewed and consensus criteria for diagnosis established [AANEM, 2009]. Limb girdle weakness is the most common presentation, but muscle pain is underappreciated and relatively common. Most patients complain of fatigue. Ventilatory failure may be the presenting complaint in as many as one-third of adults, sometimes with predominantly nocturnal symptoms.
Laboratory abnormalities include increased serum enzyme activity of creatine kinase (normal to as much as 15-fold elevated [AANEM, 2009]), aspartate aminotransferase, and lactate dehydrogenase. Adult cases cannot be delineated from infantile and late infantile cases on the basis of muscle GAA activity. The enzymatic deficiency is demonstrable in adult patients [Wokke et al., 1995].
In both the juvenile and adult forms, weakness associated with acid maltase deficiency develops during the second through the sixth decades of life. Weakness is greater proximally than distally, and is more prominent in the pelvis than in the shoulder girdle. Weakness varies from muscle to muscle. Intercostal and diaphragmatic muscles are involved in many patients. Adult patients do not have enlargement of the liver, heart, or tongue. There is a broad differential diagnosis that includes muscular dystrophies, other metabolic myopathies, congenital myopathies, inflammatory myopathies, anterior horn cell diseases, and disorders of the neuromuscular junction [AANEM, 2009].
In one series, 16 patients with adult-onset acid maltase deficiency were compound heterozygotes. Patients presented with proximal weakness of the legs or fatigue. The patients manifested progressive symptoms [Wokke et al., 1995]. Some diminution of α-glucosidase activity was identified in muscle [Wokke et al., 1995].
Replacement therapy with rabbit-derived recombinant human α-glucosidase in patients aged 11, 16, and 32 years over a 3-year period produced stabilization of pulmonary function and strength in the older patients, and sufficient improvement in strength that the youngest patient was able to dispense with his wheelchair and walk unassisted [Winkel et al., 2004].
Amylo-1,6-Glucosidase Deficiency (Debrancher Deficiency, Cori’s Disease, Forbes’ Disease, Limit Dextrinosis, Glycogen Storage Disease Type III)
Pathology
Electron microscopy of skeletal muscle of persons with glycogenoses has demonstrated glycogen deposits just inside the sarcolemmal membrane and between the filaments of the I and A bands, as well as between the myofibrils. These abnormalities are not pathognomonic for this glycogenosis [Neustein, 1969], now classified as glycogen storage disease type III. Glycogen storage in liver is indistinguishable from glycogen storage in other glycogenoses that involve the liver.
Biochemistry
A complementary DNA encoding the human muscle glycogen debranching enzyme (AGL) was used to localize the gene to 1p21 by somatic cell hybrid analysis and in situ hybridization [Yang-Feng et al., 1992]. The AGL gene was cloned and found to encode six isoforms that manifested tissue-specific distribution and two distinct functions, both as a debranching enzyme and as a transferase [Bao et al., 1996]. Polymorphic markers within the gene can be used for linkage analysis for prenatal diagnosis and carrier detection [Shen et al., 1997], although direct mutational analysis is frequently used. GSD type III has marked genetic heterogeneity, with almost 70 mutations described by 2004 [Lam et al., 2004; HGMD, 2010]. Although genotype–phenotype correlations are difficult in rare recessive phenotypes such as GSD type III, in which most patients are compound heterozygotes for private mutations, it appears that GSD type IIIa is associated with mutations downstream to exon 3, whereas GSD type IIIb is associated with mutations in exon 3 [Lucchiari et al., 2002, 2003]. There is considerable allelic heterogeneity in different ethnic groups harboring mutations in this gene [Endo et al., 2006; Aoyama et al., 2009].
Several designated biochemical categories of type III glycogenosis have been identified. In type IIIa deficiency (both transferase and glucosidase deficiency), debranching enzyme activity is either absent or greatly reduced in liver and muscle. When the enzyme activity is deficient in liver alone, the condition is designated type IIIb. Type IIIc patients have deficient glucosidase but not transferase activity. A 12-year-old girl homozygous for p.R1147G has been diagnosed with isolated glucosidase deficiency [Aoyama et al., 2009]. Some patients have the reverse: that is, isolated transferase deficiency with retention of glucosidase activity (type IIId disease) [Ding et al., 1990]. The likelihood of myopathy and cardiomyopathy can be determined from assay of debranching enzyme and debranching enzyme transferase activity [Coleman et al., 1992]. Approximately 70 percent of the patients have no activity in all tissues studied. In another 10 percent of patients, enzyme activity is absent in liver but present to a small degree in muscle tissue. In yet another group, some activity of the debranching enzyme is present in either or both liver and skeletal muscle. The use of skin fibroblasts for study of debrancher enzyme activity is the usual initial approach to enzyme studies [Brown et al., 1978]. Oligo-1,4 α1,4-transglucosylase (transferase) activity may be present in muscle and liver of patients with type III glycogenosis but absent in their leukocytes. Electron microscopy of skin indicates glycogen storage in eccrine sweat glands [Sancho et al., 1990].
Characterization of the enzyme indicates immunochemical similarity of debranching enzyme in liver and in muscle. The evidence also suggests that deficiency of debranching enzyme activity in GSD type III is the result of the absence of debrancher protein [Chen et al., 1987].
Assay of liver tissue of a patient with debrancher enzyme deficiency revealed increased activity of fructose-1,6-diphosphatase. Lack of enzymatic activity limits the breakdown of glycogen, and during fasting, the release of glucose from the liver stems from gluconeogenesis. The increase in fructose-1,6-diphosphatase activity likely reflects increased gluconeogenesis. Administration of galactose [Hers, 1959], dihydroxyacetone [Brombacher et al., 1964], fructose [Hers, 1959], casein [Fernandes and van de Kamer, 1968], and glycerol [Senior and Loridan, 1968] has resulted in increased blood glucose concentrations; these findings support the critical compensatory role of gluconeogenesis in this condition [Sadeghi-Nejad et al., 1970]. In patients with deficient muscle enzyme activity, incorporation of uridine-14C-glucose into red cell glycogen is either very low or absent.
Myogenic hyperuricemia is common in this condition but is not unique; hyperuricemia also accompanies glycogenosis type V and type VII [Mineo et al., 1987].
Clinical Characteristics
Infantile type
Patients with debrancher enzyme deficiency may have muscle or liver involvement, or both. The infantile type usually manifests in the first few months of life and is associated with hypoglycemia, failure to thrive, and hepatomegaly [Forbes, 1953]. Affected infants are hypotonic and weak, and have poor head control. Glycogen deposition in cardiac muscle rarely is sufficient to create clinical disturbances; however, gross cardiac involvement with glycogen accumulation was reported in a 3-month-old patient, who died suddenly [Miller et al., 1972].
Association of debranching disease with profound cardiac muscle and skeletal muscle involvement accompanied by thyroid insufficiency also has been reported. The simultaneous presence of these two conditions is unexplained [Goutières and Aicardi, 1971].
One infant with both GSD type IIIa and Costello’s syndrome has been described [Kaji et al., 2002]. The significance of this association is unclear.
Childhood type
Abnormal findings in a 7-year-old female with GSD type III included exercise intolerance and heart failure. Cardiac and skeletal muscle contained increased stores of glycogen. Branching enzyme deficiency was confirmed with further studies [Servidei et al., 1987]. Hyperlipidemia appears to be common in children with GSD III, particularly those under 3 years [Bernier et al., 2008]. Hypertriglyceridemia correlates negatively with age; it may reflect more severe hypoglycemia in younger children. Children may also have reduced bone density, although this cannot be reliably determined by serum or urine markers [Cabrera-Abreu et al., 2004].
Adult type
Debrancher enzyme deficiency also has been reported in older children and adults [Brunberg et al., 1971]. Adult patients with GSD type III manifesting as chronic progressive myopathy in middle age have been described [DiMauro et al., 1978; Momoi et al., 1992]. Patients with debrancher deficiency should be monitored for cardiac involvement [Moses et al., 1989]. A 52-year-old woman was reported from Korea, who presented with symptomatic hypertrophic cardiomyopathy, severe general weakness, and hepatomegaly [Kim et al., 2008]. An adult with GSD type IIIa presented with diabetes mellitus, complicating hepatic failure. He was successfully managed with an α-glucosidase inhibitor, which delays carbohydrate glycolysis in the gut, thus blunting postprandial hyperglycemia and the consequent risk of hypoglycemia [Oki et al., 2000]. Progressive cirrhosis may be more common in adult GSD type III than was previously recognized, and occasionally is complicated by hepatocellular carcinoma [Siciliano et al., 2000]. One study of 45 patients aged 20 months to 67 years with GSD III identified two cases of hepatocellular carcinoma. Both arose on a background of cirrhosis. There are no reliable biomarkers for malignant transformation, and vigilant follow-up is essential for early diagnosis [Demo et al., 2007].
Debrancher deficiency has been associated with flaccidity, as reported in a 13-year-old patient [Forbes, 1953; Pearson, 1968], and with “weak tone,” described in a 3-year-old patient [van Creveld and Huijing, 1965]. A history of a protuberant abdomen during childhood often is present. Patients complain of muscle fatigue without tenderness, cramping, or associated hematuria. Persistent diffuse weakness is present, and wasting of the hand and forearm muscles with loss of body weight ensues. Sugar-containing foods are of no clinical benefit, and symptoms of hypoglycemia are absent. The family history may include death of siblings in late childhood from a similar illness.
Clinical Laboratory Tests
Pseudomyotonic discharges are present on EMG. Serum creatine kinase activity may increase before and after exercise. Blood studies demonstrate mild fasting hypoglycemia, hyperlipidemia, fasting ketonuria, and diabetic glucose tolerance curves. Blood glucose concentration usually is not responsive to epinephrine or glucagon, but at times a mild response may occur. Results on galactose, fructose, and glycerol tolerance testing are normal. Blood lactic acid does not increase on ischemic exercise. Abnormally structured glycogen containing short outer chains has been demonstrated in liver, skeletal muscle, and red and white cells [Brandt and DeLuca, 1966; Van Hoof, 1967; Van Hoof and Hers, 1967].
Genetics
GSD type III is inherited as an autosomal-recessive trait. The use of cultured amniotic fluid cells and chorionic villus assay allows first-trimester diagnosis [Chowers et al., 1986; Yang et al., 1990]. Heterozygotes cannot be diagnosed with certainty using enzyme analysis [Cohn et al., 1975], but mutational analysis can accurately identify both affected persons and carriers when two mutant alleles have been detected in a proband.
Management
Patients with growth failure and hepatic dysfunction, including hypoglycemia, appear to benefit from the administration of oral cornstarch [Borowitz and Greene, 1987; Gremse et al., 1990]. It may be important to avoid overtreatment with carbohydrate; cardiomyopathy was reversed in a 16-year-old patient by increasing the protein content of the diet from 20 to 30 percent of caloric intake, with corresponding reduction of cornstarch to the minimum level required to avoid hypoglycemia [Dagli et al., 2009].
Amylo-1,4 →1,6 Transglucosidase Deficiency (Brancher Enzyme Deficiency, Glycogen Storage Disease Type IV)
GSD type IV (Andersen’s disease) results from a deficiency of glycogen branching enzyme (GBE), leading to the accumulation of abnormal glycogen resembling amylopectin in affected tissues. The reported phenotypes are highly varied but for the most part have been marked primarily by liver involvement. GSD type IV has been characterized as the most heterogeneous of the glycogen storage diseases [Moses and Parvari, 2002].
A few infants with severe congenital hypotonia and cardiomyopathy have been described [Nambu et al., 2003; Janecke et al., 2004]. A mild, predominantly myopathic variant has been reported in older children [Reusche et al., 1992]. Adults with polyglucosan body disease who manifest late-onset pyramidal quadriparesis, micturition difficulties, peripheral neuropathy, and mild cognitive impairment have been described. Diagnosis in those cases was made initially by sural nerve biopsy. MRI revealed marked white matter alterations. Branching enzyme activity in leukocytes was about 15 percent of control values [Lossos et al., 1991], although some affected persons identified subsequently have normal enzyme activity. Five Jewish familes with adults with polyglucosan body disease have been described in which affected persons were homozygous for a Tyr329Ser mutation in GBE1. Not all such patients have recognized GBE mutations or impaired GBE activity, suggesting both phenotypic and genotypic heterogeneity [Klein et al., 2004].
Pathology
Glycogen may accumulate disproportionately in the tongue and diaphragm in comparison with other striated muscle groups. The characteristic lesion is the polyglucosan body, a periodic acid–Schiff-positive inclusion that also is seen in phosphofructokinase deficiency, Lafora body disease, double athetosis (Bielschowsky bodies), and aging (corpora amylacea) [Cavanagh, 1999]. Electron microscopy of the deposits reveals branched filaments, osmiophilic granules, and electron-dense amorphous material. Autopsy of a neonate who died at 1 month of life of cardiorespiratory failure showed vacuoles filled with periodic acid–Schiff-positive diastase-resistant materials in cells including neurons. Electron microscopy demonstrated polyglucosan bodies in all tissues examined. GBE1 activity was markedly reduced in muscle and fibroblasts, and absent in liver and heart, as well as glycogen synthase activity. The patient was homozygous for p.E152X in GBE1 [Lamperti et al., 2009].
Biochemistry
The first patient described with deficiency of brancher enzyme activity manifested cirrhosis of the liver and glycogen accumulation [Anderson, 1956], but patients with normal [Holleman et al., 1966] and decreased muscle glycogen concentrations [Sidbury et al., 1962] also have been described. Brancher enzyme deficiency results in the synthesis of unbranched glycogen composed of elongated chains of glucose molecules joined together in 1,4 linkages. As a result, the glycogen is composed of long outer chains, has few branch points, and resembles the pattern of starch also known as amylopectin.
The glycogen brancher enzyme has been purified beyond 3000-fold from rabbit skeletal muscle. The enzyme appears to have a molecular weight of 92–103 kilodaltons (kDa), depending on the choice of reference protein. Amylopectin polysaccharide isolated from the liver of a patient with branching deficiency is branched in the presence of the purified enzyme and α-d-glucose-1-phosphate at pH 7 [Gibson et al., 1971].
Study of the fine structure of glycogen from a patient with brancher enzyme deficiency found that the similarity of abnormal glycogen to amylopectin is in some ways superficial. The abnormal glycogen contains a significant number of short branches. This finding is consistent with the hypothesis that a normal debranching enzyme system in these patients can participate in a reverse reaction, with a resultant small degree of branching activity. The short chains are explained further by the supposition that the glycogen debranching enzyme system would form branch points by the apposition of 1→6 bonded α-glucose units by amylo-1,6-glucosidase. Further elongation of this chain would occur by transfer of oligosaccharide by the oligo-1,4→1,4-transferase component of the debranching system. The transferase favors transfer of maltotriosyl residue, which creates a four-unit branch. Brancher enzyme from muscle or liver ordinarily transfers glucose units containing seven glucose molecules. The shorter branches formed by a reversal of the debranching enzyme system are not as readily extended by glycogen synthetase. If the units are shorter than four glucose units, it may be impossible for them to be extended by synthetase [Mercier and Whelan, 1970]. The presence of short branches suggests that reversal of the debranching mechanism is operative.
Clinical Characteristics
Manifestations of the disease – failure to thrive, hepatosplenomegaly, and liver failure with cirrhosis – usually appear in the first 6 months of life. Affected infants exhibit delayed motor and social development, hypotonia, weakness, and muscle atrophy, accompanied by absent or decreased deep tendon reflexes [McMaster et al., 1979; Zellweger et al., 1972]. The most severe phenotype presents in the fetus. Manifestations of this lethal disorder include cervical cystic hygroma, fetal hydrops, and fetal akinesia in differing combinations [L’Hermine-Coulomb et al., 2005]. A more benign form with clinical onset at the age of 2 years manifested as hepatomegaly and elevated liver enzyme activity. The patient had no neurologic abnormalities, and the liver disease was not progressive [Greene et al., 1988]. Another patient, a 3-year-old male, had mild glycogen storage, as well as dicarboxylicaciduria and secondary carnitine deficiency. Notable clinical improvement occurred with administration of oral l-carnitine [Maaswinkel-Moody et al., 1987]. Yet another patient had mild clinical symptoms at 8 years of age despite profound deficiency of glycogen branching enzyme [Guerra et al., 1986]. Adult myopathic variants have been described [Bornemann et al., 1996].
Clinical Laboratory Tests
Diagnosis of brancher deficiency by assay of peripheral white blood cells, skin fibroblasts, and amniotic cell activity is feasible [Howell et al., 1971]. Confirmation of the diagnosis by mutational analysis is now possible, and is often preferable, given that enzyme analysis may sometimes be difficult to interpret [Li et al., 2010].
Genetics
Early studies confirmed an autosomal-recessive mode of inheritance [Legum and Nitowsky, 1969]. Enzyme activity in cultured fibroblasts is less than control levels in patients and both parents, corroborating the presence of an autosomal-recessive mode of inheritance. Prenatal testing using cultured amniocytes and chorionic villi is feasible [Brown and Brown, 1989] but has been superseded by molecular analysis when available. The gene encoding brancher enzyme, GBE1, was identified in 1993 [Thon et al., 1993]. By 2010, 34 mutations had been described [Li et al., 2010]. Most are missense, but nonsense, intronic donor and acceptor splice-site mutations, small deletion frameshift mutations, small insertion frameshift mutations, and large deletions have all been reported. Although genotype–phenotype correlations are imperfect, missense mutations are more likely to be associated with milder phenotypes, and truncating mutations or large deletions with severe forms of the disease.
Management
Treatment with a combination of zinc-glucagon and α-glucosidase decreased liver glycogen concentration, but the infant died at 11 months of age from an infection [Fernandes and Huijing, 1968]. Liver transplantation has been successful in a number of patients [Selby et al., 1991]. Orthotopic liver transplantation has been attempted with varied success [Selby et al., 1991]. In one report, cardiac amylopectinosis occurred 9 months after successful transplantation [Sokal et al., 1992].
McArdle’s Disease (Myophosphorylase Deficiency, Glycogen Storage Disease Type V)
In 1951, McArdle reported a condition characterized by weakness, fatigue, and severe muscle cramping with pain after exercise. He subsequently noted the lack of normal lactate production in the affected muscles after ischemic work [McArdle, 1951; Pearson et al., 1961; Schmid and Mahler, 1959]. McArdle’s disease is classified as glycogen storage disease type V (GSD V).
Pathology
Light microscopic studies of muscle reveal moderately increased stores of glycogen beneath the sarcolemmal membrane. Electron microscopy demonstrates disorganization of the I band region and distortion of the myofibrils secondary to glycogen deposition [Rowland et al., 1963]. Histochemical study of muscle suggests the absence of myophosphorylase activity, but only quantitative biochemical studies are reliable to confirm the diagnosis. Critical and definitive diagnosis depends on assay for the enzymatic deficiency in the affected muscle tissue.
Biochemistry
Glycogen breakdown to lactate begins with the initial disruption of the 1,4 linkage between glucosyl units. The enzyme myophosphorylase facilitates this reaction in skeletal muscle. After this linkage is cleaved, glucose-1-phosphate is freed and metabolized to lactate through the Embden–Meyerhof pathway. The myophosphorylase enzyme is regenerated in a complex reaction involving a number of other enzymes, including phosphorylase kinase (see Figure 34-3).
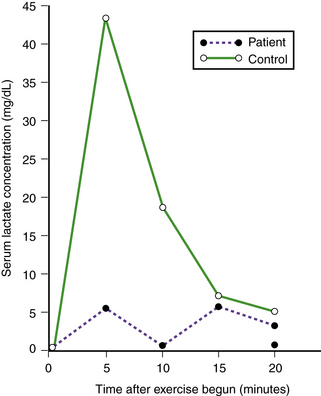
Absence of myophosphorylase activity results in decreased glucose-1-phosphate production; as a result, lactic acid is not formed in exercised muscle, and serum lactic acid concentration is not appropriately elevated (Figure 34-7). Structure of the excess glycogen stored is normal. Mitochondrial metabolism is normal [Argov et al., 1987].
Histochemical stains of fresh frozen sections of skeletal fibers demonstrate absence of phosphorylase. Studies of early multinucleated fibers and striated myofibers grown in vitro from these tissues reveal definite evidence of phosphorylase activity. Genetic coding for developing a form of myophosphorylase activity must be present in the precursor cells of regenerating skeletal muscle. The observation suggests the presence of a mechanism for loss of activity during maturation of tissues. Feasible explanations include the following possibilities: muscle maturation may result in loss of an enzyme that maintains phosphorylase production, survival, or activity; an abnormal specific protease may develop with maturity and inactivate myophosphorylase; a normally repressed myophosphorylase repressor gene may be “de-repressed”; and a normally present but inactive myophosphorylase-inhibiting or destroying enzyme may be activated and inhibit myophosphorylase enzyme activity or survival [DiMauro et al., 1978; Roelofs et al., 1972]. Occasionally, patients are found to have no immunologic cross-reactive material to normal myophosphorylase [Koster et al., 1979].
Clinical Characteristics
Affected children have decreased stamina and tire easily. Fatigue may be mediated in part by ammonia accumulation [Coakley et al., 1992]. Severe cramping pain after minimal exercise is noted in the involved skeletal muscles and primarily affects distal muscles. Cardiac symptoms have not been reported, but cardiac muscle is involved [Ratinov et al., 1965]. Myoglobinuria occurs with moderate or strenuous exercise. In adolescence and adulthood, persistent weakness may develop, with moderate loss of muscle bulk [Schmid and Hammaker, 1961]. A “second wind” phenomenon has been described in which the patient appears to recover after a 15-minute period of weakness and fatigue [Braakhekke et al., 1986]. This phenomenon has been attributed to improved energy production when metabolic dependence switches from glycogen stores to blood-borne fuels, including glucose and fatty acids, and is consistently seen in GSD type V but not in GSD type VII, whose phenotype is otherwise indistinguishable [Haller and Vissing, 2004]. Prolonged or frequent repetitive episodes of myoglobinuria should be avoided because they may result in both acute and chronic renal failure.
Renal failure occurs primarily in men, especially those who perform unusually vigorous exercise, thereby inducing myoglobinuria. These men generally are aware that they are exceeding their usual exercise tolerance. Acute renal failure may not be reversible in these patients [Bank et al., 1972]. One patient with recurrent myoglobinuria and renal failure was found to have had previously unrecognized convulsive seizures as the precipitating events for his episodes [Walker et al., 2003]. In another case, the presence of sickle cell trait and bulimia were likely significant stressors [Pillarisetti and Ahmed, 2007].
Onset usually is in childhood; neonatal onset has been reported [Milstein et al., 1989]. Adult-onset McArdle’s disease also has been reported. One patient had onset at 60 years of age [Felice et al., 1992]. Frequent ingestion of glucose or fructose has had little therapeutic effect. Muscle damage after prolonged exercise may be demonstrated by means of radionuclide scanning techniques [Swift and Brown, 1978].
A 4-week-old female manifested diffuse, progressive muscle weakness and died at 13 weeks of age. She subsequently was demonstrated to have myophosphorylase deficiency and glycogen storage in the muscles. A female sibling died at 4 months of age from the same condition [Miranda et al., 1979]. A very severe phenotype, lethal in infancy, was reported in a child born to consanguineous parents with mutations in both PYGM and dGK, the gene encoding deoxyguanosine kinase, whose deficiency causes the hepatic form of mitochondrial depletion syndrome [Mancuso et al., 2003].
Clinical Laboratory Tests
Exercise results in elevated serum creatine kinase activity and increase in activity of other serum enzymes released from muscle, ostensibly a result of loss of sarcolemmal membrane integrity. The EKG may demonstrate an increased QRS amplitude, a prolonged R-S interval, T wave inversion, and bradycardia [Ratinov et al., 1965].
Ischemic exercise effects may be studied using two blood pressure cuffs, one at the wrist and one just above the elbow. The cuffs are inflated to above systolic pressure, and the pressure is maintained for 3 minutes. Blood is removed from the antecubital vein at 0, 3, 5, 10, 15, and 20 minutes. After the initial blood specimen is drawn (at time 0), the patient is asked to contract and extend the fingers over a rubber ball or rod while the cuff pressure is maintained. A patient with McArdle’s disease, or with any of the glycolytic abnormalities that interfere with lactate production, will experience severe contractures and complain bitterly of pain within 30 seconds after the initiation of ischemic exercise. The contracture phenomenon may be related to delayed reaccumulation of calcium ions in the sarcoplasmic reticulum [Gruener et al., 1968]. The exercise test may not identify patients with low levels of myophosphorylase, in contradistinction to those patients with absence of the enzyme [Taylor et al., 1987].
A test in which subjects cycle with moderate intensity for 15 minutes revealed a consistent decrease in heart rate from 7 to 15 minutes in GSD type V patients, in contrast with an elevation in heart rate in control subjects and patients with other glycogen storage diseases. The test appears specific and sensitive in this population [Vissing and Haller, 2003a]. Near-infrared spectroscopy (NIRS) is another noninvasive approach to screening for GSD V. This technique involves measurement of deoxyhemoglobin and deoxymyoglobin levels in the vastus lateralis muscle as surrogates for oxygen extraction. Patients with GSD V show reduced oxygen extraction compared to controls [Grassi et al., 2007]. Pulmonary oxygen uptake kinetics are negatively correlated with NIRS findings in these patients [Grassi et al., 2009].
Relaxing factor (which controls accumulation of calcium ions by the sarcoplasmic reticulum) appears to be normal in patients with McArdle’s disease [Brody et al., 1970]. Spectroscopy studies are useful in the detection of excessive muscle glycogen [deKerviler et al., 1991; Jehenson et al., 1991].
Genetics
The gene encoding synthesizing myophosphorylase, PYGM, is located at 11q13 [Lebo et al., 1990]. A number of mutations have been described [Vorgerd et al., 1998] but do not appear to explain the clinical heterogeneity of GSD type V. A study of potential genetic modifiers found a strong association between angiotensin-converting enzyme genotype and clinical phenotype, suggesting that angiotensin-converting enzyme is a modifier of PYGM [Martinuzzi et al., 2003]. A further study of 99 Spanish patients confirmed this relationship, and also found that female gender conferred a more severe phenotype [Rubio et al., 2007]. GSD V is transmitted as an autosomal-recessive trait and may manifest in a heterozygote [Schmidt et al., 1987]. Study of muscle biopsy material demonstrates molecular heterogeneity, including near-normal expression of phosphorylase mRNA concentration and size in some patients [McConchie et al., 1990].
Management
A fat-rich diet was administered to a 21-year-old male patient; he subsequently had a shortened recovery period from the acute physical load and suffered no induration of the deltoid muscle after sustained abduction to 90°. Maximal strength did not appear to be improved by the fat-rich diet, but tolerance of submaximal loads appeared to be increased, and recovery from muscle discomfort was accelerated [Viskoper et al., 1975]. The interrelationship of pyridoxal phosphate and glycogen phosphorylase offered some hope for nutritional therapy [Beynon et al., 1996], but this has not been supported by more recent studies. A controlled trial of oral sucrose loading showed improved exercise tolerance and stable glucose levels in 12 adults with GSD type V [Vissing and Haller, 2003b]. Although not suitable for continuous use owing to its tendency to induce weight gain, this regimen, combined with aerobic conditioning, appears likely to be useful in improving performance under stressful conditions and may protect against acute rhabdomyolysis [Amato, 2003]. A review of published trials cited this study and one other in which oral creatine improved ischemic performance, suggesting these as the only therapies with evidence of benefit [Quinlivan and Beynon, 2004]. A more recent review noted that, while low doses of creatine monohydrate improved performance, higher doses could produce worsening of function [Tarnopolsky, 2007]. A trial of aerobic conditioning in eight adults led to increased exercise capacity without adverse effects [Haller et al., 2006]. A short-term trial of gentamicin as “read through” therapy in four patients with stop mutations showed no evidence of benefit [Schroers et al., 2006].
Hepatophosphorylase Deficiency (Hers’ Disease, Glycogen Storage Disease Type VI)
Biochemistry
GSD type VI was described by Hers in 1959, and is characterized by increased glycogen stores of normal configuration in the liver. Hepatic phosphorylase (hepatophosphorylase) activity is diminished or absent.
Because of the possibility of abnormalities in the complex activating mechanism of hepatophosphorylase, systematic study of enzyme activity in suspected hepatophosphorylase deficiency is necessary to exclude phosphorylase kinase deficiency and other metabolic errors in the activating sequence. One patient had hepatomegaly with increased glycogen content and low activity of hepatophosphorylase. No abnormalities of muscle tissue enzymes or glycogen configuration were noted. A liver homogenate prepared from the patient’s biopsy specimen converted rabbit muscle phosphorylase b to phosphorylase a. Hepatic homogenate from the patient manifested no phosphorylase activity under the same conditions in which control human liver homogenate demonstrated phosphorylase activity through activation procedures. No activity was observed in the patient’s hepatic homogenate after the addition of phosphorylase kinase [Hug and Schubert, 1970].
GSD VI could only be diagnosed by enzymology of liver tissue [Hug et al., 1974] until the gene was identified. This identification was accomplished in a Mennonite kindred, whose affected members harbored a single base pair change in a splice donor site of intron 13 in the PYGL gene [Chang et al., 1998]. The technique is particularly helpful in distinguishing patients with relatively high residual enzyme activity from heterozygotes [Tang et al., 2003]. A series of eight patients with GSD VI from seven families were studied, and found to harbor 11 novel mutations, most of which were missense [Beauchamp et al., 2007b]. The patients’ symptoms ranged from hepatomegaly and subclinical hypoglycemia, to severe hepatomegaly with recurrent severe hypoglycemia and postprandial lactic acidosis.
Genetics
The gene coding for the enzyme liver glycogen phosphorylase is located on chromosome 14 [Newgard et al., 1987] at 14q21–22. The condition is transmitted as an autosomal-recessive trait [Wallis et al., 1966]. Most mutations are missense; there are no common mutations [Beauchamp et al., 2007b].
Muscle Phosphofructokinase Deficiency (Tarui’s Disease, Glycogen Storage Disease Type VII)
Biochemistry
The enzyme phosphofructokinase transforms fructose-6-phosphate to fructose-1,6-diphosphate. Decreased activity of this enzyme results in increased muscle glycogen stores of normal structure and increased concentration of glucose-6-phosphate and fructose-6-phosphate [Tarui et al., 1965; Layzer et al., 1967; Thomson et al., 1963; Vora et al., 1987]. The history of GSD type VII, since its discovery as the first enzymatic disorder of glycolysis in 1965, has been reviewed [Nakajima et al., 2002]. Phosphofructokinase exists in five different isoforms with tissue-specific distribution. The gene consists of varying combinations of liver (L), muscle (M), and platelet (P) subunits. Muscle phosphofructokinase is a homotetramer of M subunits [Vora et al., 1980].
Clinical Characteristics
Motor development is normal during the first decade. Nevertheless, patients experience decreased exercise tolerance and easy fatigability during childhood. They perform poorly in games requiring physical stamina and complain of muscle stiffness and weakness, and occasionally of muscle cramps. Myoglobinuria may follow moderate to strenuous exercise and has precipitated acute renal failure [Exantus et al., 2004]. The clinical pattern is reminiscent of McArdle’s disease, except for the absence of a “second wind” phenomenon in GSD type VII [Haller and Vissing, 2004]. One patient with hyperuricemia and gout has been described [Agamanolis et al., 1980].
An unusual infantile syndrome characterized by limb weakness, seizures, cortical blindness, and corneal opacifications has been reported. The infant died at 7 months of age. Microscopic studies of the brain revealed typical features of neuroaxonal dystrophy [Servidei et al., 1986]. Another infant has been reported with infantile seizures and a relatively mild course; two of his sisters died in infancy with hypotonia, delayed milestones, and epilepsy [Al-Hassnan et al., 2007]. A 70-year-old male with progressive weakness of the legs has also been described [Vora et al., 1987]. An Ashkenazi kindred with GSD type VII has been described whose members had clinical manifestations of diabetes in addition to abnormal results on glucose tolerance testing, confirming that PFKM mutations can cause impaired glucose responses to insulin [Ristow et al., 1997]. Affected persons in this family had first become symptomatic in childhood, with easy fatigability after exercise.
A 66-year-old female with epilepsy and cardiac disease attributed to GSD type VII manifested slow progression of symptoms over an 8-year period, but showed marked improvement after effective treatment of her seizures and cardiac disease [Finsterer et al., 2002]. This report emphasizes the importance of meticulously treating (or preferably preventing) complications, rather than adopting a nihilistic approach.
Clinical Laboratory Tests
Phosphofructokinase activity is about 50 percent of the expected value in the erythrocytes of these patients. A decrease from normal levels of activity also is noted in other patients [Sivakumar et al., 1996]. Immunologic study suggests that half of the total activity of erythrocyte phosphofructokinase is derived from an enzyme form identical to phosphofructokinase. One patient with phosphofructokinase deficiency was found to have (incidental) Gilbert’s syndrome (hepatic glucuronyltransferase deficiency) [Fogelfeld et al., 1990].
Genetics
The phosphofructokinase gene (PFKM) is encoded at 12q13.3 [Howard et al., 1996]. GSD type VII is prevalent in Ashkenazim; 68 percent of mutant alleles in this population are accounted for by a splicing mutation in exon 5 [Raben and Sherman, 1995]. About 20 disease-causing mutations in PFKM have been described [Toscano et al., 2007].
Hepatic Phosphorylase Kinase Deficiency and Activation Abnormalities
Some patients with glycogen storage disease have defects in control of the phosphorylase system at the phosphorylase kinase level, rather than a deficiency of the phosphorylase enzyme (see Figure 34-3). Although they appear to have hepatic phosphorylase deficiency disease, further studies identify the presence of the enzyme when activation cycle materials are added in vitro. Hug et al. [1969] described five children with hepatomegaly and increased liver stores of glycogen of normal configuration. An additional three patients, who were siblings, had a mild form of the disease [Gray et al., 1983]. Hepatomegaly, attacks of ketonuria with fasting, and intermittent diarrhea may be prominent. Other patients with the same enzymatic deficiency have involvement of muscle with accompanying weakness [Madlom et al., 1989].
Phosphorylase kinase has a hexadecameric structure: (α, β, γ, δ)4. The δ subunit is calmodulin, which interacts with calcium. The α subunit is encoded by PHKA2 (at Xp22), the β subunit by PHKB, and the γ subunit by PHKG2. Mutations in these three genes have been associated with phosphorylase kinase deficiency and a GSD phenotype [Ban et al., 2003]. The analysis of the responsible genes confirms the prior clinical recognition of both autosomal-recessive and X-linked inheritance [Huijing and Fernandes, 1969; Schimke et al., 1973]. The classification of phosphorylase kinase system disorders into GSD subtypes is highly confusing; various deficiencies have been designated as GSD VIa, VIII, and IX by different workers [Ozen, 2007]. We will simply describe the enzyme defects here, without invoking GSD nomenclature.
One patient with deficiency of phosphorylase kinase activity had normal phosphorylase activity in leukocytes, with deficiency in liver. Three siblings with the condition exhibited a deficiency in red cell and leukocyte phosphorylase b kinase. Specific therapy may not be necessary [Gray et al., 1983]. Treatment with diazoxide may be beneficial, because fasting hypoglycemia is curtailed. Diazoxide inhibits insulin release, increases adrenal medullary secretion of epinephrine, and inhibits the cyclic adenosine monophosphate phosphodiesterase activity. Together these actions should increase intracellular cyclic adenosine monophosphate. Neither insulin suppression nor associated decrease in hepatomegaly occurred in this patient [Ludwig et al., 1972].
In another patient, findings included evidence of central nervous system dysfunction and associated incomplete activation of brain phosphorylase [Hug et al., 1966]. Glucagon appeared to reverse the deficiency.
Glucagon administration does not lead to clinical improvement in all patients with decreased hepatic phosphorylase kinase activity. Hug and Schubert [1970] described a 3-year-old child with marked hepatomegaly and no splenomegaly. A slight tendency to develop hypoglycemia without acidosis was noted. Mental development was normal. Administration of either glucagon or epinephrine did not stimulate phosphorylase activity. Phosphorylase activity was reinstituted by in vitro methods employing addition of cyclic adenosine monophosphate or its substituted derivatives.
Reduced hepatophosphorylase activity may result from several separate defects in the phosphorylase activating system [Hug, 1972]. Hepatic tissue removed from a patient may fail to activate either endogenous or exogenous phosphorylase. Purified exogenous phosphorylase kinase may restore the phosphorylase activity, which establishes a deficiency of liver phosphorylase kinase. There may be no abnormalities in the cyclic adenosine monophosphate-dependent protein kinase cycle [Hug, 1972].
A 5-year-old male with phosphorylase kinase deficiency manifested improved growth, stabilization of blood glucose, and improvement in laboratory measures with uncooked cornstarch supplementation [Nakai et al., 1994].
A study of 15 patients from 12 families emphasized the importance of molecular diagnosis in this condition, since enzymology is often uninformative [Beauchamp et al., 2007]. Most patients (13 of 15) were boys, with onset of symptoms between 6 months and 7 years. They presented with varying combinations of hypoglycemia, hepatosplenomegaly, short stature, liver disease, and muscular symptoms, including weakness, fatigue, and motor delay. Laboratory abnormalities included elevated lactate, urate, and lipids. Mutations were identified in the PHKA2, PHKG2, and PHKB genes. Patients with PHKG2 mutations had severe manifestations, whereas those with PHKB mutations were mildly affected. There was a range of manifestations associated with PHKA2 mutations.
Phosphohexose Isomerase Deficiency (Satoyoshi’s Disease)
Satoyoshi and Kowa [1967] described a family whose members experienced muscle pain and stiffness with exercise, beginning in childhood. The symptoms become more prominent in later life. Muscle contractures do not occur after ischemic exercise. Routine examination is normal. Heavy exercise leads to stiffness and tenderness of the muscles without apparent weakness. Lactic acid does not increase during ischemic exercise and serum creatine kinase is increased, but findings on EMG remain normal.
Schroter and co-workers [1985] described a male with severe hemolytic anemia requiring splenectomy at 5 years. Eight years later he had mild hemolytic anemia, gallstones, and jaundice; neurologic findings included weakness, mixed sensory and cerebellar ataxia, and mental retardation. He was found to have a unique mutation (glucose phosphate isomerase Homburg) that produced severe enzyme deficiency.
GPI has been assigned to 19cen–q12. It consists of 18 exons and is 40 kb in length [Walker et al., 1995]. The gene codes for two proteins in addition to hexosephosphate isomerase: neuroleukin, a chemokine, and autocrine motility factor [Niinaka et al., 1998]. Antibodies to glucose phosphate isomerase have been shown to sustain a rheumatoid arthritis-like condition in experimental animals [Schaller et al., 2001]. A Japanese report summarized the expanded phenotype of Satoyoshi’s disease, which includes painful muscle cramps, alopecia, intractable diarrhea, bone and joint deformity, and endocrine disturbances. The authors postulated that antibody-induced inhibition of spinal interneurons and excitation of anterior horn cells might explain the cramps, based on the reaction of patients’ sera with an 85 kDa protein derived from human brain lysate [Arimura, 2004].
Phosphoglucomutase Deficiency (Thomson’s Disease)
The phosphoglucomutases are a family of enzymes catalyzing the interconversion of glucose-1-phosphate and fructose-1-phosphate. In early infancy, a male experienced numerous episodes of supraventricular tachycardia, requiring digitoxin treatment; development then proceeded normally until the age of 2 years, when he began to walk on his toes [Thomson et al., 1963]. Examination revealed mild weakness and poor muscle development. His calf muscles were bulky and firm, and shortening of the Achilles tendons was noted. No clinical history of exercise intolerance, muscle pain, or myoglobinuria was elicited. Serum enzyme activities, including creatine kinase, aldolase, glutamic-oxaloacetic transaminase, and glutamic-pyruvic transaminase, were elevated. Examination by EMG showed myopathic changes.
Another patient, a 5-month-old male, presented with recurrent vomiting, lethargy, and poor weight gain. Metabolic acidosis was profound. In addition to the expected enzyme deficiency, he had decreased muscle and serum carnitine levels [Sugie et al., 1988]. The carnitine changes most likely were a secondary phenomenon.
A 38-year-old male presented with a history of easy fatigability and exercise-induced weakness of the extremities since he was 20. He had weakness, wasting of extremities, bilateral clubbed fingers, and hypoesthesia of the distal portion of extremities. Fasting plasma glucose was low (58 mg/dL), and no rise in lactate occurred after ischemic exercise. Phosphoglucomutase activity was 15 percent of control, and muscle biopsy depicted a small amount of glycogen storage [Nakashima et al., 1992]. A 35-year-old man with exercise-induced cramps, mild limb girdle weakness, episodes of rhabdomyolysis, normal elevation of lactate, and hyperammonemia on a forearm-exercise test has also been reported the investigators suggested that this disorder should be designated glycogenosis type XIV. Given the confusion surrounding the numeric designation of glycogenoses, we suggest referring to the disorder by its enzyme deficiency.
Other Defects of Glycolysis Causing Glycogen Storage
Three enzyme defects affecting the terminal glycolysis pathway have been reported, involving phosphoglycerate kinase, phosphoglycerate mutase, and lactate dehydrogenase [Bresolin et al., 1983; Tsujino et al., 1993; Toscano et al., 2007]. Phosphoglycerate kinase deficiency is an X-linked disorder manifesting with varying combinations of hemolytic anemia, seizures, mental retardation, and exercise intolerance with myoglobinuria [Bresolin et al., 1984]. Up to 1990, 33 patients had been reported. Of these, 11 of the 33 had hemolytic anemia and central nervous system involvement (seizures, mental retardation, strokes); 9 of the 33 had a purely myopathic form. This phenotype features recurrent episodes of exercise-induced cramps and myoglobinuria, and may be indistinguishable clinically from deficiencies of phosphorylase b kinase (PHK), myophosphorylase (GSD V, McArdle’s disease), phosphofructokinase (PFK, GSD VII, Tarui’s disease), phosphoglycerate mutase (PGAM), and lactate dehydrogenase. Phosphoglycerate mutase deficiency (PGAMD) has been associated in adults with myalgia, cramps, and myoglobinuria after exercise [Tonin et al., 1993]. Twelve well-verified patients had been described by 2009, 9 of whom were African American [Naini et al., 2009]. Tubular aggregates, an expression of sarcoplasmic reticulum proliferation, are seen in about one-third of patients with this disease; the pathogenic mechanism is unclear [Naini et al., 2009]. A patient with PGAMD who experienced muscle cramps on forearm ischemic exercise testing was protected from cramps by dantrolene, suggesting that cramps in this disease reflect excessive calcium release from the sarcoplasmic reticulum relative to calcium reuptake capacity [Vissing et al., 1999]. The PGAMD gene has been cloned, and molecular diagnosis is feasible [Tsujino et al., 1993.] Lactate dehydrogenase M subunit deficiency has been reported in three families with exertional myoglobinuria [Kanno et al., 1988]. Additional cases have been identified, and a number of mutations identified in the responsible gene [Maekawa et al., 1994; Tsujino et al., 1994]. Successful pregnancy in an affected female has been described [Anai et al., 2002].
References
 The complete list of references for this chapter is available online at www.expertconsult.com.
AANEM American Association of Neuromuscular and Electrodiagnostic Medicine. Diagnostic criteria for late-onset (childhood and adult) Pompe disease. Muscle Nerve. 2009;40:149-160.
Adams A., Redden C., Menahem S. Characterization of human fructose 1,6-bisphosphatase in control and deficient tissues. J Inherit Metab Dis. 1990;13:829.
Agamanolis D.P., Askari A.D., DiMauro S., et al. Muscle phosphofructokinase deficiency: Two cases with unusual polysaccharide accumulation and immunologically active enzyme protein. Muscle Nerve. 1980;3:456.
Al-Hassnan Z.N., Al Budhaim M., Al-Owain M., et al. Muscle phosphofructokinase deficiency with neonatal seizures and nonprogressive course. J Child Neurol. 2007;22:106-108.
Amato A.A. Sweet success – a treatment for McArdle’s disease. N Engl J Med. 2003;349:2481.
Anai T., Urata K., Tanaka Y., et al. Pregnancy complicated with lactate dehydrogenase M-subunit deficiency: The first case report. J Obstet Gynaecol Res. 2002;28:108.
Andersen M.W., Williams V.P., Sparkes M.C., et al. Transferase-deficiency galactosemia: Immunochemical studies of the Duarte and Los Angeles variants. Hum Genet. 1984;65:287.
Anderson D.H. Familial cirrhosis of the liver with storage of abnormal glycogen. Lab Invest. 1956;5:11.
Angelini C., Engel A. Comparative study of acid maltase deficiency. Arch Neurol. 1972;26:344.
Annabi B., Hiraiwa H., Mansfield B.C., et al. The gene for glycogen-storage disease type 1b maps to chromosome 11q23. Am J Hum Genet. 1998;62:400.
Aoyama Y., Ozer I., Demirkol M., et al. Molecular features of 23 patients with glycogen storage disease type III in Turkey: a novel mutation p.R1147G associated with isolated glucosidase deficiency, along with 9 AGL mutations. J Hum Genet. 2009;54:681-686.
Applegarth D.A., Donnell G.N., Mullinger M., et al. Study of a family with Los Angeles, Duarte, and classical galactosemia variants of galactose-1-phosphate uridyl transferase. Biochem Med. 1976;15:206.
Araoz C., Sun C.N., Shenefelt R., et al. Glycogenosis type II (Pompe’s disease): Ultrastructure of peripheral nerves. Neurology. 1974;24:739.
Argov Z., Bank W.J., Maris J., et al. Muscle energy metabolism in McArdle’s syndrome by in vivo phosphorus magnetic resonance spectroscopy. Neurology. 1987;37:1720.
Arimura K. Isaacs’ syndrome, stiff person syndrome and Satoyoshi disease: pathomechanisms and treatment. Rinsho Shinkeigaku. 2004;44:805-807.
Baker L., Winegrad A.I. Fasting hypoglycaemia and metabolic acidosis associated with deficiency of hepatic fructose 1,6-diphosphatase activity. Lancet. 1970;2:13.
Ban K., Sugiyama K., Goto K., et al. Detection of PHKA2 gene mutation in four Japanese patients with hepatic phosphorylase kinase deficiency. Tohoku J Exp Med. 2003;200:47.
Bank W., DiMauro S., Rowland L. Renal failure in McArdle’s disease. N Engl J Med. 1972;287:1102.
Bao Y., Dawson T.L., Chen Y.T. Human glycogen debranching enzyme gene (AGL): Complete structural organization and characterization of the 5 flanking region. Genomics. 1996;38:155.
Beauchamp N.J., Dalton A., Ramaswami U., et al. Glycogen storage disease type IX: High variability in clinical phenotype. Mol Genet Metab. 2007;92:88-99.
Beauchamp N.J., Taybert J., Champion M.P., et al. High frequency of missense mutations in glycogen storage disease type VI. J Inherit Metab Dis. 2007;30:722-734.
Bell L., Sherwood W.G. Current practices and improved recommendations for treating hereditary fructose intolerance. J Am Diet Assoc. 1987;87:721.
Belman A.L., Moshe S.L., Zimmerman R.D. Computed tomographic demonstration of cerebral edema in a child with galactosemia. Pediatrics. 1986;78:606.
Bergsma D.J., Ai Y., Skach W.R., et al. Fine structure of the human galactokinase GALK1 gene. Genome Res. 1996;6:980.
Bernier A.V., Sentner C.P., Correia C.E., et al. Hyperlipidemia in glycogen storage disease type III: effect of age and metabolic control. J Inherit Metab Dis. 2008;31(6):729-732.
Beutler E., Baluda M.C. A simple spot screening test for galactosemia. J Lab Clin Med. 1966;68:137.
Beutler E., et al. A new genetic abnormality resulting in galactose-1-phosphate uridyltransferase deficiency. Lancet. 1965;1:353.
Beynon R.J., Bartram C., Flannery A., et al. Interrelationships between metabolism of glycogen phosphorylase and pyridoxal phosphate – implications in McArdle’s disease. Adv Food Nutr Res. 1996;40:135.
Bodamer O.A., Haas D., Hermans M.M., et al. L-alanine supplementation in late infantile glycogen storage disease type II. Pediatr Neurol. 2002;2:145.
Bodamer O.A., Halliday D., Leonard J.V. The effects of L-alanine supplementation in late-onset glycogen storage disease type II. Neurology. 2000;55:710.
Bodamer O.A., Leonard J.V., Halliday D. Dietary treatment in late-onset acid maltase deficiency. Eur J Pediatr. 1997;156(Suppl 1):539.
Bornemann A., Besser R., Shin Y.S., et al. A mild adult myopathic variant of type IV glycogenosis. Neuromuscul Disord. 1996;6:95.
Borowitz S.M., Greene H.L. Cornstarch therapy in a patient with type III glycogen storage disease. J Pediatr Gastroenterol Nutr. 1987;6:631.
Bosch A.M. Classical galactosaemia revisited. J Inherit Metab Dis. 2006;29:516-525.
Bosch A.M., Bakker H.D., van Gennip A.H., et al. Clinical features of galactokinase deficiency: a review of the literature. J Inherit Metab Dis. 2002;25:629-634.
Bouteldja N., Timson D.J.. The biochemical basis of hereditary fructose intolerance. Epub online February J Inherit Metab Dis. 2010. DOI:10.1007/s10545-010-9053-2
Bowling F.G., Fraser D.K., Clague A.E., et al. A case of uridine diphosphate galactose-4-epimerase deficiency detected by neonatal screening for galactosaemia. Med J Aust. 1986;144:150.
Braakhekke J.P., de Bruin M.I., Stegeman D.F., et al. The second wind phenomenon in McArdle’s disease. Brain. 1986;109:1087.
Brandt I.K., DeLuca V.A.Jr. Type III glycogenosis: A family with an unusual tissue distribution of the enzyme lesion. Am J Med. 1966;40:779.
Bresolin N., Miranda A., Chang H.W., et al. Phosphoglycerate kinase deficiency myopathy: Biochemical and immunological studies of the mutant enzyme. Muscle Nerve. 1984;7:542.
Bresolin N., Ro Y.I., Reyes M., et al. Muscle phosphoglycerate mutase (PGAM) deficiency: A second case. Neurology. 1983;33:1049.
Brody I., Gerberg C., Sidbury J.Jr. Relaxing factor in McArdle’s disease. Neurology. 1970;20:555.
Brody L.C., Abel K.J., Castilla L.H., et al. Construction of a transcription map surrounding the BRCA1 locus of human chromosome 17. Genomics. 1995;25:238.
Brombacher P.J., et al. A report on two adult patients with glycogen storage disease. Acta Med Scand. 1964;176:269.
Brown B.I., Brown D.H. Branching enzyme activity of cultured amniocytes and chorionic villi: Prenatal testing for type IV glycogen storage disease. Am J Hum Genet. 1989;44:378.
Brown D.H., Waindle L.M., Brown B.I. The apparent activity in vivo of the lysosomal pathway of glycogen catabolism in cultured human skin fibroblasts from patients with type III glycogen storage disease. J Biol Chem. 1978;253:5005.
Brunberg J.A., McCormick W.F., Schochet S.S.Jr. Type III glycogenosis: An adult with diffuse weakness and muscle wasting. Arch Neurol. 1971;25:171.
Butterworth J., Broadhead D.M. Diagnosis of Pompe’s disease in cultured skin fibroblasts and primary amniotic fluid cells using 4-methylumbelliferyl-alpha-d-glucopyranoside as substrate. Clin Chim Acta. 1977;78:335.
Cabrera-Abreu J., Crabtree N.J., Elias E., et al. Bone mineral density and markers of bone turnover in patients with glycogen storage disease types I, III and IX. J Inherit Metab Dis. 2004;27(1):1-9.
Cakmakci H., Pekcevik Y., Yis U., et al. Diagnostic value of proton MR spectroscopy and diffusion-weighted MR imaging in childhood inherited neurometabolic brain diseases and review of the literature. Eur J Radiol. 2009.
Calderon F.R., Phansalkar A.R., Crockett D.K., et al. Mutation database for the galactose-1-phosphate uridyltransferase (GALT) gene. Hum Mutat. 2007;28:939-943.
Cavanagh J.B. Corpora amylacea and the family of polyglucosan diseases. Brain Res Rev. 1999;29:265.
Chambers R.A., Pratt R.T.C. Idiosyncrasy to fructose. Lancet. 1956;2:340.
Chang S., Rosenberg M.J., Morton H., et al. Identification of a mutation in liver glycogen phosphorylase in glycogen storage disease type VI. Hum Mol Genet. 1998;7:865.
Chen C.P., Lin S.P., Tzen C.Y., et al. Detection of a homozygous D645E mutation of the acid alpha-glucosidase gene and glycogen deposition in tissues in a second-trimester fetus with infantile glycogen storage disease type II. Prenat Diagn. 2004;24:231-232.
Chen Y.T. Type I glycogen storage disease: Kidney involvement, pathogenesis and its treatment. Pediatr Nephrol. 1991;5:71.
Chen Y.T., Cornblath M., Sidbury J.B. Cornstarch therapy in type I glycogen storage disease. N Engl J Med. 1984;310:171.
Chen Y.T., He J.K., Ding J.H., et al. Glycogen debranching enzyme: Purification, antibody characterization, and immunoblot analyses of the type III glycogen storage disease. Am J Hum Genet. 1987;41:1002.
Chhay J.S., Vargas C.A., McCorvie T.J., et al. Analysis of UDP-galactose 4′-epimerase mutations associated with the intermediate form of type III galactosaemia. J Inherit Metab Dis. 2008;31:108-116.
Chou J.Y., Jun H.S., Mansfield B.C. Neutropenia in type Ib glycogen storage disease. Curr Opin Hematol. 2010;17(1):36-42.
Chowers M., Abeliovich D., Potashnik R., et al. Enzymatic activity of glycogen metabolism in chorionic villi. Placenta. 1986;7:505.
Clemens P., Voltmer C., Plettner C. Interference by antibiotics with neonatal screening for galactosemia. J Pediatr. 1986;109:713.
Coakley J.H., Wagenmakers A.J., Edwards R.H. Relationship between ammonia, heart rate, and exertion in McArdle’s disease. Am J Physiol. 1992;2662:E167.
Cohn J., et al. Amylo-1,6-glucosidase deficiency (glycogenosis type III) in Faroe Islands. Hum Hered. 1975;25:15.
Coleman R.A., Winter H.S., Wolf B., et al. Glycogen storage disease type III (glycogen debranching enzyme deficiency): Correlation of biochemical defects with myopathy and cardiomyopathy. Ann Intern Med. 1992;116:896.
Corbeel L., Van Lierde S., Jaeken J. Long-term follow-up of portacaval shunt in glycogen storage disease type 1B. Eur J Pediatr. 2000;159:268-272.
Cori G.T., Cori C.F. Glucose-6-phosphatase of the liver in glycogen storage disease. J Biol Chem. 1952;199:661.
Cuthbert C., Klapper H., Elsas L. Diagnosis of inherited disorders of galactose metabolism. Curr Protoc Hum Genet. 2008. Chapter 17: Unit 17 15
Cuttino J.Jr, Summer G., Hill H.Jr, et al. Response to medium chain triglycerides in von Gierke’s disease. Pediatrics. 1970;46:925.
Dagli A.I., Zori R.T., McCune H., et al. Reversal of glycogen storage disease type IIIa-related cardiomyopathy with modification of diet. Inherit Metab Dis. 2009. Mar 30 [Epub ahead of print] DOI: 10.1007/s10545-009-1088-x
Danon M.J., Oh S.J., DiMauro S., et al. Lysosomal glycogen storage disease with normal acid maltase. Neurology. 1981;31:51.
Daublin G., Schwahn B., Wendel U. Type I glycogen storage disease: Favourable outcome on a strict management regimen avoiding increased lactate production during childhood and adolescence. Eur J Pediatr. 2002;161(Suppl 1):S40.
deKerviler E., Leroy-Willig A., Jehenson P., et al. Exercise-induced muscle modifications: Study of healthy subjects and patients with metabolic myopathies with MR imaging and P-31 spectroscopy. Radiology. 1991;181:259.
Demo E., Frush D., Gottfried M., et al. Glycogen storage disease type III-hepatocellular carcinoma a long-term complication? J Hepatol. 2007;46(3):492-498.
de Parscau L., Guibaud P., Maire I. Glycogenoses type 1b and 1c. Pediatrie. 1988;43:661.
Dieckgraefe B.K., Korzenik J.R., Husain A., et al. Association of glycogen storage disease 1b and Crohn disease: Results of a North American survey. Eur J Pediatr. 2002;161(Suppl 1):S88.
Di Mauro S., Hartwig G.B., Hays A. Debrancher deficiency: Neuromuscular disorder in five adults. Ann Neurol. 1978;5:422.
Ding J.H., de Barsy T., Brown B.I., et al. Immunoblot analyses of glycogen debranching enzyme in different subtypes of glycogen storage disease type III. J Pediatr. 1990;116:95.
Dobrowolski S.F., Banas R.A., Suzow J.G., et al. Analysis of common mutations in the galactose-1-phosphate uridyl transferase gene: New assays to increase the sensitivity and specificity of newborn screening for galactosemia. J Mol Diagn. 2003;5:42.
Donnell G.N., Bergren W.R., Ng W.G. Galactosemia. Biochem Med. 1967;1:29.
Edelstein G., Hirshman C.A. Hyperthermia and ketoacidosis during anesthesia in a child with glycogen storage disease. Anesthesiology. 1980;52:90.
Egan T.J., Wells W.W. Alternate metabolic pathway in galactosemia. Am J Dis Child. 1966;111:400.
Elsas L.J. Prenatal diagnosis of galactose-1-phosphate uridyltransferase (GALT)–deficient galactosemia. Prenat Diagn. 2001;21:302.
Elsas L.J., Langley S., Steele E., et al. Galactosemia: A strategy to identify new biochemical phenotypes and molecular genotypes. Am J Hum Genet. 1995;56:630.
Endo Y., Horinishi A., Vorgerd M., et al. Molecular analysis of the AGL gene: heterogeneity of mutations in patients with glycogen storage disease type III from Germany, Canada, Afghanistan, Iran, and Turkey. J Hum Genet. 2006;51(11):958-963.
Exantus J., Ranchin B., Dubourg L., et al. Acute renal failure in a patient with phosphofructokinase deficiency. Pediatr Nephrol. 2004;19:111.
Facchiano A., Marabotti A. Analysis of galactosemia-linked mutations of GALT enzyme using a computational biology approach. Protein Eng Des Sel. 2010;23(2):103-113. Epub 2009 Dec 11
Felice K.J., Schneebaum A.B., Jones H.R.Jr. McArdle’s disease with late-onset symptoms: Case report and review of the literature. J Neurol Neurosurg Psychiatry. 1992;55:407.
Fernandes J., Huijing F. Branching enzyme-deficiency glycogenosis: Studies in therapy. Arch Dis Child. 1968;43:347.
Fernandes J., van de Kamer J.H. Hexose and protein tolerance tests in children with liver glycogenosis caused by a deficiency of the debranching enzyme system. Pediatrics. 1968;41:935.
Fine R.N., Podosin R., Donnell G.N. Case report: Acute hemiplegia in glycogen storage disease, type I. Acta Paediatr Scand. 1969;58:621.
Finsterer J., Stollberger C., Kopsa W. Neurologic and cardiac progression of glycogenosis type VII over an eight-year period. South Med J. 2002;95:1436.
Fishler K., Donnell G.N., Bergren W.R., et al. Intellectual and personality development in children with galactosemia. Pediatrics. 1972;50:412.
Flanagan J.M., McMahon G., Brendan Chia S.H., et al. The role of human demographic history in determining the distribution and frequency of transferase-deficient galactosaemia mutations. 1 February Heredity. 2010;104:148-154. doi: 10.1038/hdy.2009.84
Fogelfeld L., Sarova-Pinchas I., Meytes D., et al. Phosphofructokinase deficiency (Tarui disease) associated with hepatic glucuronyltransferase deficiency (Gilbert’s syndrome): A case and family study. Isr J Med Sci. 1990;26:328.
Folkman J., Philipart A., Tze W., et al. Portacaval shunt for glycogen storage disease: Value of prolonged intravenous hyperalimentation before surgery. Surgery. 1972;72:306.
Forbes G.B. Glycogen storage disease: Report of a case with abnormal glycogen structure in liver and skeletal muscle. J Pediatr. 1953;42:645.
Forges T., Monnier-Barbarino P., Leheup B., et al. Pathophysiology of impaired ovarian function in galactosaemia. Hum Reprod Update. 2006;12:573-584.
Foster J.D., Nordlie R.C. The biochemistry and molecular biology of the glucose-6-phosphatase system. Exp Biol Med (Maywood). 2002;227:601-608.
Franco L.M., Krishnamurthy V., Bali D., et al. Hepatocellular carcinoma in glycogen storage disease type Ia: a case series. J Inherit Metab Dis. 2005;28:153-162.
Fridovich-Keil J.L. Galactosemia: the good, the bad, and the unknown. J Cell Physiol. 2006;209:701-705.
Friedman J.H., Levy H.L., Boustany R.M. Late onset of distinct neurologic syndromes in galactosemic siblings. Neurology. 1989;39:741.
Froesch E.R., et al. Hereditary fructose intolerance: An inborn defect of hepatic fructose-1-phosphate splitting aldolase. Am J Med. 1963;34:151.
Garibaldi L., Superti-Furga A., Borrone C. Galactosemia caused by generalized uridine diphosphate galactose-4-epimerase deficiency. J Pediatr. 1986;109:1074.
Gibson W., Brown B., Brown D. Studies of glycogen branching enzyme: Preparation and properties of a-1,4-glucan-a-1,4-glucan 6-glycosyltransferase and its action on the characteristic polysaccharide of the liver of children with type IV glycogen storage disease. Biochemistry. 1971;10:4253.
Goutières F., Aicardi J. Glycogenose par deficit en amylo-1,6-glucosidase associee a un trouble de l’hormonosynthese thyroidienne. Arch Fr Pediatr. 1971;28:699.
Goutières F., Bourgeois M., Trioche P., et al. Moyamoya disease in a child with glycogen storage disease type Ia. Neuropediatrics. 1997;28:133.
Grassi B., Marzorati M., Lanfranconi F., et al. Impaired oxygen extraction in metabolic myopathies: detection and quantification by near-infrared spectroscopy. Muscle Nerve. 2007;35:510-520.
Grassi B., Porcelli S., Marzorati M., et al. Metabolic myopathies: functional evaluation by analysis of oxygen uptake kinetics. Med Sci Sports Exerc. 2009;41:2120-2127.
Gray R.G., Kumar D., Whitfield A.E. Glycogen phosphorylase b kinase deficiency in three siblings. J Inherit Metab Dis. 1983;6:107.
Greene H.L., Brown B.I., McClenathan D.T., et al. A new variant of type IV glycogenosis: Deficiency of branching enzyme activity without apparent progressive liver disease. Hepatology. 1988;8:302.
Greene H.L., Slonim A.E., O’Neill J.A.Jr, et al. Nocturnal intragastric feeding for type 1 glycogen-storage disease. N Engl J Med. 1976;294:423.
Greene H.L., Wilson F.A., Hefferan P., et al. ATP depletion, a possible role in the pathogenesis of hyperuricemia in glycogen storage disease type I. J Clin Invest. 1978;62:321.
Gremse D.A., Bucuvalas J.C., Balistreri W.F. Efficacy of cornstarch therapy in type III glycogen-storage disease. Am J Clin Nutr. 1990;52:671.
Gross K.C., Acosta P.B. Fruits and vegetables are a source of galactose: Implications in planning the diets of patients with galactosaemia. J Inherit Metab Dis. 1991;14:253.
Gruener R., McArdle B., Ryman F.E., et al. Contracture of phosphorylase deficient muscle. J Neurol Neurosurg Psychiatry. 1968;31:268.
Gubbels C.S., Land J.A., Rubio-Gozalbo M.E. Fertility and impact of pregnancies on the mother and child in classic galactosemia. Obstet Gynecol Surv. 2008;63:334-343.
Guerra A.S., van Diggelen O.P., Carneiro F., et al. A juvenile variant of glycogenosis IV (Andersen disease). Eur J Pediatr. 1986;145:179.
Gutman L., Hogan G., Schmidt R. Electromyography and histology of Pompe’s disease. Bull Am Assoc EMG Electrodiag. 1967;14:13.
Haller R.G., Vissing J. No spontaneous second wind in muscle phosphofructokinase deficiency. Neurology. 2004;62:82.
Haller R.G., Wyrick P., Taivassalo T., et al. Aerobic conditioning: an effective therapy in McArdle’s disease. Ann Neurol. 2006;59(6):922-928.
Hansen R.B. Hereditary galactosemia. JAMA. 1969;208:43.
Hansen T.W., Henrichsen B., Rasmussen R.K., et al. Neuropsychological and linguistic follow-up studies of children with galactosaemia from an unscreened population. Acta Paediatr. 1996;85:1197.
Harley J.D., Mutton P., Irvine S., et al. Maternal enzymes of galactose metabolism and the “inexplicable” infantile cataract. Lancet. 1974;2:259.
Hasegawa Y., Kikawa Y., Miyamaoto J., et al. Intravenous glycerol therapy should not be used in patients with unrecognized fructose-1,6-bisphosphatase deficiency. Pediatr Int. 2003;45:5.
Henry I., Gallano P., Besmond C., et al. The structural gene for aldolase B (ALDB) maps to 9q13-32. Ann Hum Genet. 1985;49:173.
Hermans M.M., van Leenen D., Kroos M.A., et al. Twenty-two novel mutations in the lysosomal alpha-glucosidase gene (GAA) underscore the genotype-phenotype correlation in glycogen storage disease type II. Hum Mutat. 2004;23:47.
Hers H.G. a-Glucosidase deficiency in generalized glycogen storage disease (Pompe’s disease). Biochem J. 1963;86:11.
Hers H.G. Etudes enzymatique sur fragments hepatiques: Application á la classification des glycogennoses. Rev Int Hepatol. 1959;9:35.
Hers H.G., Joassin G. Anomalie de l’aldolase hepatique dans l’intolérance au fructose. Enzyme. 1961;1:4.
HMGD – Human Gene Mutation Database. University of Cardiff http://www.hgmd.cf.ac.uk/ac/gene.php?gene=AGL Accessed March 24, 2010
Hoefsloot L.H., van der Ploeg A.T., Kroos M.A., et al. Adult and infantile glycogenosis type II in one family, explained by allelic diversity. Am J Hum Genet. 1990;46:45.
Hogan G.R., Gutmann L., Schmidt R., et al. Pompe’s disease. Neurology. 1969;19:894.
Holden H.M., Thoden J.B., Timson D.J., et al. Galactokinase: structure, function and role in type II galactosemia. Cell Mol Life Sci. 2004;61:2471-2484.
Holleman L.W.J., van der Haar J.A., de Vaan G.A.M. Type IV glycogenosis. Lab Invest. 1966;15:357.
Holton J.B. Galactose disorders: An overview. J Inherit Metab Dis. 1990;13:476.
Holton J.B., Allen J.T., Gillett M.G. Prenatal diagnosis of disorders of galactose metabolism. J Inherit Metab Dis. 1989;12(Suppl 1):202.
Hou J.W., Wang T.R. A 20-year follow-up of a male patient with type Ia glycogen storage disease. Chang Gung Med J. 2003;26:283-287.
Hou J.W., Wang T.R., Tunnessen W.W.Jr. Picture of the month. Glycogen storage disease type la (von Gierke disease) complicated by gouty arthritis and xanthomatosis. Arch Pediatr Adolesc Med. 1996;150:219-220.
Howard T.D., Akots G., Bowden D.W. Physical and genetic mapping of the muscle phosphofructokinase gene (PFKM): Reassignment to human chromosome 12q. Genomics. 1996;34:122.
Howell R., Kaback M., Brown B. Type IV glycogen storage disease: Branching enzyme deficiency in skin fibroblasts and possible heterozygote detection. J Pediatr. 1971;78:638.
Hsia DY-Y, Walker F.A. Variability in the clinical manifestations of galactosemia. J Pediatr. 1961;59:872.
Hudgson B., Fulthorpe J. The pathology of type II skeletal muscle glycogenosis. J Pathol. 1975;116:139.
Hug G. Enzyme therapy and prenatal diagnosis in glycogenosis type II. Am J Dis Child. 1974;128:607.
Hug G. Non-bilirubin genetic disorders of the liver. In: Gall E.A., editor. The liver. Baltimore: Williams & Wilkins, 1972.
Hug G., Chick G., Walling L., et al. Liver phosphorylase deficiency in glycogenosis type VI: Documentation by biochemical analysis of hepatic biopsy specimens. J Lab Clin Med. 1974;84:26.
Hug G., Garancis J.C., Schubert W.K., et al. Glycogen storage disease, types II, III, VII, and IX. Am J Dis Child. 1966;11:457.
Hug G., Schubert W. Type IV glycogenosis: Biochemical demonstration of liver phosphorylase deficiency. Biochem Biophys Res Commun. 1970;41:1178.
Hug G., Schubert W.K., Chuck G. Deficient activity of dephosphorylase kinase and accumulation of glycogen in liver. J Clin Invest. 1969;48:704.
Hug G., Soukup S., Ryan M., et al. Rapid prenatal diagnosis of glycogen-storage disease type II by electron microscopy of uncultured amniotic-fluid cells. N Engl J Med. 1984;310:1018.
Hughes J., Ryan S., Lambert D., et al. Outcomes of siblings with classical galactosemia. J Pediatr. 2009;154:721-726.
Huijing F., Fernandes J. X-chromosomal inheritance of liver glycogenosis with phosphorylase kinase deficiency. Am J Hum Genet. 1969;21:275.
Hulsmann W.C., Fernandes J. A child with lactacidemia and fructose diphosphatase deficiency in the liver. Pediatr Res. 1971;5:633.
Hurley T.D., Walls C., Bennett J.R., et al. Direct detection of glycogenin reaction products during glycogen initiation. Biochem Biophys Res Commun. 2006;348:374-378.
Huttenlocher P.R., Hillman R.E., Hsia Y.E. Pseudotumor cerebri in galactosemia. J Pediatr. 1970;76:902.
Irons M., Levy H.L., Pueschel S., et al. Accumulation of galactose-1 phosphate in the galactosemic fetus despite maternal milk avoidance. J Pediatr. 1985;107:261.
Janecke A.R., Dertinger S., Ketelsen U.P., et al. Neonatal type IV glycogen storage disease associated with “null” mutations in glycogen branching enzyme 1. J Pediatr. 2004;145(5):705-709.
Janecke A.R., Mayatepek E., Utermann G. Molecular genetics of type 1 glycogen storage disease. Mol Genet Metab. 2001;73:117-125.
Jehenson P., Duboch D., Bloch G., et al. Diagnosis of muscular glycogenosis by in vivo natural abundance 13-C NMR spectroscopy. Neuromuscul Disord. 1991;1:99.
Jinks D.C., Vollmer D., Orfanos A., et al. An evaluation of a new test kit to screen for galactosemia. Clin Biochem. 1987;20:353.
Jubiz W., Rallison M.L. Diphenylhydantoin treatment of glycogen storage disease. Arch Intern Med. 1974;134:418.
Kaji M., Kurokawa K., Hasegawa T., et al. A case of Costello syndrome and glycogen storage disease type III. J Med Genet. 2002;39:E8.
Kalaydjieva L., Perez-Lezaun A., Angelicheva D., et al. A founder mutation in the GK1 gene is responsible for galactokinase deficiency in Roma (Gypsies). Am J Hum Genet. 1999;65:1299.
Kanno T., Sudo K., Maekawa M., et al. Lactate dehydrogenase M-subunit deficiency: A new type of hereditary exertional myopathy. Clin Chim Acta. 1988;173:89.
Kasahara M., Horikawa R., Sakamoto S., et al. Living donor liver transplantation for glycogen storage disease type Ib. Liver Transpl. 2009;15:1867-1871.
Kaufmann U., Froesch E.R. Inhibition of phosphorylase-a by fructose-1-phosphate, a-glycerophosphate and fructose-1,6-diphosphate: Explanation for fructose-induced hypoglycaemia in hereditary fructose intolerance and fructose-1,6-diphosphatase deficiency. Eur J Clin Invest. 1973;3:407.
Kikawa Y., Shin Y.S., Inuzuka M., et al. Diagnosis of fructose-1,6-bisphosphatase deficiency using cultured lymphocyte fraction: A secure and noninvasive alternative to liver biopsy. J Inherit Metab Dis. 2002;25:41.
Kim K.O., et al. An adult case of glycogen storage disease type IIIa. Korean J Hepatol. 2008;14(2):219-225.
Klein C.J., Boes C.J., Chapin J.E., et al. Adult polyglucosan body disease: Case description of an expanding genetic and clinical syndrome. Muscle Nerve. 2004;29:323.
Koeberl D.D., Kishnani P.S., Chen Y.T. Glycogen storage disease types I and II: treatment updates. J Inherit Metab Dis. 2007;30:159-164.
Koster J.F., Slee R.G., Jennekens F.G.I., et al. McArdle’s disease: A study on the molecular basis of two different etiologies of myophosphorylase deficiency. Clin Chem Acta. 1979;94:229.
Krishnamurthy V., Eschrich K., Boney A., et al. Three successful pregnancies through dietary management of fructose-1,6-bisphosphatase deficiency. J Inherit Metab Dis. 2007;30:819.
Kroos M.A., Kirschner J., Gellerich F.N., et al. A case of childhood Pompe disease demonstrating phenotypic variability of p.Asp645Asn. Neuromuscul Disord. 2004;14:371.
Kullberg-Lindh C., Hannoun C., Lindh M. Simple method for detection of mutations causing hereditary fructose intolerance. J Inherit Metab Dis. 2002;25:571.
Kuo W.L., Hirschhorn R., Huie M.L., et al. Localization and ordering of acid alpha-glucosidase (GAA) and thymidine kinase (TK1) by fluorescence in situ hybridization. Hum Genet. 1996;97:404.
Labrune P. Glycogen storage disease type I: Indications for liver and/or kidney transplantation. Eur J Pediatr. 2002;161(Suppl 1):S53.
Labrune P., Chatelon S., Huguet P., et al. Unusual cerebral manifestations in hereditary fructose intolerance. Arch Neurol. 1990;47:1243.
Lai K., Elsas L.J. Structure-function analyses of a common mutation in blacks with transferase-deficiency galactosemia. Mol Genet Metab. 2001;74:264-272.
Lai K., Elsas L.J., Wierenga K.J. Galactose toxicity in animals. IUBMB Life. 2009;61:1063-1074.
Lai K., Langley S.D., Dembure P.P., et al. Duarte allele impairs biostability of galactose-1-phosphate uridyltransferase in human lymphoblasts. Hum Mutat. 1998;11:28.
Lam C.W., Lee A.T., Lam Y.Y., et al. DNA-based subtyping of glycogen storage disease type III: Mutation and haplotype analysis of the AGL gene in Chinese. Mol Genet Metab. 2004;83:271.
Lamperti C., Salani S., Lucchiari S., et al. Neuropathological study of skeletal muscle, heart, liver, and brain in a neonatal form of glycogen storage disease type IV associated with a new mutation in GBE1 gene. J Inherit Metab Dis. 2009. Apr 8. [Epub ahead of print] DOI:10.1007/s10545-009-1134-8
Layzer R.B., Rowland L.P., Lanney H.M. Muscle phosphofructokinase deficiency. Arch Neurol. 1967;17:512.
Leathwood P., Ryman B. Enzymes of glycogen metabolism in human skin with particular reference to differential diagnosis of the glycogen storage disease. Clin Sci. 1971;40:261.
Lebo R.V., Anderson L.A., DiMauro S., et al. Rare McArdle disease locus polymorphic site on 11q13 contains CpG sequence. Hum Genet. 1990;86:17.
Lee P. Glycogen storage disease type I: Pathophysiology of liver adenomas. Eur J Pediatr. 2002;161(Suppl 1):S46.
Lee P.J., Lilburn M., Wendel U., et al. A woman with untreated galactosaemia. Lancet. 2003;362(9382):446.
Lee R.T., Peterson C.L., Calman A.F., et al. Cloning of a human galactokinase gene (GK2) on chromosome 15 by complementation in yeast. Proc Natl Acad Sci USA. 1992;89:10887.
Legum C.P., Nitowsky H.M. Studies on leukocyte brancher enzyme activity in a family with type IV glycogenosis. J Pediatr. 1969;74:84.
Lemonnier F., Delhotal-Landes B., Couturier M., et al. Comparative use of glucose and fructose in cultured fibroblasts from patients with hereditary fructose intolerance. J Inherit Metab Dis. 1987;10:52.
Levy H.L., Sepe S.J., Shih V.E., et al. Sepsis due to Escherichia coli in neonates with galactosemia. N Engl J Med. 1977;297:823.
Levy H.L., Sepe S.J., Walton D.S., et al. Galactose-1-phosphate uridyl transferase deficiency due to Duarte-galactosemia combined variation: Clinical and biochemical studies. J Pediatr. 1978;92:390.
L’herminé-Coulomb A., Beuzen F., Bouvier R., et al. Fetal type IV glycogen storage disease: clinical, enzymatic, and genetic data of a pure muscular form with variable and early antenatal manifestations in the same family. Am J Med Genet A. 2005;139A(2):118-122.
Li S.C., Chen C.M., Goldstein J.L., et al. Glycogen storage disease type IV: novel mutations and molecular characterization of a heterogeneous disorder. J Inherit Metab Dis. 2010. Jan 8. [Epub ahead of print] DOI:10.1007/s10545-009-9026-5
Lockwood D., et al. Insulin secretion in type I glycogen storage disease. Diabetes. 1969;18:756.
Lossos A., Barash V., Soffer D., et al. Hereditary branching enzyme dysfunction in adult polyglucosan body disease: A possible metabolic cause in two patients. Ann Neurol. 1991;30:655.
Lucchiari S., Donati M.A., Melis D., et al. Mutational analysis of the AGL gene: Five novel mutations in GSD III patients. Hum Mutat. 2003;22:337.
Lucchiari S., Fogh I., Prelle A., et al. Clinical and genetic variability of glycogen storage disease type IIIa: Seven novel AGL gene mutations in the Mediterranean area. Am J Med Genet. 2002;109:183.
Ludwig M., Wolfson S., Rennert O. Glycogen storage disease type VIII. Arch Dis Child. 1972;47:830.
Maaswinkel-Moody P.D., Poorthuis B.J., van Gelderen H.H., et al. Dicarboxylicaciduria and secondary carnitine deficiency in glycogenosis type IV. Arch Dis Child. 1987;62:1066.
Maceratesi P., Daude N., Dallapiccola B., et al. Human UDP-galactose 4′-epimerase (GALE) gene and identification of five missense mutations in patients with epimerase-deficiency galactosemia. Mol Genet Metab. 1998;63:26.
Madlom M., Besley G.T., Cohen P.T. Phosphorylase b kinase deficiency in a boy with glycogenosis affecting both liver and muscle. Eur J Pediatr. 1989;149:52.
Maekawa M., Sudo K., Kanno T., et al. A novel deletion mutation of lactate dehydrogenase A(M) gene in fifth family with the enzyme deficiency. Hum Mol Genet. 1994;3:825.
Maire I., Baussan C., Moatti N., et al. Biochemical diagnosis of hepatic glycogen storage diseases: 20 years French experience. Clin Biochem. 1991;24:169.
Malatack J.J., Finegold D.N., Iwatsuki S., et al. Liver transplantation for type I glycogen storage disease. Lancet. 1983;1:1073.
Mancuso M., Filosto M., Tsujino S., et al. Muscle glycogenosis and mitochondrial hepatopathy in an infant with mutations in both the myophosphorylase and deoxyguanosine kinase genes. Arch Neurol. 2003;60:1445.
Manis F.R., Cohn L.B., McBride-Chang C., et al. A longitudinal study of cognitive functioning in patients with classical galactosaemia, including a cohort treated with oral uridine. J Inherit Metab Dis. 1997;20:549.
Martiniuk F., Bodkin M., Tzall S., et al. Isolation and partial characterization of the structural gene for human acid alpha glucosidase. DNA Cell Biol. 1991;10:283.
Martiniuk F., Ellenbogen A., Hirschhorn K., et al. Further regional localization of the genes for human acid alpha glucosidase (GAA), peptidase D (PEPD), and alpha mannosidase B (MANB) by somatic cell hybridization. Hum Genet. 1985;69:109.
Martiniuk F., Mehler M., Pellicer A. Isolation of a cDNA for human acid alpha-glucosidase and detection of genetic heterogeneity for mRNA in three alpha-glucosidase-deficient patients. Proc Natl Acad Sci USA. 1986;83:9641.
Martinuzzi A., Sartori E., Fanin M., et al. Phenotype modulators in myophosphorylase deficiency. Ann Neurol. 2003;53:497.
Matern D., Seydewitz H.H., Bali D., et al. Glycogen storage disease type I: Diagnosis and phenotype/genotype correlation. Eur J Pediatr. 2002;161(Suppl 1):S10-S19.
McArdle B. Myopathy due to a defect in muscle glycogen breakdown. Clin Sci. 1951;10:13.
McConchie S.M., Coakley J., Edwards R.H., et al. Molecular heterogeneity in McArdle’s disease. Biochim Biophys Acta. 1990;1096:26.
McMaster K.R., Powers J.M., Hennigar G.R., et al. Nervous system involvement in type IV glycogenosis. Arch Pathol Lab Med. 1979;103:105.
Melis D., Parenti G., Della Casa R., et al. Brain damage in glycogen storage disease type I. J Pediatr. 2004;144:637.
Mercier C., Whelan W. The fine structure of glycogen from type IV glycogen-storage disease. Eur J Biochem. 1970;16:579.
Miller C., Alleyne G., Brooks S. Gross cardiac involvement in glycogen storage disease type III. Br Heart J. 1972;34:862.
Milstein J.M., Herron T.M., Haas J.E. Fatal infantile muscle phosphorylase deficiency. J Child Neurol. 1989;4:186.
Mineo I., Kono N., Hara N. Myogenic hyperuricemia. A common pathophysiologic feature of glycogenosis types III, V, and VII. N Engl J Med. 1987;317:75.
Miranda A.F., Nette E.G., Hartlage P.L., et al. Phosphorylase isoenzymes in normal and myophosphorylase-deficient human heart. Neurology. 1979;29:1538.
Momoi T., Sano H., Yamanaka C., et al. Glycogen storage disease type III with muscle involvement: Reappraisal of phenotypic variability and prognosis. Am J Med Genet. 1992;42:696.
Moses S.W. Historical highlights and unsolved problems in glycogen storage disease type 1. Eur J Pediatr. 2002;161(Suppl 1):S2-S9.
Moses S.W., Parvari R. The variable presentations of glycogen storage disease type IV: A review of clinical, enzymatic and molecular studies. Curr Mol Med. 2002;2:177.
Moses S.W., Wanderman K.L., Myroz A., et al. Cardiac involvement in glycogen storage disease type III. Eur J Pediatr. 1989;148:764.
Mulhern M.L., Madson C.J., Danford A., et al. The unfolded protein response in lens epithelial cells from galactosemic rat lenses. Invest Ophthalmol Vis Sci. 2006;47:3951-3959.
Muraca M., Gerunda G., Neri D., et al. Hepatocyte transplantation as a treatment for glycogen storage disease type 1a. Lancet. 2002;359:317-318.
Murata M., Ohta N., Sakurai S., et al. The role of aldose reductase in sugar cataract formation: Aldose reductase plays a key role in lens epithelial cell death (apoptosis). Chem Biol Interact. 2001;130–132:617.
Naini A., Toscano A., Musumeci O., et al. Muscle phosphoglycerate mutase deficiency revisited. Arch Neurol. 2009;66:394-398.
Nakai A., Shigematsu Y., Takano T., et al. Uncooked cornstarch treatment for hepatic phosphorylase kinase deficiency. Eur J Pediatr. 1994;153:581.
Nakajima H., Raben N., Hamaguchi T., et al. Phosphofructokinase deficiency: Past, present and future. Curr Mol Med. 2002;2:197.
Nakashima H., Suo H., Ochiai J., et al. A case of adult onset phosphoglucomutase deficiency. Rinsho Shinkeigaku. 1992;32:42.
Nambu M., Kawabe K., Fukuda T., et al. A neonatal form of glycogen storage disease type IV. Neurology. 2003;61:392.
Nelson M.D.Jr, Wolff J.A., Cross C.A., et al. Galactosemia: Evaluation with MR imaging. Radiology. 1992;184:255.
Neustein H.B. Fine structure of skeletal muscle in type III glycogenosis. Arch Pathol. 1969;88:130.
Newgard C.B., Fletterick R.J., Anderson L.A., et al. The polymorphic locus for glycogen storage disease VI (liver glycogen phosphorylase) maps to chromosome 14. Am J Hum Genet. 1987;40:351.
Ng W.G., Bergren W.R., Donnell G.N. A new variant of galactose-1-phosphate uridyl transferase in man: The Los Angeles variant. Ann Hum Genet. 1973;37:1.
Niinaka Y., Paku S., Haga A., et al. Expression and secretion of neuroleukin/phosphohexose isomerase/maturation factor as autocrine motility factor by tumor cells. Cancer Res. 1998;58:2667.
Nishino I., Fu J., Tanji K., et al. Primary LAMP-2 deficiency causes X-linked vacuolar cardiomyopathy and myopathy (Danon disease). Nature. 2000;406:906.
Nitzan O., Saliba W.R., Goldstein L.H., et al. Fructose-1,6-diphosphatase deficiency: a rare cause of prolonged prothrombin time. Ann Hematol. 2004;83:302-303.
Oki Y., Okubo M., Tanaka S., et al. Diabetes mellitus secondary to glycogen storage disease type III. Diabet Med. 2000;17:810.
Openo K.K., Schulz J.M., Vargas C.A., et al. Epimerase-deficiency galactosemia is not a binary condition. Am J Hum Genet. 2006;78:89-102.
Ounap K., Joost K., Temberg T., et al. Classical galactosemia in Estonia: selective neonatal screening, incidence, and genotype/phenotype data of diagnosed patients. Epub February 12 J Inherit Metab Dis. 2010. DOI:10.1007/s10545-010-9045-2
Ozen H. Glycogen storage diseases: new perspectives. World J Gastroenterol. 2007;13:2541-2553.
Papapetropoulos T., Paschalis C., Manda P. Myopathy due to juvenile acid maltase deficiency affecting exclusively the type-I fibers. J Neurol Neurosurg Psychiatry. 1984;47:213.
Park H.K., Kahler S.G., Chen Y.T. Brain abscess in glycogen storage disease type Ib. Acta Paediatr Scand. 1991;80:1103.
Park H.K., Kay H.H., McConkie-Rossell A., et al. Prenatal diagnosis of Pompe’s disease (type II glycogenosis) in chorionic villus biopsy using maltose as a substrate. Prenat Diagn. 1992;12:169.
Pearson C.M. Glycogen metabolism and storage disease of types III, IV, and V. Am J Clin Pathol. 1968;50:29.
Pearson C.M., Rimer D.G., Mommaerts W.F.H.M. A metabolic myopathy due to absence of muscle phosphorylase. Am J Med. 1961;30:502.
Pillarisetti J., Ahmed A. McArdle disease presenting as acute renal failure. South Med J. 2007;100(3):313-316.
Pompé J.C. Over idiopatische hypertrophy van het hart. Ned Tijdschr Geneeskd. 1932;76:304.
Potter N.L., Lazarus J.A., Johnson J.M., et al. Correlates of language impairment in children with galactosaemia. J Inherit Metab Dis. 2008;31:524-532.
Powell K.K., Van Naarden Braun K., Singh R.H., et al. Long-term speech and language developmental issues among children with Duarte galactosemia. Genet Med. 2009;11:874-879.
Quimby B.B., Alano A., Almashanu S., et al. Characterization of two mutations associated with epimerase-deficiency galactosemia, by use of a yeast expression system for human UDP-galactose-4-epimerase. Am J Hum Genet. 1997;61:590.
Quinlivan R., Beynon R.J. Pharmacological and nutritional treatment for McArdle’s disease (glycogen storage disease type V). Cochrane Database Syst Rev. (3):2004. CD003458
Quintana E., Sturiale L., Montero R., et al. Secondary disorders of glycosylation in inborn errors of fructose metabolism. Epub online September 20 J Inherit Metab Dis. 2009. DOI: 10.1007/s10545-009-1219-4
Raben N., Baum R., Schreiner C., et al. When more is less: excess and deficiency of autophagy coexist in skeletal muscle in Pompe disease. Autophagy. 2009;5:111-113.
Raben N., Sherman J.B. Mutations in muscle phosphofructokinase gene. Hum Mutat. 1995;6:1.
Ratinov G., Baker W.P., Swaiman K.F. McArdle’s syndrome with previously unreported electrocardiographic and serum enzyme abnormalities. Ann Intern Med. 1965;62:328.
Reichardt J.K. Molecular analysis of 11 galactosemia patients. Nucleic Acids Res. 1991;19:7049.
Reichardt J.K., Belmont J.W., Levy H.L., et al. Characterization of two missense mutations in human galactose-1-phosphate uridyltransferase: Different molecular mechanisms for galactosemia. Genomics. 1992;12:596.
Rennert O.M., Greer M. Hereditary fructosemia. Neurology. 1970;20:421.
Rennert O.M., Mukhopadhyay D. Diazoxide in von Gierke’s disease. Arch Dis Child. 1968;43:358.
Reusche E., Aksu F., Goebel H.H., et al. A mild juvenile variant of type IV glycogenosis. Brain Dev. 1992;14:36.
Reuser A.J., Van Den Hout H., Bijvoet A.G., et al. Enzyme therapy for Pompe disease: From science to industrial enterprise. Eur J Pediatr. 2002;161(Suppl 1):S106-S111.
Ridel K.R., Leslie N.D., Gilbert D.L. An updated review of the long-term neurological effects of galactosemia. Pediatr Neurol. 2005;33:153-161.
Ristow M., Vorgerd M., Mohlig M., et al. Deficiency of phosphofructo-1-kinase/muscle subtype in humans impairs insulin secretion and causes insulin resistance. J Clin Invest. 1997;100:2833.
Roelofs R., Engel W., Chauvin P. Histochemical phosphorylase activity in regenerating muscle fibers from myophosphorylase-deficient patients. Science. 1972;177:795.
Roe T.F., Coates T.D., Thomas D.W., et al. Brief report: Treatment of chronic inflammatory bowel disease in glycogen storage disease type Ib with colony-stimulating factors. N Engl J Med. 1992;326:1666.
Rogers S., Heidenreich R., Mallee J., et al. Regional activity of galactose-1-phosphate uridyltransferase in rat brain. Pediatr Res. 1992;31:512.
Rowland L.P., Fah S., Schotland D.L. McArdle’s disease. Arch Neurol. 1963;9:325.
Rubio J.C., Gomez-Gallego F., Santiago C., et al. Genotype modulators of clinical severity in McArdle disease. Neurosci Lett. 2007;422:217-222.
Ruttenberg H.D., Steidl R.M., Carey L.S., et al. Glycogen-storage disease of the heart: Hemodynamic and angiocardiographic features in two cases. Am Heart J. 1964;67:469.
Sadeghi-Nejad A., Hochman H., Senior B. Studies on type I glycogenosis: The paradoxical effect of ethanol on lactate. J Pediatr. 1975;86:37.
Sadeghi-Nejad A., Loridan L., Senior B. Studies of factors affecting gluconeogenesis and glycolysis in glycogenoses of the liver. J Pediatr. 1970;76:561.
Sancho S., Navarro C., Fernandez J.M., et al. Skin biopsy findings in glycogenosis III: Clinical, biochemical, and electrophysiological correlations. Ann Neurol. 1990;27:480.
Sangiuolo F., Magnani M., Stambolian D., et al. Biochemical characterization of two GALK1 mutations in patients with galactokinase deficiency. Hum Mutat. 2004;23:396.
Santer R., Rischewski J., von Weihe M., et al. The spectrum of aldolase B (ALDOB) mutations and the prevalence of hereditary fructose intolerance in Central Europe. Hum Mutat. 2005;25:594.
Sardharwalla I.B., Wraith J.E., Bridge C., et al. A patient with severe type of epimerase deficiency galactosemias. J Inherit Metab Dis. 1988;11(Suppl 2):249.
Satoyoshi E., Kowa H. A myopathy due to glycolytic abnormality. Arch Neurol. 1967;17:248.
Schadewaldt P., Hoffmann B., Hammen H.W., et al. Longitudinal assessment of intellectual achievement in patients with classical galactosemia. Pediatrics. 2010;125(2):e374-e381. Epub 2010 Jan 25
Schaller M., Burton D.R., Ditzel H.J. Autoantibodies to GPI in rheumatoid arthritis: Linkage between an animal model and human disease. Nat Immun. 2001;2:746.
Schapira F., Kaplan J.C. Electrophoretic abnormality of galactose-1-phosphate uridyl transferase in galactosemia. Biochem Biophys Res Commun. 1969;35:451.
Scheepers A., Joost H.G., Schurmann A. The glucose transporter families SGLT and GLUT: Molecular basis of normal and aberrant function. JPEN J Parenter Enteral Nutr. 2004;28:364.
Schimke R., Zakheim R., Corder R., et al. Glycogen storage disease type IX: Benign glycogenosis of liver and hepatic phosphorylase kinase deficiency. J Pediatr. 1973;83:1031.
Schmid R., Hammaker L. Hereditary absence of muscle phosphorylase (McArdle’s syndrome). N Engl J Med. 1961;264:223.
Schmid R., Mahler R. Chronic progressive myopathy with myoglobinuria: Demonstration of a glycogenolytic defect in the muscle. J Clin Invest. 1959;38:2044.
Schmidt B., Servidei S., Gabbai A.A., et al. McArdle’s disease in two generations: Autosomal recessive transmission with manifesting heterozygote. Neurology. 1987;37:1558.
Schoser B., Hill V., Raben N. Therapeutic approaches in glycogen storage disease type II/Pompe Disease. Neurotherapeutics. 2008;5:569-578.
Schroers A., Kley R.A., Stachon A., et al. Gentamicin treatment in McArdle disease: failure to correct myophosphorylase deficiency. Neurology. 2006;66(2):285-286.
Schroter W., Eber S.W., Bardosi A., et al. Generalised glucosephosphate isomerase (GPI) deficiency causing haemolytic anaemia, neuromuscular symptoms and impairment of granulocytic function: A new syndrome due to a new stable GPI variant with diminished specific activity (GPI Homburg). Eur J Pediatr. 1985;144:301.
Schulpis K., Papakonstantinou E.D., Michelakakis H., et al. Screening for galactosaemia in Greece. Paediatr Perinat Epidemiol. 1997;11:436.
Schweitzer-Krantz S. Early diagnosis of inherited metabolic disorders towards improving outcome: The controversial issue of galactosaemia. Eur J Pediatr. 2003;162(Suppl 1):S50-S53.
Segal S. Another aspect of the galactosemia enigma. Mol Genet Metab. 2004;81:253.
Segal S., Rogers S. Regulation of galactose metabolism: Implications for therapy. J Inherit Metab Dis. 1990;13:487.
Seifert B.L., Snyder M.S., Klein A.A., et al. Development of obstruction to ventricular outflow and impairment of inflow in glycogen storage disease of the heart: Serial echocardiographic studies from birth to death at 6 months. Am Heart J. 1992;123:239.
Selby R., Starzl T.E., Yunis E., et al. Liver transplantation for type IV glycogen storage disease [see comments]. N Engl J Med. 1991;324:39.
Sellick C.A., Campbell R.N., Reece R.J. Galactose metabolism in yeast-structure and regulation of the Leloir pathway enzymes and the genes encoding them. Int Rev Cell Mol Biol. 2008;269:111-150.
Senior B., Loridan L. Functional differentiation of glycogenosis of the liver with respect to the use of glycerol. N Engl J Med. 1968;279:965.
Servidei S., Bonilla E., Diedrich R.G., et al. Fatal infantile form of muscle phosphofructokinase deficiency. Neurology. 1986;36:1465.
Servidei S., Riepe R.E., Langston C., et al. Severe cardiopathy in branching enzyme deficiency. J Pediatr. 1987;111:51.
Shah P.A., Kuchhai F.A. Galactosemia with chorea–an unusual presentation. Indian J Pediatr. 2009;76:97-98.
Shea L., Raben N. Autophagy in skeletal muscle: implications for Pompe disease. Int J Clin Pharmacol Ther. 2009;47(Suppl 1):S42-S47.
Shen J., Liu H.M., Bao Y., et al. Polymorphic markers of the glycogen debranching enzyme gene allowing linkage analysis in families with glycogen storage disease type III. J Med Genet. 1997;34:34.
Shih L.Y., Suslak L., Rosin I., et al. Gene dosage studies supporting localization of the structural gene for galactose-1-phosphate uridyl transferase (GALT) to band p13 of chromosome 9. Am J Med Genet. 1984;19:539.
Shin Y.S., Moro V., Doliwa H., et al. A radioisotopic method for fructose-1-phosphate aldolase assay that facilitates diagnosis of hereditary fructose intolerance. Clin Chem. 1983;29:1955.
Siciliano M., De Candia E., Ballarin S., et al. Hepatocellular carcinoma complicating liver cirrhosis in type IIIa glycogen storage disease. J Clin Gastroenterol. 2000;31:80.
Sidbury J.B.Jr, Mason J., Burns W.B.Jr, et al. Type IV glycogenosis: Report of a case proven by characterization of glycogen and studied at necropsy. Johns Hopkins Med J. 1962;111:157.
Sivakumar K., Vasconcelos O., Goldfarb L., et al. Late-onset muscle weakness in partial phosphofructokinase deficiency: A unique myopathy with vacuoles, abnormal mitochondria, and absence of the common exon 5/intron 5 junction point mutation. Neurology. 1996;46:1337. Comment in Neurology 49:899, 1997]
Slonim A.E., Bulone L., Ritz S., et al. Identification of two subtypes of infantile acid maltase deficiency. J Pediatr. 2000;137:283.
Smith H., Amick L.D., Sidbury J. Type II glycogenosis. Am J Dis Child. 1966;11:475.
Smith J., Zellweger H., Afifi A.K. Muscular form of glycogenosis type II (Pompe): Report of a case with unusual features. Neurology. 1967;17:537.
Sokal E.M., Van Hoof F., Alberti D., et al. Progressive cardiac failure following orthotopic liver transplantation for type IV glycogenosis. Eur J Pediatr. 1992;151:200.
Spiegel R., Rakover-Tenenbaum Y., Mandel H., et al. Secondary diabetes mellitus: late complication of glycogen storage disease type 1b. J Pediatr Endocrinol Metab. 2005;18:617-619.
Spycher M.A., Gitzelmann R. Glycogenosis type I: Ultrastructural alterations of hepatocytes in a tumor-bearing liver. Virchows Arch Abt B Zellpathol. 1971;8:133.
Sugie H., Kobayashi J., Sugie Y., et al. Infantile muscle glycogen storage disease: Phosphoglucomutase deficiency with decreased muscle and serum carnitine levels. Neurology. 1988;38:602.
Sugie K., Yamamoto A., Murayama K., et al. Clinicopathological features of genetically confirmed Danon disease. Neurology. 2002;58:1773.
Swift T.R., Brown M. Tc-99m pyrophosphate muscle labeling in McArdle’s syndrome. J Nucl Med. 1978;19:295.
Tachi N., Tachi M., Sasaki K., et al. Glycogen storage disease with normal acid maltase: Skeletal and cardiac muscles. Pediatr Neurol. 1989;5:60.
Tager J.M., Oude Elferink R.P., Reuser A., et al. a-Glucosidase deficiency (Pompe’s disease). Enzyme. 1987;38:280.
Takamura Y., Kubo E., Tsuzuki S., et al. Apoptotic cell death in the lens epithelium of rat sugar cataract. Exp Eye Res. 2003;77:51.
Tanaka K., Shimazu S., Oya N., et al. Muscular form of glycogenosis type II (Pompe’s disease). Pediatrics. 1979;63:124.
Tang N.L., Hui J., Young E., et al. A novel mutation (G233D) in the glycogen phosphorylase gene in a patient with hepatic glycogen storage disease and residual enzyme activity. Mol Genet Metab. 2003;79:142.
Tarnopolsky M.A. Clinical use of creatine in neuromuscular and neurometabolic disorders. Subcell Biochem. 2007;46:183-204.
Tarui S., Okuno G., Ikura Y., et al. Phosphofructokinase deficiency in skeletal muscle: A new type of glycogenosis. Biochem Biophys Res Commun. 1965;19:517.
Taylor R.G., Lieberman J.S., Portwood M.M. Ischemic exercise test: Failure to detect partial expression of McArdle’s disease. Muscle Nerve. 1987;10:546.
Thomson W.H.S., MacLaurin J.C., Prineas J.W. Skeletal muscle glycogenosis: An investigation of two dissimilar cases. J Neurol Neurosurg Psychiatry. 1963;26:60.
Thon V.J., Khalil M., Cannon J.F. Isolation of human glycogen branching enzyme cDNAs by screening complementation in yeast. J Biol Chem. 1993;268:7509.
Tonin P., Shanske S., Miranda A.F., et al. Phosphoglycerate kinase deficiency: Biochemical and molecular genetic studies in a new myopathic variant (PGK Alberta). Neurology. 1993;43:387.
Toscano A., Musumeci O. Tarui disease and distal glycogenoses: clinical and genetic update. Acta Myol. 2007;26:105-107.
Tsuji A., Yang R.C., Omura K. A simple differential immunoprecipitation assay of urinary acid and neutral alpha-glucosidases for glycogenosis II. Clin Chim Acta. 1987;167:313.
Tsujino S., Shanske S., Brownell A.K., et al. Molecular genetic studies of muscle lactate dehydrogenase deficiency in white patients. Ann Neurol. 1994;36:661.
Tsujino S., Shanske S., Sakoda S., et al. The molecular genetic basis of muscle phosphoglycerate mutase (PGAM) deficiency. Am J Hum Genet. 1993;52:472.
van Creveld S., Huijing F. Glycogen storage disease. Am J Med. 1965;38:554.
Van den Hout H.M.P., Hop W., van Diggelen O.P., et al. The natural course of infantile Pompe’s disease: 20 original cases compared with 133 cases from the literature. Pediatrics. 2003;112:332.
Van Hoof F. Amylo-1, 6-glucosidase activity and glycogen content of the erythrocytes of normal subjects, patients with glycogen storage disease and heterozygotes. Eur J Biochem. 1967;2:271.
Van Hoof F., Hers H.G. The subgroups of type III glycogenosis. Eur J Biochem. 1967;2:265.
Verity M.A. Infantile Pompe’s disease, lipid storage, and partial carnitine deficiency. Muscle Nerve. 1991;14:435.
Viskoper R.J., Wolf E., Chaco J., et al. McArdle’s syndrome: The reaction to a fat-rich diet. Am J Med Sci. 1975;269:217.
Visser G., Rake J.P., Labrune P., et al. Granulocyte colony-stimulating factor in glycogen storage disease type 1b. Results of the European Study on Glycogen Storage Disease Type 1. Eur J Pediatr. 2002;161(Suppl 1):S83.
Vissing J., Haller R.G. A diagnostic cycle test for McArdle’s disease. Ann Neurol. 2003;54:539.
Vissing J., Haller R.G. The effect of oral sucrose on exercise tolerance in patients with McArdle’s disease. N Engl J Med. 2003;349:2503.
Vissing J., Schmalbruch H., Haller R.G., et al. Muscle phosphoglycerate mutase deficiency with tubular aggregates: Effect of dantrolene. Ann Neurol. 1999;46:274.
Vora S., Corash L., Engel W.K., et al. The molecular mechanism of the inherited phosphofructokinase deficiency associated with hemolysis and myopathy. Blood. 1980;55:629.
Vora S., DiMauro S., Spear D., et al. Characterization of the enzymatic defect in late-onset muscle phosphofructokinase deficiency. New subtype of glycogen storage disease type VII. J Clin Invest. 1987;80:1479.
Vorgerd M., Kubisch C., Burwinkel B., et al. Mutation analysis in myophosphorylase deficiency (McArdle’s disease). Ann Neurol. 1998;43:326.
Walker A.R., Tschetter K., Matsuo F., et al. Phenotype modulators in myophosphorylase deficiency. Ann Neurol. 2003;53:497.
Walker J.I.H., Morgan M.J., Faik P. Structure and organization of the human glucose phosphate isomerase gene (GPI). Genomics. 1995;29:261.
Wallis P.G., Sidbury J.B.Jr, Harris R.C. Hepatic phosphorylase defect. Am J Dis Child. 1966;111:278.
Walter J.H., Roberts R.E., Besley G.T., et al. Generalised uridine diphosphate galactose-4-epimerase deficiency. Arch Dis Child. 1999;80:374.
Webb A.L., Singh R.H., Kennedy M.J., et al. Verbal dyspraxia and galactosemia. Pediatr Res. 2003;53:396.
Weinstein D.A., Wolfsdorf J.I. Effect of continuous glucose therapy with uncooked cornstarch on the long-term clinical course of type 1a glycogen storage disease. Eur J Pediatr. 2002;161(Suppl 1):S35-S39.
Welch R.J., Milligan D.W. Cerebral edema and galactosemia. Letter to the editor. Pediatrics. 1987;80:597.
Widhalm K., Miranda da Cruz B.D., Koch M. Diet does not ensure normal development in galactosemia [see comments]. J Am Coll Nutr. 1997;16:204. [Comment in J Am Coll Nutr 16:190, 1997]
Winkel L.P., Van den Hout J.M., Kamphoven J.H., et al. Enzyme replacement therapy in late-onset Pompe’s disease: A three-year follow-up. Ann Neurol. 2004;55:495.
Wokke J.H.J., Ausems M.G.E.M., van den Boogaard M-JH, et al. Genotype-phenotype correlation in adult-onset acid maltase deficiency. Ann Neurol. 1995;38:450.
Wolfsdorf J.I., Plotkin R.A., Laffel L.M., et al. Continuous glucose for treatment of patients with type 1 glycogen-storage disease: Comparison of the effects of dextrose and uncooked cornstarch on biochemical variables. Am J Clin Nutr. 1990;52:1043.
Xu Y.K., Ng W.G., Kaufman F.R., et al. Uridine nucleotide sugars in erythrocytes of patients with galactokinase deficiency. J Inherit Metab Dis. 1989;12:445.
Yang B.Z., Ding J.H., Brown B.I. Definitive prenatal diagnosis of type III glycogen storage disease. Am J Hum Genet. 1990;47:735.
Yang-Feng T.L., Zheng K., Yu J., et al. Assignment of the human glycogen debrancher gene to chromosome 1p21. Genomics. 1992;13:931.
Zellweger H., et al. Glycogenosis. IV. A new cause of infantile hypotonia. J Pediatr. 1972;80:842.
Zhong N., Martiniuk F., Tzall S., et al. Identification of a missense mutation in one allele of a patient with Pompe disease, and use of endonuclease digestion of PCR-amplified RNA to demonstrate lack of mRNA expression from the second allele. Am J Hum Genet. 1991;49:635.
