Diabetic Nephropathy
Natural History of Diabetic Nephropathy
Structural-Functional Relationships in Diabetic Nephropathy
Microalbuminuria and Renal Structure
Contrasts in Nephropathy Lesions between Type 1 and Type 2 Diabetes
Structural-Functional Relationships in Type 2 Diabetes
Genetic Predisposition to Diabetic Nephropathy
Familial Studies of Blood Pressure, Cardiovascular Disease, and Diabetic Nephropathy
Pathogenesis of Diabetic Nephropathy
It is estimated that more than 500,000 Americans have end-stage renal disease (ESRD).1 In the United States, nearly half of patients entering ESRD programs in 2006 had diabetes (about 90% had type 2 diabetes).1 The much higher prevalence of type 2 diabetes accounts at least in part for the greater contribution of these patients to ESRD incidence. Diabetic nephropathy (DN) develops in 15% to 35% of type 1 diabetic patients, with a peak in the incidence around 15 to 20 years of diabetes.2 Studies in type 2 diabetic patients from Western Europe3 and in Pima Indians from Arizona4 show nephropathy rates similar to or higher than those of type 1 diabetic patients. There are data suggesting that the incidence of DN among patients with type 1 diabetes may be declining over time. Studies in Pima Indians showed a continuous increase in the incidence of proteinuria as well as an increase in the incidence of ESRD between 1967 and 1994, with a decline in the ESRD rates between 1995 and 2002.5 Studies from Sweden6 and Denmark7 reported a 50% to 60% decline in the incidence of proteinuria among patients with type 1 diabetes in the last decades. Thus, the cumulative incidence of proteinuria after 20 to 25 years of type 1 diabetes fell from about 30% in patients whose diabetes was diagnosed in the 1960s to about 13% in those whose diabetes was diagnosed after 1970. However, while the incidence of ESRD declined between 1998 and 2002 among patients with type 1 diabetes, it increased 5% per year among European and European-descent patients with type 2 diabetes.8 Moreover, after adjusting for population growth, the ESRD incidence in the United States is over 35% higher than a decade ago, and the explanation for this increase is unclear.9
The annual cost of caring for these patients in the United States alone exceeds $10 billion, accounting for more than 24% of Medicare costs. Moreover, costs can be 25% greater in ESRD patients with diabetes than in patients without diabetes.10 Once overt DN, manifested as proteinuria and decreased glomerular filtration rate (GFR), is present, ESRD can be postponed but in most instances not prevented by effective antihypertensive treatment11,12 or glycemic control.13 The mortality rate of patients with DN is high, and a marked increase in cardiovascular risk accounts for more than half of the increased mortality among these patients and for much of the 5-year survival rate of less than 20% among diabetic patients on chronic dialysis.
Natural History of Diabetic Nephropathy
For simplicity, the course of renal involvement in type 1 diabetes can be roughly divided into five stages (Table 28-1). Stage 1, present at diagnosis, is that of renal hypertrophy-hyperfunction. At this stage, patients at risk and not at risk of DN currently cannot be clearly separated. Genetic factors associated with predisposition to or protection from DN (see Genetic Predisposition) could, in the future, add to prediction of risk during this period. Although some studies14–17 and a recent meta-analysis18 suggest that the presence of GFR above the normal range (glomerular hyperfiltration) is a risk factor for DN, this remains controversial and does not fit with data showing that more than 65% of young type 1 diabetic subjects have increased GFR.19 Most studies addressing this issue evaluated cohorts of patients with average diabetes duration of a decade or so. In an inception cohort study of patients with adult-onset type 1 diabetes within 6 months of diabetes diagnosis, higher than normal levels of albumin excretion rate (AER), blood pressure, hemoglobin A1c, male sex, and shorter stature were significant independent (albeit imprecise) predictors of microalbuminuria development over 18 years of follow-up, while GFR was noncontributory. Stage 2 is characterized by the presence of glomerular lesions in patients with normal albumin excretion rate and normal blood pressure levels. Preliminary studies suggest that normoalbuminuric patients with more severe glomerular lesions are at increased risk of progression.20 Further, patients with type 1 diabetes, normoalbuminuric at baseline, with greater increase in DN lesions over the subsequent 5 years, have greater increases in AER over that time (Kukla, Caramori, and Mauer, unpublished observations). Decreased normal nocturnal blood pressure decline (dipping) and increased nocturnal systolic blood pressure in 24-hour blood pressure monitoring may be an early indicator of DN risk, preceding the development of persistent microalbuminuria.21 The presence of persistent microalbuminuria with at least 2 of 3 consecutive values between 20-200 µg/min for 30-300 mg/g of creative defines stage 3. This typically occurs after 5 or more years of type 1 diabetes, but microalbuminuria may be present earlier, particularly during adolescence and in patients with poor glycemic control and high-normal blood pressure levels, and may be more frequent and less prognostic in daytime urine samples due to postural proteinuria, especially in adolescents (Mauer, unpublished observations). Compared to normoalbuminuric patients, patients with persistent microalbuminuria are at three- to fourfold increased risk of progression to proteinuria and ESRD.22 Current studies indicate that about 20% to 45% of microalbuminuric type 1 diabetic patients will progress to proteinuria after about 10 years of follow-up, while 20% to 25% will return to normoalbuminuric levels, and the rest will remain microalbuminuric, at least over the subsequent 6 to 10 years.22–26 Of note, studies conducted 2 to 3 decades ago estimated that about 80% of type 1 diabetic microalbuminuric patients would progress to proteinuria over the next 10 years.27–29 The differences in progression rates may be related to overestimation of risk in these earlier small post hoc studies, differing definitions of microalbuminuria, improved prognosis due to advancements in treatment, or some combination of these factors. Alternatively, the natural history of DN may have changed over the past decades. At stage 3, glomerular lesions are generally more serious than in the previous ones. GFR is usually normal and stable or slowly declining during this stage, and recent data suggest that the subset with microalbuminuria and declining GFR may be at particularly high risk of progression.30 Blood pressure levels tend to increase, and hypertension is not uncommon. Some patients also have hypercholesterolemia and hypertriglyceridemia, along with increased fibrinogen, von Willebrand factor, and prorenin levels. Other microvascular (diabetic retinopathy and neuropathy) and macrovascular (coronary artery disease and stroke) complications are also more common. Stage 4 is defined by the presence of overt proteinuria [AER > 200 µg/min or 300 mg/24 hour or albumin/creatinine ratio (ACR) > 300 mg/g]. Proteinuria typically develops only after 10 to 20 years of type 1 diabetes. Patients with proteinuria at shorter type 1 diabetes duration deserve a clinical renal biopsy. However, microalbuminuria or proteinuria may be present at diagnosis in patients with type 2 diabetes where onset of diabetes may go undetected for many years or because the increased urinary protein is of another pathogenesis in patients with minimal or atypical DN lesions. GFR is often reduced, and hypertension and dyslipidemia are very common. Retinopathy and peripheral and autonomic neuropathy are present in most patients, and if retinopathy is absent, this should call the diagnosis of DN into question. The risk for cardiovascular events is extremely high, and asymptomatic myocardial ischemia is frequent. Without treatment, GFR declines about 14 mL/min/yr in type 1 diabetic patients with proteinuria and hypertension. Progression to ESRD (stage 5) will occur 5 to 15 years after the development of proteinuria.
Table 28-1
Stages of Diabetic Nephropathy
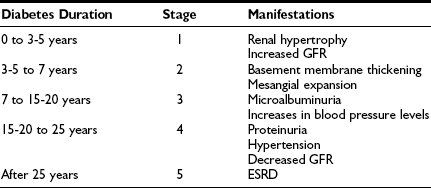
ESRD, End-stage renal disease; GFR, glomerular filtration rate.
Modified from Caramori ML, Mauer M: Pathogenesis and pathophysiology of diabetic nephropathy. In Greenberg A, Cheung AK, Coffman TM, et al (eds): Primer on kidney diseases, ed 4, Philadelphia, 2005, Saunders, pp 241–248.
Type 2 Diabetes
As already noted, diabetes duration is usually not precisely known. At diagnosis, about 10% of type 2 diabetic patients have nephropathy, 20% retinopathy, 70% hypertension, and 60% dyslipidemia. Interestingly, in studies of Pima Indians where type 2 diabetes onset is much more precisely known and the age of onset is much younger than in most other type 2 diabetes cohorts, the course of diabetic kidney disease is very similar to that of type 1 diabetic patients. Overall, in patients with type 1 and type 2 diabetes, the rate of progression from microalbuminuria to proteinuria is similar to that of type 1 diabetic patients, around 30% after 10 years of follow-up.31,32 Thus, the Steno 2 study reported that 31% of initially microalbuminuric type 2 diabetic patients progressed to proteinuria, while the same proportion (31%) of patients became normoalbuminuric, and 38% remained microalbuminuric after about 8 years of follow-up.32 Moreover, those who were normoalbuminuric at follow-up had a lower rate of GFR decline (2.3 mL/min/yr) compared to patients who remained microalbuminuric (3.7 mL/min/yr; P = 0.03) or who progressed to proteinuria (5.4 mL/min/yr; P < 0.001).32 GFR decline may be more variable in type 2 than in type 1 diabetes. Microalbuminuric type 2 diabetic patients with GFR decline usually have more advanced typical diabetic glomerulopathy lesions and worse metabolic control,33 while those with mild or atypical lesions have no significant GFR decline over nearly 5 years of follow-up. The above categories are general, and progression is highly variable and often nonlinear. The expression and natural history of these overlapping stages may be influenced by complex genetic, environmental, and treatment interactions that may greatly affect progression and outcome. Thus, the scheme presented here is only a useful general guide, but it cannot be considered an accurate map of the course of individual patients.
For example, large long-term clinical trials have demonstrated that improved blood glucose34,35 and blood pressure control, perhaps especially with renin-angiotensin system blockers,12,36,37 slows the progression of DN in proteinuric patients with already substantially reduced GFR. Indeed, the natural history of DN may have changed after the results of these trials were available to the scientific community and to patients. This has led to the publication of revised treatment guidelines by several entities recommending stricter glycemic and blood pressure control for patients with diabetes. Although in the past it was believed that once DN was present the decline of renal function was inexorable, it is now clear that this may not always be the case.12,36,37 Finally, the demonstration that prolonged euglycemia leads to reversal of established DN lesions in patients with type 1 diabetes38 contradicts the long-held belief that these lesions are irreversible.
Kidney Structure in Diabetes
DN manifests as a constellation of structural changes unique to this disease (Table 28-2).39–41 Subtle thickening of the glomerular basement membrane (GBM) is the initial quantifiable change (Fig. 28-1A and C), and this is paralleled by thickening of tubular basement membranes (TBM) (Fig. 28-2).42,43 Afferent and efferent glomerular arteriolar hyalinosis can be present within 3 to 5 years of diabetes onset.44 Involvement of both vessels is virtually pathognomonic of diabetes, and these changes can progress to total replacement of the smooth muscle cells of these small vessels by hyaline, a waxy, homogeneous, stained-glass appearing, periodic acid Shiff (PAS)-positive material (Fig. 28-3A and B).45 These arteriolar lesions, along with glomerular capillary subendothelial hyaline and capsular drops (hyaline caps) along the parietal surface of the Bowman capsule (see Fig. 28-3C), constitute the exudative lesions of DN.
Table 28-2
Pathology of Diabetic Nephropathy in Patients with Type 1 Diabetes and Proteinuria
| Always Present | Often or Usually Present | Sometimes Present |
| Glomerular basement membrane thickening* | Kimmelstiel-Wilson nodules (nodular glomerulosclerosis)*; global glomerular sclerosis; focal-segmental glomerulosclerosis, atubular glomeruli | Hyaline “exudative” lesions (subendothelial)† |
| Tubular basement membrane thickening* | Foci of tubular atrophy | Capsular drops† |
| Mesangial expansion with predominance of increased mesangial matrix (diffuse glomerulosclerosis)* | Afferent and efferent arteriolar hyalinosis* | Atherosclerosis |
| Interstitial expansion with predominance of increased extracellular matrix material | Glomerular microaneurysms | |
| Increased glomerular basement membrane, tubular basement membrane, and Bowman’s capsule staining for albumin and IgG* |
*In combination, diagnostic of diabetic nephropathy.
†Highly characteristic of diabetic nephropathy.
From Parving H-H, Mauer M, Ritz E: Diabetic nephropathy. In Brenner BM (ed): Brenner & Rector’s the kidney, ed 7, Philadelphia, 2004, Saunders, pp 1777–1818.
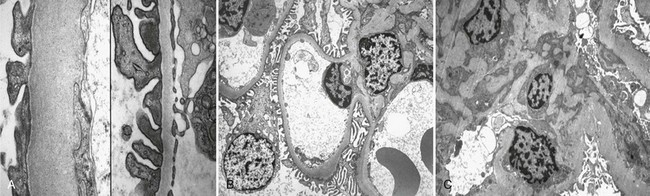
FIGURE 28-1 Electron microscopic photomicrographs. A, Normal glomerular basement membrane (GBM) on the left compared to thickened GBM from a proteinuric type 1 diabetic patient on the right. B, Normal glomerular capillary loops and mesangial zone. C, Thickened GBM, mesangial expansion (predominantly with mesangial matrix), and capillary lumen narrowing in a proteinuric type 1 diabetic patient. (From Parving H-H, Mauer M, Ritz E: Diabetic nephropathy. In Brenner BM [ed]: Brenner & Rector’s the kidney, ed 7, Philadelphia, 2004, Saunders, pp 1777–1818.)
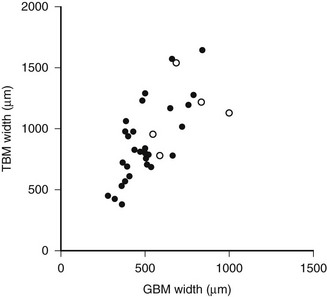
FIGURE 28-2 Relationship of proximal tubular basement membrane (TBM) width and glomerular basement membrane (GBM) width in 35 type 1 diabetic patients, 25 of whom were normoalbuminuric. The hypertensive patients are represented by the open circles. r = 0.64, P < 0.001. (Data from Brito PL et al: Proximal tubular basement membrane width in insulin-dependent diabetes mellitus, Kidney Int 53:754–761, 1998.)
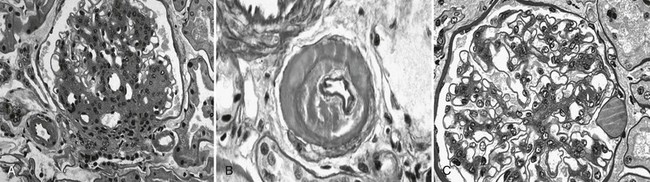
FIGURE 28-3 Light microscopic photomicrographs. A, Afferent and efferent arteriolar hyalinosis in a glomerulus from a type 1 diabetic patient. The glomerulus shows diffuse and nodular mesangial expansion (PAS stain). B, Glomerular arteriole showing almost complete replacement of the smooth-muscle wall by hyaline material and lumen narrowing (PAS stain). C, Glomerulus with minimal mesangial expansion and a capsular drop at 3 o’clock (PAS stain). (From Parving H-H, Mauer M, Ritz E: Diabetic nephropathy. In Brenner BM [ed]: Brenner & Rector’s the kidney, ed 7, Philadelphia, 2004, Saunders, pp 1777–1818.)
Increases in the fraction of the glomerulus occupied by the mesangium, or mesangial fractional volume [Vv(Mes/glom)], may be measurable after only 4 to 5 years of type 1 diabetes,46 but in most cases, it may take 10 or more years to increase into the abnormal range.47 Mesangial expansion in diabetes mainly results from the accumulation of mesangial matrix material and less from the expansion of the cellular component of the mesangium (see Fig. 28-1C; Fig. 28-4).48 The cortical interstitium is the space between renal tubules, glomeruli, and blood vessels. As a fraction of cortical volume, interstitium [Vv(Int/cortex)] is initially decreased early in type 1 diabetes, perhaps due to expansion of the tubular compartment, which is 85% of the cortex. Moderate increases in Vv(Int/cortex) are primarily due to expansion of the cellular component of the interstitium, the initial explanation for interstitial expansion in type 1 diabetes, whereas increased interstitial fibrillar collagen comes later, with more marked interstitial expansion and in association with already reduced GFR.49
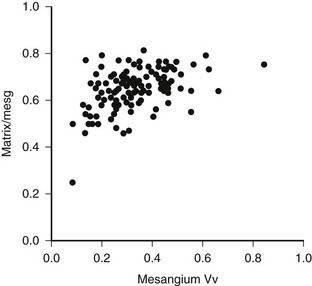
FIGURE 28-4 Mesangial matrix expressed as a fraction of the total mesangial (Matrix/mesg) plotted against mesangial fractional volume (Mesangium Vv) in longstanding type 1 diabetic patients. The normal value for matrix/mesg is approximately 0.5. Note that most diabetic patients have elevated values for matrix/mesg whether or not there is an increase in mesangium Vv (i.e., values above 0.24). (Data from Steffes MW, Bilous RW, Sutherland DE, et al: Cell and matrix components of the glomerular mesangium in type I diabetes, Diabetes 41:679–684, 1992.)
Abnormalities of the junction of the glomerulus with its tubule, with obstruction of the proximal tubular take-off from the glomerulus and, in the extreme, complete detachment of the tubule from the glomerulus (atubular glomerulus) (Fig. 28-5A to D) occur late in the disease and, in type 1 diabetes, is largely restricted to patients with overt proteinuria (Fig. 28-6).50
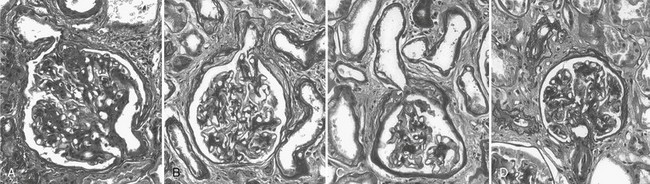
FIGURE 28-5 Glomerulotubular junction (GTJ) abnormalities (GTJA). A, Glomerulus attached to a short atrophic tubule (SAT). The arrow points to the atrophic segment. B, Glomerulus attached to a long atrophic tubule (LAT). The arrow points to the atrophic segment and tuft adhesion. C, Glomerulus attached to an atrophic tubule with no observable opening (ATNO) and a tip lesion (arrow). D, Atubular glomerulus (AG). *Tubular remnants that possibly belonged to the AG. (From Najafian B, Crosson JT, Kim Y, et al: Glomerulotubular junction abnormalities are associated with proteinuria in type 1 diabetes, J Am Soc Nephrol 17:S53–S60, 2006.)
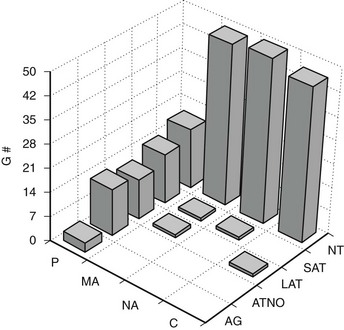
FIGURE 28-6 Frequency of glomerular tubular junction abnormalities (GTJA) in normoalbuminuric (NA), microalbuminuric (MA), and proteinuric (P) patients and control subjects (C). G#, Number of glomeruli; AG, atubular glomerulus; ATNO, atrophic tubule with no observable opening; LAT, long atrophic tubule; SAT, short atrophic tubule; NT, normal tubules. (Data from Najafian B, Crosson JT, Kim Y, et al: Glomerulotubular junction abnormalities are associated with proteinuria in type 1 diabetes, J Am Soc Nephrol 17:S53–S60, 2006.)
The lesions of diabetic glomerulopathy also progress at varying rates within individual patients.51,52 A given patient may have relatively marked GBM thickening with less advanced mesangial expansion or vice versa (Fig. 28-7).39,51 However, both abnormalities are advanced in the majority of type 1 diabetic patients who develop clinical DN manifesting as proteinuria, hypertension, and declining GFR39,51,52 (see later). In addition to these classic diabetic glomerulopathy lesions (GBM and TBM thickening and mesangial expansion), focal and global glomerulosclerosis, tubular atrophy, interstitial expansion and fibrosis, and glomerulotubular junction abnormalities contribute to the progressive GFR loss which culminates in ESRD.50
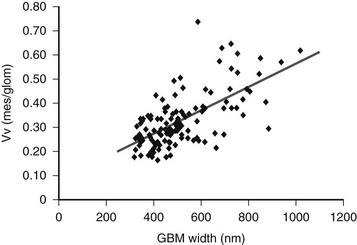
FIGURE 28-7 Relationship between glomerular basement membrane (GBM) width and mesangial fractional volume (Vv[Mes/glom]) in 125 longstanding type 1 diabetic patients, 88 of whom were normoalbuminuric, 17 microalbuminuric, and 18 proteinuric. r = 0.58, P < 0.001. (Data from Caramori ML, Kim Y, Huang C, et al: Cellular basis of diabetic nephropathy: 1. Study design and renal structural-functional relationships in patients with long-standing type 1 diabetes, Diabetes 51:506–513, 2002.)
Mesangial expansion, occurring relatively evenly in most glomeruli, has been termed diffuse diabetic glomerulosclerosis (Fig. 28-8A to C). Kimmelstiel-Wilson nodular lesions are large round fibrillar areas of mesangial expansion with palisading of mesangial nuclei around the periphery of the nodule, often with extreme compression of the adjacent glomerular capillaries (Fig. 28-9C). These nodules result from glomerular capillary microaneurysm formation (see Fig. 28-9A)53 and subsequent filling of the expanded capillary space with mesangial matrix (see Fig. 28-9B). About half of proteinuric type 1 diabetic patients have some nodular lesions, typically on a background of diffuse diabetic glomerulosclerosis (Fioretto and Mauer, unpublished observations). In the end, clinical DN largely results from marked extracellular matrix (ECM) accumulation whereby over many years, the rate of ECM production exceeds the rate of removal. The ECM that accumulates in mesangium, GBM and TBM is made up of the normal ECM constituents of these sites, including (primarily) types IV and VI collagen, laminin, and fibronectin54 and perhaps additional ECM components not yet identified. “Scar” collagens (mainly collagens I and II) are seen only very late in the diabetic glomerulopathy process, primarily associated with global glomerular sclerosis or developing in the center of nodular lesions.54,55 Understanding the processes that result in ECM accumulation in the mesangium, GBM, and TBM in diabetes is incomplete.56,57 Glomeruli may become globally sclerosed in diabetic patients without other diabetic changes,58 especially in type 2 diabetes (see later). In type 1 diabetic patients, there is a relationship between the severity of arteriolar hyalinosis lesions and the number of globally sclerosed glomeruli, with greater frequency of scarred glomeruli in the plane vertical to the kidney capsule, suggesting that glomerulosclerosis could also be caused by occlusion of medium-sized renal arteries.59 As renal insufficiency progresses, there are increasing numbers of totally scarred glomeruli, glomeruli with capillary closure due to massive mesangial expansion (see Fig. 28-9D), or atubular glomeruli (i.e., glomeruli that are nonfunctioning because they are detached from their tubules (see later).
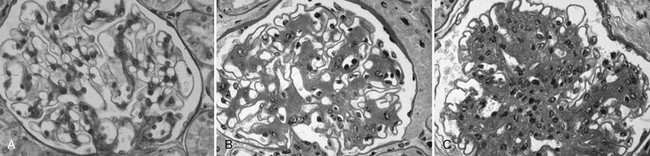
FIGURE 28-8 Light microscopic photomicrographs (PAS stain). A, Normal glomerulus. B, Glomerulus from a normoalbuminuric type 1 diabetic patient with glomerular basement membrane (GBM) thickening and moderate mesangial expansion. C, Glomerulus from a type 1 diabetic patient with overt diabetic nephropathy and severe diffuse mesangial expansion. (From Parving H-H, Mauer M, Ritz E: Diabetic nephropathy. In Brenner BM [ed]: Brenner & Rector’s the kidney, ed 7, Philadelphia, 2004, Saunders, pp 1777–1818.)
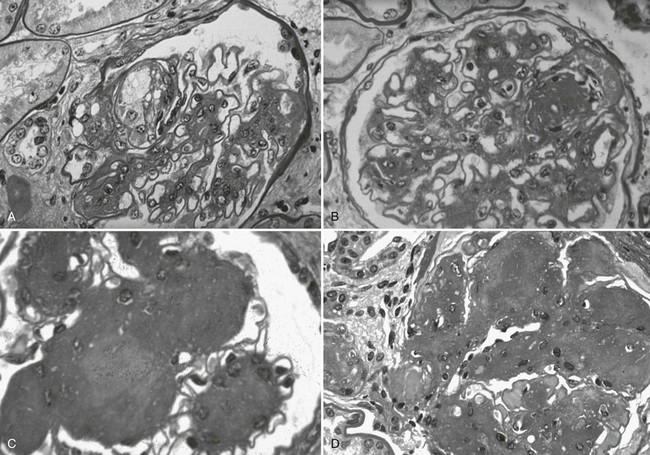
FIGURE 28-9 Light microscopic photomicrographs (PAS stain) of glomeruli from type 1 diabetic patients. A, Capillary microaneurysm (mesangiolysis) at 11 o’clock. B, Nodule formation within a capillary microaneurysm. C, Nodular glomerulosclerosis (Kimmelstiel-Wilson nodules). D, End-stage diabetic glomerular changes with nearly complete capillary closure. (From Parving H-H, Mauer M, Ritz E: Diabetic nephropathy. In Brenner BM [ed]: Brenner & Rector’s the kidney, ed 7, Philadelphia, 2004, Saunders, pp 1777–1818.)
Numbers of glomerular podocytes are reportedly reduced in patients with type 1 and 2 diabetes,60–63 especially in association with albuminuria and disease progression. This may be at least in part due to increased podocyte detachment from the GBM.64 However, more work is needed to further document and understand these potentially important podocyte abnormalities.
Structural-Functional Relationships in Diabetic Nephropathy
Mesangial expansion is the major cause of GFR loss in type 1 diabetic patients.51 Increase in Vv(Mes/glom) is strongly inversely correlated with filtration surface (Fig. 28-10) per glomerulus which in turn is strongly directly correlated with GFR in type 1 diabetes.65 Mesangial fractional volume is also directly correlated with AER51,52 (Fig. 28-11A and B) and systemic blood pressure.51,66 The relationships of GBM width with these clinical manifestations of diabetic kidney disease are also important but are somewhat weaker than those for mesangial changes.51,52 However, mesangial and GBM changes together explain most of the AER variability in type 1 diabetes, ranging from normoalbuminuria to proteinuria.52
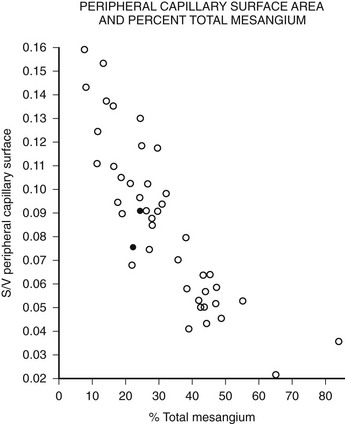
FIGURE 28-10 Relationship of mesangial fractional volume (% total mesangium) and filtration surface density (Sv[peripheral capillary/surface]) in type 1 diabetic patients. (Data from Mauer SM, Steffes MW, Ellis EN, et al: Structural-functional relationships in diabetic nephropathy, J Clin Invest 74:1143–1155, 1984.)
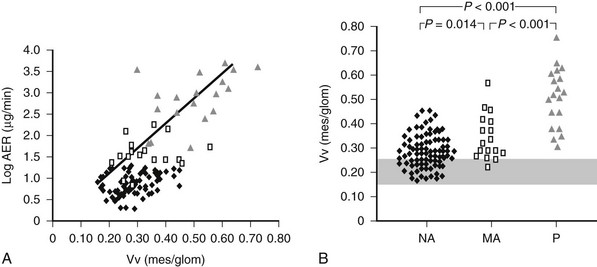
FIGURE 28-11 A, Correlation between mesangial fractional volume (Vv[Mes/glom]) and albumin excretion rate (AER) in 124 patients with type 1 diabetes.  = Normoalbuminuric patients;
  = microalbuminuric patients; Δ = proteinuric patients. r = 0.75; P < 0.00l. B, Vv(Mes/glom) in 88 normoalbuminuric (NA), 17 microalbuminuric (MA), and 19 proteinuric (P) patients with type 1 diabetes. The hatched area represents the mean ± 2 SD in a group of 76 age-matched normal control subjects. All groups are different from control subjects. (Data from Caramori ML, Kim Y, Huang C, et al: Cellular basis of diabetic nephropathy: 1. Study design and renal structural-functional relationships in patients with long-standing type 1 diabetes, Diabetes 51:506–513, 2002.)
As mentioned, decreased podocyte number and detachment are related to albuminuria. Increases in podocyte foot process width also correlate with AER increases in type 1 diabetic patients.61,67,68 If podocyte number or shape changes are early predictors of DN risk,69 this would support an important pathogenetic role for this key glomerular cell in this disease.
Although glomerular capillary filtration surface is directly correlated with GFR in type 1 diabetes,65,70,71 linear regression models only partially explain GFR variability in these patients.52 Global sclerosis58 and interstitial expansion41 are additional independent predictors of GFR loss. However, the conclusion that the interstitium is more important than glomerular changes in diabetes came from studies where most patients were in advanced stages of kidney failure.72–74 At these advanced stages, when serum creatinine is already clearly elevated, especially if above 2 mg/dL, interstitial changes are common to most chronic renal diseases and are not specific to diabetes. During most of the natural history of DN, glomerular parameters are more important determinants of renal dysfunction. Moreover, as already discussed, early interstitial expansion in type 1 diabetes is mainly due to expansion of its cellular component, and increased interstitial fibrillar (scar) collagen is primarily seen in patients whose GFR is reduced,56 while glomerular ECM changes are due to accumulation of basement membrane components. Thus, the interstitial and glomerular changes of diabetes probably have different pathogenetic mechanisms.
Through many years of the natural history of DN, lesions develop without detectable clinical or laboratory abnormalities. Often, when microalbuminuria initially manifests, lesions are far advanced. Once proteinuria is present in type 1 diabetes, GFR loss typically progresses relatively rapidly toward ESRD. This nonlinear clinical course is best reflected by nonlinear analyses of structural-functional relationships.50 Using piecewise linear regression instead of simple linear models, glomerular structural variables alone explained 95% of variability in AER. These glomerular structures, mesangial fractional volume, GBM width and filtration surface density, however, explained less than 80% of GFR variability. This increased to more than 90% with the addition of measures of glomerular tubular junction abnormalities and interstitial expansion.50
Microalbuminuria and Renal Structure
Persistent microalbuminuria antedates clinical nephropathy, whereas normoalbuminuria in longstanding type 1 diabetic patients predicts lower nephropathy risk. However, the relationship of renal structural changes to low levels of albuminuria (i.e., normal to microalbuminuria) is far from simple. As a group, normoalbuminuric longstanding type 1 diabetic patients have diabetic glomerulopathy lesions.52,75 Their structural measurements range from normal to pathology overlapping in severity with microalbuminuric and proteinuric patients (see Fig. 28-11B; Fig. 28-12B).52,75 Increased GBM width predicts progression to microalbuminuria and proteinuria.75,76 Microalbuminuric patients have on average even more severe lesions, with few type 1 diabetic patients having renal structural measures still within the normal range (see Fig. 28-11B and Fig. 28-12B).52,75 Hypertension and reduced GFR are also more frequent in these patients, so microalbuminuria is a marker of more advanced lesions and other functional disturbances.52,75 However, reduced GFR may be present in normoalbuminuric longstanding type 1 diabetic patients. This is more frequent in females with retinopathy and/or hypertension and is associated with advanced glomerulopathy lesions.23,77,78 Microalbuminuria may not be the first indicator of DN, and careful GFR and blood pressure measurements are needed, especially in female patients with the described characteristics.
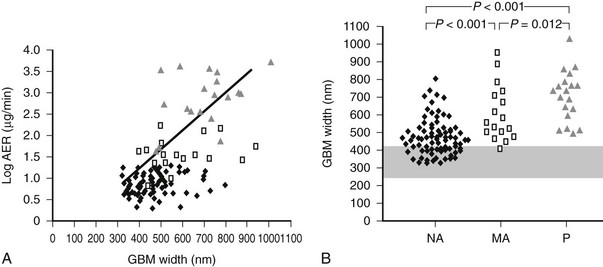
FIGURE 28-12 A, Correlation between glomerular basement membrane (GBM) width and albumin excretion rate (AER) in 124 patients with type 1 diabetes.  = Normoalbuminuric patients;
  = microalbuminuric patients; Δ = proteinuric patients. r = 0.62, P < 0.001. B, GBM width in 88 normoalbuminuric (NA), 17 microalbuminuric (MA), and 19 proteinuric (P) patients with type 1 diabetes. The hatched area represents the mean ± 2 SD in a group of 76 age-matched normal control subjects. All groups are different from control subjects. (Data from Caramori ML, Kim Y, Huang C, et al: Cellular basis of diabetic nephropathy: 1. Study design and renal structural-functional relationships in patients with long-standing type 1 diabetes, Diabetes 51:506–513, 2002.)
Normal identical twins of type 1 diabetic patients have normal renal structure.42 Diabetic twins have greater GBM and TBM width and mesangial fractional volume than their nondiabetic twin, albeit sometimes still within the normal range despite many years of diabetes.42 Over time, all type 1 diabetic patients appear to develop some structural changes of DN, but the rate may be so slow that the lesions would be undetectable except by comparison with their nondiabetic twin and would not lead to clinical disease. There is also striking variability in the rate at which lesions develop in kidneys transplanted into type 1 diabetic patients who all had ESRD secondary to DN.75 This cannot be fully explained by glycemia and suggests genetically determined renal tissue susceptibility.75
Interestingly, studies of type 1 diabetic transplant recipients indicate that having a single kidney does not appear to accelerate the rate of development of DN lesions, arguing against reduced nephron number as a risk factor.79 In fact, proteinuric diabetic patients without advanced renal failure have normal numbers of glomeruli.80 However, reduced glomerular number could be associated with faster GFR decline once overt DN develops.
Contrasts in Nephropathy Lesions Between Type 1 and Type 2 Diabetes
There have been fewer studies of renal pathology and structural-functional relationships in type 2 diabetes, even though it accounts for more than 80% of ESRD among diabetic patients. A Danish study found that Caucasian proteinuric type 2 diabetic patients have similar structural changes when compared to proteinuric type 1 diabetic patients, and the severity of these changes predicted the subsequent rate of GFR decline.81 However, the authors also noted more variability in glomerular structure in these patients than in type 1 patients, with some type 2 proteinuric patients having minimal or no diabetic glomerulopathy.81 One study from Northern Italy of type 2 diabetic patients biopsied for clinical reasons82 found typical DN lesions in a third of patients; an increase of globally sclerosed glomeruli, severe tubulointerstitial lesions, and minimal or no diabetic glomerulopathy in another third; while the rest showed changes of diabetic glomerulopathy plus changes of other diseases such as proliferative glomerulonephritis and similar changes.82 In another Danish study, most proteinuric type 2 diabetic patients had diabetic changes,83 but about a fourth of those studied had nondiabetic glomerulopathies, including “minimal lesions,” glomerulonephritis, or mixed diabetic and other changes. In this study, all patients with proteinuria and diabetic retinopathy had classical DN lesions, but less than half of those without retinopathy had DN.83 A British study found similar results.84 However, these high rates of diseases other than or superimposed upon DN are almost certainly because the patients in these studies had clinical indications for kidney biopsies, often including atypical clinical courses. In another study from Northern Italy, when renal biopsies in type 2 diabetes were performed solely for research purposes, definable renal diseases other than secondary to diabetes were in fact uncommon.85 However, only about a third of type 2 microalbuminuric patients in this research study had findings typical of diabetic glomerulopathy; approximately a third had minimal abnormalities, and about 40% had varying combinations of global glomerulosclerotic, vascular, and tubulointerstitial lesions out of proportion to their absent to relatively mild diabetic glomerulopathy lesions.85
Structural-Functional Relationships in Type 2 Diabetes
Although initially reported to have renal structural-functional relationships that were similar to type 1 patients,86 a more recent study in Japanese type 2 diabetic patients indicated greater heterogeneity.87 A Danish study found fewer glomerular lesions and higher GFR levels in type 2 versus type 1 patients with similar AER.81 Much larger glomerular volumes were found in the type 2 patients, and perhaps this preserved filtration surface.81 Nonetheless, the proteinuria in these type 2 diabetic patients was at least in part unexplained. Mesangial fractional volume increased progressively with albuminuria and global glomerular sclerosis correlated inversely with GFR in Pima Indian type 2 diabetic patients.61 Also, glomerular podocyte loss was related to proteinuria (but not microalbuminuria) in these patients.
The less precise correlation between glomerular structure and renal function in type 2 diabetes is probably due to these more varied patterns of renal injury.85 This is of prognostic significance, since patients with more typical diabetic glomerulopathy lesions are more likely to have progressive GFR loss.33,83
In summary, renal structural changes in type 2 diabetes are more heterogeneous, and diabetic glomerulopathy lesions are on average less severe in type 2 than in type 1 diabetic patients with similar albuminuria levels. Approximately 40% of the type 2 diabetic patients show atypical renal injury patterns. These atypical patterns are associated with higher body mass index and less diabetic retinopathy.85 Thus, the atypical manifestations of renal injury in type 2 diabetes could be related to obesity, hypertension, hyperlipidemia, accelerated atherosclerosis, and aging interacting with the effects of hyperglycemia. The markedly increased risk of ESRD in certain type 2 diabetic populations (e.g., African American, American Indian, Hispanic) could represent variability in the renal consequence of one or more of these pathogenetic influences (e.g., there are differences in the renal structural consequences of hypertension in African American and Caucasian patients,88) genetic susceptibility to DN, or both. Further cross-sectional and longitudinal studies in type 2 diabetic patients are required before these complexities can be better understood.
Diabetic Nephropathy Lesions are Reversible
Despite rapid reversal of mesangial expansion in rats cured of diabetes by islet transplantation,89 there was no improvement in DN lesions in the native kidneys of type 1 diabetic patients normoglycemic for 5 years after successful pancreas transplantation.90 However, after 10 years of normoglycemia, there was dramatic healing of diabetic renal lesions.91 GBM and TBM width and mesangial fractional volume were lower at 10 years versus baseline and 5 years, often with these structural parameters having returned to the normal range (Fig. 28-13A and B).91 The reduction in mesangial expansion primarily resulted from the disappearance of excess mesangial matrix material (see Fig. 28-13C and D). Light microscopy revealed remarkable glomerular architectural remodeling, often including the complete disappearance of Kimmelstiel-Wilson nodules (Fig. 28-14A to C) and increased patency of glomerular capillaries.91 It is not clear why reversal of lesions was not seen in the first 5 years. Perhaps there was cellular (epigenetic) memory for the diabetic state. Alternatively, glycation of ECM may have slowed the degradation process. Unlike the normal situation where throughout adult life, glomerular ECM content remains quite constant,92 this healing process requires ECM removal to exceed production. Thus, the cellular recognition of an abnormal structural environment and the cellular machinery to initiate and sustain the healing and remodeling processes must exist. Remodeling and healing in the tubulointerstitium also occurred in these patients.93 There was an estimated decrease in total amount of cortical interstitial collagen and disappearance of atrophic tubules, the latter presumably through reabsorption.93 If it becomes possible to stimulate these healing processes over the processes of injury, DN could be delayed or prevented.
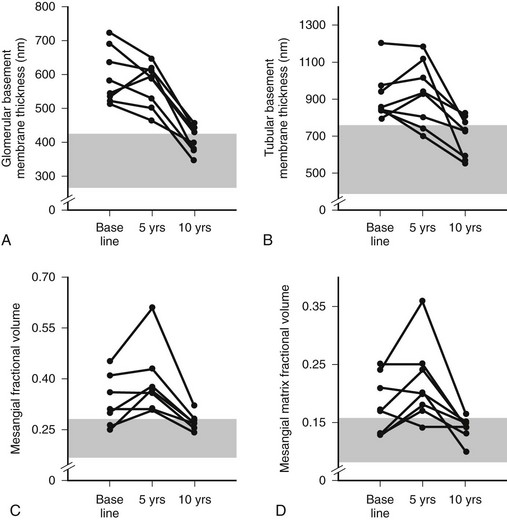
FIGURE 28-13 Thickness of the glomerular basement membrane, thickness of the tubular basement membrane, mesangial fractional volume, mesangial-matrix fractional volume at baseline, and 5 and 10 years after pancreas transplantation. The shaded area represents the normal ranges obtained in the 66 age- and sex-matched normal controls (mean ± 2 SD). Data for individual patients are connected by lines. (Data from Fioretto P, Steffes MW, Sutherland DE, et al: Reversal of lesions of diabetic nephropathy after pancreas transplantation, N Engl J Med 339:69–75, 1998.)
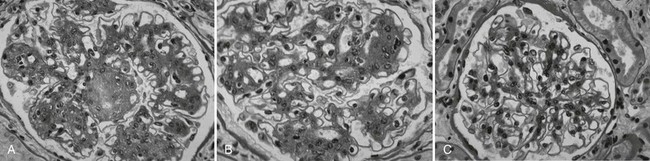
FIGURE 28-14 Light microscopic photomicrographs (PAS stain) of renal biopsy specimens obtained before and after pancreas transplantation from a 33-year-old woman with type 1 diabetes of 17 years’ duration at the time of transplantation. A, Typical glomerulus from the baseline biopsy specimen, which is characterized by diffuse and nodular (Kimmelstiel-Wilson) diabetic glomerulopathy. B, Typical glomerulus 5 years after transplantation, with persistence of the diffuse and nodular lesions. C, Typical glomerulus 10 years after transplantation, with marked resolution of diffuse and nodular mesangial lesions and more open glomerular capillary lumina. (From Fioretto P, Steffes MW, Sutherland DE, et al: Reversal of lesions of diabetic nephropathy after pancreas transplantation, N Engl J Med 339:69–75, 1998.)
Genetic Predisposition to Diabetic Nephropathy
Genetic predisposition is a strong DN determinant in both type 1 and type 2 diabetes; only about half of patients with poor glycemic control develop DN,94 whereas some patients do so despite relatively good control—findings consistent with genetically modulated risk. Differences in the prevalence of DN in different patient populations also support this view.10,95,96 Genetic predisposition to DN is supported by several cross-sectional studies of siblings concordant for type 197–100 and type 2101–105 diabetes. There is a large difference (300% to 800%) in the cumulative risk of DN between siblings of probands with or without DN. Moreover, there is a strong correlation for the severity and patterns of glomerular lesions in type 1 diabetic sibling pairs.106 Although some of the data are consonant with a major gene effect with an autosomal dominant mode of inheritance, more recent genomewide studies suggest a more complex picture (see later).
Familial Studies of Blood Pressure, Cardiovascular Disease, and Diabetic Nephropathy
Several studies showed associations between DN and predisposition to hypertension and cardiovascular disease.107–112 Higher blood pressure levels and increased prevalence of hypertension have been described in nondiabetic parents of proteinuric and microalbuminuric type 1107–109 and type 2111 diabetic patients. Diabetic patients with advanced nephropathy also had higher mean arterial blood pressures during adolescence,109 and prediabetic blood pressure levels predicted AER after diabetes onset.110 The prevalence of cardiovascular disease and cardiovascular death was greater in the parents of type 1 diabetic patients with nephropathy,112 and DN patients who had suffered a cardiovascular event more often had a positive family history of cardiovascular disease. This indicates that familial predisposition to cardiovascular disease increases both the risk of nephropathy and the risk of cardiovascular disease in type 1 diabetic patients with nephropathy, linking the pathogenesis of DN to factors also favoring the development of atherosclerosis.107,108,113 Moreover, AER and blood pressure levels were linked and heritable in Caucasian families with type 2 diabetes.114
Sodium/Lithium and Sodium/Hydrogen Countertransport
Sodium/lithium (Na+/Li+) countertransport activity, a genetically regulated system linked to hypertension and cardiovascular disease in nondiabetic persons,115 was increased in microalbuminuric and proteinuric type 1108,116,117 but not in type 2118 diabetic patients. Increased Na+/Li+ countertransport activity has also been described in parents of proteinuric type 1 diabetic patients119 and is similar in identical twin pairs discordant for type 1 diabetes120 where both twins had values higher than age-matched nondiabetic controls.120 Raised erythrocyte Na+/Li+ countertransport activity was associated with a fourfold increased risk of development of persistent microalbuminuria in patients with type 1 diabetes.121
Na+/Li+ countertransport has parallels with the sodium/hydrogen (Na+/H+) antiport exchange system involved in the regulation of intracellular pH, cell volume and growth, and proximal tubular sodium reabsorption.122 The Na+/H+ antiport activity is increased in leukocytes123 and cultured skin fibroblasts124–126 of type 1 and type 2 diabetic patients with microalbuminuria and proteinuria. Also, since cultured skin fibroblast Na+/H+ antiport activity was highly correlated among sibling pairs concordant for type 1 diabetes and for DN lesions,127 and independent of environmental factors, it was suggested that these cultured skin fibroblast abnormalities are at least in part genetically regulated.
Diabetic Nephropathy Genes
As already noted, genetic predisposition to DN has been strongly suggested in studies of siblings concordant for type 197,98,100 and type 2101,103 diabetes. There are ongoing searches for genetic loci related to DN susceptibility through genomic scanning and candidate gene approaches, although neither approach has yet yielded definitive results,128–130 probably because multiple genes are involved.128,129 Sib-pair studies in Pima Indian families with type 2 diabetes showed linkage between four chromosomal regions (chromosomes 3, 7, 9, and 20) and DN, the strongest one in chromosome 7.131 Previous studies in Caucasian populations have shown linkage between DN and chromosome 7q in type 2 diabetic patients132 and chromosome 3q in type 1 diabetic patients.133 Segregation analysis studies in Caucasian families with type 2 diabetes also suggest a major gene effect for AER.134 In the Family Investigation of Nephropathy and Diabetes (FIND) study, a genomewide scan demonstrated multiple chromosomal regions linked to estimated GFR in multiethnic families ascertained by a proband with DN,135 but these may be related more to DN progression than to DN risk.
Genetic polymorphisms in candidate genes have been evaluated in several studies. Associations with DN risk have also been reported for polymorphisms in the human inducible nitric oxide synthase,136 ectonucleotide pyrophosphatase/phosphodiesterase-1,137 heparan sulfate proteoglycan,138 paraoxonase 2,139 matrix metalloproteinase-9 (MMP-9),140 transforming growth factor-β1 (TGFB1),141 protein kinase C (PKCB),142 and haptoglobin143 genes. Studies of polymorphisms in endothelial nitric oxide synthase (eNOS),144–146 aldose-reductase,147–149 plasminogen activator inhibitor 1,150,151 interleukin 1,152,153 apolipoprotein E,154–157 glucose transporter-1 (GLUT1),158,159 and methylenetetrahydrofolate reductase160,161 genes showed conflicting results. Many other candidate genes have been studies.70–82 A leucine repeat of the carnosinase (CNDP1) gene was associated with DN in both type 1 and type 2 diabetic patients.162,163 Also, multiple variations in the superoxide dismutase 1 (SOD1) gene were significantly associated with development of persistent microalbuminuria and severe nephropathy in type 1 diabetic patients enrolled in the Diabetes Control and Complications Trial/Epidemiology of Diabetes and Its Complications (DCCT/EDIC) study.164
One particularly extensively studied set of genes are those related to the renin-angiotensin system. Polymorphism in the angiotensin converting enzyme (ACE) gene, consisting of an insertion or a deletion (I/D) of a 287-base-pair sequence that determines most of the interindividual variance in the ACE activity, has also been associated with rate of GFR decline in nondiabetic renal diseases.165 It remains unclear if this ACE polymorphism is important in the genesis of DN,166–170 although a follow-up study supports this view.171 I/D ACE polymorphism may be involved in the progression of DN and the response to ACE inhibitor therapy.172–174 Normoalbuminuric and microalbuminuric type 1 diabetic patients with the II genotype appears to have the fastest increase in AER174 and the best response to ACE inhibitor therapy.173,174 On the other hand, D was the risk allele for development of DN after 6 years of follow-up of Caucasian type 1 diabetic patients.171 The, DD genotype was also more frequent in normoalbuminuric or microalbuminuric Japanese type 2 diabetic patients who doubled AER or changed AER class (progressors) than in patients who did not progress after 10 years of follow-up.172 Although progression was not be associated with ACE genotype in Caucasian normoalbuminuric or microalbuminuric type 2 diabetic patients,175 patients with II genotype (n = 11) did not decrease GFR after 9 years of follow-up. Moreover, presence of the D allele in Caucasian type 2 diabetic patients was related to the presence of more severe DN lesions.176 Other studies did not observe an association between this ACE gene polymorphism and DN129,151,177–186 or rate of GFR decline187 in type 1 or type 2 diabetic patients. One meta-analysis concluded that the D allele was significantly associated with DN in a dominant model (DD + ID versus II) in both type 1 and type 2 diabetic patients.188 Another found this association to be significant in Japanese type 2 diabetic patients but not in Caucasian type 1 or type 2 diabetic patients.189
Association with DN risk in type 1 or type 2 diabetic patients and polymorphisms in the angiotensinogen gene was found in some190,191 but not in all181,182,192,193 studies. One study observed association between the T-allele of the angiotensinogen gene and elevated AER only when interaction with the D-allele of the ACE I/D polymorphism was considered.194 Interactions between ACE and angiotensinogen gene polymorphism have been previously described in cross-sectional166 but not confirmed in longitudinal171 studies. A meta-analysis did not find association between angiotensinogen gene polymorphism and DN.195 Two large studies did not find a role for angiotensin II type 1 receptor polymorphism in DN,196,197 while another found this polymorphism to significantly contribute to DN risk in type 1 diabetic patients only when accompanied by poor glycemic control.198
Pathogenesis of Diabetic Nephropathy
Although important modulating factors may exist, DN is secondary to the long-term metabolic aberrations found in diabetes and exposure to elevated glucose levels appears central to the expression of this disorder. Studies in type 1 and type 2 diabetes proved that improved glycemic control could reduce the development of DN. The DCCT demonstrated that the risk of microalbuminuria in type 1 diabetic patients was decreased by strict glycemic control.199 Importantly, although the DCCT did not show a benefit of 6.3 years of improved glycemic control in the progression from microalbuminuria to proteinuria, additional follow-up of these patients showed significant reduction in the rates of progression to proteinuria and ESRD.200 The United Kingdom Prospective Diabetes Study (UKPDS) also demonstrated a decreased incidence of DN after 10 years of intensive glycemic control in recently diagnosed type 2 diabetic patients.35 Moreover, a 5-year randomized clinical trial in 48 type 1 diabetic kidney transplant recipients demonstrated that the development of one of the earliest diabetic renal lesions, increased mesangial matrix fractional volume per glomeruli (Vv[MM/glom]), was prevented by strict glycemic control.201 Also, intensive insulin treatment for 26 to 34 months decreased the rate of GBM thickening and increase in Vv(MM/Mes) and matrix star volume in a controlled trial in 18 microalbuminuric type 1 diabetic patients.202 Finally, regression of established diabetic glomerular lesions has been demonstrated in the native kidneys of 8 type 1 diabetic patients with 10 years of normoglycemia induced by successful pancreas transplantation (see Fig. 28-14 A to C).90,203 These studies strongly suggest that hyperglycemia is not only necessary for DN lesions to develop, but it is also necessary to sustain established lesions. Removal of hyperglycemia allows reparative mechanisms to be expressed that ultimately result in healing of the original diabetic glomerular injuries. Studies evaluating GLUT1 in animals reinforce the pathogenic role of glycemia on the development of DN. High glucose can increase GLUT1 expression and glucose transport in rat mesangial cells,204 effects mediated by TGF-β.205 Rat mesangial cells transduced to overexpress human GLUT1 protein in normal glucose concentration showed increased glucose uptake and ECM synthesis.206 The mechanisms involved in the glomerular injury caused by hyperglycemia will be discussed in detail later.
Hemodynamic Mechanisms
Berkman and Rifkin207 described a diabetic patient with unilateral renal artery stenosis and marked diabetic lesions in the kidney exposed both to hypertension and diabetes, while the contralateral kidney, protected from hypertension by the narrowed renal artery, had only ischemic changes. A model of unilateral renal artery stenosis in diabetic rats208 proposed to confirm this human observation, although hypertensive and diabetic changes were not differentiated in this study. Insulin-treated diabetic rats have glomerular hyperfiltration explainable by increased single nephron GFR due to increased single nephron blood flow and, in the Münich-Wistar rat strain, increased glomerular capillary pressure.209 Thus, alterations in intraglomerular hemodynamics could influence the rate at which diabetic lesions develop. Some studies reported that glomerular hyperfiltration was a risk factor for the development of microalbuminuria.16,210 However, there is still controversy as to whether increased GFR is an independent predictor of progression.15,211
Several mediators of diabetes-induced hyperfiltration have been proposed. Increased renal and urinary kallikrein levels were associated with increased GFR and renal plasma flow in moderately hyperglycemic diabetic rats,212 which were normalized by a bradykinin B2 receptor antagonist.213 Urinary kallikrein excretion was also increased in type 1 diabetic patients with hyperfiltration.214 The genesis of glomerular hyperfiltration has also been associated with increased nitric oxide (NO) generation or action by a glucose-dependent mechanism.215,216 The vasodilatation caused by increased NO could enhance the permeability to macromolecules, leading to albuminuria.217 Furthermore, the enhanced NO synthesis by endothelial nitric oxide synthase (eNOS) in afferent arterioles and glomerular endothelial cells in diabetic rats suggests a pivotal role of NO in preferential afferent arteriolar dilatation, glomerular enlargement, and functional glomerular hyperfiltration in the early stages of DN.218 Treatment with a nonselective NOS inhibitor normalized GFR and plasma renal flow levels in diabetic rats.219 NO activity was shown to be increased in microalbuminuric compared to normoalbuminuric type 1 diabetic patients or nondiabetic controls and related to GFR and AER.220 Other studies suggest that hyperfiltration may result from an increased proximal tubular fluid reabsorption independent of any primary malfunction of the glomerular microvasculature.221
However, one cannot explain the genesis of DN on hyperfiltration alone. Reduction in nephron mass in rats by uninephrectomy222 produces glomerular hemodynamic perturbations that are similar to diabetes209 but does not produce the lesions223 that are classic for DN in animals.224,225 The central lesion associated with hyperfiltration in rats, focal segmental glomerular sclerosis,226 is not an important lesion in human or animal diabetes (see the section Kidney Structure in Diabetes). Reduced glomerular number at birth has been proposed as a risk factor for progressive renal disease and hypertension.227 One study suggested that reduced glomerular number was associated with increased DN risk in type 2 diabetic patients.228 This association was not confirmed in studies with type 1 diabetic patients. Glomerular number, estimated during autopsy, was decreased in type 1 diabetic patients only if ESRD was present.80 No differences in glomerular number were found between controls and type 1 diabetic patients with established DN but not ESRD.80 Moreover, there was no relationship between glomerular number (estimated by morphometric techniques in kidney biopsy tissue) and functional or structural parameters in type 1 diabetic patients with a wide AER range.229 Also, reduced nephron mass, such as in patients with uninephrectomy, has not been documented to produce DN lesions in humans. More than that, DN lesions may not develop faster in type 1 diabetic kidney transplant recipients (single-kidney diabetic patients) than in type 1 diabetic patients with their native kidneys.79,230 These studies suggest that glomerular number is probably not a crucial variable in the development of DN, although this variable may be important in progression once clinical findings of DN are present.
Lowering glomerular capillary pressure by long-term ACE inhibitor therapy prevented the development of focal segmental glomerular sclerosis231 but did not prevent the GBM widening and increase in Vv(Mes/glom) that occurs in the first 6 months of diabetes in rats.232 Thus, renin-angiotensin system blockage may not prevent the development of specific early DN lesions in diabetic animals.232 ACE inhibitor therapy prevented increase of GBM width and perhaps changed Mes composition but had no effect on Vv(Mes/glom) in microalbuminuric type 1 diabetic patients with established diabetic lesions.233 Cortical interstitial expansion was also prevented in type 1234 and type 2235 diabetic patients with already increased AER. These effects may not be specific for ACE inhibition, since β-blocker therapy in these studies showed similar effects on blood pressure and lesions.233,234 The influences of renin-angiotensin system blockage on clinical progression of DN are discussed in the Treatment section. Taken together, these studies could support the hypothesis that hemodynamic abnormalities may be more important in influencing the progression of established DN lesions than in serving as the genesis of these structural changes.
Although we are arguing that a case has not been made which currently allows acceptance of the hypothesis that hemodynamic abnormalities are responsible for the genesis of the early lesions of DN, it is nonetheless possible that manipulations that can affect glomerular hemodynamics might also affect the development of early diabetic renal lesions through other than hemodynamic influences. Drugs affecting the renin-angiotensin system might also impact ECM dynamics236–239 and thereby renal structure in diabetes. However, the mechanisms of actions of these agents appear complex, are incompletely understood, and may in part be independent of the renin-angiotensin system. Also, TGF-β expression may be regulated in parallel with renin.240,241 Thus, glomerular hyperfiltration could promote ECM accumulation by increases in the expression of TGF-β,242 and this might be modeled in vitro by the mechanical stretching of mesangial cells.243
Pathophysiology of Diabetic Nephropathy
The renal lesions of DN are mainly due to accumulation of ECM components such as collagens, tenascin, and fibronectin.54 ECM accumulation occurs early on in the GBM244 and TBM,43 is the principal cause of mesangial expansion, and also contributes to the later stages of interstitial expansion.49 This ECM accumulation is clearly secondary to an imbalance between synthesis and degradation of ECM components. The ECM changes in diabetes are highly site-specific, differing in direction in the GBM compared to MM55,56 and suggesting that variables related to cell type (e.g., glomerular epithelial cell for GBM, mesangial cell for MM) are important determinants in the response to the diabetic state. Moreover, these patterns of cell response may be genetically regulated, as suggested by concordance in the pattern of glomerular lesions between sib pairs concordant for type 1 diabetes.106
The major hypotheses as to how hyperglycemia causes DN are: (1) increased activity of growth factors, including TGF-β, growth hormone (GH), insulin-like growth factor (IGF), vascular endothelial growth factor (VEGF), and epidermal growth factor (EGF); (2) activation of PKC isoforms; (3) activation of cytokines; (4) formation of reactive oxygen species; (5) increased formation of glycation products; (6) increased activity of the aldose reductase pathway, and (7) decreased glycosaminoglycan content in basement membranes (“Steno hypothesis”). The various hypotheses overlap and intersect with one another. Polyol pathway–induced redox changes or hyperglycemia-induced formation of reactive oxygen species could potentially account for most of the other biochemical abnormalities.245,246 These mechanisms, reviewed later, could be influenced by genetic and epigenetic determinants of susceptibility or resistance to hyperglycemic damage.
Growth Factors
This subject was previously reviewed in detail by Flyvbjerg247 and Chiarelli248 and, using a similar organizational scheme, it is summarized here.
Transforming Growth Factor-β
TGF-β isoforms (TGF-β1, TGF-β2, and TGF-β3) mRNA and proteins and TGF-β receptors mRNA have been demonstrated in all glomerular and in proximal tubular cells.249,250 Glomerular mesangial and epithelial cells exposed in vitro to TGF-β demonstrate increased ECM protein synthesis, including type IV collagen, fibronectin, laminin, and proteoglycans; decreased MMPs synthesis; and increased tissue inhibitors of MMPs (TIMPs) production.251–253 TGF-β1 also stimulates glucose uptake by enhancing the expression of GLUT1 in mesangial cells.205 Increased TGF-β expression in diabetes can be secondary to hyperglycemia, increased intraglomerular pressure, increased formation of glycated proteins, PKC activation, and mechanical strain.248 High glucose increases TGF-β1 mRNA levels in mesangial cells.254 TGF-β neutralizing antibodies reduce the in vitro rise in mesangial-cell type IV collagen synthesis induced by high glucose.255 Further, TGF-β antibodies limited the increases in plasma renal TGF-β1, renal TGF-β1, TGF-β type II receptor, type IV collagen, and fibronectin mRNA expression; prevented the increase in serum creatinine; and reduced the diabetes-associated renal hypertrophy and MM expansion in diabetic mice.256,257 ACE inhibitor (enalapril) treatment decreases TGF-β type I, II, and III receptors in the glomerulus, with no changes in TGF-β isoforms, partially prevents renal hypertrophy, and completely prevents AER increase in diabetic rats.258 Thus, ACE inhibitors may regulate the renal TGF-β system through decreases in TGF-β receptors.258 Interestingly, serum and urinary TGF-β1 levels were not different between diabetic patients with or without renal impairment and were similar to levels observed in patients with nondiabetic renal diseases.259
Growth Hormone and Insulin-Like Growth Factor
Diabetes leads to decreased hepatic production of IGF-1, and the consequent decrease in serum IGF-1 results in excess GH secretion260 that in turn can then stimulate local IGF-1 pathways in other tissues such as the kidney. IGF-1 induces increased mesangial cell proliferation in vitro.261 Increased renal levels of IGF-1 precede renal growth in diabetic rodents. Of note, strict insulin therapy blocks IGF-1 increase and renal hypertrophy in diabetic rats.262 Renal accumulation of IGF-1 is more likely caused by changes in renal IGF-1 receptors and IGF-1 binding proteins (IGFBPs) than by an increase in local kidney IGF-1 production.263,264 Long-acting somatostatin analogues265 and GH-receptor antagonists266,267 prevent the rise in renal IGF-1 and IGFBP-1 mRNA levels and renal hypertrophy in diabetic animals. An IGF-1 receptor antagonist prevented retinal neovascularization and VEGF increase in a rat model of nondiabetic retinopathy,268 arguing that VEGF may be a downstream mediator of IGF-1 actions. This hypothesis is further reinforced by the nuclear factor kappa B (NF-κB) stimulation by both IGF-1 and VEGF in endothelial cells in vitro. NF-κB is involved in the up-regulation of genes encoding for cytokines, growth factors, such as TGF-β, and ECM proteins, such as fibronectin.269
Vascular Endothelial Growth Factor
VEGF increases microvascular permeability270 and has been associated with proliferative retinopathy271,272 and neoangiogenesis273,274 in experimental and human diabetes. VEGF is a potent mitogen for vascular endothelial cells and a major regulator of angiogenesis; hypoxia is a potent VEGF stimulator.275 In the kidney, VEGF is almost exclusively expressed in glomerular and tubular epithelial cells,276,277 whereas the VEGF type-2 receptor (VEGF-R2) is mainly present in glomerular and tubular endothelial cells but also in interstitial cells.277 In high glucose conditions, VEGF and its receptors are also expressed in glomerular endothelial and mesangial cells.278 Glucose stimulates VEGF expression in vitro in vascular smooth279 and mesangial280,281 cells, probably through the PKC pathway.280–282 TGF-β, PKC, and NO enhance VEGF expression in cultured mesangial cells.247,280,281,283 On the other hand, VEGF stimulates NO production by vascular endothelial cells in vitro and in vivo but not by renal mesangial cells in vitro.284 Angiotension II also stimulates VEGF in human mesangial cells.285 Mechanical stretch of human mesangial cells in vitro induces VEGF production,285 possibly linking glomerular hemodynamic abnormalities in diabetes to this system. VEGF is increased in glomeruli in diabetic animals,277 and diabetic rats treated with anti-VEGF neutralizing antibody do not hyperfilter and have less AER increase.286 Plasma and urinary levels of VEGF are increased in microalbuminuric and proteinuric patients with type 1 and type 2 diabetes,274,280,287 but no relationship between VEGF levels and GFR decline was found in proteinuric type 1 diabetic patients followed for 3 years.274 One study showed that improvement in glycemia resulted in a significant reduction of VEGF levels.287 No differences in glomerular VEGF mRNA levels were found between microalbuminuric and proteinuric type 2 diabetic patients with typical or atypical diabetic glomerulopathy.288 Another study found stronger VEGF glomerular epithelial cells immunostaining in type 2 diabetic patients with mild versus more advanced DN or controls.280 VEGF staining was markedly decreased or absent in globally sclerotic glomeruli. However, tubular VEGF staining was more intense in advanced than in mild DN. These could be explained by podocyte loss with consequent decrease in the glomerular VEGF expression.289 Indeed, as is true for neoangiogenesis in diabetic retinopathy,272 VEGF could also be related to increased vascularization around the glomerular pole in DN. Blood vessel growth has been observed in experimental290 and human291 DN. However, the role of VEGF in the pathogenesis of DN is still far from clear, and it is uncertain whether VEGF expression is the cause of pathologic changes or represents a reparative response to preexisting tissue and functional alterations.
Epidermal Growth Factor
EGF is synthesized in the kidney, and EGF receptors are present in mesangial, tubular, and interstitial cells.292 EGF stimulates in vitro tubular cell proliferation293 and influences the synthesis and turnover of ECM proteins, including collagens, fibronectin, laminin, and glycosaminoglycans.294 EGF down-regulates TGF-β receptor expression in many cell types,295,296 suggesting that some of EGF activities are indirect. Other growth factors, including platelet-derived, fibroblast, and nerve growth factors, can modulate the EGF receptor activity.297 The human EGF receptor-1 is phosphorylated by PKC, reducing the affinity of this receptor for EGF. Interestingly, binding of EGF to its receptor leads to inositol-1,4,5-triphosphate and 1,2-diacylglycerol formation,298 stimulating PKC and thus possibly modulating the activity of this system.
Protein Kinase C
The PKC enzyme regulating Na+/K+-ATPase299 has a role in regulating cell proliferation, vascular contractility and permeability, and basement membrane syntheses. PKC can be activated by diacylglycerol300 and thus by high glucose (Fig. 28-15). High glucose–induced PKC activation in glomerular cells in vitro is followed by increased TGF-β301 and MAPK302 activity. Increased type IV collagen expression in mesangial cells in high glucose states is prevented by nonspecific PKC inhibitors,303 and treatment of PKC agonists can increase type IV collagen expression.304 Treatment with a PKCβ inhibitor blocks glomerular TGF-β1 mRNA, MM, GFR, and AER increase in diabetic rodents.305,306 In another study, PKCβ inhibition prevented glomerular hypertrophy and albuminuria without affecting the TGF-β axis in diabetic rats,307 arguing that PKC renal effects in diabetes may at least in part be independent of the TGF-β axis.
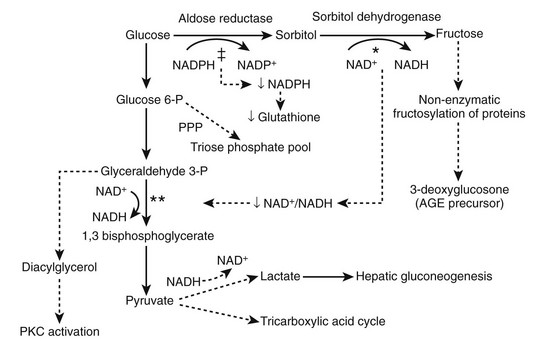
FIGURE 28-15 The effects of increased activity of the polyol pathway. The metabolism of glucose to sorbitol and fructose in the polyol decreases the NADPH/NADP+ and NAD+/NADH ratios. Consumption of NAD+ in the conversion of sorbitol to fructose* may limit 1,3 bisphosphoglycerate formation,** resulting in increased diacylglycerol and protein kinase C (PKC) activation. The consumption of NADPH in the conversion of glucose to sorbitol (‡) may result in decreased production of glutathione, an antioxidant coenzyme used by glutathione peroxidase to reduce peroxide and superoxide levels. PPP, Pentose phosphate pathway. (From Caramori MLA, Mauer M: Pathophysiology of renal complications. In Porte D Jr, Sherwin RS, Baron A [eds]: Ellenberg and Rifkin’s diabetes mellitus, ed 6, New York, 2002, McGraw-Hill, pp 697–722.)
Cytokines
Plasma Prorenin Levels and Diabetic Complications
Renin and its inactive precursor, prorenin, are secreted into the circulation from the kidney.308 Renin is derived almost entirely from the kidney,308 whereas prorenin, while primarily of renal origin, is also produced in other sites.308,309 In diabetic patients with microvascular complications, plasma prorenin levels tend to be markedly elevated, but renin levels tend to be normal or reduced.310–313 Followed serially, only 1 of 20 young patients with type 1 diabetes with consistently normal prorenin levels developed proteinuria or retinopathy, whereas one or both developed in 8 of 14 patients with increased prorenin levels.312 Prorenin was higher in microalbuminuric than in normoalbuminuric type 1 diabetic patients, and all type 1 diabetic patients combined had higher values than controls.313 Most interestingly, the nondiabetic siblings of these microalbuminuric patients had higher prorenin values than the siblings of the normoalbuminuric type 1 diabetic patients.313 In another report, type 1 diabetic patients developing microalbuminuria or proteinuria (progressors) had increased total renin content (which is predominantly prorenin) as early as 10 years before onset of microalbuminuria.314 Other studies also showed that increased plasma prorenin preceded the development of microalbuminuria in patients with type 1315 or type 2316 diabetes. However, this was not confirmed in another study in patients with type 2 diabetes.317 Taken together, these studies suggest that elevated plasma prorenin may be an important predictor of progressive DN.
Angiotensin II
Angiotensin II elevates blood pressure through its direct vasoconstrictor, sympathomimetic, and sodium-retaining (through aldosterone release) activities. Non-hemodynamic effects of angiotensin II on renal cells may also contribute to the progression of DN. Glucose increases angiotensin II production by mesangial cells,318 and angiotensin II in turn stimulates cellular glucose uptake and GLUT1 transcription,319 leading to a high intracellular glucose concentration and its consequences. Angiotensin II also activates PKC in mesangial and tubular cells320 and up-regulates TGF-β receptor expression in mesangial cells in vitro.321 Angiotensin II can stimulate in vitro ECM synthesis through TGF-β activity in mesangial and tubular cells322,323 and can inhibit mesangial cell collagenase activity,324 thus reducing ECM turnover. These effects are blocked by losartan,324 an angiotensin II type 1 receptor antagonist, and by saralasin,323 an angiotensin II competitive inhibitor. Angiotensin II can also stimulate VEGF and endothelin release (see previous discussion), activate NAD/NADP oxidase, and induce superoxide production and hypertrophy by mesangial cells.325 Many of the angiotensin II actions are indirect and dependent on TGF-β or VEGF release. Interestingly, diabetic rats deficient in angiotensin type 1 receptors do not show increased renal TGF-β mRNA levels, supporting the hypothesis that the increase in TGF-β in diabetes is mediated by angiotensin II.326 The relative importance of systemically-derived versus locally generated angiotensin II in the pathogenesis of tissue injury remains controversial327 (see Hemodynamic Mechanisms).
Bradykinin
Bradykinin, the major effector molecule of the kallikrein-kinin system, inhibits angiotensin II formation and prevents degradation of vasodilatory kinins328 and thus could have a protective role on the progression of renal failure. Bradykinin can also increase NO levels.329 Alterations in the kallikrein-kinin system have been found in experimental330 and clinical214 diabetes (see Hemodynamic Mechanisms). Diabetic rats developing proteinuria and reduced GFR show increased serum and urinary levels of bradykinin compared to control animals.331 Type 2 diabetic patients have lower renal kallikrein levels, suggesting that impairment of this system contributes to the development of DN.332 Under physiologic conditions, most of bradykinin’s effects involve bradykinin-B2 receptors.332 A bradykinin-B2 receptor antagonist used alone or in association with an ACE inhibitor (ramipril) or an angiotensin II type 1 receptor blocker (valsartan) had no effect on AER and glomerular ultrastructure (GBM width and Vv[Mes/glom]) in diabetic rats.333 In a previous study, this bradykinin-B2 receptor antagonist reduced hyperfiltration213 and AER334 in diabetic rodents. It has been suggested that modulation of the kallikrein-kinin system by ACE inhibitors may contribute to the renoprotective effect of these drugs. ACE inhibition reduces angiotensin II formation and induces bradykinin accumulation.328 However, a randomized, double-blind, crossover clinical trial in 16 patients with type 1 diabetes did not find differences in AER, GFR, and 24-hour blood pressure between an ACE inhibitor (enalapril) and angiotensin II type 1 receptor blocker (losartan) used for 2 months,335 whereas both drugs reduced AER and blood pressure when compared to placebo. There was no effect on GFR. These studies suggest that the renoprotective effects of ACE inhibitors are independent of bradykinin, insofar as angiotensin II type 1 receptor blockers do not increase bradykinin levels.
Endothelin
Endothelins, potent vasoconstrictors and positive inotropic and chronotropic myocardial agents, increase the plasma levels of a number of vasoactive hormones, such as atrial natriuretic peptide, aldosterone, and catecholamines. They are produced and secreted by endothelial, epithelial, and mesangial cells.336 TGF-β, angiotensin, hypoxia, and hemodynamic shear forces increase endothelin synthesis by vascular endothelial cells.337 On the other hand, endothelins can induce TGF-β synthesis and stimulate mesangial cells, smooth muscle cells, and fibroblast proliferation.336,337 High glucose induces endothelin-1 expression in rat mesangial cells,338 and endothelin stimulation activates MAPKs (extracellular signal-regulated kinases [ERK1 and ERK2]) in a PKC-dependent mechanism.339,340 Reactive oxygen species can also enhance endothelin-1 production in glomeruli of diabetic rats, and reactive oxygen species scavengers suppress endothelin-1 production both in vivo and in vitro.341 Endothelins can also reduce renal blood flow and GFR.342 Diabetic rats have higher urinary endothelin-1 excretion and AER than controls. Treatment with an endothelin-A receptor antagonist,343 insulin,344 and enalapril345 ameliorated the glomerular increase of endothelin-1 mRNA in diabetic rats. Administration of endothelin-A/endothelin-B,346 but not of endothelin-A receptor antagonist,343 reduced AER in diabetic rats. Higher urinary endothelin-1 excretion was reported in patients with type 1 and type 2 diabetes versus nondiabetic controls, and urinary endothelin-1 was correlated with AER and serum albumin in the diabetic patients.347,348 However, other studies found lower urinary excretion and higher plasma endothelin-1 levels in type 2 diabetic patients when compared to controls.349,350
Oxidative Stress
Oxidative stress is increased in diabetes.351 The debate has been whether oxidative stress has a primary role in the pathogenesis of DN.352 Skin fibroblasts from type 1 diabetic patients with DN do not show the expected increase in mRNA expression and activity for catalase and glutathione peroxidase, two antioxidant enzymes, when exposed to a high glucose condition in vitro.353 Catalase converts hydrogen peroxide (H2O2) to oxygen and water, whereas glutathione peroxidase reduces peroxide and superoxide (O2−) levels. Glutathione peroxidase requires a high cellular level of reduced glutathione to be effective. Lipid peroxidation, induced by exposure to high glucose, was also increased in cells of type 1 diabetic patients with DN. These findings suggest that increased oxidative stress in type 1 diabetic patients with DN is at least in part associated with a decreased response of antioxidant enzymes to high glucose. Increased oxidative stress was also demonstrated in families of type 1 diabetic patients,354 suggesting that an abnormal redox state could even precede diabetes onset. Interestingly, erythrocyte glutathione content is correlated to Na+/H+ exchanger (NHE) activity,355 linking oxidative stress to an ion-transport system associated with DN risk.
There is an association between oxidative stress, NO production, and endothelial dysfunction.356,357 Endothelium-derived NO is a potent vasodilator that also has antiatherogenic properties, including inhibition of endothelial platelet and leukocyte adhesion and of smooth muscle cell migration.358 Endogenous NO produced by glomerular capillary endothelial cells may modulate TGF-β production by these cells and also by mesangial cells.357 Endothelial NO synthesis can be stimulated by shear stress and pulsatile vessel stretching,359 hypoxia,360 and by agonists such as acetylcholine and bradykinin.361 Exposure to high glucose concentrations increases eNOS gene expression and NO release, with a concomitant increase in O2° production.362 O2° inactivates and reacts with NO to form peroxynitrite,362 a potent oxidant, leading to endothelial dysfunction.363 Normalization of NO-mediated vasorelaxation in high glucose conditions by superoxide dismutase,364 a scavenger that converts O2° into hydrogen peroxide, further adds to this association. NO suppressed TGF-β activity and abolished TGF-β1 mRNA and collagen synthesis increase in mesangial cells grown under high glucose conditions. Also, in vitro stimulation of inducible nitric oxide synthase (iNOS) activity reduced collagen and fibronectin accumulation in rat mesangial cells.365 NO may also modulate MMP-2 activity in these cells.366 Decreased basal and stimulated NO release and reduced NO bioavailability and vascular smooth muscle cell responsiveness have been shown in diabetes. Hyperglycemia may cause these abnormalities by several mechanisms, including increase in advanced glycation and end-product (AGE) production, polyol pathway and PKC activities, and oxidative stress, as further described later. AGEs can quench NO both in vitro and in vivo,367 decreasing its bioavailability and impairing NO’s antiproliferative effects on mesangial cells.368 Interestingly, aminoguanidine, an AGE crosslink inhibitor, also inhibits NO215 and restores endothelium-dependent relaxation in diabetic rats.367 Increased aldose reductase activity in chronic hyperglycemia causes reduced NADPH, an essential cofactor for NOS, and could thus lead to reduced NO production.356 Increased PKC could also lead to impaired endothelium-dependent relaxation.369
Thus, the increase in intracellular reactive oxygen species (ROS) induced by hyperglycemia may arise from multiple pathways,370 including (1) glucose autoxidation; (2) H2O2 generated from the oxidation of enediols formed from Amadori products; and (3) O2− formed by the mitochondrial oxidation of NADH to NAD+ or during prostaglandin generation (prostaglandin synthase utilizes NADH [and NADPH], generating O2−). Both H2O2 and hydroxyl radicals (·OH) may be derived from O2−. Mitochondrial superoxide overproduction stimulates aldose reductase activity, thus initiating the de novo synthesis of diacylglycerol, activating PKC. Reactive oxygen species can also initiate intracellular AGE formation (see Fig. 28-15). Inhibitors of the mitochondrial electron transport system and manganese superoxide dismutase, an enzyme that leads to reactive oxygen species scavenging in the mitochondrial matrix, inhibit reactive oxygen species production secondary to hyperglycemia. These agents also prevent high glucose–induced PKC and NF-κB activation, methylglyoxal-derived AGEs formation, and sorbitol accumulation through the polyol pathway. This strongly suggests that reactive oxygen species are not only necessary for the damage caused by hyperglycemia, they can also be the link between the several pathophysiologic hypotheses for DN. Recent studies suggest that the high glucose–induced sustained increase in NF-κB p65 unit expression in vitro after cells are transferred to a normal glucose medium is caused by epigenetic modifications. These epigenetic changes are caused by increased generation of methylglyoxal due to hyperglycemia-induced formation of ROS by the mitochondrial electron transport system. Methylglyoxal, the most reactive dicarbonyl AGE-intermediate in cross-linking of proteins, can in turn regenerate reactive oxygen species in the course of glycation reactions.371 In vitro studies demonstrated that vitamin E, an antioxidant, blocks the high glucose–induced increase in PKC, TGF-β bioactivity, collagen, and fibronectin synthesis in mesangial cells.301,372 Taurine, another antioxidant, also inhibits PKC activation,301 TGF-β increase,301 and collagen accumulation373 in rat mesangial cells exposed to high glucose.301 In contrast, vitamin E did not alter the TGF-β induced increase in matrix protein synthesis in mesangial cells.301 Treatment of diabetic rats with antioxidants shows conflicting results. Diabetic rats treated with selenium and vitamin E374 or nitecapone, another antioxidant,375 showed reduction of AER, hyperfiltration, and glomerular lesions. Intraperitoneal injection of vitamin E also prevented glomerular increase of diacylglycerol content, PKC activity, and filtration rate and fraction, and improved AER in diabetic rats.376 However, another study observed less proteinuria, glomerular hypertrophy, glomerulosclerosis, tubulointerstitial fibrosis, and preserved glomerular type IV collagen staining in taurine treated animals, whereas vitamin E–treated animals had extremely high mortality and worse renal lesions.377 In combination with vitamin C, vitamin E administered for 3 months reduced AER in a randomized, double-blind, placebo-controlled clinical trial in type 2 diabetic patients.378 Further studies evaluating the long-term effects of vitamin E supplementation on renal function of patients with diabetes are needed.
Glycosylation Products
Nonenzymatic reactions between reducing sugars, such as glucose, and free amino groups, lipids, or nucleic acids, known as Maillard reactions, are one of the major metabolic effects of diabetes.379,380
Many proteins, including hemoglobin,381 albumin,380 low-density lipoproteins,382 erythrocyte membrane proteins,383 and crystalline lens,384 undergo nonenzymatic glycosylation in diabetes, leading to altered physiochemical properties of these molecules. This early glycation process proceeds through the labile Schiff base adducts formation and intramolecular Amadori rearrangement to become a stable glucose-modified protein. Amadori products comprise the majority of plasmatic glucose-modified proteins, and receptors for some of those modified proteins have been defined.385 Further modifications of Maillard reaction products lead to inter- and intramolecular crosslinks and formation of AGEs. These reactions are complex, and the reader is referred to several excellent reviews for greater detail.386,387
Renal cells grown in high glucose have up-regulation of the TGF-β255,388,389 and PKC304,390 systems and exhibit ECM overproduction.303,391 Amadori-glycated proteins have similar effects, even without high-glucose media. Glomerular epithelial cells exposed to glycated fetal bovine serum show increased laminin and GBM antigens, unchanged type I collagen and fibronectin, and decreased collagenase activity.392 Glycated albumin and high glucose together cause an even greater in vitro increase in TGF-β1, TGF-β type II receptor, α1(IV) collagen, and fibronectin mRNA than either manipulation alone.393,394 Moreover, antibody to glycated albumin prevented the increase in fibronectin and type IV collagen expression in rodent endothelial and mesangial glomerular cells exposed to glycated albumin.379,393,395 Antiglycated albumin antibody administration lowers plasma glycated albumin concentration, reduces AER, and improves glomerular mesangial pathology in db/db diabetic mice.396,397 Treatment with an inhibitor of glycated albumin formation (EXO-226) normalized glycated albumin plasma concentration, reduced AER, prevented GFR decline, and reduced MM accumulation and α1(IV) collagen cortical mRNA expression in db/db mice despite persistent hyperglycemia.398 Blockage of overall PKC or PKC-β activity prevented the glycated albumin-induced increase in type IV collagen production,305,306 consistent with the idea that PKC, particularly the β isoform, plays a role in the glycated-albumin induced ECM accumulation. Type 1 diabetic patients showed higher plasma levels of glycated albumin than nondiabetic controls, and type 1 diabetic patients with DN showed higher plasma levels of Amadori albumin than normoalbuminuric patients.399 However, studies examining the role of Amadori-glycated proteins in the progression of diabetic renal disease have reached conflicting conclusions.400–402
Accumulation of glycation products may be a major contributor to the development of diabetic complications.403–405 Increased AGEs can stimulate the synthesis of various growth factors, including IGF-I and TGF-β. Binding of AGE-proteins to its receptors on cell surfaces induces an intracellular oxidative response in vitro, characterized by increased NF-κB.406
A hallmark of the glomerular changes caused by diabetes is mesangial expansion, mainly due to ECM increase. Mesangial cells exposed to high glucose when the matrix is being made or degraded show reduced rates of mesangium degradation,407 favoring ECM accumulation.408 Human and rat mesangial cells exposed to glycated bovine serum albumin showed increased IGF-1, IGF-2, and TGF-β1 mRNAs, IGF-1 and TGF-β proteins, and ECM (laminin, type IV collagen, and fibronectin) proteins and mRNAs. These effects were prevented by aminoguanidine or by an AGE-receptor 1 antagonist.409 Both high glucose and glycated bovine serum albumin can increase AGE-receptors expression in rat mesangial cells.410 Induction of diabetes increases mRNA expression and immunohistochemistry staining of AGE-receptors in rat glomeruli.410 Further, intraperitoneal AGE-modified mouse albumin increases glomerular TGF-β1 and ECM components mRNA411 and causes glomerular hypertrophy. These effects are reduced by aminoguanidine.411 Oral treatment with aminoguanidine also normalized IGF-1 and IGFBP renal mRNA expression in diabetic rats.412 Aminoguanidine also diminished albuminuria and the increase in collagen-related fluorescence in the aorta, glomeruli, and renal tubules of diabetic rats.405 In this study, aminoguanidine prevented the increase in Vv(Mes/glom) but did not prevent GBM thickening. However, another study found aminoguanidine to ameliorate the GBM thickening but not the Vv(Mes/glom) increase in diabetic rats.413 In similar studies (M.W. Steffes, M. Mauer, unpublished data), aminoguanidine failed to reverse GBM thickening and mesangial expansion in severe longstanding diabetic rats. Novel inhibitors of advanced glycation have been shown to exhibit renoprotective effects similar to aminoguanidine.414,415 OPB-9195 reduced renal TGF-β1, VEGF, and type IV collagen mRNA expression, glomerular TGF-β1, VEGF, type IV collagen, and AGE immunoreactivity, albuminuria, and progressive glomerulosclerosis, without changing glycemia, in an animal model of type 2 diabetes.416,417 Moreover, serum AGE levels were independent predictors of progression of early structural glomerular lesions (Vv[MM/glom]) in microalbuminuric type 1 diabetic patients.418 Pimagedine, a second-generation AGE inhibitor, reduced urinary protein excretion in proteinuric type 1 diabetic patients and also decreased the chances of doubling serum creatinine in patients with an initial creatinine lower than 1.5 mg/dL.419 In a randomized, double-blind, placebo-controlled study, pimagedine significantly reduced proteinuria and the rate of GFR decline in type 1 diabetic patients with nephropathy and retinopathy at baseline.420 Also, fewer pimagedine-treated patients experienced a three-step or greater progression of the retinopathy (Early Treatment of Diabetic Retinopathy Study) score.420 However, some patients receiving high-dose pimagedine developed glomerulonephritis.420
Further studies of glycation’s role in pathogenesis and treatment strategies for DN are warranted. However, the fact that glycation is a nonenzymatic process dependent on the duration and magnitude of glycemia currently leaves unexplained why only about half of patients with very poor glycemic control develop clinical DN.94
Increased Activity of Aldose Reductase
Aldose reductase, the enzyme that catalyses the reduction of glucose to sorbitol in the polyol pathway (see Fig. 28-15), has been associated with DN and other microvascular complications. Aldose reductase, not present in all mammalian cells, is present in all the target tissues of diabetic complications. These tissues include kidney, lens, retinal capillary wall pericytes, vascular endothelium, and peripheral nerve (Schwann cells). Increased activity of aldose reductase leads to accumulation of sorbitol, which is further converted to fructose by the sorbitol dehydrogenase enzyme, using NAD+ as substrate. The NAD+/NADH ratio decreases, and the conversion of glyceraldehyde 3-phosphate to 1,3 bisphosphoglycerate is blocked, leaving more substrate (glyceraldehyde 3-phosphate) for the synthesis of α-glycerol phosphate, a diacylglycerol precursor. Diacylglycerol is a PKC activator that, as discussed, could regulate ECM synthesis and removal. Also, increased activity of aldose reductase consumes NADPH, leading to decreased or depleted glutathione. As already noted, glutathione is used by glutathione peroxidase to reduce peroxides or O2°, yielding oxidized glutathione. Glutathione can also act as a detoxificant for carbonyl compounds.352 Hypertonicity stimulates aldose reductase gene expression, and kinases (p38-MAPK and ERKs) appear to be involved in the regulation of this response.421 Both glucose and H2O2 activate p38-MAPK in vitro, suggesting that increased glucose may contribute to increased aldose reductase expression independently of hyperosmotic conditions. PKC also has a role in controlling aldose reductase gene transcription.422 Moreover, reactive oxygen species decrease NO content, which activates aldose reductase. Increased aldose reductase activity may also contribute to impaired renal autoregulation.423 An aldose reductase inhibitor prevented type IV collagen and fibronectin accumulation in human renal proximal tubular cells exposed to high glucose.424 Treatment of diabetic animals with aldose reductase inhibitors have generated divergent results.425–427 One study showed prevention of renal and glomerular hypertrophy but not GBM thickening,428 while another reported prevention of mesangial expansion.429 Tolrestat, an aldose reductase inhibitor, prevented increased GFR, AER, and glomerular hypertrophy and attenuated the accumulation of basement membrane–like material in diabetic rats, with no effect on mesangium expansion.430 Peripheral blood mononuclear cell aldose reductase mRNA levels are increased in patients with type 1 diabetes and DN but not in diabetic patients without nephropathy.431 Aldose reductase inhibitors have a partial432–434 or no435,436 effect in ameliorating renal microvascular complications in human studies.
The Steno Hypothesis
According to the Steno hypothesis, albuminuria reflects widespread vascular damage.437 Hyperglycemia, by decreasing the synthesis of and reducing sulfation levels can lead to partial depletion of heparan sulfate,438 the main glycosaminoglycan component of glomerular basement membranes.439 Reduced renal heparan sulfate can decrease the glomerular capillary wall electrostatic charge barrier.440 Abnormal glomerular charge permselectivity has been observed in diabetic rats441 and humans,442 suggesting that loss of glomerular capillary-wall proteoglycans may be responsible for the initial increase in the excretion of negatively charged albumin.439,443 Changes in heparan sulfate have also been associated with other diabetic complications.444,445 Administration of a modified heparin glycosaminoglycan preparation to mesangial cells exposed to high glucose in vitro caused inhibition of TGF-β1 overexpression, probably through inhibition of the glucose-induced PKC activation.446 The changes in the balance of α1(IV) collagen, MMP-2, and TIMP-2 in human and murine cells exposed to high glucose were partially reversed by heparin supplementation.447 Animal studies have shown that subcutaneous administration of low molecular weight heparin, perhaps by inducing heparin sulfate synthesis, prevented increased AER, GBM, and α1(IV) collagen expression and deposition in diabetic rats.448–450 Reduction in AER was also reported after treatment with subcutaneous low molecular weight heparin or similar drugs in microalbuminuric and proteinuric type 1451–454 and type 2455 diabetic patients, but the results are still controversial.456 Danaparoid, a mixture of sulfated glycosaminoglycan consisting mainly of heparan sulfate, not only decreased AER453 but also reduced retinal hard exudates in proteinuric type 1 diabetic patients.457 These studies suggest that decreased glycosaminoglycans can have a pathogenetic role in the development of diabetic complications. However, it is also clear from earlier discussions (see Kidney Structure in Diabetes section) that important DN lesions can develop in patients with normal glomerular permselectivity. Thus, measurably abnormal glomerular permselectivity is not necessary for the genesis of DN lesions.