Cardiovascular Diagnostic Procedures
Mary E. Lough and Christine Thompson
Cardiovascular Assessment and Monitoring
Bedside Hemodynamic Monitoring
Equipment
A traditional hemodynamic monitoring system has four component parts as shown in Figure 14-1 and described in the following list:
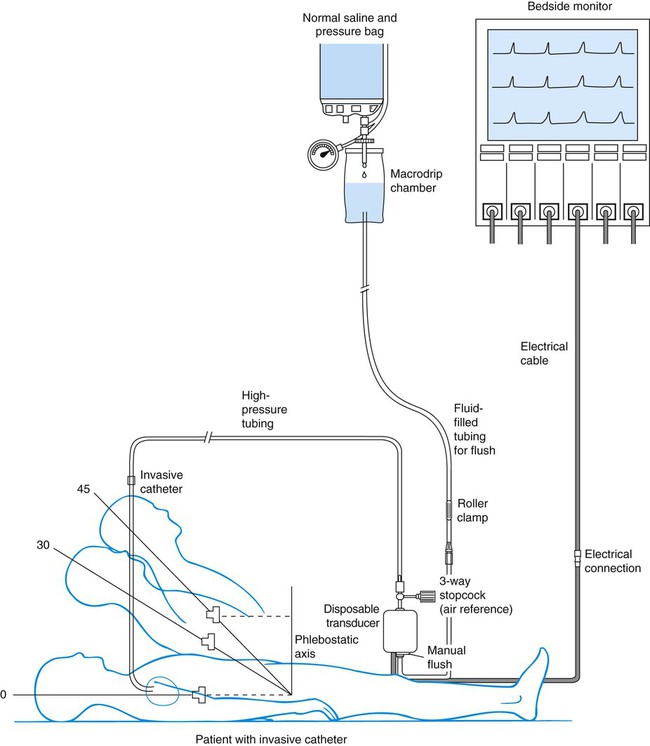
1. An invasive catheter and high-pressure tubing connect the patient to the transducer.
2. The transducer receives the physiologic signal from the catheter and tubing and converts it into electrical energy.
3. The flush system maintains patency of the fluid-filled system and catheter.
4. The bedside monitor contains the amplifier with recorder, which increases the volume of the electrical signal and displays it on an oscilloscope and on a digital scale in millimeters of mercury (mm Hg).
Although many different types of invasive catheters can be inserted to monitor hemodynamic pressures, all such catheters are connected to similar equipment (see Fig. 14-1). Even so, there remains variation in the way different hospitals configure their hemodynamic systems. The basic setup consists of the following:
• A bag of 0.9% sodium chloride (normal saline) is used as a flush solution. In some hospitals heparin is added as an anticoagulant. A pressure infusion cuff covers the bag of flush solution and is inflated to 300 mm Hg.
• The system contains intravenous tubing, three-way stopcocks, and an in-line flow device attached for continuous fluid infusion and manual flush. High-pressure tubing must be used to connect the invasive catheter to the transducer to prevent damping (flattening) of the waveform.
• A pressure transducer is used. Modern transducers are disposable, use a silicon chip, and are highly accurate.
Heparin.
The use of the anticoagulant heparin added to the normal saline (NS) flush setup to maintain catheter patency remains controversial.1,2 While many units do add heparin to flush solutions, other critical care units avoid heparin because of concern about development of heparin-induced antibodies that can trigger the autoimmune condition known as heparin-induced thrombocytopenia (HIT).2 This is sometimes described as a “heparin allergy” and, when present, is associated with a dramatic drop in platelet count and thrombus formation. If heparin is used in the flush infusion, ongoing monitoring of the platelet count is recommended.3
Flush solutions, lines, stopcocks, and disposable transducers are changed every 96 hours per current Centers for Disease Control and Prevention (CDC) guidelines.4 However, there is variation in practice between hospitals; some change the flush solutions every 24 hours. For this reason, it is essential to be familiar with the specific written procedures that concern hemodynamic monitoring equipment in each critical care unit. Dextrose solutions are not recommended as flush solutions in monitoring catheters.4
Phlebostatic Axis.
The phlebostatic axis is a physical reference point on the chest that is used as a baseline for consistent transducer height placement. To locate the level of the phlebostatic axis, an imaginary vertical line is drawn from the fourth intercostal space where it joints the sternum to a horizontal line that is midway between the anterior and posterior chest walls. The midaxillary line is one half of the anteroposterior depth of the lateral chest wall.5 This point approximates the level of the atria, as shown in Figure 14-1. It is used as the reference mark for central venous pressure (CVP) and pulmonary artery catheter transducers. The level of the transducer “air reference stopcock” approximates the position of the tip of an invasive hemodynamic monitoring catheter within the chest.
Leveling the Transducer.
Leveling the transducer is different from zeroing. This process aligns the transducer with the level of the left atrium. The purpose is to line up the air–fluid interface with the left atrium to correct for changes in hydrostatic pressure in blood vessels above and below the level of the heart.5
A carpenter’s level or laser-light level can be used to ensure that the transducer is parallel with the phlebostatic axis reference point. When there is a change in the patient’s position, the transducer must be leveled again to ensure accurate hemodynamic pressure measurements are obtained.5 Errors in measurement can occur if the transducer is placed below the phlebostatic axis because the fluid in the system weighs on the transducer, creating additional hydrostatic pressure, and produces a falsely high reading. For every inch the transducer is below the tip of the catheter, the fluid pressure in the system increases the measurement by 1.87 mm Hg. For example, if the transducer is positioned 6 inches below the tip of the catheter, this falsely elevates the displayed pressure by 11 mm Hg.
If the transducer is placed above this atrial level, gravity and lack of fluid pressure will give an erroneously low reading. For every inch the transducer is positioned above the catheter tip, the measurement is 1.87 mm Hg less than the true value. If several clinicians are taking measurements, the reference point can be marked on the side of the patient’s chest to ensure accurate measurements. Box 14-1 summarizes other nursing activities associated with hemodynamic monitoring.
 Box 14-1
NIC
Invasive Hemodynamic Monitoring
Assist with insertion and removal of invasive hemodynamic lines
Assist with Allen test for evaluation of collateral ulnar circulation before radial artery cannulation, if appropriate
Assist with chest radiograph examination after insertion of pulmonary artery catheter
Zero and calibrate equipment every 4 to 12 hours, as appropriate, with transducer at the level of the right atrium
Monitor blood pressure (systolic, diastolic, and mean), central venous/right atrial pressure, pulmonary artery pressure (systolic, diastolic, and mean), and pulmonary capillary/artery wedge pressure
Monitor hemodynamic waveforms for changes in cardiovascular function
Compare hemodynamic parameters with other clinical signs and symptoms
Use closed-system cardiac output setup
Obtain cardiac output by administering cardiac output injectate within 4 seconds, and average three injections that are within less than 1 L of each other
Monitor pulmonary artery and systemic arterial waveforms; if dampening occurs, check tubing for kinks or air bubbles, check connections, aspirate clot from tip of catheter, gently flush system, or assist with repositioning of catheter
Document pulmonary artery and systemic arterial waveforms
Monitor peripheral perfusion distal to catheter insertion site every 4 hours or as appropriate
Monitor for dyspnea, fatigue, tachypnea, and orthopnea
Monitor for forward progression of pulmonary catheter resulting in spontaneous wedge, and notify physician if it occurs
Refrain from inflating balloon more frequently than every 1 to 2 hours, or as appropriate
Monitor for balloon rupture (e.g., assess for resistance when inflating balloon and allow balloon to passively deflate after obtaining pulmonary artery occlusion pressure [PAOP])
Prevent air emboli (e.g., remove air bubbles from tubing; if balloon rupture is suspected, refrain from attempts to reinflate balloon and clamp balloon port)
Maintain closed-pressure system to ports, as appropriate
Perform sterile dressing changes and site care, as appropriate
Inspect insertion site for signs of bleeding or infection
Change IV solution and tubing every 24 to 96 hours, based on protocol
Monitor laboratory results to detect possible catheter-induced infection
Administer fluid and/or volume expanders to maintain hemodynamic parameters within specified range
Administer pharmacologic agents to maintain hemodynamic parameters within specified range
Instruct patient and family on therapeutic use of hemodynamic monitoring catheters
Instruct patient on activity restriction while catheters remain in place
Modified from Bulechek GM, et al. Nursing interventions classification (NIC). 6th ed. St. Louis: Mosby; 2013.
Patient Position
Head of Bed Backrest Position.
Nurse researchers have determined that the CVP, pulmonary artery pressure (PAP), and pulmonary artery occlusion pressure (PAOP)—also called pulmonary artery wedge pressure (PAWP)—can be reliably measured at head of bed backrest positions from 0 (flat) to 60 degrees if the patient is lying on his or her back (supine).5,6 If the patient is normovolemic and hemodynamically stable, raising the head of the bed usually does not affect hemodynamic pressure measurements. If the patient is so hemodynamically unstable or hypovolemic that raising the head of the bed negatively affects intravascular volume distribution, the first priority is to correct the hemodynamic instability and leave the patient in a lower backrest position. In summary, most patients do not need the head of the bed to be lowered to 0 degrees to obtain accurate CVP, PAP, or PAOP readings.
Lateral Position.
The landmarks for leveling the transducer are different if the patient is turned to the side. Researchers have evaluated hemodynamic pressure measurement readings with the patients in the 30- and 90-degree lateral positions with the head of the bed flat, and they found the measurements to be reliable.5 In the 30-degree angle position, the landmark to use for leveling the transducer is one half of the distance from the surface of the bed to the left sternal border.5 In the 90-degree right-lateral position, the transducer fluid–air interface was positioned at the fourth ICS at the midsternum. In the 90-degree left-lateral position, the transducer was positioned at the left parasternal border (beside the sternum).5 It is important to know that measurements can be recorded in nonsupine positions, because critically ill patients must be turned to prevent development of pressure ulcers and other complications of immobility.
Intra-arterial Blood Pressure Monitoring
Indications
Catheters
1. Entry into the artery using a needle
2. Passage of a supple guidewire through the needle into the artery
4. Passage of the catheter over the guidewire
5. Removal of the guidewire, leaving the catheter in the artery
Insertion and Allen Test.
Several major peripheral arteries are suitable for receiving a catheter and for long-term hemodynamic monitoring. The most frequently used site is the radial artery.2 The femoral artery is a larger vessel that is also frequently cannulated. Other smaller arterials such as the dorsalis-pedis, axillary, or brachial arteries are avoided if possible, and only used when other arterial access is unavailable.
The major advantage of the radial artery is the supply of collateral circulation to the hand provided by the ulnar artery through the palmar arch in most people. Before radial artery cannulation, collateral circulation must be assessed by using Doppler flow or by the modified Allen test according to institutional protocol.2,7 In the Allen test the radial and ulnar arteries are compressed simultaneously. The patient is asked to clench and unclench the hand until it blanches. One of the arteries is then released, and the hand should immediately flush from that side. The same procedure is repeated for the remaining artery.
Nursing Management
Intra-arterial blood pressure monitoring is designed for continuous assessment of arterial perfusion to the major organ systems of the body. MAP is the clinical parameter most often used to assess perfusion, because MAP represents perfusion pressure throughout the cardiac cycle. Because one third of the cardiac cycle is spent in systole and two thirds in diastole, the MAP calculation must reflect the greater amount of time spent in diastole.8 This MAP formula can be calculated by hand or with a calculator, where diastole times 2 plus systole is divided by 3 as shown in the formula below:
< ?xml:namespace prefix = "mml" />

A blood pressure of 120/60 mm Hg produces a MAP of 80 mm Hg. However, the bedside hemodynamic monitor may show a slightly different digital number because bedside monitoring computers calculate the area under the curve of the arterial line tracing8 (Table 14-1).
TABLE 14-1
HEMODYNAMIC PRESSURES AND CALCULATED HEMODYNAMIC VALUES
| HEMODYNAMIC PRESSURE | DEFINITION AND EXPLANATION | NORMAL RANGE |
| Mean arterial pressure (MAP) | Average perfusion pressure created by arterial blood pressure during the cardiac cycle. The normal cardiac cycle is one third systole and two thirds diastole. These three components are divided by 3 to obtain the average perfusion pressure for the whole cardiac cycle. | 70-100 mm Hg |
| Central venous pressure (CVP) | Pressure created by volume in the right side of the heart. When the tricuspid valve is open, the CVP reflects filling pressures in the right ventricle. Clinically, the CVP is often used as a guide to overall fluid balance. | 2-5 mm Hg 3-8 cm water (H2O) |
| Left atrial pressure (LAP) | Pressure created by the volume in the left side of the heart. When the mitral valve is open, the LAP reflects filling pressures in the left ventricle. Clinically, the LAP is used after cardiac surgery to determine how well the left ventricle is ejecting its volume. In general, the higher the LAP, the lower the ejection fraction from the left ventricle. | 5-12 mm Hg |
| Pulmonary artery pressure (PAP) PA systolic (PAS) PA diastolic (PAD) PAP mean (PAPm) |
Pulsatile pressure in the pulmonary artery measured by an indwelling catheter. | PAS 20-30 mm Hg PAD 5-10 mm Hg PAPm 10-15 mm Hg |
| Pulmonary artery occlusion pressure (PAOP)* | Pressure created by the volume in the left side of the heart. When the mitral valve is open, the PAOP reflects filling pressures in the pulmonary vasculature, and pressures in the left side of the heart are transmitted back to the catheter “wedged” into a small pulmonary arteriole. | 5-12 mm Hg |
| Cardiac output (CO) | Amount of blood pumped out by a ventricle over 1 minute. Clinically, it can be measured using the thermodilution CO method, which calculates CO in liters per minute (L/min). | 4-6 L/min (at rest) |
| Cardiac index (CI) | CO divided by the body surface area (BSA), with tailoring of CO to individual body size. A BSA conversion chart is necessary to calculate CI, which is considered more accurate than CO because it is individualized to height and weight. CI is measured in liters per minute per square meter of BSA (L/min/m2). | 2.2-4.0 L/min/m2 |
| Stroke volume (SV) | Amount of blood ejected by the ventricle with each heartbeat, expressed in milliliters (mL). Hemodynamic monitoring systems calculate SV by dividing cardiac output (CO in L/min) by the heart rate (HR) and then multiplying the answer by 1000 to change liters to milliliters (mL). | 60-70 mL |
| Stroke volume index (SI) | SV indexed to the BSA. | 40-50 mL/m2 |
| Systemic vascular resistance (SVR) | Mean pressure difference across the systemic vascular bed divided by blood flow. Clinically, SVR represents the resistance against which the left ventricle must pump to eject its volume. This resistance is created by the systemic arteries and arterioles. As SVR increases, CO falls. SVR is measured in Wood units or dyn·sec·cm−5. If the number of Wood units is multiplied by 80, the value is converted to dyn·sec·cm−5. | 10-18 Wood units or 800-1400 dyn·sec·cm−5 |
| Systemic vascular resistance index (SVRI) | SVR indexed to BSA. | 2000-2400 dyn·sec·cm−5 |
| Pulmonary vascular resistance (PVR) | Mean pressure difference across pulmonary vascular bed divided by blood flow. Clinically, PVR represents the resistance against which the right ventricle must pump to eject its volume. This resistance is created by the pulmonary arteries and arterioles. As PVR increases, the output from the right ventricle decreases. PVR is measured in Wood units or dyn·sec·cm−5. PVR is normally one sixth of SVR. | 1.2-3.0 Wood units or 100-250 dyn·sec·cm−5 |
| Pulmonary vascular resistance index (PVRI) | PVR indexed to BSA. | 225-315 dyn·sec·cm−5/m2 |
| Left cardiac work index (LCWI) | Amount of work the left ventricle does each minute when ejecting blood. The hemodynamic formula represents pressure generated (MAP) multiplied by volume pumped (CO). A conversion factor is used to change mm Hg to kilogram-meter (kg-m). LCWI is always represented as an indexed volume (BSA chart). LCWI increases or decreases because of changes in pressure (MAP) or volume pumped (CO). | 3.4–4.2 kg-m/m2 |
| Left ventricular stroke work index (LVSWI) | Amount of work the left ventricle performs with each heartbeat. The hemodynamic formula represents pressure generated (MAP) multiplied by volume pumped (SV). A conversion factor is used to change mL/mm Hg to gram-meter (g-m). LVSWI is always represented as an indexed volume. LVSWI increases or decreases because of changes in the pressure (MAP) or volume pumped (SV). | 50-62 g-m/m2 |
| Right cardiac work index (RCWI) | Amount of work the right ventricle performs each minute when ejecting blood. The hemodynamic formula represents pressure generated (PAP mean) multiplied by volume pumped (CO). A conversion factor is used to change mm Hg to kilogram-meter (kg-m). RCWI is always represented as an indexed value (BSA chart). Similar to LCWI, the RCWI increases or decreases because of changes in the pressure (PAP mean) or volume pumped (CO). | 0.54-0.66 kg-m/m2 |
| Right ventricular stroke work index (RVSWI) | Amount of work the right ventricle does each heartbeat. The hemodynamic formula represents pressure generated (PAP mean) multiplied by volume pumped (SV). A conversion factor is used to change mm Hg to gram-meter (g-m). RVSWI is always represented as an indexed value (BSA chart). Similar to LVSWI, the RVSWI increases or decreases because of changes in the pressure (PAP mean) or volume pumped (SV). | 7.9-9.7 g-m/m2 |
*Pulmonary artery occlusion pressure (PAOP) was formerly called pulmonary capillary wedge pressure (PCW or PCWP) or pulmonary arterial wedge pressure (PAWP).
Infection.
Infection was once believed to be rare in arterial catheters because of the rapid arterial blood flow. New evidence suggests that arterial catheters are associated with the same risk of bloodstream infections as central venous catheters (CVCs).9 This means that infection prevention measures must be just as meticulous for arterial catheters as for CVCs.9
Cuff Blood Pressure.
If the arterial line becomes unreliable or dislodged, a cuff pressure can be used as a reserve system.10 In the normotensive, normovolemic patient, little difference exists between the arm cuff blood pressure and the intravascular catheter pressure, and differences of 5 to 10 mm Hg do not generally alter clinical management. The situation is different if the patient has a low CO or is in shock. The concern is that the cuff pressure may be unreliable because of peripheral vasoconstriction, and an arterial line is generally required. It is usual practice to compare a cuff pressure after the arterial line is inserted. A recent study in hypotensive patients found that a MAP calculated from the arm cuff blood pressure was comparable to the intravascular arterial MAP.11 However, blood pressure cuffs placed on the thigh or ankle were less accurate in hypotensive patients.11
Arterial Pressure Waveform Interpretation
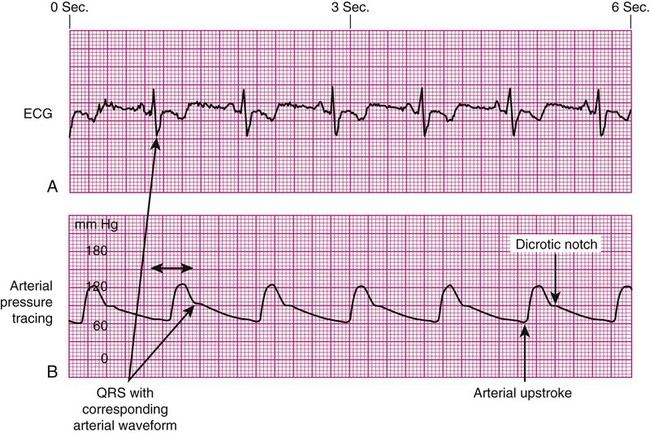
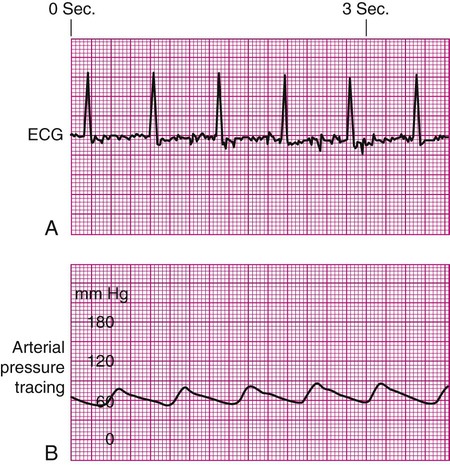
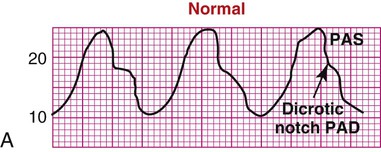
As the aortic valve opens, blood is ejected from the left ventricle and is recorded as an increase of pressure in the arterial system. The highest point recorded is called systole. After peak ejection (systole), the force decreases, and the pressure drops. A notch (dicrotic notch) may be visible on the downstroke of this arterial waveform, representing closure of the aortic valve. The dicrotic notch signifies the beginning of diastole. The remainder of the downstroke represents diastolic runoff of blood flow into the arterial tree. The lowest point recorded is called diastole. A normal arterial pressure tracing is shown in Figure 14-2. Notice that electrical stimulation (QRS) is always first and that the arterial pressure tracing follows the initiating QRS.
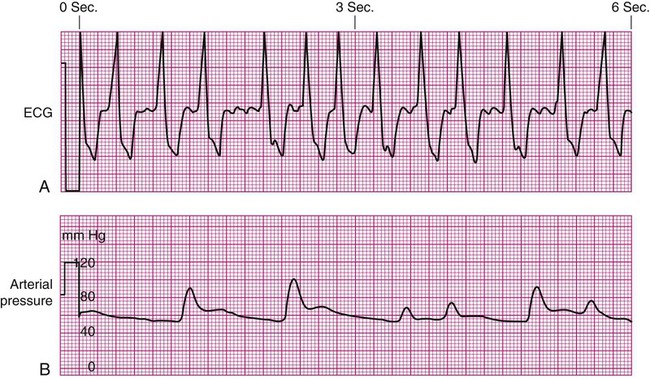
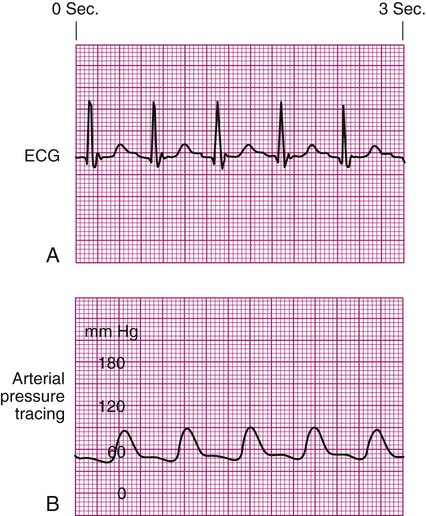
Decreased Arterial Perfusion.
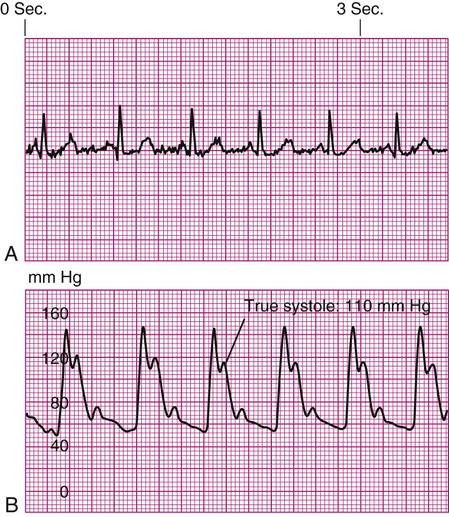
Specific problems with heart rhythm can translate into poor arterial perfusion if CO decreases. Poor perfusion may be seen as a single, nonperfused beat after a premature ventricular contraction (PVC) (Fig. 14-3) or as multiple, nonperfused beats (Fig. 14-4). In ventricular bigeminy, every second beat is poorly perfused (Fig. 14-5). A disorganized atrial baseline resulting from atrial fibrillation creates a variable arterial pulse because of the differences in stroke volume (SV) between each beat (Fig. 14-6). All of these examples illustrate that when two beats are close together, the left ventricle does not have time to fill adequately, and the second beat is inadequately perfused or is not perfused at all.
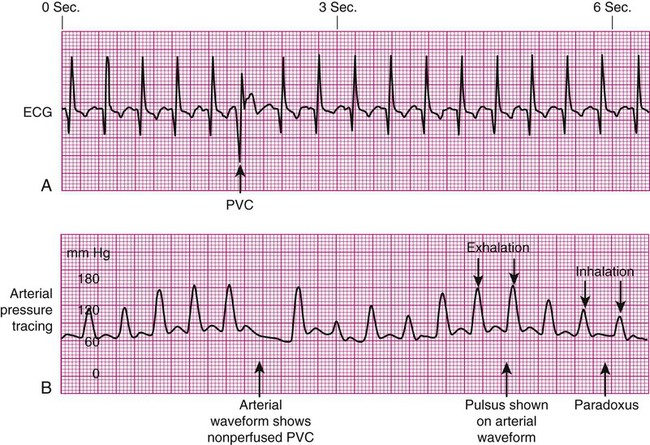
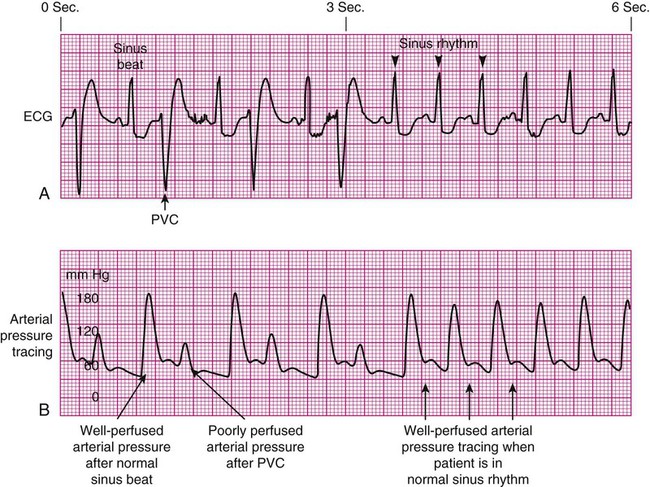
Pulse Deficit.
A pulse deficit occurs when the apical HR and the peripheral pulse are not equal. In the critical care unit, this can be seen on the bedside monitor. Normally, there is one arterial upstroke for each QRS, and if there are more QRS complexes than arterial upstrokes, a pulse deficit is present, as shown in Figures 14-3 and 14-6. To identify a pulse deficit in an unmonitored patient, a stethoscope is placed over the apex of the heart. The heartbeat can be heard, but it cannot be felt as a radial pulse. To determine whether a pulse deficit is significant, it is necessary to evaluate the clinical impact on the patient and whether any change in MAP or pulse pressure has occurred. Generally, the more nonperfused beats, the more serious the problem.
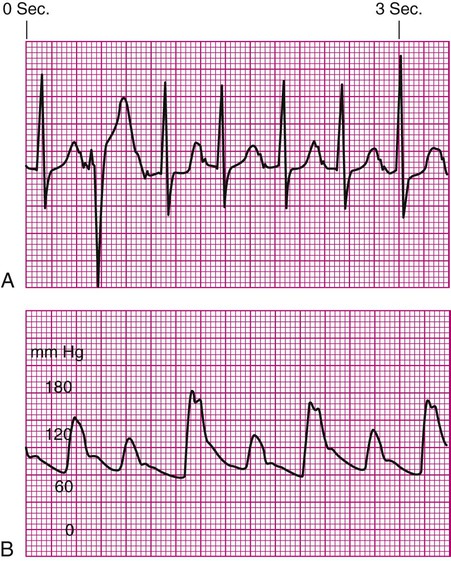
Pulsus Paradoxus.
Pulsus paradoxus is a decrease of more than 10 mm Hg in the arterial waveform that occurs during inhalation (inspiration). It is caused by a fall in CO as a result of increased negative intrathoracic pressure during inhalation. As pressure within the thorax falls, blood pools in the large veins of the lungs and thorax, and SV is decreased. The procedure for identification of pulsus paradoxus is discussed in Chapter 13 (see Box 13-9).
In certain clinical conditions, the pulsus paradoxus is obvious and can be clearly seen on an arterial waveform. It can be used as a clinical diagnostic test in a patient with cardiac tamponade, pericardial effusion, or constrictive pericarditis.12 Pulsus paradoxus commonly occurs in hypovolemic surgical patients who are mechanically ventilated with large tidal volumes (see Fig. 14-3).
Damped Waveform.
If the arterial monitor shows a low blood pressure, it is the responsibility of the nurse to determine whether it is a patient problem or a problem with the equipment, as described in Table 14-2. A low arterial blood pressure waveform is shown in Figure 14-7. In this case, the digital readout correlated well with the patient’s cuff pressure, confirming that the patient was hypotensive. This arterial waveform is more rounded, without a dicrotic notch, compared with the normal waveform in Figure 14-2. A damped (flattened) arterial waveform is shown in Figure 14-8. In this case, the patient’s cuff pressure was significantly higher than the digital readout, representing a problem with equipment. A damped waveform occurs when communication from the artery to the transducer is interrupted and produces false values on the monitor and oscilloscope. Damping is caused by a fibrin “sleeve” that partially occludes the tip of the catheter, by kinks in the catheter or tubing, or by air bubbles in the system. Troubleshooting techniques (see Table 14-2) are used to find the origin of the problem and to remove the cause of damping.
TABLE 14-2
| PROBLEM | PREVENTION | RATIONALE | TROUBLESHOOTING |
| Overdamping of waveform | Provide continuous infusion of solution containing heparin through an in-line flush device (1 unit of heparin for each 1 mL of flush solution). | Ensure that recorded pressures and waveform are accurate because a damped waveform gives inaccurate readings. | Before insertion, completely flush the line and/or catheter. In a line attached to a patient, back flush through the system to clear bubbles from tubing or transducer. |
| Underdamping (“overshoot” or “fling”) | Use short lengths of noncompliant tubing. Use fast-flush square wave test to demonstrate optimal system damping. Verify arterial waveform accuracy with the cuff blood pressure. | If the monitoring system is underdamped, the systolic and diastolic values will be overestimated by the waveform and the digital values. False high systolic values may lead to clinical decisions based on erroneous data. | Perform the fast-flush square wave test to verify optimal damping of the monitoring system. |
| Clot formation at end of the catheter | Provide continuous infusion of solution containing heparin through an in-line flush device (1 unit of heparin for each 1 mL of flush solution). | Any foreign object placed in the body can cause local activation of the patient’s coagulation system as a normal defense mechanism. The clots that are formed may be dangerous if they break off and travel to other parts of the body. | If a clot in the catheter is suspected because of a damped waveform or resistance to forward flush of the system, gently aspirate the line using a small syringe inserted into the proximal stopcock. Flush the line again after the clot is removed, and inspect the waveform. It should return to a normal pattern. |
| Hemorrhage | Use Luer-Lock (screw) connections in line setup. Close and cap stopcocks when not in use. Ensure that the catheter is sutured or securely taped in position. |
A loose connection or open stopcock creates a low-pressure sump effect, causing blood to back into the line and into the open air. If a catheter is accidentally removed, the vessel can bleed profusely, especially with an arterial line or if the patient has abnormal coagulation factors (resulting from heparin in the line) or has hypertension. | After a blood leak is recognized, tighten all connections, flush the line, and estimate blood loss. If the catheter has been inadvertently removed, put pressure on the cannulation site. When bleeding has stopped, apply a sterile dressing, estimate blood loss, and inform the physician. If the patient is restless, an armboard may protect lines inserted in the arm. |
| Air emboli | Ensure that all air bubbles are purged from a new line setup before attachment to an indwelling catheter. Ensure that the drip chamber from the bag of flush solution is more than one half full before using the in-line, fast-flush system. Some sources recommend removing all air from the bag of flush solution before assembling the system. |
Air can be introduced at several times, including when central venous pressure (CVP) tubing comes apart, when a new line setup is attached, or when a new CVP or pulmonary artery (PA) line is inserted. During insertion of a CVP or PA line, the patient may be asked to hold his or her breath at specific times to prevent drawing air into the chest during inhalation. The in-line, fast-flush devices are designed to permit clearing of blood from the line after withdrawal of blood samples. If the chamber of the intravenous tubing is too low or empty, the rapid flow of fluid will create turbulence and cause flushing of air bubbles into the system and into the bloodstream. |
Because it is impossible to get the air back after it has been introduced into the bloodstream, prevention is the best cure. If air bubbles occur, they must be vented through the in-line stopcocks and the drip chamber must be filled. The left atrial pressure (LAP) line setup is the only system that includes an air filter specifically to prevent air emboli. |
| Normal waveform with low digital pressure | Ensure that the system is calibrated to atmospheric pressure. | To provide a 0 baseline relative to atmospheric pressure. | Recalibrate the equipment if transducer drift has occurred. |
| Ensure that the transducer is placed at the level of the phlebostatic axis. | If the transducer has been placed higher than the phlebostatic level, gravity and the lack of hydrostatic pressure will produce a false low reading. | Reposition the transducer at the level of the phlebostatic axis. Misplacement can occur if the patient moves from the bed to the chair or if the bed is placed in a Trendelenburg position. | |
| Normal wave form with high digital pressure | Ensure that the system is calibrated to atmospheric pressure. Ensure that the transducer is placed at the level of the phlebostatic axis. |
To provide a 0 baseline relative to atmospheric pressure. If the transducer has been placed lower than the phlebostatic level, the weight of hydrostatic pressure on the transducer will produce a false high reading. |
Recalibrate the equipment if transducer drift has occurred. Reposition the transducer at the level of the phlebostatic axis. This situation can occur if the head of the bed was raised and the transducer was not repositioned. Some centers require attachment of the transducer to the patient’s chest to avoid this problem. |
| Loss of waveform | Always have the hemodynamic waveform monitored so that changes or loss can be quickly noted. | The catheter may be kinked, or a stopcock may be turned off. | Check the line setup to ensure that all stopcocks are turned in the correct position and that the tubing is not kinked. Sometimes, the catheter migrates against a vessel wall, and having the patient change position restores the waveform. |

Underdamped Waveform.
Another cause of arterial waveform distortion is underdamping, also called overshoot or fling. Underdamping is recognized by a narrow, upward systolic peak that produces a falsely high systolic reading compared with the patient’s cuff blood pressure, as shown in Figure 14-9. The overshoot is caused by an increase in dynamic response or increased oscillations within the system.
Fast-Flush Square Waveform Test.
The monitoring system’s dynamic response can be verified for accuracy at the bedside by the fast-flush square waveform test, also called the dynamic frequency response test.5 The nurse performs this test to ensure that the patient pressures and waveform shown on the bedside monitor are accurate.5 The test makes use of the manual flush system on the transducer. Normally, the flush device allows only 3 mL of fluid/hr. With the normal waveform displayed, the manual fast-flush procedure is used to generate a rapid increase in pressure, which is displayed on the monitor oscilloscope. As shown in Figure 14-10, the normal dynamic response waveform shows a square pattern with one or two oscillations before the return of the arterial waveform. If the system is overdamped, a sloped (rather than square) pattern is seen. If the system is underdamped, additional oscillations—or vibrations—are seen on the fast-flush square wave test. This test can be performed with any hemodynamic monitoring system. If air bubbles, clots, or kinks are in the system, the waveform becomes damped, or flattened, and this is reflected in the square waveform result.
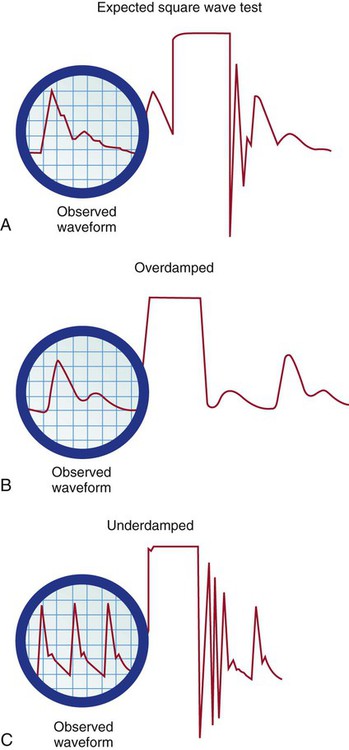
A, Expected square wave test result. B, Overdamped. C, Underdamped. (From Darovic GO. Hemodynamic Monitoring: Invasive and Noninvasive Clinical Application. 3rd ed. Philadelphia: WB Saunders; 2002.)
This is an easy test to perform, and it should be incorporated into nursing care procedures at the bedside when the hemodynamic system is first set up, at least once per shift, after opening the system for any reason, and when there is concern about the accuracy of the waveform.5 If the pressure waveform is distorted or the digital display is inaccurate, the troubleshooting methods described in Table 14-2 can be implemented. The nurse caring for the patient with an arterial line must be able to assess whether a low MAP or narrowed perfusion pressure represents decreased arterial perfusion or equipment malfunction. Assessment of the arterial waveform on the oscilloscope, in combination with clinical assessment, and use of the square waveform test will yield the answer.
Alarms.
All critically ill patients must have the hemodynamic monitoring alarms on and adjusted to sound an audible alarm if the patient should experience a change in blood pressure, HR, respiratory rate, or other significant monitored variable. The key issues concerning monitor alarms are presented in Box 14-2.
 Box 14-2 Patient Safety Alert
Clinical Alarm Systems
 Clinical Alarm System Effectiveness
1. Audible and visual indication should be present for any condition that poses a risk to the patient. Indicators should be visible from at least 10 ft (3 m).
2. Cause of the alarm must be easily identifiable by the health care practitioner.
3. Life-threatening conditions should be clearly differentiated from noncritical alarm situations.
4. High-priority alarms should override low-priority alarms.
5. Alarm must be sufficiently loud or distinctive to be heard over the environmental noise of a busy critical care unit.
6. It should never be possible to turn the volume control to “off.”
1. Alarm limits can be adjusted to meet the clinical needs of a patient. The system should default to standard settings between patients.
2. Alarm limits should preferably be displayed on the monitor.
Based on data from The Joint Commission. http://www.jointcommission.org; and Critical alarms and patient safety. ECRI’s guide to developing effective alarm strategies and responding to JCAHO’s alarm-safety goal. Health Devices. 2002;31(11):397.
Central Venous Pressure Monitoring
Indications
CVP monitoring is indicated whenever a patient has significant alteration in fluid volume (see Table 14-1). The CVP can be used as a guide in fluid volume replacement in hypovolemia and to assess the impact of diuresis after diuretic administration in the case of fluid overload. When a major intravenous line is required for volume replacement, a CVC is a good choice because large volumes of fluid can easily be delivered.
Central Venous Catheters
A range of CVC options are available as single-, double-, triple-, and quad-lumen infusion catheters, depending on the specific needs of the patient. CVCs are made from a variety of materials ranging from polyurethane to silicone; most are soft and flexible. Catheters that are antimicrobial-impregnated or heparin-coated have a lower rate of bloodstream infections.4
Insertion.
The large veins of the upper thorax—subclavian (SC) and internal jugular (IJ)—are most commonly used for percutaneous CVC line insertion.4 The femoral vein in the groin is used when the thoracic veins are not accessible. All three major sites have advantages and disadvantages.
Internal Jugular Vein.
The IJ vein is the most frequently used access site for CVC insertion. Compared with the other thoracic veins, it is the easiest to canalize. If the IJ vein is not available, the external jugular (EJ) vein may be accessed, although blood flow is significantly higher in the IJ vein, making it the preferred site. Another advantage of the IJ vein is that the risk of creating an iatrogenic pneumothorax is small. Disadvantages to the IJ vein are patient discomfort from the indwelling catheter when moving the head or neck and contamination of the IJ vein site from oral or tracheal secretions, especially if the patient is intubated or has a tracheostomy. This may be the reason why catheter-related infections are higher in the IJ than the SC position for indwelling catheters left in place for more than 4 days.13,14
Femoral Vein.
The femoral vein is considered the easiest cannulation site because there are no curves in the insertion route. The large diameter of the femoral vein carries a high blood flow that is advantageous for specialized procedures such as continuous renal replacement therapy (CRRT) or plasmapheresis. Because there is a higher rate of nosocomial infection with femoral catheters, this site is not recommended.4 If a femoral venous access has been used, the CVC should be changed to either the SC or IJ location as soon as the patient is hemodynamically stable.4
All central catheters are designed for placement by percutaneous injection after skin preparation and administration of a local anesthetic. Visualization of the vessel with a bedside ultrasound before insertion is recommended to reduce the number of CVC placement attempts.4 A prepackaged CVC kit typically is used for the procedure. The standard CVC kit contains sterile towels, chlorhexidine and alcohol for skin preparation, a needle introducer, a syringe, guidewire, and a catheter. The Seldinger technique, in which the vein is located by using a “seeking” needle and syringe, is the preferred method of placement. A guidewire is passed through the needle, the needle is removed, and the catheter is passed over the guidewire. After the tip of the catheter is correctly placed in the vena cava, the guidewire is removed. A sterile intravenous tubing and solution is attached, and the catheter is sutured in place. Following upper thoracic CVC placement, a chest radiograph is obtained to verify placement and the absence of an iatrogenic hemothorax or pneumothorax, especially if the SC vein was accessed.
Central Venous Catheter Complications
Air Embolus.
The risk of air embolus, although uncommon, is always present for the patient with a central venous line in place. Air can enter during insertion15 through a disconnected or broken catheter by means of an open stopcock, or air can enter along the path of a removed CVC.16,17 This is more likely if the patient is in an upright position, because air can be pulled into the venous system with the increase in negative intrathoracic pressure during inhalation. If a large volume of air is infused rapidly, it may become trapped in the right ventricular outflow tract, stopping blood flow from the right side of the heart to the lungs. Based on animal studies, this volume is approximately 4 mL/kg.18 If the air embolus is large, the patient will experience respiratory distress and cardiovascular collapse. An auscultatory clinical sign specifically associated with a large venous air embolism is the mill wheel murmur.15,16,19 A mill wheel murmur is a loud, churning sound heard over the middle chest, caused by the obstruction to right ventricular outflow. Treatment involves immediately occluding the external site where air is entering, administering 100% oxygen, and placing the patient on the left side with the head downward (left lateral Trendelenburg position).19 This position displaces the air from the right ventricular outflow tract to the apex of the heart, where the air may be aspirated by catheter intervention or gradually absorbed by the bloodstream as the patient remains in the left lateral Trendelenburg position. Precautions to prevent an air embolism in a CVP line include using only screw (Luer-Lock) connections, avoiding long loops of intravenous tubing, and using closed-top screw caps on the three-way stopcock.
Thrombus Formation.
Clot formation (thrombus) at the CVC site is unfortunately common. Thrombus formation is not uniform; it may involve development of a fibrin sleeve around the catheter,20 or the thrombus may be attached directly to the vessel wall. Other factors that promote clot formation include rupture of vascular endothelium, interruption of laminar blood flow, and physical presence of the catheter, all of which activate the coagulation cascade. The risk of thrombus formation is higher if insertion was difficult or there were multiple needlesticks. Gradual thrombus formation may lead to “sudden” CVC occlusion. Usually, the CVC becomes more difficult to withdraw blood from, or the CVP waveform becomes intermittently damped over a period of hours or even 1 to 2 days and is reported as “needing frequent flushes” to remain patent. This situation is caused by the continued lengthening of a fibrin sleeve that extends along the catheter length from the insertion site past the catheter tip.20 Some catheters are heparin coated to reduce the risk of thrombus formation, although the risk of HIT does not make this a benign option. Sometimes, CVC complications are additive; for example, the risk of catheter-related infection is increased in the presence of thrombi, where the thrombus likely serves as a culture medium for bacterial growth. Because of concerns over the development of HIT many hospitals use a saline-only flush to maintain CVC patency.21,22
Infection.
Infection related to the use of CVCs is a major problem. The incidence of infection strongly correlates with the length of time the CVC has been inserted, longer insertion times leading to a higher infection rate.4,23 CVC-related infection is identified at the catheter insertion site or as a bloodstream infection (septicemia). Systemic manifestations of infection can be present without inflammation at the catheter site. No decrease in bloodstream infections was found when catheters were routinely changed and this practice is no longer recommended.4 When a CVC is infected it must be removed and a new catheter inserted in a different site. If a catheter infection is suspected, the CVC should not be changed over a guidewire because of the risk of transferring the infection.4 Most infections are transmitted from the skin, and infection prevention begins prior to insertion of the CVC. Insertion guidelines state that the physician must use effective hand-washing procedures, clean the insertion site with 2% chlorhexidine gluconate in 70% isopropyl, use sterile technique during catheter insertion, and maintain maximal sterile barrier precautions.4 In many hospitals the nurse is authorized to stop the procedure if these insertion infection control guidelines are not followed. A daily review to determine whether the catheter is still required is recommended to ensure CVCs are removed promptly when no longer needed (Box 14-3).4
 Box 14-3
Patient Safety Alert
Prevention of Central Venous Catheter-Related Bloodstream Infections

1. Education, Training, and Staffing
a. Nurses and other health care providers should receive education about indications for central venous catheter (CVC) use, maintenance, and infection prevention.
b. Only trained personnel should insert and maintain CVCs.
c. Adequate staffing levels in critical care units are associated with fewer catheter-related bloodstream infections (CRBSI).
2. Selection of Catheters and Sites
a. Use subclavian site rather than jugular or femoral insertion sites to minimize infection risk.
b. Use ultrasound guidance to place CVCs.
c. Remove any catheter that is no longer essential.
d. If a CVC was placed in a medical emergency when aseptic technique was not assured, replace CVC within 48 hours.
3. Hand Hygiene and Aseptic Technique
a. Perform hand hygiene procedures by washing hands with soap and water or alcohol-based hand rubs (ABHR) before and after palpating the CVC site, dressing the site or any other intervention.
b. New sterile gloves must be worn by the professional inserting the CVC.
c. New sterile gloves must be donned before touching a new catheter for CVC exchange over guidewire.
d. Wear clean or sterile gloves when changing the catheter dressing.
4. Maximal Sterile Barrier Precautions
a. For insertion, use maximal sterile barrier precautions including cap, mask, sterile gown, sterile gloves, and a full-body drape.
a. Prepare clean skin with greater than 0.5% chlorhexidine preparation with alcohol before CVC insertion.
b. Antiseptics should be allowed to dry according to the manufacturer’s recommendation before CVC insertion.
6. Catheter Site Dressing Regimens
a. Transparent, semipermeable polyurethane dressings permit continuous visualization of the CVC insertion site.
b. Replace transparent dressings on CVC sites at least every 7 days.
c. Monitor the site when changing the dressing or by palpation through an intact dressing.
d. Replace catheter site dressing whenever the dressing becomes damp, loose, or soiled.
e. Do not use topical antibiotic ointment or creams on insertion sites (except for dialysis catheters) because of increased fungal infection risk.
f. Use a chlorhexidine-impregnated sponge dressing at CVC site if CRBSI rate is not decreasing by other means (no recommendation for other types of chlorhexidine dressings).
a. Use a sutureless catheter securement device to reduce catheter movement, which may reduce infection risk.
O’Grady P, et al. Guidelines for the prevention of intravascular catheter-related infections. Am J Infect Control. 2011;39(4):S1-S34.
All clinicians must use good hand-washing technique and follow aseptic procedures during site care and any time the CVC system is entered to withdraw blood, give medications, or change tubing.4 Site dressings impregnated with chlorhexidine are recommended to lower CVC infection rates.4
Nursing Management
Central Venous Pressure—Volume Assessment.
The time-honored practice of using the CVP value to assess central volume status has now been challenged.24 A landmark systematic review of the literature revealed a weak relationship between the CVP measurement and blood volume.24 Nor was a low CVP value always reliable in predicting who would respond to a fluid challenge.24 In patients with a CVP between 0 and 5 mm Hg, up to 25% do not respond to a fluid challenge as expected.25 Overall only about half of critically ill patients respond as expected to a fluid challenge.24 In this situation the clinician must look at other indices of poor tissue perfusion such as an elevated lactate level, low base deficit, or decreased urine output.25
Passive Leg Raise.
Another method to assess fluid responsiveness is to passively raise and support the patient’s legs, to allow the venous blood from the lower extremities to rapidly flow into the vena cava and return to the right heart. If this maneuver increases the CVP by at least 2 mm Hg, this suggests that the patient will have a positive response to an IV fluid bolus.26
Patient Position.
To achieve accurate CVP measurements, the phlebostatic axis is used as a reference point on the body, and the transducer or water manometer zero must be level with this point. If the phlebostatic axis is used and the transducer or water manometer is correctly aligned, any head of bed position of up to 60 degrees may be used for accurate CVP readings for most patients.5 Elevating the head of the bed is especially helpful for the patient with respiratory or cardiac problems who cannot tolerate a flat position.
Central Venous Pressure Waveform Interpretation.
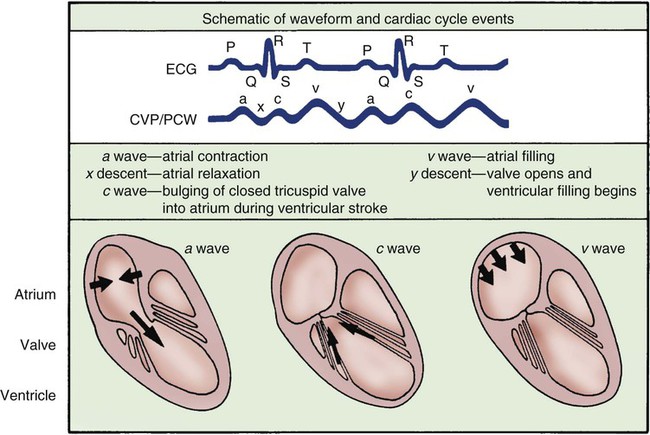
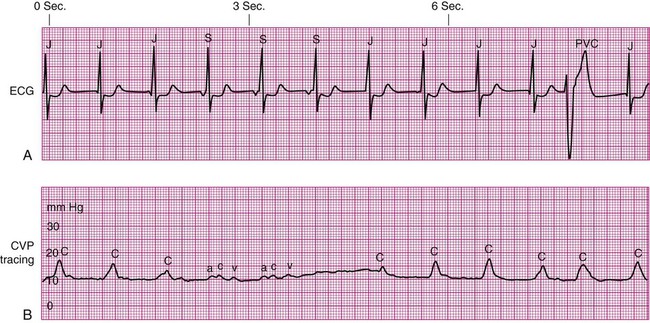
The normal right atrial (CVP) waveform has three positive deflections—a, c, and v waves—that correspond to specific atrial events in the cardiac cycle (Fig. 14-11). The a wave reflects atrial contraction and follows the P wave seen on the ECG. The downslope of this wave is called the x descent and represents atrial relaxation. The c wave reflects the bulging of the closed tricuspid valve into the right atrium during ventricular contraction; this wave is small and not always visible but corresponds to the QRS-T interval on the ECG. The v wave represents atrial filling and increased pressure against the closed tricuspid valve in early diastole. The downslope of the v wave is named the y descent and represents the fall in pressure as the tricuspid valve opens and blood flows from the right atrium to the right ventricle.
Cannon Waves.
Dysrhythmias can change the pattern of the CVP waveform. In a junctional rhythm or after a PVC, the atria are depolarized after the ventricles if retrograde conduction to the atria occurs. This may be seen as a retrograde P wave on the ECG and as a large combined ac or cannon wave on the CVP waveform (Fig. 14-12). These cannon waves can be easily detected as large pulses in the jugular veins. Other pathologic conditions, such as advanced right ventricular failure or tricuspid valve insufficiency, allow regurgitant backflow of blood from the right ventricle to the right atrium during ventricular contraction, producing large v waves on the right atrial waveform. In atrial fibrillation, the CVP waveform has no recognizable pattern because of the disorganization of the atria.
Specialized Central Venous Catheters
A CVC that incorporates a fiberoptic sensor to continuously measure central venous oxygen saturation (Scvo2) can be used as a traditional CVC and additionally used to follow the trend of venous oxygen saturation.27 The physiology underlying use of this fiberoptic technology is discussed later in sections on monitoring mixed venous oxygen saturation (Svo2) and Scvo2.
Pulmonary Artery Pressure Monitoring
The pulmonary artery (PA) catheter is the most invasive of the critical care monitoring catheters. It is also known as a right heart catheter or Swan-Ganz catheter (named after the catheter’s inventors). The practice of routinely using PA catheters is highly controversial. Several randomized, controlled trials of critically ill patients have not demonstrated a benefit to use of the PA catheter. A randomized, controlled trial of 676 critical care patients with acute respiratory distress syndrome (ARDS) in France reported no difference in mortality rates for patients when treatment was guided by PA catheter and for patients without this information.28 A randomized, controlled trial of 1000 patients with ARDS in the United States found no difference in mortality rates for patients when treatment was guided by a PA catheter and those for whom diagnostic information was obtained from a CVP.29
The impact of PA catheterization on mortality rates for patients with acute heart failure has also been examined. A randomized, controlled trial of 433 patients with acute heart failure in the United States reported no difference in mortality based on whether fluid volume management was guided by PA catheter insertion or not.30 Similar results were reported from a British multicenter trial enrolling more than 1000 critical care patients; there were no differences in mortality or in length of stay.31 No survival benefit was found in a randomized, controlled trial enrolling older high-risk surgical patients who required critical care monitoring when treatment was guided by PA catheter diagnostics or not.32 Systematic reviews and meta-analysis of studies of PA catheter use have reached similar conclusions—that insertion of a PA catheter is neutral, it neither conferred a benefit nor increased risk to the patient. There was no increase in mortality or increase in the number of days in the critical care unit or the hospital.33,34
These findings have raised concerns about routine use of PA catheters for critically ill patients. The PA catheter is invasive. It previously seemed intuitive that the diagnostic information provided would confer a survival advantage over less invasive methods, but research has shown this is not the case. Consequently PA catheter use has decreased dramatically. The number of PA catheters inserted in the United States has declined by 65% over 10 years (1993-2004).35 In western Canada the decline in PA catheter use was 50% over 5 years (2002-2006).36
Although the PA catheter is inserted less frequently in critical care units, right heart catheterization is still used as a diagnostic tool in the cardiac catheterization laboratory. In many critical care units, the PA catheter is reserved for patients who are refractory to conventional treatment,37 and in many settings, it has been replaced by less invasive technologies such as echocardiography, as discussed later in this chapter.
Indications
The thermodilution PA catheter is reserved for the most hemodynamically unstable patients, for the diagnosis and evaluation of heart disease,38 and shock states. The PA catheter is used to evaluate patient response to treatment, as described in Table 14-3. The PA catheter can simultaneously assess PA systolic and diastolic pressures, PA mean pressure, and PAOP (wedge pressure). The PA catheter is used to measure CO, determine mixed venous oxygen saturation, and calculate additional hemodynamic parameters.
TABLE 14-3
PULMONARY ARTERY CATHETERS: SELECTED INDICATIONS FOR USE AND RESPONSE TO TREATMENT
| DIAGNOSTIC INDICATIONS* | POSSIBLE CAUSE | ASSOCIATED CLINICAL FINDINGS | HEMODYNAMIC PROFILE† | TREATMENT AND EXPECTED RESPONSE |
| Hypovolemic shock | Trauma Surgery Bleeding Burns Excessive diuresis |
Cardiovascular: sinus tachycardia, ↓ BP (SBP <90 mm Hg), weak peripheral pulses Pulmonary: lungs clear Renal: ↓ urinary output Skin: normal skin temperature, no edema Neurologic: variable |
Low CO Low CI (2.2 L/min/m2) High SVR (>1600 dyn·sec·cm−5) Low PAP Low PAOP |
Treatment: Fluid challenge Expected hemodynamic response: ↓ HR ↑ BP ↑ PAP ↑ PAOP ↑ CVP ↑ CO/CI ↓ SVR |
| Septic shock | Sepsis | Cardiovascular: sinus tachycardia, ↓ BP (SBP <90 mm Hg), bounding peripheral pulses Pulmonary: lungs may be clear or congested, depending on the origin of the sepsis Renal: ↓ urinary output Skin: warm and flushed Neurologic: variable |
High CO (>8 L/min) High CI Low SVR (<600 dyn·sec·cm−5) Low PAP Low PAOP Low CVP |
Treatment: IV fluid to maintain hemodynamic function Fluid challenge Peripheral vasoconstricting agent (alpha) to ↑ SVR |
| Antibiotics and laboratory cultures to find site of infection | ||||
| Consider rhAPC | ||||
| Expected hemodynamic response: | ||||
| ↓ HR | ||||
| ↑ BP | ||||
| ↑ PAP | ||||
| ↑ PAOP | ||||
| ↑ CVP | ||||
| ↑ CO and CI | ||||
| ↑ SVR | ||||
| Svo2 = 70% | ||||
| Multisystem failure shock | Multiple organ dysfunction syndrome (MODS) | Cardiovascular: normal sinus rhythm or sinus tachycardia, ↓ BP, weak peripheral pulses Pulmonary: lungs may be clear or congested, depending on the site of sepsis; acidosis based on arterial blood gas values, may require mechanical ventilation Renal: ↓ urinary output, may have ↑ BUN and ↑ creatinine levels Skin: cool and mottled |
Low CO Low CI (<2.2 L/min/m2) High SVR (>1600 dyn·sec·cm−5) High or low PAP High or low PAOP High or low CVP |
Treatment: Vasodilators to ↓ SVR, Antibiotics Support of body system as necessary (e.g., mechanical ventilation, hemodialysis) |
| Neurologic: variable, depending on fluid status and medications used in treatment | Expected hemodynamic response: ↓ HR ↑ BP Normalized PAP, PAOP, CVP |
|||
| ↓ SVR | ||||
| ↓ PVR | ||||
| ↑ CO and CI | ||||
| Cardiogenic shock | LV pump failure caused by acute myocardial infarction or severe mitral or aortic valve disease | Cardiovascular: sinus tachycardia, possibly dysrhythmias, systolic BP <90 mm Hg, S3 or S4, weak peripheral pulses Pulmonary: lungs may have crackles or pulmonary edema Renal: ↓ urinary output Skin: cool, pale, and moist |
Low CO Low CI (<2.2 L/min/m2) High SVR (>1600 dyn·sec·cm−5) High PAP High PAOP (>15 mm Hg) High CVP Low SVI Low left CWI Low left VSWI |
Treatment: Inotropic medications to ↑ LV contractility Vasodilators or IABP to ↓ SVR Diuretics to ↓ preload Optimization of HR and control of dysrhythmias |
| Expected hemodynamic response: | ||||
| ↓ HR | ||||
| ↑ BP | ||||
| ↓ PAP | ||||
| ↓ PAOP | ||||
| ↓ CVP | ||||
| ↓ SVR | ||||
| ↑ CO and CI | ||||
| ↑ SVI | ||||
| ↑ Left CWI | ||||
| ↑ Left VSWI | ||||
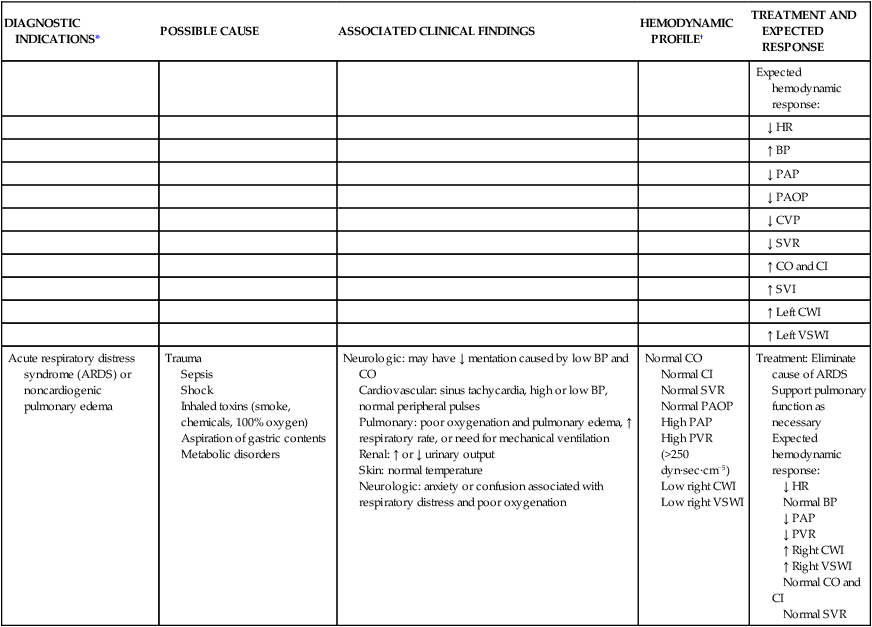
| Acute respiratory distress syndrome (ARDS) or noncardiogenic pulmonary edema | Trauma Sepsis Shock Inhaled toxins (smoke, chemicals, 100% oxygen) Aspiration of gastric contents Metabolic disorders |
Neurologic: may have ↓ mentation caused by low BP and CO Cardiovascular: sinus tachycardia, high or low BP, normal peripheral pulses Pulmonary: poor oxygenation and pulmonary edema, ↑ respiratory rate, or need for mechanical ventilation Renal: ↑ or ↓ urinary output Skin: normal temperature Neurologic: anxiety or confusion associated with respiratory distress and poor oxygenation |
Normal CO Normal CI Normal SVR Normal PAOP High PAP High PVR (>250 dyn·sec·cm−5) Low right CWI Low right VSWI |
Treatment: Eliminate cause of ARDS Support pulmonary function as necessary Expected hemodynamic response: ↓ HR Normal BP ↓ PAP ↓ PVR ↑ Right CWI ↑ Right VSWI Normal CO and CI Normal SVR |

*Patients undergoing major vascular or cardiac surgery may also have a pulmonary catheter in situ to follow the trend of the cardiac output and cardiac index, SVR systemic vascular resistance and PVR pulmonary vascular resistance, and fluid status during the first 24 hours after surgery.
†See Table 14-1 for definitions and Appendix B for normal values of hemodynamic parameters listed in this table.
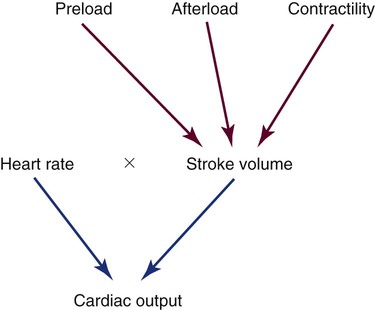
Cardiac Output Determinants

The normal adult SV is 60 to 70 mL. The clinical factors that contribute to the heart’s SV are preload, afterload, and contractility (Fig. 14-13). These three factors may be monitored using the PA catheter. Another contributor to CO is HR, which is usually recorded from the ECG leads.
Oxygen Supply and Demand
Preload.
Measurement of Preload.
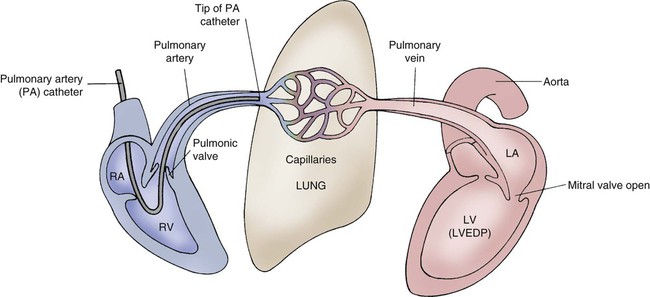
When the PA catheter is correctly positioned with the tip in one of the large branches of the PA, the only valve between the PA catheter tip and the left ventricle is the mitral valve. During diastole, when the mitral valve is open, no obstruction exists between the tip of the PA catheter and the left ventricle (Fig. 14-14). The LV preload volume creates left ventricular end-diastolic pressure (LVEDP). This is measured clinically by the PAOP or “wedge” pressure. The PAOP and PADP are the values most often referred to in this chapter, because they are the values used in clinical practice. Normal left atrial pressure (LAP) or PAOP is 5 to 12 mm Hg.
Frank-Starling Law of the Heart.
1. Volume in the ventricle at end-diastole (preload)
2. Amount of myocardial stretch placed on the ventricle as a result
If the volume in the left ventricle is low, CO is also suboptimal. If intravenous fluids (volume) are infused, CO increases as LV volume and myocardial fiber stretch increase. This is true up to a point. Past this point, more fluid volume overdistends the ventricle and stretches the myocardial fibers so much that CO decreases. This scenario is seen clinically in the setting of acute heart failure with pulmonary edema. The increased volume in the overdistended left ventricle raises pressure in the left ventricle, left atrium, and pulmonary veins (that drain into the left atrium), and it ultimately raises pulmonary capillary pressures measured as an increased wedge pressure (PAOP). The impact of preload on CO is represented in Figures 14-15 and 14-16, using the Frank-Starling curve as a model.
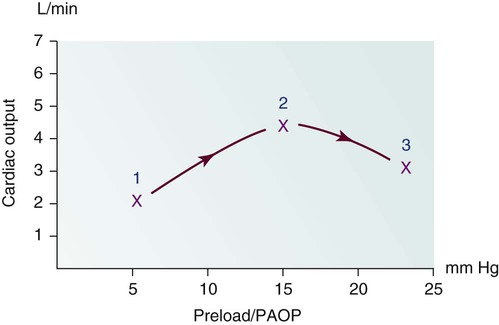
1, Poor cardiac output with low preload as a result of hypovolemia. 2, Hypovolemia is corrected after the administration of 2 L of intravenous fluid. The preload volume in the ventricle is increased, and pulmonary artery occlusion pressure (PAOP) has risen. Because of the increased fiber stretch from the increase in preload, CO also has risen. 3, After the infusion of an additional 2 L of intravenous solution, the myocardial fibers are overdistended, preload (PAOP) has increased, and CO has fallen as the volume in the left ventricle rises.
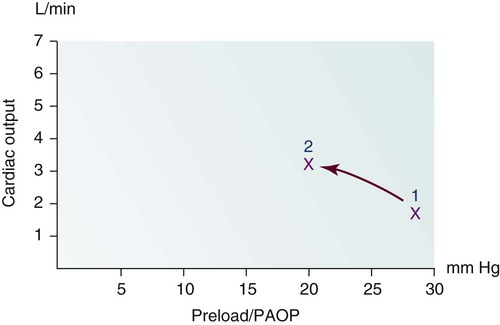
1, After an acute anterior wall myocardial infarction that has created significant left ventricular dysfunction, this patient has left ventricle (LV) pump failure with low CO and elevated filling pressures identified by an elevated pulmonary artery occlusion pressure (PAOP). One of the clinical problems faced by this patient is too much preload. 2, After administration of diuretics to reduce volume and nitroglycerin to dilate the venous system, preload is reduced and CO rises.
Cardiac Dysfunction.
A significant relationship exists between LVEDP and cardiac muscle dysfunction. As a general rule, the higher the pressure inside the left ventricle, the greater the degree of cardiac dysfunction. The pressure rises at end-diastole (end of filling) because the compromised ventricle cannot eject all of the preload blood volume. For example, in a patient with heart failure, the preload volume may be 100 mL. However, the SV ejected may be only 30 mL. The EF in this patient is 30% (normal EF is greater than 50%). The remaining preload volume (70 mL in this example) significantly elevates LV pressures. When the mitral valve opens at the beginning of diastole, the pressure in the left atrium needs to be slightly higher than pressures in the left ventricle to allow filling. The 70 mL remaining in the ventricle produces high LV diastolic pressures. This elevates the left atrial filling pressure and consequently elevates the PAOP (wedge pressure). In this example, the left ventricle is overstretched by excessive preload, and CO therefore is below normal. A plan of care for this patient includes decreasing LV preload through 1) restriction of intravenous and oral fluids; 2) venodilation; and 3) diuresis. The myocardial dysfunction will lead to heart failure symptoms that are discussed further in Chapter 15.
Pulmonary Artery Diastolic Pressure and Pulmonary Artery Occlusion Pressure Relationship.
LVEDP can be estimated by indirect measures using the PA catheter. The most accurate is the PAOP method. The second method involves measuring PADP during diastole when the normal PADP is equal to or 1 to 3 mm Hg higher than the mean PAOP and LVEDP. It is physiologically impossible for the PAOP to be higher than the PADP. The clinician must recalibrate and troubleshoot the monitoring system if this appears to occur (see Table 14-2).
Pulmonary Hypertension.
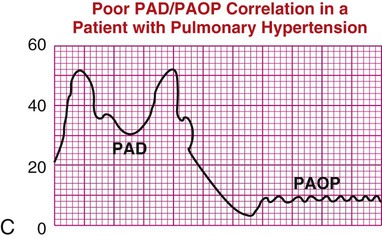
Specific clinical conditions can alter the normal PADP/PAOP relationship.39 In ARDS with acute pulmonary hypertension, the pulmonary arterial systolic and diastolic pressures are independently raised above the LV pressures. In this clinical situation the PADP will not accurately reflect function of the left side of the heart. The numeric difference between the PADP and the PAOP value is called a gradient. If a large gradient exists between the PAOP and PADP when the PA catheter is inserted, the patient has pulmonary hypertension (Table 14-4, illustration C).
TABLE 14-4
CLINICAL INTERPRETATION OF PULMONARY ARTERY WAVEFORMS
| PA PRESSURE | CLINICAL INTERPRETATION | WAVEFORM INTERPRETATION* | |
| Pulmonary artery systolic (PAS) pressure | PAS pressure reflects the systolic pressure in the pulmonary vasculature. Waveform A is a normal waveform. The elevated values in pulmonary hypertension may be caused by idiopathic sources, some congenital heart defects, or lung disease. | A |
 |
| Pulmonary artery diastolic (PAD) pressure | In the patient with healthy lung vasculature, PAD pressure reflects left ventricular end-diastolic pressure (LVEDP), as shown in waveform B. Even if the patient experiences heart failure, the pulmonary artery occlusion pressure (PAOP) and PAD increase together. | B |
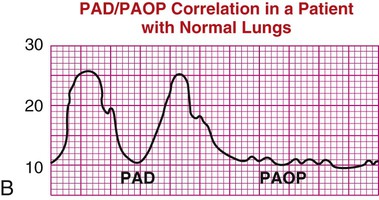 |
| In the presence of acute respiratory distress syndrome or pulmonary hypertension, PAD pressure is not an accurate reflection of PAOP, as shown in waveform C. | C |
 |
|
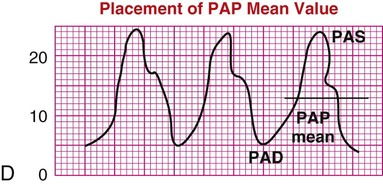
| Mean pulmonary artery pressure (PAP mean or PAPM) | PAP mean pressure is used in the calculation of pulmonary vascular resistance (PVR) and pulmonary vascular resistance index (PVRI), as described in Table 14-1. High mean pressures can reflect cardiac or pulmonary disease. Low mean pressures reflect hypovolemia. Waveform D shows PAP mean placement. | D |
 |
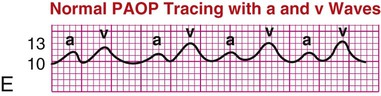
| Pulmonary artery occlusion pressure (PAOP) or pulmonary artery wedge pressure (PAWP) | In the healthy patient, PAOP reflects blood in the left ventricle at end-diastole (LVEDP). The normal PAOP waveform is a left atrial waveform, as shown in waveform E. | E |
 |
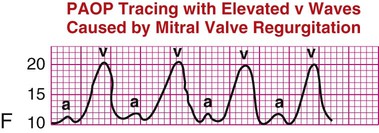
| If a patient has mitral valve regurgitation, the v waves are larger than normal, increasing PAOP and possibly not reflecting true LVEDP, as shown in waveform F. PAOP is elevated in many cardiac disease states in which LV function is compromised. PAOP is low in hypovolemic states. | F |
 |
|
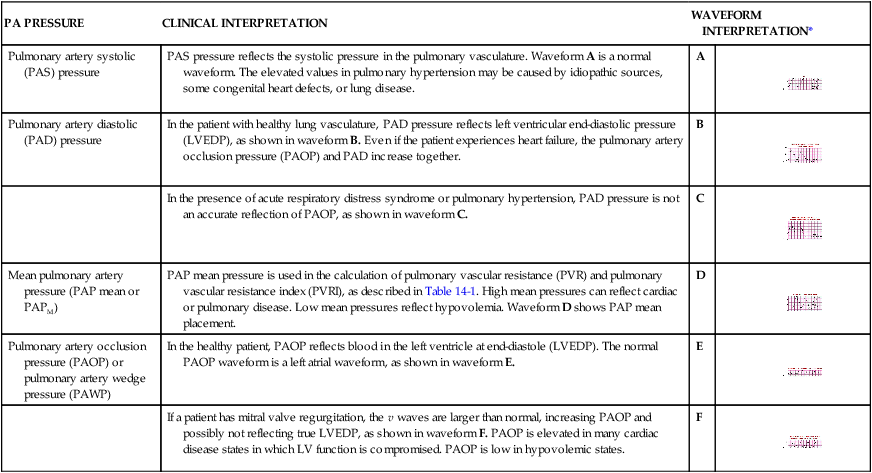
*Pressures on the y axis are given in millimeters of mercury (mm Hg).
Heart Failure.
In failure of the left side of the heart, the PAOP and PADP are elevated and approximately equal (see Table 14-4, illustration B). The heart failure may cause secondary pulmonary hypertension. Over time, the damage to the lung vasculature occurs because of exposure to high LV pressure.
Mitral Regurgitation.
In patients with mitral regurgitation (MR), the mean PAOP reading is artificially elevated because of abnormal backflow of blood from the left ventricle to the left atrium during systole. This PAOP reading is distinguished by very large v waves on the PAOP (wedge) tracing and may not reflect the true LVEDP (see Table 14-4, illustration F).
The v waves can be dramatically large in some patients. The size of the v wave is related to the amount of MR and to the compliance of the left atrium.40 If the MR is chronic and the left atrium is compliant and can stretch, the v waves may be small. In the setting of acute MR after infarction of a papillary muscle, the noncompliant or stiff atrium contributes to the development of large v waves. Reading the PAOP tracing in the presence of MR is difficult. If the v waves are large (acute MR), they cannot be used to estimate LV preload. If the v wave is small (chronic MR), the mean PAOP or LAP can still estimate LV preload (LVEDP). Echocardiography also is used to confirm the presence of MR.41
Afterload.

Systemic Vascular Resistance and Afterload Reduction.
If the SVR is extremely low (e.g., less than 500 dyn·sec·cm−5), as may occur in sepsis, the CO will be elevated, and MAP will be low. In this situation, volume and vasopressors are infused to increase MAP and the SVR. After adequate volume resuscitation, the Surviving Sepsis Campaign guidelines recommend centrally administered dopamine, which increases MAP by affecting CO, or norepinephrine (Levophed), which increases MAP by vasoconstriction of the peripheral vasculature to increase SVR.42 Frequent assessment of the peripheral circulation is required when medications that increase SVR are used, because excessive vasoconstriction can negatively affect tissue perfusion.
Pulmonary Vascular Resistance.
Resistance to ejection from the right side of the heart is estimated by calculating the pulmonary vascular resistance (PVR). The PVR value is normally one sixth of the SVR. Normal PVR is 100 to 250 dyn·sec·cm−5. The formula to calculate PVR is listed in Appendix B. Acute pulmonary hypertension, identified as a mean PA pressure greater than 25 mm Hg, can occur as a sequela of ARDS.43 The acute rise in PVR may cause the right ventricle to fail, although LV pressures generally remain within the normal range. Traditionally, a PA catheter was used to monitor vasodilator therapy and fluid management. However, because research trials have not shown a survival benefit for patients with ARDS who received invasive PA monitoring compared with CVP monitoring, today, a PA catheter is rarely used.28,29 Chronic pulmonary hypertension is associated with chronic elevation of PVR, and in that situation infusions of pulmonary vasodilators are used to decrease PVR.44 A discussion of pharmacologic management of pulmonary hypertension occurs in Chapter 15; see Table 15-12 and Figure 15-22.
Contractility.
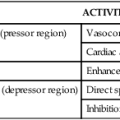
Many factors have an impact on contractility, including preload volume as measured by PAOP, SVR, myocardial oxygenation, electrolyte balance, positive and negative inotropic medications, and the amount of functional myocardium available to contribute to contraction. These factors can have a positive inotropic effect, enhancing contractility, or a negative inotropic effect, decreasing contractility. Significant factors related to contractility that can be measured by the PA catheter include preload filling pressures, SVR, and CO. Additional contractility numbers can be calculated and are displayed in the hemodynamic profile on the bedside monitor. These include left and right ventricular stroke work index values (LVSWI and RVSWI). These values estimate the force of cardiac contraction (see Table 14-1).
Preload has an impact on contractility by means of Starling’s mechanism. As volume in the ventricle rises, contractility increases. If the ventricle is overdistended with volume, contractility falls (see Figs. 14-15 and 14-16). SVR alters contractility by changes in resistance to ventricular ejection. If SVR is high, contractility is decreased. If SVR is low, contractility is augmented. Hypoxemia acts as a negative inotrope. The myocardium must have oxygen available to the cells to contract efficiently.
Pulmonary Artery Catheters
The traditional PA catheter, invented by Swan and Ganz, has four lumens for measurement of right atrial pressure (RAP) or CVP, PA pressures, PAOP, and CO (Fig. 14-17A). Multifunction catheters may have additional lumens, which can be used for intravenous infusion (Fig. 14-17B) and to measure continuous Svo2, right ventricular volume, and continuous CO (Fig. 14-17C). Other PA catheters include transvenous pacing electrodes to pace the heart if needed.
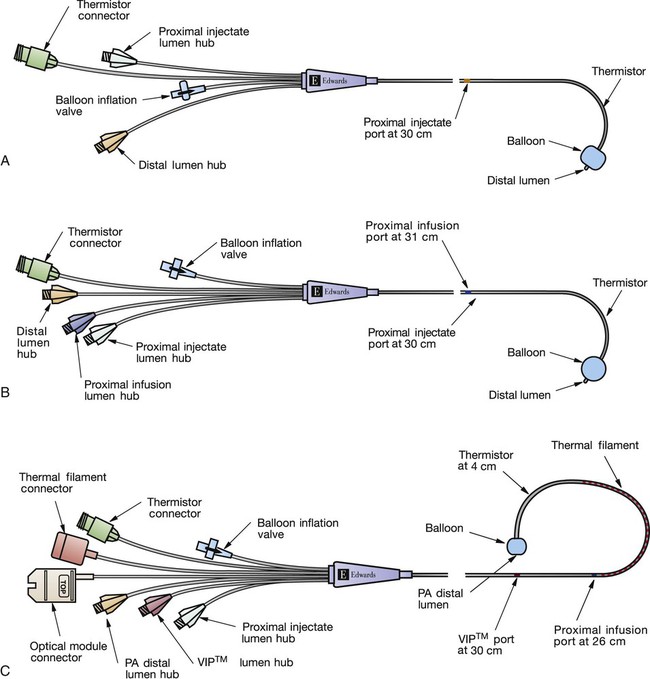
A, Four-lumen catheter. B, Five-lumen catheter that includes an additional venous infusion port (VIP) into the right atrium. C, Seven-lumen catheter that includes a VIP port and two additional lumens, as well as a thermal filament, for continuous cardiac output (CCO) and internal fiber-optic strands for continuous mixed venous oxygen saturation (Svo2) monitoring (i.e., optical module connector). An additional option is to combine the use of the CCO filament and the thermistor response time to calculate continuous right ventricular end-diastolic volume (RECEDV) and right ventricular ejection fraction (RVEF). (Copyright 2001 Edwards Lifesciences LLC. All rights reserved. Reprinted with permission of Edwards Lifesciences, Swan-Ganz is a trademark of Edwards Lifesciences Corporation, registered in the U.S. Patent and Trademark Office.)
The PA flow directed catheter is 110 cm long. The most commonly used size is 7.5 or 8.0 Fr, although 5.0 and 7.0 Fr sizes are available. Each of the four lumens exits into the heart or PA at a different point, graduated along the catheter length (see Fig. 14-17A).
Additional Features.
If continuous Svo2 is measured, the catheter has an additional fiberoptic lumen that exits at the tip of the catheter (see Fig. 14-17C). If cardiac pacing is used, two PA catheter methods are available. One type of catheter has three atrial (A) and two ventricular (V) pacing electrodes attached to the catheter so that when it is properly positioned, the patient can be connected to a pacemaker and be AV paced. The other catheter method uses a specific transvenous pacing wire that is passed through an additional catheter lumen and exits into the right ventricle if ventricular pacing is required. A right ventricular volumetric PA catheter is available that measures SV in the right ventricle.
Insertion
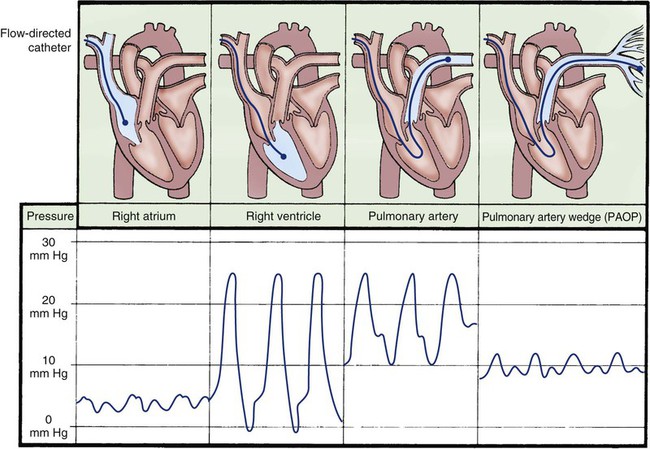
If a PA catheter is to be inserted into a patient who is awake, some brief explanations about the procedure are helpful to ensure that the patient understands what is going to happen. The initial insertion techniques used for placement of a PA catheter are similar to those described for CVC insertion. Because the PA catheter is positioned within the heart chambers and PA on the right side of the heart, catheter passage is monitored using fluoroscopy or waveform analysis on the bedside monitor (Fig. 14-18).
Before inserting the catheter into the vein, the physician—using sterile technique—tests the balloon for inflation and flushes the catheter with NS solution to remove any air. The PA catheter is then attached to the bedside hemodynamic line setup and monitor so that the waveforms can be visualized while the catheter is advanced through the right side of the heart (see Fig. 14-18). A larger introducer sheath (8.5 Fr)—which has the tip positioned in the vena cava and has an additional intravenous side-port lumen—is often used to cannulate the vein first. This introducer sheath is known by several different names in clinical practice, including sheath, cordis, introducer, or side port. This introducer sheath remains in place, and the supple PA catheter is threaded through it into the vena cava and into the right side of the heart.
Pulmonary Artery Waveform Interpretation
Right Atrial Waveform.
As the PA catheter is advanced into the right atrium during insertion, a right atrial waveform must be visible on the monitor, with recognizable a, c, and v waves (see Fig. 14-18). The normal mean pressure in the right atrium is 2 to 5 mm Hg. Before passage through the tricuspid valve, the balloon at the tip of the catheter is inflated for two reasons. First, it cushions the pointed tip of the PA catheter so that if the tip comes into contact with the right ventricular wall, it will cause less myocardial irritability and, consequently, fewer ventricular dysrhythmias. Second, inflation of the balloon assists the catheter to float with the flow of blood from the right ventricle into the PA. It is because of these features and the balloon that PA catheters are described as flow-directional catheters.
Pulmonary Artery Occlusion Waveform (Wedge).
While the balloon remains inflated, the catheter is advanced into the wedge position. This maneuver produces the PAOP. The waveform decreases in size and is nonpulsatile, reflecting a normal left atrial tracing with a and v wave deflections. This is known as a wedge tracing, because the balloon is “wedged” into a small pulmonary vessel, but it is technically described as the PAOP (see Fig. 14-18). The balloon occludes the pulmonary vessel so that the PA catheter tip and lumen are exposed only to left atrial pressure (LAP) and are protected from the pulsatile influence of the right ventricle and PA. When the balloon is deflated, the catheter should spontaneously float back into the PA. When the balloon is reinflated, the wedge tracing should be visible. The normal PAOP ranges from 5 to 12 mm Hg.
After insertion of the catheter, the chest radiograph or fluoroscopy is used to verify the PA catheter position to make sure that it is not looped or knotted in the right ventricle and to rule out pneumothorax or hemorrhagic complications. A thin plastic sleeve is placed on the outside of the catheter when it is inserted to maintain sterility of the part of the PA catheter that exits from the patient. If the PA catheter is not in the desired position or if it migrates out of position, it can be repositioned. Use of this external sleeve on PA catheters has been associated with lower rates of bloodstream infection.4
Medical Management
Controversy exists in the medical community over the use of PA catheters and rates of use have declined in response to lack of benefit demonstrated in clinical trials. Medical goals of hemodynamic monitoring include assessment of adequacy of perfusion in stable patients, early detection of decreased perfusion, titration of therapy to meet specific therapeutic outcomes, and differentiation of different organ system dysfunctions. Practice guidelines are available for physicians who routinely work with PA catheters.45
Nursing Management
The more knowledgeable the critical care nurse can become about use of the PA catheter, the more accurate and effective the nursing management interventions will be.5 Factors that affect PA measurement are the head-of-bed backrest position and lateral body position relative to transducer height placement, respiratory variation, and use of positive end-expiratory pressure (PEEP).
Patient Position.
The patient does not need to be flat for accurate pressure readings to be obtained. In the supine position, when the transducer is placed at the level of the phlebostatic axis, a head-of-bed position from flat up to 60 degrees is appropriate for most patients.5 It is important to know that PADP and PAOP measurements in the lateral position may be significantly different from those taken when the patient is lying supine. If there is concern about the validity of pressure readings in a particular patient, it is more reliable to take measurements with the patient on his or her back, with the head of bed elevated from flat to 60 degrees as tolerated. After a patient changes position, a stabilization period of 5 to 15 minutes is recommended before taking pressure readings.5 The stabilization period is usually longer if the patient has LV dysfunction or is hemodynamically unstable.
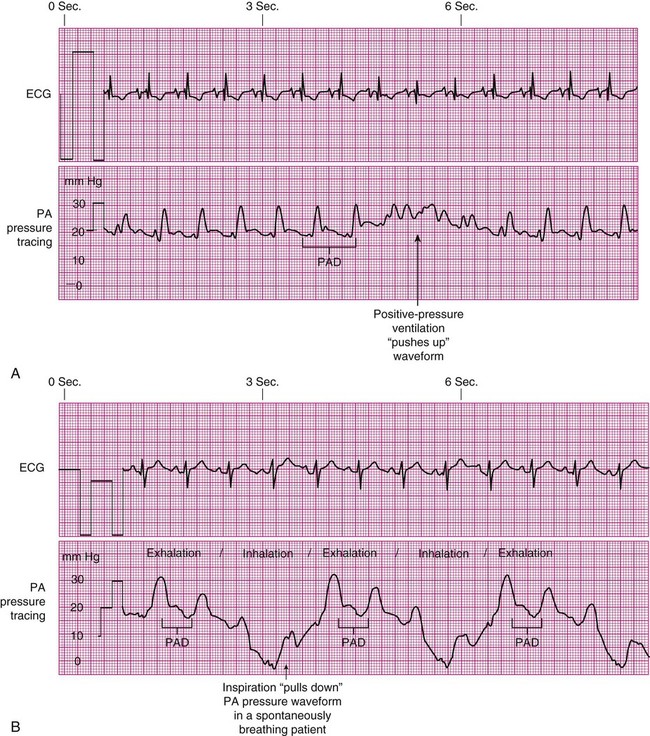
Respiratory Variation.
All PADP and PAOP (wedge) tracings are subject to respiratory interference, especially when the patient is on a positive-pressure, volume-cycled ventilator.5 During the positive-pressure inhalation phase, the increase in intrathoracic pressure may “push up” the PA tracing, producing an artificially high reading (Fig. 14-19A). During inhalation with spontaneous breaths, negative intrathoracic pressure “pulls down” the waveform, producing an erroneously low measurement (see Fig. 14-19B). To minimize the impact of respiratory variation, the PADP is read at end-expiration, which is the most stable point in the respiratory cycle when intrapleural pressures are close to zero. If the digital number fluctuates with respiration, a printed readout on paper can be obtained to verify true PADP. In some clinical settings, ECG signals or airway pressure and flow are recorded simultaneously with the PADP/PAOP tracing to identify end-expiration.5
Cardiac Output Measurement
The PA catheter measures CO using an intermittent (bolus) or a continuous CO method.
Cardiac Output Curve.
The thermodilution CO method uses the indicator-dilution method, in which a known temperature is the indicator. It is based on the principle that the change in temperature over time is inversely proportional to blood flow. Blood flow can be diagrammatically represented as a CO curve on which temperature is plotted against time (Fig. 14-20A). Most hemodynamic monitors display this CO curve, which must then be interpreted to determine whether the CO injection is valid. The normal curve has a smooth upstroke, with a rounded peak and a gradually tapering down-slope. If the curve has an uneven pattern, it may indicate faulty injection technique, and the CO measurement must be repeated. Patient movement or coughing also alters the CO measurement (see Fig. 14-20B).
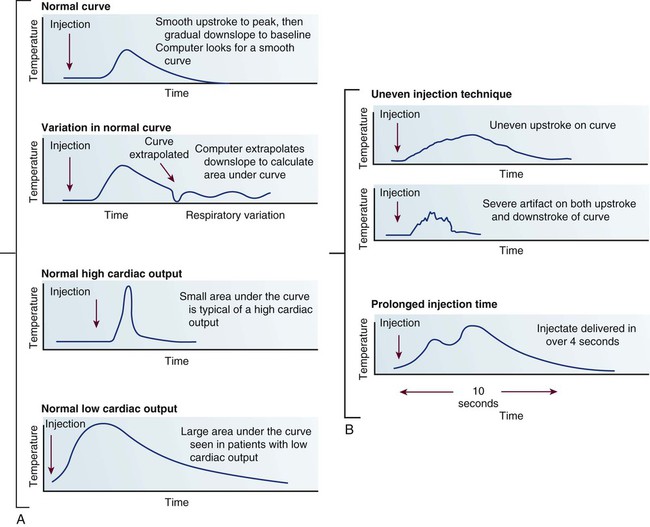
Patient Position and Cardiac Output.
In the normovolemic, stable patient, reliable CO measurements can be obtained in a supine position (patient lying on his or her back) with the head of the bed elevated up to 60 degrees.5 If the patient is hypovolemic or unstable, leaving the head of the bed in a flat position or only slightly elevated is the most clinically appropriate choice. CO measurements performed when the patient is turned to the side are not considered as accurate as those performed with the patient in the supine position.
Calculated Hemodynamic Profiles.
The calculated values used in the hemodynamic profiles are described in Table 14-1. Clinical use of these profiles is described in two case studies. In Hemodynamic Profile 1 (Box 14-4), the example is a step-by-step interpretation of the hemodynamic profile to familiarize the reader with use of calculated values. In Hemodynamic Profile 2 (Box 14-5), the example uses only values indexed to body weight and illustrates the impact of treatment on these values over time.
Box 14-4 Hemodynamic Profile 1
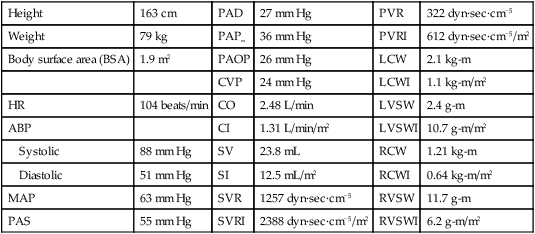
Analysis of the Hemodynamic Profile*
| PROFILE | ANALYSIS |
| HR (heart rate) | HR of 104 beats/min is above normal limits (normal, 60-100 beats/min). |
| ABP (arterial blood pressure) | Narrow pulse pressure of 88/51 mm Hg with a low mean arterial pressure (MAP) of 63 mm Hg (normal MAP, 65-90 mm Hg). |
| PAP (pulmonary artery pressure) | Pulmonary artery pressures are elevated (55/27 mm Hg), consistent with diagnosis of cardiomyopathy, failure of left side of heart, and COPD (normal PAP, 25/10 mm Hg). |
| PAOP (pulmonary artery occlusion pressure) | Elevated PAOP (26 mm Hg), consistent with diagnosis of cardiomyopathy and failure of left side of heart (normal PAOP, 5-12 mm Hg). |
| CVP (central venous pressure) | Elevated CVP (24 mm Hg), consistent with diagnosis of cardiomyopathy, failure of right side of heart, and COPD (normal CVP, 4-6 mm Hg). |
| CO (cardiac output) and CI (cardiac index) | Poor CO and CI (CO, 2.48 L/min; CI, 1.31 L/min/m2). Both values are below normal (normal CO, 4-6 L/min; normal CI, 2.2-4 L/min/m2). |
| SV (stroke volume) and SI (stroke volume index) | SV and SI are low (SV, 23.8 mL; SI, 12.5 mL/m2). These results would be anticipated from the low CO (normal SV, 60-70 mL; normal SI, 40-50 mL/min/m2). |
| SVR (systemic vascular resistance) and SVRI (systemic vascular resistance index) | SVR and SVRI are at the upper normal range (SVR, 1257 dyn·sec·cm−5; SVRI, 2388 dyn·sec·cm−5/m2). These values are not contributing to the low CO at this time (normal SVR, 800-1400 dyn·sec·cm−5; normal SVRI, 2000-2400 dyn·sec·cm−5/m2). |
| PVR (pulmonary vascular resistance) and PVRI (pulmonary vascular resistance index) | PVR and PVRI are elevated (PVR, 322 dyn·sec·cm−5; PVRI 612 dyn·sec·cm−5/m2). High PVR may be contributing to the low CO (normal PVR, 100-250 dyn·sec·cm−5; normal PVRI, 225-315 dyn·sec·cm−5/m2). |
| LCWI (left cardiac work index) and LVSWI (left ventricular stroke work index) | Both LCWI and LVSWI are below normal (LCWI, 1.1 kg-m/m2; LVSWI, 10.7 g-m/m2), indicating that left ventricular myocardial damage may be present. This is consistent with Mr. SR’s diagnosis of cardiomyopathy (normal LCWI, 3.4-4.2 kg-m/m2; normal LVSWI, 50-62 g-m/m2). |
| RCWI (right cardiac work index) and RVSWI (right ventricular stroke work index) | RCWI is normal, but RVSWI is below normal (RCWI, 0.64 kg-m/m2; RVSWI, 6.2 g-m/m2), indicating that right ventricular myocardial damage may be present. This is consistent with Mr. SR’s diagnosis of cardiomyopathy and history of COPD (normal RCWI, 0.54-0.66 kg-m/m2, normal RVSWI, 7.9-9.7, g-m/m2). |
| Nursing impression | The hemodynamic data confirm the nursing clinical diagnosis of poor CO. The goal is to improve CO within the limits of Mr. SR’s myocardial dysfunction and COPD. As CO improves and PA pressures decrease, the patient will have less pulmonary congestion, which will improve alveolar gas exchange. |
*Formulas and normal values for the hemodynamics values are given in Table 14-1 and in Appendix B.
Box 14-5 Hemodynamic Profile 2
| Height | 159 cm | MAP | 106 mm Hg | SI | 9.9 mL/m2 |
| Weight | 45.8 kg | PAS | 53 mm Hg | SVRI | 5351 dyn·sec·cm−5/m2 |
| Body surface area (BSA) | 1.40 m2 | PAD | 27 mm Hg | PVRI | 1046 dyn·sec·cm−5/m2 |
| PAPM | 44 mm Hg | LCWI | 1.9 kg-m/m2 | ||
| HR | 131 beats/min | PAOP | 27 mm Hg | LVSWI | 14.3 g-m/m2 |
| ABP | CVP | 19 mm Hg | RCW | 0.78 kg-m/m2 | |
| Systolic | 160 mm Hg | CO | 1.82 L/min | RCWI | 5.9 g-m/m2 |
| Diastolic | 80 mm Hg | CI | 1.3 L/min/m2 |
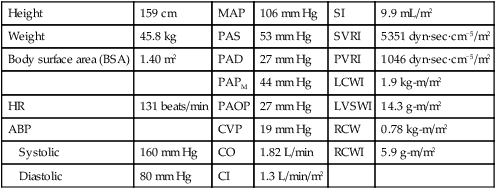
| Height | 159 cm | MAP | 83 mm Hg | SI | 16.5 mL/m2 |
| Weight | 45.8 kg | PAS | 41 mm Hg | SVRI | 3088 dyn·sec·cm−5/m2 |
| Body surface area (BSA) | 1.40 m2 | PAD | 26 mm Hg | PVRI | 300 dyn·sec·cm−5/m2 |
| PAPM | 33 mm Hg | LCWI | 2.1 kg-m/m2 | ||
| HR | 113 beats/min | PAOP | 26 mm Hg | LVSWI | 18.6 g-m/m2 |
| ABP | CVP | 11 mm Hg | RCWI | 0.84 kg-m/m2 | |
| Systolic | 104 mm Hg | CO | 2.61 L/min | RVSWI | 7.4 g-m/m2 |
| Diastolic | 69 mm Hg | CI | 1.86 L/min/m2 |
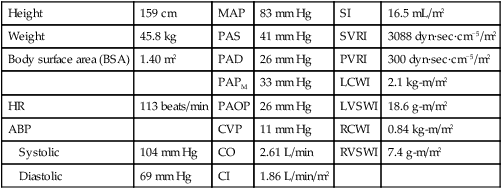
| Height | 159 cm | MAP | 77 mm Hg | SI | 22.5 mL/m2 |
| Weight | 45.8 kg | PAS | 31 mm Hg | SVRI | 2423 dyn·sec·cm−5/m2 |
| Body surface area (BSA) | 1.40 m2 | PAD | 15 mm Hg | PVRI | 273 dyn·sec·cm−5/m2 |
| PAPM | 23 mm Hg | LCWI | 2.4 kg-m/m2 | ||
| HR | 104 beats/min | PAOP | 15 mm Hg | LVSWI | 22.9 g-m/m2 |
| ABP | CVP | 4 mm Hg | RCWI | 0.74 kg-m/m2 | |
| Systolic | 111 mm Hg | CO | 3.28 L/min | RVSWI | 7.1 g-m/m2 |
| Diastolic | 60 mm Hg | CI | 2.34 L/min/m2 |
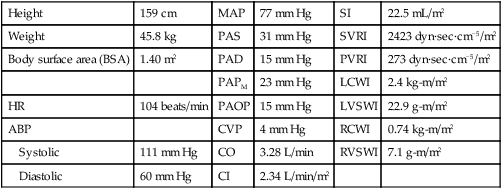
*See Box 14-4 for explanation of abbreviations and Table 14-1 and Appendix B for an explanation of hemodynamic values.
Noninvasive and Minimally Invasive Measurement of Cardiac Output
As a result of the perceived risks associated with use of the PA catheter, combined with studies that have not shown improved outcomes with routine monitoring, there is tremendous interest in finding less invasive methods of CO measurement. Noninvasive methods include echocardiography or bioimpedance. Minimally invasive techniques can involve vascular catheters or esophageal probes as described in Table 14-5. All have been compared with the PA catheter thermodilution CO method.
TABLE 14-5
| DEVICE NAME | PROBE PLACEMENT | METHOD | CARDIAC OUTPUT CALCULATION | CLINICAL ISSUES |
| Noninvasive Methods | ||||
| Bioimpedance | External electrodes placed on the neck and chest | Thoracic electric bioimpedance | ||
Less accurate with low body temperature.
Three calibrations are required initially, and frequent recalibration is required to maintain accuracy.
1. Calculates CO by use of the arterial pressure waveform analysis in conjunction with patient data (age, sex, height, weight).
2. Uses an internal proprietary algorithm based on the principle that pulse pressure (difference between systolic and diastolic pressure) is proportional to stroke volume (SV) and inversely proportional to aortic compliance.
Lack of calibration procedures is controversial.
Probe is stiff, and placement is not well tolerated by conscious patients.
Probe is stiff, and placement is not well tolerated by conscious patients.
Requires skill to accurately position probe to visualize the LV outflow tract.
Specialized additional tubing setup on ventilator.
Cannot be used in patients who cannot tolerate hypercapnia (elevated CO2).
CO measurement is altered by intrapulmonary shunt.

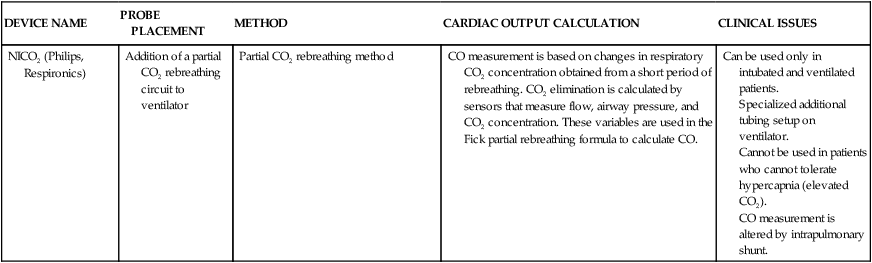
CO, Cardiac output; CO2, carbon dioxide; HR, heart rate; LV, left ventricle; SV, stroke volume.
Thoracic Electrical Bioimpedance.
Thoracic electrical bioimpedance is a noninvasive method of continuous CO measurement. Impedance cardiography works by emitting a low-voltage, high-frequency, alternating electrical current through the thorax by means of four skin electrodes. Two are placed at the base of the neck under the ear and two are placed at the side of the chest in the midaxillary line at the midxyphoid level.47 The sensing electrodes detect changes in electrical impedance within the thorax. Because blood flow through the thoracic aorta causes shifts in impedance, this information can be used to calculate SV and continuous CO. Use of thoracic electrical bioimpedance in the in-hospital setting is uncommon. One cited reason is that, although bioimpedance provides information about CO, it does not provide other clinical information such as cardiac filling pressures that may be helpful to guide treatment.48
Arterial Waveform – Pulse Contour Cardiac Output Methods.
Lithium Dilution Cardiac Output.
The lithium dilution cardiac output system (LiDCO, LiDCO Ltd., United Kingdom) assesses the power of the arterial pressure waveform and identifies changes in arterial power to reflect changes in SV. The LiDCO Plus combines two systems: an initial calibration and ongoing assessment of the pulse waveform guided by a proprietary algorithm. To obtain an accurate baseline measure of SV and CO for calibration, a subtherapeutic dose of lithium is injected into the venous line and measured by a lithium sensor in the arterial catheter. The values obtained are comparable to thermodilution CO measurements.49–51 Recalibration of the system to establish a new baseline is required about every 4 to 8 hours.52
A second system, the LiDCO rapid, a noncalibrated pulse contour system, is also available. In general, noncalibrated systems are reported to have lower levels of CO accuracy when compared with bolus thermodilution CO.53
Pulse Index Contour Cardiac Output.
The pulse index contour cardiac output system (PiCCO2) (Pulsion Medical Systems, Germany) obtains CO by two methods, the transpulmonary CO (baseline) and a continuous CO measurement obtained by analyzing the systolic component of the arterial waveform.54,55 Three calibrations using cold saline are required at initial setup (venous injections with arterial sensor). The venous injection can be delivered from jugular or femoral venous access. The transit time is longer from the femoral artery, which causes a systematic overestimate of the CO, but once recognized, this can be accounted for by following the trend of measurements.56 The manufacturer recommends recalibration every 8 hours, although researchers reported that recalibration is required every 4 to 6 hours or even hourly to maintain accurate CO readings.57–59
The PiCCO system also monitors other clinically relevant variables that offer additional information to guide management in critical illness. The extravascular lung water (EVLW) index measures the volume of lung water in lung tissue and is a marker of pulmonary edema.55 Lung water content increases in conditions such as heart failure, pneumonia, and sepsis and higher lung water content is associated with higher mortality. Knowledge of EVLW may influence whether to administer diuretics or volume.
Pulse contour analysis enables the use of stroke volume variation (SVV) to assess volume status. SVV measures the difference between the highest and lowest SV over the previous 30 seconds. The caveat is that the patient must be mechanically ventilated and not over-breathing the ventilator. This limits SVV usefulness to anesthesia, deep sedation, or pharmacologic paralysis.55
Pulse Contour Cardiac Output Method.
The Vigileo Monitor (Edwards Lifesciences, Irvine, CA) uses pulse contour waveform technology but does not require calibration. A specialized sensor (FloTrac sensor) added to the conventional arterial line setup assesses arterial pressure at a frequency of 100 Hz to characterize the arterial pulse waveform. This information is combined with patient variables (age, sex, weight) in a proprietary algorithm to estimate SV and CO.57,60 The validation studies show conflicting results; some researchers reported that the system was not able to maintain accurate CO readings, and others found it tracked hemodynamic changes accurately in response to vasopressors.57,60
All of the pulse contour systems use different proprietary methods for the estimation of aortic impedance. For this reason, even though the mean CO values may be similar, the different methods trend CO values differently over time in response to volume and inotropic interventions.50,61
Esophageal Doppler Cardiac Output.
The esophagus is used as the monitoring site for patients who are deeply sedated or are under general anesthesia in the operating room. The esophageal Doppler is considered less invasive than a PA catheter. Insertion of the esophageal Doppler is similar to insertion of a gastric tube, although the probe is relatively inflexible and stiff.62 The probe is inserted 35 to 40 cm from the teeth. The tip of the probe rests near T5-T6 on the vertebral column, where the esophagus typically is parallel with the descending aorta.62 There are at least three types of esophageal Doppler monitors available, with proprietary differences in the methods of CO measurement.63 When the probe is correctly placed, this method has a high degree of accuracy for CO measurement.63 Accurate CO values depend on correct placement and on the skill of the operator.64
Partial Carbon Dioxide Rebreathing Cardiac Output.
A different technology involves partial carbon dioxide (CO2) rebreathing and uses a modified Fick principle for CO applied to CO2. This noninvasive cardiac output (NICO) system (Novametrix Medical Systems Inc., Wallingford, CT, USA), involves the addition of an extra circuit (tubing loop) to the ventilator tubing, and it can be used only with intubated, mechanically ventilated patients. A sensor that uses infrared light absorption measures CO2, and a second sensor measures airflow in the circuit tubing to collect data during a breathing cycle. CO2 production is calculated as the product of minute ventilation and CO2 concentration. Arterial CO2 content is derived from end-tidal CO2 and the CO2 dissociation curve. The differences in these values are then used to calculate the CO.65 The validation studies have produced inconsistent results for the accuracy of the derived CO; this might have resulted from intrapulmonary shunt in the critically ill. This system also requires frequent calibration.
Continuous Monitoring of Venous Oxygen Saturation
Indications
Continuous monitoring of venous oxygen saturation is indicated for the critically ill patient who has the potential to develop an imbalance between oxygen supply and metabolic tissue demand. This includes patients in severe sepsis or shock, those after high-risk cardiac surgery, and patients with ARDS.66
Three of these factors (CO, Hgb, and Sao2) contribute to the supply of oxygen to the tissues. Tissue metabolism (Vo2) determines oxygen consumption or the quantity of oxygen extracted at tissue level that creates the demand for oxygen. The relationships of these factors are illustrated in Figure 14-21.
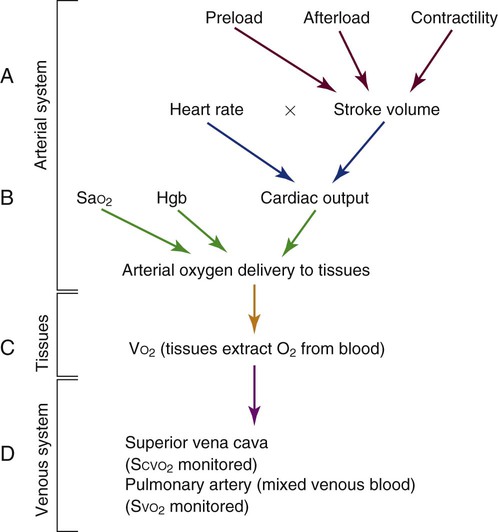
In addition to measurement of venous oxygen saturation, it is possible to calculate the quantity of oxygen (in mL/min) that is provided to the tissues by the cardiopulmonary system and to assess the amount of oxygen consumed by the body tissues. These calculations rely on principles of oxygen transport physiology and are the basis for calculation of Svo2. These formulas are explained in greater detail in Table 14-6 and are listed in Appendix B.
TABLE 14-6
CALCULATIONS OF OXYGEN TRANSPORT PHYSIOLOGY
| NAME | FORMULA | NORMAL VALUE | EXPLANATION |
| Arterial oxygen saturation (Sao2) |
 |
>96% | Sao2 is determined by the amount of oxygen bound to hemoglobin (Hgb), termed oxyhemoglobin (HgbO2). HgbO2 is divided by the total hemoglobin (Hgb + HgbO2). Normally, 96% of oxygen is bound to hemoglobin. |
| Blood oxygen content Cao2 (arterial) Cvo2 (venous) |
(O2 dissolved) + (O2 saturation) (Po2 × 0.003) + (1.34 × Hgb × So2) |
19-20 mL/dL 12-15 mL/dL |
Blood oxygen (O2) content is the amount of oxygen dissolved in 100 mL (1 dL) of blood. It can be calculated for arterial blood (Cao2) and for venous blood (Cvo2). Measured in units of mL/dL, it is the combination of dissolved O2 (Pao2) and O2 saturation (Sao2). |
| Blood oxygen transport (i.e., oxygen delivery) | CO × Cao2 × 10 (arterial) CO × Cvc2 × 10 (venous) |
1000 mL/min 750 mL/min |
Oxygen transport represents the amount (mL) of oxygen transported to or from the tissues each minute (mL/min). Arterial O2 transport is a measure of the O2 delivered to the tissues. Venous O2 transport reflects the venous return to the right side of the heart. Oxygen transport is calculated by multiplying the cardiac output (CO) by the oxygen content (Cao2 or Cvo2) and by the number 10. The difference between normal arterial and normal venous O2 return represents oxygen consumption by the tissues. |
| Tissue oxygen consumption (Vo2) | Arterial O2 transport minus venous O2 transport (CO × Cao2 × 10) − (CO × CVO2 × 10) |
250 mL/min | Oxygen consumption is the amount of oxygen consumed by the tissues in 1 minute. To calculate Vo2, the arterial oxygen transport and venous oxygen transport values (calculated in mL/min) must be known. The difference is Vo2. |
| Arterial-venous oxygen difference (a-v O2 difference) | Arterial O2 content minus venous O2 content Cao2 − CVO2 |
3.0-5.5 mL/dL | The a-v O2 difference is the difference between the arterial oxygen content (Cao2) and the venous oxygen content (Cvo2). Because Cao2 and CVO2 are measured in mL/dL, the a-v O2 difference is also measured in mL/dL. |
| Mixed venous oxygen saturation (Svo2) | Arterial O2 transport minus tissue O2 consumption equals venous O2 return (CO × Cao2 × 10) − Vo2 |
60%-80% | Svo2 is the venous oxygen return that is bound (saturated) to hemoglobin. Saturation is measured as a percentage (%). The Svo2 value is a function of the amount of oxygen delivered to the tissues minus the amount of oxygen consumed by the tissues (Vo2) and is measured in mL/min. The higher the amount (mL) of oxygen in the venous return, the greater the hemoglobin saturation. |

Catheters
SCVO2 Catheter.
The Scvo2 catheter has been successfully used to guide hemodynamic fluid resuscitation in septic patients.27 The relationship between the values obtained from the traditional PA (Svo2) catheter and the central venous (Scvo2) catheter are very similar, although the Scvo2 values are slightly higher. The trend of parallel measurements (up or down as patient condition changes) is in the same direction most cases.
SVO2 or SCVO2 Calibration.
To recalibrate the fiberoptic module to verify accuracy when the catheter is already inserted in a patient, a mixed venous blood sample (Svo2) or central venous sample (Scvo2) must be withdrawn from the appropriate catheter tip and sent to the laboratory for oxygen saturation analysis. In many critical care units, this is a standard daily procedure to ensure that readings used to guide patient care remain accurate.67
Nursing Management
Normal SCVO2 Values.
The normal values for the Scvo2 catheter are slightly higher, because the reading is taken before the blood enters the right heart chambers, where the cardiac sinus (vein) delivers venous blood drained from the myocardium into the right atrium. The heavily desaturated myocardial blood decreases the oxygen saturation slightly. For this reason, Svo2 values are always slightly lower than Scvo2 readings in the same patient.68


SVO2 or SCVO2 and Arterial Oxygen Saturation.
A change in Svo2 or Scvo2 may be caused by a change in arterial oxygen saturation (Sao2). If the Sao2 is increased because supplemental oxygen is being administered, the Svo2 also will increase. If the oxygen supply is disrupted and Sao2 is decreased, Svo2 will decrease. The Svo2 can be decreased by any action or disease that reduces oxygen supply, including ARDS, endotracheal suctioning, removing a patient from the ventilator, or removing supplementary oxygen. Figure 14-22 demonstrates a drop in Svo2 during suctioning in a patient with ARDS. Transient decreases in Svo2 or Scvo2 related to a nursing action such as endotracheal suctioning are not usually a cause for concern. Some patients may be slow to resaturate up to the presuction level of Svo2 or Scvo2. In this case, an appropriate nursing intervention is to wait until the venous oxygen saturation has again returned to baseline before initiating other nursing activities.
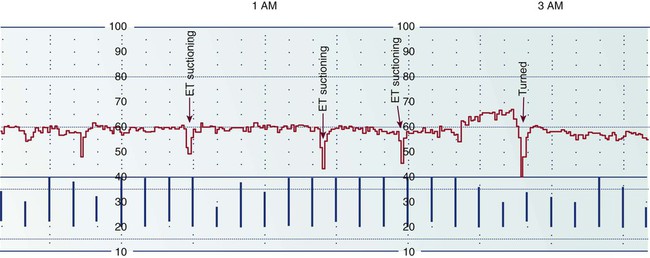
SVO2 or SCVO2 and Cardiac Output.
A change in Svo2 or Scvo2 may be caused by an alteration in CO. Four hemodynamic factors affect CO: preload, SVR, contractility, and HR (see Fig. 14-21). Changes in one or more of these individual factors affects CO. Figure 14-23 shows an improvement in a patient’s Svo2 concentration from 70% to 80% after volume administration that increased preload (point A). Later, this patient’s CO fell abruptly during a short run of ventricular tachycardia (VT) (point B). Any major loss of HR causes a decrease in CO. Alterations in contractility, preload, and afterload (SVR) also have the potential to alter CO.
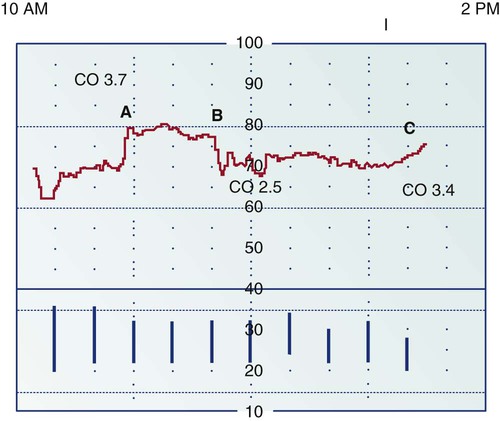
Point A: Just before point A, Svo2 readings are low because CO and pulmonary artery pressures were low as a result of excessive diuresis. Infusion of 500 mL of colloid solution and 1000 mL of lactated Ringer’s solution crystalloid increased the Svo2 level and improved the CO, which rose to 3.7 L/min. Point B: A short run of ventricular tachycardia caused the CO to fall abruptly to 2.5 L/min and decreased the Svo2 value. Point C: The beginning of an upward trend in Svo2 is related to administration of fluids and to improvement in CO and in filling pressures. CO is now 3.4 L/min. The graph represents a 4-hour printout; the space between each dotted line represents 20 minutes.
This principle is clearly illustrated in the Svo2 Hemodynamic Profile 3 (Box 14-6), in which an increase in Svo2 is not associated with a significant rise in CO. The rationale and explanation for this finding is also discussed in the section on assessment of oxygen consumption.
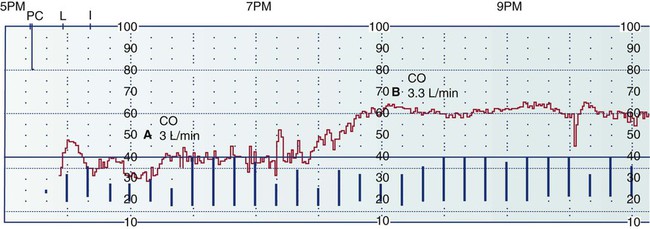

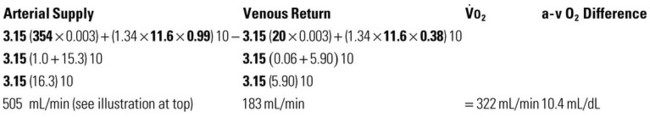
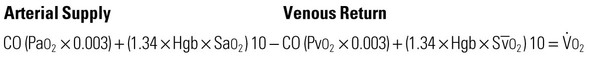
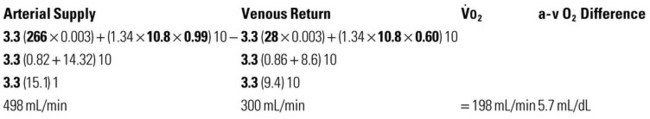
SVO2 or SCVO2 and Oxygen Consumption.
Oxygen consumption Vo2 describes the amount of oxygen the body tissues consume for normal function in 1 minute. If the body’s metabolic demands increase because of exercise or increased metabolic rate, the body increases CO to augment oxygen supply and uses reserve oxygen in the venous system. Normal oxygen delivery to the tissues is 1000 mL (1 L) of oxygen per minute. At rest, a person may consume one fourth of the available oxygen, or 250 mL of oxygen per minute. This leaves a venous oxygen reserve of 750 mL of oxygen per minute (see Table 14-6). For the normal individual, the combination of increased CO and use of considerable venous oxygen reserve provides adequate compensation for increased metabolic needs. However, for the critically ill patient with cardiac or respiratory dysfunction, an increase in activity leading to increased oxygen consumption may overwhelm the cardiopulmonary system and oxygen reserves.
In the critically ill patient, nursing procedures can increase Vo2 by 10% to 36% (Table 14-7). The critical care nurse can observe the effect of increased Vo2 during routine nursing care and under conditions that increase metabolic rate. Activities such as turning, giving a backrub, or getting a patient out of bed are often accompanied by a sudden, temporary decrease in the patient’s continuous Svo2 or Scvo2 reading. After the physical activity is finished, most patients resaturate up to their preactivity venous saturation level within a few minutes. In critically ill patients, it may take up to 5 minutes for resaturation (increase in Svo2 or Scvo2) to occur. In this situation, the appropriate nursing action is to observe the patient clinically in conjunction with monitoring Svo2 or Scvo2 and to postpone additional maneuvers until the venous saturation has returned to baseline.
TABLE 14-7
ALTERATIONS IN OXYGEN CONSUMPTION
| CONDITION OR ACTIVITY | % INCREASE OVER RESTING Vo2 | % DECREASE UNDER RESTING Vo2 |
| Clinical Conditions That Increase Vo2 | ||
| Fever | 10% (for each 1° C above normal) | |
| Skeletal injuries | 10%-30% | |
| Work of breathing | 40% | |
| Severe infection | 60% | |
| Shivering | 50%-100% | |
| Burns | 100% | |
| Routine postoperative procedures | 7% | |
| Nasal intubation | 25%-40% | |
| Endotracheal tube suctioning | 27% | |
| Chest trauma | 60% | |
| Multiple organ dysfunction syndrome | 20%-80% | |
| Sepsis | 50%-100% | |
| Head injury, with patient sedated | 89% | |
| Head injury, with patient not sedated | 138% | |
| Critical illness in emergency department | 60% | |
| Nursing Activities That Increase Vo2 | ||
| Dressing change | 10% | |
| Electrocardiogram | 16% | |
| Agitation | 18% | |
| Physical examination | 20% | |
| Visitor | 22% | |
| Bath | 23% | |
| Chest radiograph examination | 25% | |
| Position change | 31% | |
| Chest physiotherapy | 35% | |
| Weighing on sling scale | 36% | |
| Conditions That Decrease Vo2 | ||
| Anesthesia | 25% | |
| Anesthesia in burned patients | 50% | |
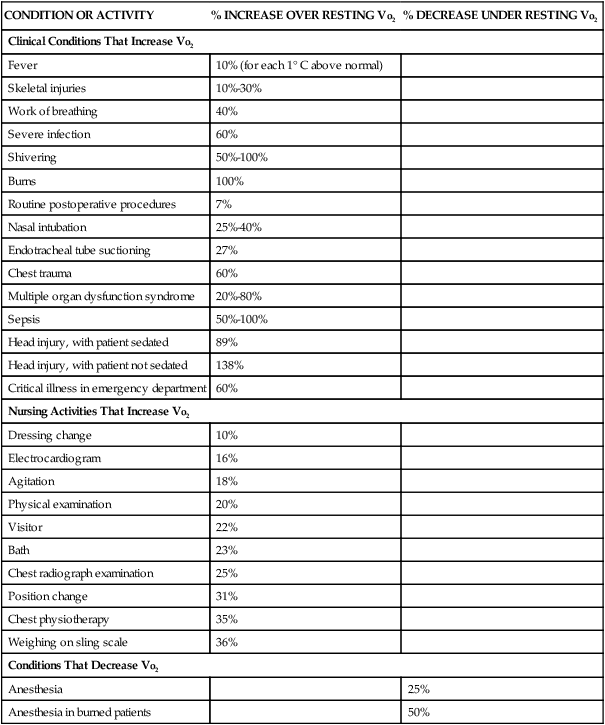
Modified from White KM, et al. The physiologic basis for continuous mixed venous oxygen saturation monitoring. Heart Lung. 1990;19(5 Pt 2):548.
Many clinical conditions that dramatically increase Vo2 consumption are often seen in critical care units. Conditions such as sepsis, multiple organ dysfunction syndrome (MODS), burns, head injury, and shivering can more than double the normal oxygen tissue requirements (see Table 14-7). Such dramatic increases in Vo2 translate into a low Svo2 or Scvo2 value, even if the CO is normal. This situation is demonstrated in Hemodynamic Profile 3, in which intense shivering resulted in increased tissue oxygen consumption and a low initial Svo2 value (point A); after sedation, the Svo2 value increased due to the normalization of tissue oxygen requirements (point B).
Low SVO2 or SCVO2.
If Svo2 or Scvo2 falls below 60% and is sustained, the clinician must assume that oxygen supply is not equal to demand (Table 14-8). It is helpful to assess the cause of decreased Svo2 or Scvo2 in a logical sequence that reflects knowledge of the meaning of the venous saturation value. The following is one such assessment sequence:
TABLE 14-8
MEASUREMENTS OF MIXED VENOUS OXYGEN SATURATION
| Svo2 MEASUREMENT | PHYSIOLOGIC BASIS FOR CHANGES IN Svo2/Scvo2 | CLINICAL DIAGNOSIS AND RATIONALE |
| High Svo2 (80%-95%) | Increased oxygen supply Decreased oxygen demand |
Patient receiving more oxygen than required by clinical condition |
| Anesthesia, which causes sedation and decreased muscle movement | ||
| Hypothermia, which lowers metabolic demand (e.g., during cardiopulmonary bypass) | ||
| Sepsis caused by decreased ability of tissues to use oxygen at a cellular level | ||
| False high-positive result because the pulmonary artery catheter is wedged in a pulmonary arteriole (Svo2 only) | ||
| Normal Svo2/Scvo2 (60%-80%) Low Svo2/Scvo2 (<60%) | Normal oxygen supply and metabolic demand Decreased oxygen supply caused by: |
Balanced oxygen supply and demand Anemia or bleeding with compromised cardiopulmonary system Hypoxemia resulting from decreased oxygen supply or lung disease |
| Low hemoglobin (Hgb) | Cardiogenic shock caused by LV pump failure | |
| Low arterial saturation (Sao2) Low CO Increased oxygen consumption (Vo2) |
Metabolic demand exceeds oxygen supply in conditions that increase muscle movement and increase metabolic rate, including physiologic states such as shivering, seizures, and hyperthermia and nursing interventions such as being weighed on a bed scale and turning |
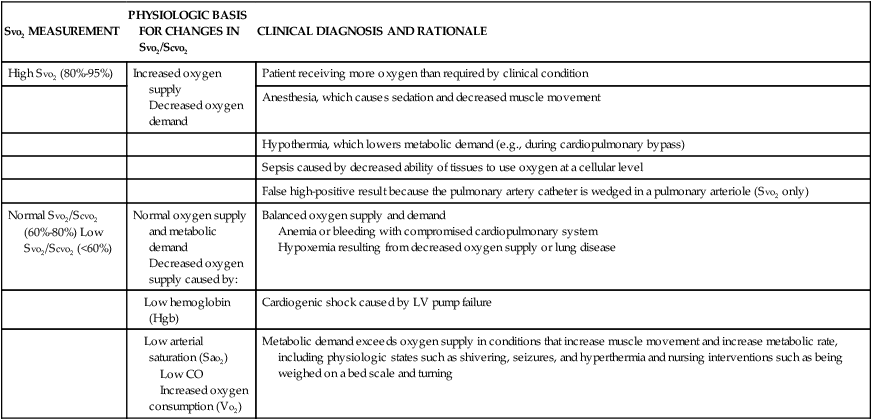
Scvo2, Central venous oxygen saturation; Svo2, mixed venous oxygen saturation.
1. Clinically assess the patient.
2. Assess whether the decreased Svo2 or Scvo2 is caused by low oxygen supply. Verify the effectiveness of the ventilator or oxygen mask, or check Sao2 from arterial blood gas values.
3. Assess cardiac function by performing a CO measurement.
4. Assess the hemoglobin value by checking recent laboratory results or by withdrawing a blood sample for laboratory analysis.
5. Assess whether the decreased Svo2 or Scvo2 is the result of a recent patient movement or nursing action that may have temporarily increased Vo2.
The concept of target values is helpful when designing protocols for hemodynamic monitoring. Target values for venous oximetry are an Svo2 of 70% or above and a Scvo2 of 65% or above. The concept is that patients with values below these targets are at greater risk for organ hypoperfusion and increased mortality. This was seen in a study of intraoperative and postoperative surgical patients, in whom an Scvo2 below 65% was associated with increased mortality.69,70 Based on studies of patients with sepsis, the Surviving Sepsis Campaign guidelines recommend that Scvo2 be maintained above 70% for septic patients.42 This represents a clinically useful target to aim for, even as research is ongoing to find the optimal Scvo2 value to predict survival.
If Svo2 or Scvo2 falls below 40%, and is maintained at this low value, the imbalance of oxygen supply and demand will not be adequate to meet tissue needs at the cellular level. At some point, the cells change from an aerobic to anaerobic mode of metabolism, which results in the production of lactic acid and is representative of a shock state in which cellular injury or cell death may result. At this point, every attempt must be made to determine the cause of the low Svo2 or Scvo2 and to correct the oxygen supply–demand imbalance. To avoid the risk of lactic acidosis, it is helpful to watch the trend of the Svo2 or Scvo2 and to intervene early with a goal of returning the venous oxygen saturation to 70%.42
High SVO2.
In certain clinical conditions, Svo2 or Scvo2 may increase to an above-normal level (greater than 80%). This occurs during times of low oxygen demand (decreased Vo2), such as during anesthesia or hypothermia. In some cases of septic shock, the tissue cells cannot use the oxygen supplied to them, and the oxygen is not extracted from the blood at the tissue level. In this situation, the venous oxygen reserve remains elevated, and the Svo2 or Scvo2 value is higher than normal (see Table 14-8). If the Svo2 PA catheter drifts into a wedged position, the Svo2 increases because the fiberoptic tip of the catheter comes into contact with newly oxygenated blood.