Chapter 16 Cardiac output monitoring
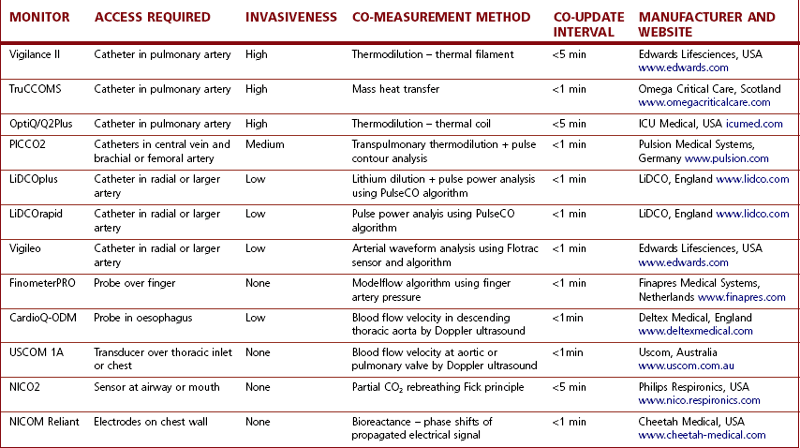
Newer methods of assessing and optimizing cardiovascular function have been developed that allow vastly improved therapeutic intervention by anaesthetists in the perioperative period. Today, at least a dozen devices are available to measure or estimate CO quite accurately. Some of the more popular ones, based on their market presence or adoption in clinical practice, will be described in this chapter. Table 16.1 is a more comprehensive list of the available equipment and their associated technologies.
Table 16.1 A representative sample of the variety of devices available for measuring CO and their technological bases.
Pulmonary artery catheter
The advent of the Swan-Ganz pulmonary artery catheter (PAC) in 1970 enabled clinicians to measure cardiac output (CO) at the bedside.1
For most of the last 40 years, the PAC has been the preferred tool for haemodynamic monitoring in critically ill patients. As well as CO, the PAC can measure right heart and pulmonary artery pressures, estimate cardiac preload, and evaluate global oxygen delivery and consumption. Although such a comprehensive assessment of the circulation would be assumed to enhance patient care, there is little evidence to support this notion. Several studies have failed to show that using a PAC improved the outcome of critically ill patients in general2,3 or those with congestive cardiac failure4 or acute respiratory distress syndrome.5 Now and consequent to the emergence of the other less invasive technologies for measuring CO discussed later in this chapter, the last ten years has seen a continuing and dramatic decline in PAC usage.
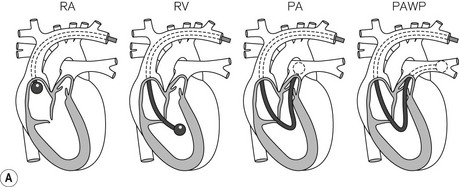
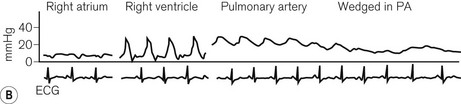
The original PAC was a double lumen balloon-tipped catheter. A wide range of PACs is now available with one manufacturer producing around 30 different models. The PAC for adult use is typically a multi-lumen catheter, 110 cm in length and 7.0 or 7.5 F (French gauge) in external diameter. It is inserted via an introducer sheath (8.0–9.0 F depending on catheter model) into the internal jugular, subclavian or femoral vein. The proximal ports on the catheter are intended for administration of fluids or drugs, with their lumens appearing 19–30 cm from the distal tip of the catheter. To position the PAC, the balloon is inflated with air (1.5 ml) and the catheter is advanced with continuous pressure monitoring from the distal lumen. The typical waveforms and pressures encountered as the catheter traverses the right atrium and right ventricle on its way to the pulmonary artery (PA) should be familiar to anyone using this device (Fig. 16.1).
Modified pulmonary artery catheters
Data from the continuous CO catheter can be synchronized with the electrocardiogram to obtain right ventricular stroke volume, right ventricular end-diastolic volume, and calculate right ventricular ejection fraction. Oximetric catheters contain a fibre-optic cable and permit continuous measurement of mixed venous oxygen saturation (SvO2) from the distal pulmonary artery. Some catheters have embedded pacing wires for atrial, ventricular or dual chamber pacing. Like other central vascular catheters, the PAC can be coated with an antimicrobial agent to reduce the risk of catheter-related infection. A latex-free PAC is also available.
Limitations
1. Central venous cannulation is an invasive procedure with risks of arterial puncture, haemorrhage and pneumothorax.
2. The PAC can become knotted during insertion or later and may need to be removed surgically.
3. The indwelling introducer sheath and PAC are potential causes of sepsis and thrombus formation. The risk of infection appears to increase significantly if the catheters are left in for more than 72 h.
4. The PAC may cause arrhythmias particularly in the presence of hypothermia or electrolyte disturbances.
5. Improper balloon inflation and monitoring (e.g. failure to recognize an inadvertently wedged catheter) can result in arterial rupture, pulmonary infarction or haemorrhage.
6. The presence of the PAC may worsen pre-existing tricuspid regurgitation (TR). Over and underestimation of the true CO have been reported when there is TR. Continuous CO devices may be less affected by TR than when CO is measured intermittently.
7. CO measurement may be inaccurate in the presence of intracardiac shunts.
Oesophageal doppler method for measurement of cardiac output
Doppler effect
Oesophageal Doppler cardiac output monitors measure blood flow velocity in the descending aorta. An ultrasound probe (see below) is inserted into the distal third of the oesophagus. The ultrasound signal is backscattered by red cells travelling in the descending aorta by virtue of their differing acoustic impedence to the surrounding plasma (see Chapter 31). The returning ultrasound, is at a lower frequency (if flow direction is away from the source) and the difference between the two frequencies – the Doppler shift – is proportional to the velocity of the aortic blood flow as shown in the equation:
where:
V is velocity of red blood cells (blood flow)
C is speed of ultrasound travelling through biological tissues
Fe is emitted frequency from ultrasound device
Cosφ is cosine of angle (φ) between the sound beam axis and the direction of blood flow (angle of insonation).
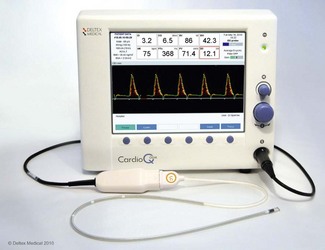
CardioQ-ODM (Deltex Medical)
In the 1990s Abbott Medical marketed an early version of the oesophageal Doppler monitor, the ODMII, from this manufacturer. A major revision of the monitor resulted in the appearance of the CardioQ in 2000. The current model, the CardioQ-ODM (Fig. 16.2), was introduced in 2009. Compared to the CardioQ, the monitor screen has a higher resolution and a USB has replaced the RS232 ports to facilitate downloading of data and screenshots. The original algorithm to convert flow velocity to stroke volume is still used in the latest model, although some software enhancements have improved the monitor’s facility to store and display a variety of haemodynamic data.
Aortic flow signal
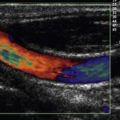
Flow signals acquired by the probe are processed by fast Fourier transformation (FFT) and represented on the monitor as a spectral density display of the distribution of red blood cell flow velocities (vertical axis) against time (horizontal axis). Descending aortic blood flow gives a positive deflection and is approximately triangular in shape (Fig. 16.3).
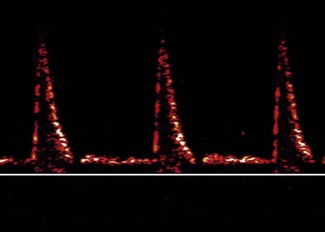
Figure 16.3 Ideal aortic waveform. The brightness of the signal is on the periphery of the waveform.
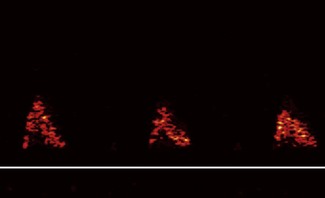
Note that flow in the descending aorta occurs predominantly during systole; there is minimal forward flow in diastole. Correct identification of the descending aortic waveform is a prerequisite for oesophageal Doppler monitoring. Ideally, the aortic waveform should appear triangular with the ‘brightness’ confined to the peripheral edge and an absence of signal in the central part of the triangle. This type of waveform is characteristic of a plug flow profile (present in the descending aorta) with a narrow spread of red cell velocities. Turbulent flow or unsatisfactory orientation of the transducer towards the descending aorta would show evidence of spectral dispersion (Fig. 16.4).
The Doppler frequency is proportional to flow velocity and being in the audible range may be transmitted through speakers. The two rotary controls on the monitor (Fig. 16.2) adjust the volume of the audio output and amplify the signal (gain) seen on the waveform display until the optimal signal is obtained. The same rotary controls may also be used to navigate through various menu options.
Doppler probe
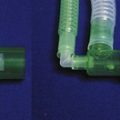
The CardioQ-ODM uses continuous wave Doppler ultrasound. This is transmitted through an oesophageal probe that consists of a 50 cm length of a tightly coiled, steel spring, mounted with send-and-receive piezo-electric transducers (Fig. 16.5).
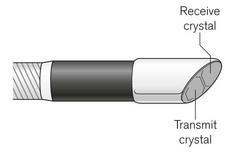
The 45° bevel of the transducer defines the angle of insonation relative to the direction of blood flow in the descending aorta. At its proximal end, the probe terminates in an asymmetric connector containing a memory chip. The whole probe is encased in silicone and measures about 19 F – the size of a large nasogastric tube (Fig. 16.6). The adult probe has three markers indicating 35, 40 and 45 cm from the distal end which are used to guide the initial depth of probe insertion via the mouth (35–40 cm) or nose (40–45 cm).
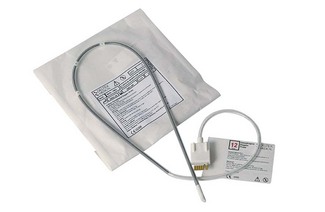
Figure 16.6 Doppler Probe (CardioQ). Note the flexible probe shaft, three depth markers and patient interface connector.
There are several versions of the probe. All are designed for single-patient use only. Adult probes differ in the pre-programmed maximum monitoring duration (6, 12 or 240 h). The ‘awake Doppler probe’ was designed to be softer and more flexible to facilitate insertion through the nose in the awake patient. The paediatric probe has a similar construction, but is shorter and has markings from 15 to 40 cm at 5 cm intervals. This probe has a monitoring limit of 72 h and can be used in children weighing upwards of 3 kg.
Probe insertion
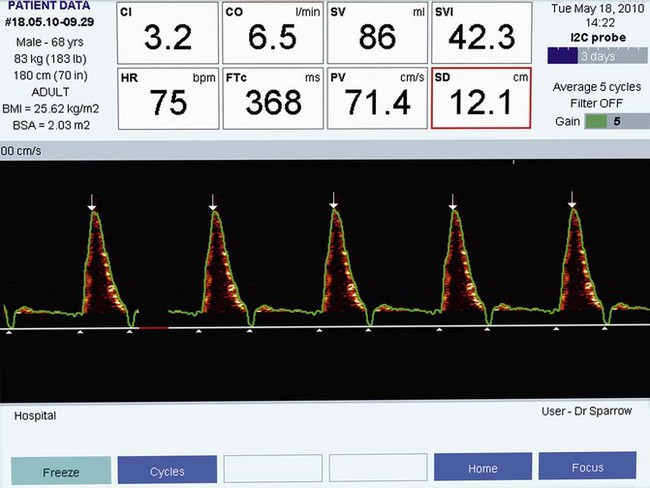
The lubricated probe is inserted into the oesophagus to an appropriate depth. If the probe is inserted orally in an adult, the descending aortic signal is typically found at a depth of 35–40 cm from the lips. To commence monitoring, the probe is connected to the monitor (via a separate patient interface cable) and the patient’s age, weight and height are entered. The signal is found by a combination of rotation and slight advancement or withdrawal of the probe. Some experience is required, such that if the user is familiar with the characteristic appearance and sound associated with the optimal aortic flow waveform (Fig. 16.7), then probe positioning and monitoring are rapidly achieved.
The CardioQ-ODM parameters
Corrected flow time (FTc)
Flow time (FT) is the duration of blood flow in the descending aorta resulting from each cardiac ejection. It is indicated by two white triangles at the base of each waveform (Fig. 16.7).
A low FTc (<330 ms) is seen in hypovolaemia, decreased LV preload states due to major circulatory ‘obstruction’ (e.g. pulmonary embolus or isolated right ventricular failure). A low FTc may also reflect an elevated LV afterload, as may occur with significant peripheral vasoconstriction (Fig. 16.8).
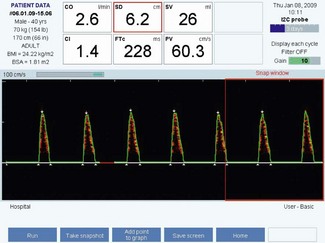
Figure 16.8 Characteristic waveform from a hypovolaemic patient: shortened flow time and low stroke volume.
A prolonged FTc (>360 ms) is seen with decreased LV afterload, such as in a vasodilated circulation (e.g. sepsis, epidural anaesthesia) (Fig. 16.9).
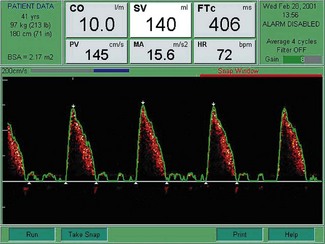
Peak velocity (PV)
The PV is the highest velocity of descending aortic flow, indicated by the white arrow at the top of the waveform (see Figs 16.7, 16.8 and 16.9). Peak velocity decreases linearly with age, as it is affected by LV contractility, which also declines with age. PV is affected by LV preload (low preload = low PV) and afterload (high afterload = low PV). The normal ranges for peak velocity are shown in Table 16.2. An erroneous, low peak velocity may be recorded if the angle of insonation is significantly greater than 45°. This may occur in the presence of an abnormal anatomical relationship between the axes of the oesophagus and thoracic aorta.
| AGE (YEARS) | PEAK VELOCITY (cm/s) |
|---|---|
| 20 | 90–120 |
| 50 | 70–100 |
| 70 | 50–80 |
Mean acceleration (MA)
The MA is the average rate of change of velocity of blood flow from the start until the time at peak velocity. Mean acceleration reflects LV contractility, but is also affected by changes in afterload and, to a lesser extent, preload.6
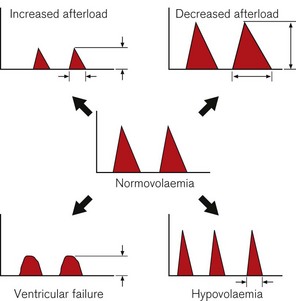
Changes in contractility and loading tend to produce characteristic changes in peak velocity or flow time. These are indicated in Fig. 16.10.
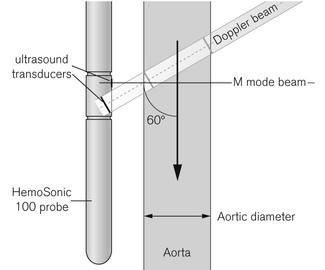
HemoSonic 100, Arrow Critical Care Products, USA
The HemoSonic system utilizes a probe with two ultrasound transducers (Fig. 16.11). One points perpendicularly to the axis of the probe and is used in M Mode (see Chapter 31) to confirm probe position and to measure aortic diameter. The second distally placed pulsed Doppler transducer is angled at 60° towards descending aortic flow to measure flow velocity in the same area. The probe is a little larger as a consequence and is reused, necessitating a disposable cover and oral usage only. This device is no longer in production but illustrates an alternative approach.
Arterial pressure waveform analysis
The increase in aortic pressure that occurs with left ventricular ejection will depend on the stroke volume, aortic capacitance and the vascular tone or compliance. The CO estimated from arterial pressure analysis can be calibrated directly against a measured reference CO or inferred using reference data biometrically matched to the patient. The limitations of these devices reflect the fundamental problem of inferring volume from pressure. Pressure-derived CO tends to become inaccurate when there are rapid or extreme changes in peripheral resistance. Cardiac output estimation may also be unreliable in the presence of rapid or persistent arrhythmia, if the arterial cannula becomes kinked, if the waveform is damped, and when an intra-aortic balloon is being used.
PiCCO2 (Pulsion Medical Systems)
The first arterial pressure-derived CO monitor (PiCCO) from Pulsion Medical Systems was available in 1997. The PiCCO2 was brought out in 2008 and uses a similar algorithm to the original monitor. Stroke volume is estimated from the area under the systolic portion of the arterial pressure waveform with adjustments for aortic compliance, impedance and the shape of the arterial waveform (Fig. 16.12).
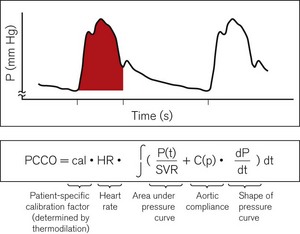
Figure 16.12 Cardiac output calculation in the PiCCO. PCCO, pulse contour cardiac output; SVR, systemic vascular resistance.
Additional variables
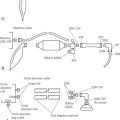
One of the unique features of the PiCCO2 is its ability to estimate cardiac preload, cardiac function and extravascular lung water. After injection into a central vein, the cold saline indicator is distributed serially through three compartments – (a) in the thorax, (b) the right heart, (c) the lungs and the left heart – before reaching the artery where the temperature change is measured. The volumes of these compartments can be calculated with reference to the transpulmonary thermodilution curve. The mean transit time (MTt) is the time taken for half of the indicator to be detected (Fig. 16.13).
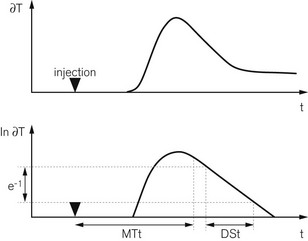
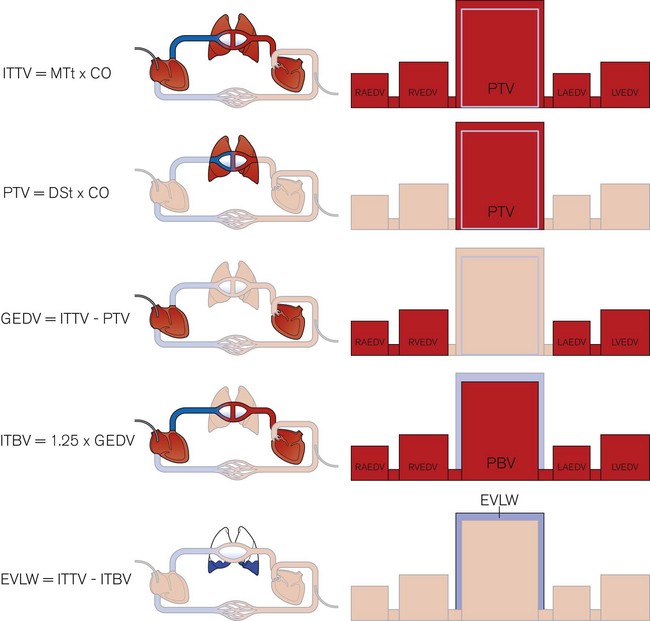
The product of MTt and CO equals the intrathoracic thermal volume (ITTV). The slope of the terminal portion of the thermodilution curve is governed by the largest of the three compartments – the lungs in this case.7 The product of the exponential downslope time (DSt) and CO gives the pulmonary thermal volume (PTV). The volume of blood in the right and left heart chambers at the end of diastole, called the global end diastolic volume (GEDV), is the difference between PTV and ITTV. The GEDV gives a relative measure of cardiac preload and at least one study suggests that absolute values may depend on gender and age.8 Based on previous work showing that the intrathoracic blood volume (ITBV) is consistently 25% greater than the GEDV, extravascular lung water (EVLW) is the difference between ITTV and ITBV.9 These volume calculations are summarized in Fig. 16.14. Other haemodynamic indices can be calculated from the available data and include the global ejection fraction (GEF), cardiac function index (CFI), cardiac power (CP) and pulmonary vascular permeability index (PVPI).
LiDCOplus and LiDCOrapid
These monitors use the same algorithm (PulseCO) to estimate CO from the arterial pressure waveform. The arterial pressure waveform is slaved to the LiDCO devices via standard analogue outputs from any patient monitor. In the LiDCOplus, CO is also measured intermittently by lithium-dilution (see below) and this value is used to calibrate the nominal CO obtained by the algorithm.
Lithium dilution cardiac ouput
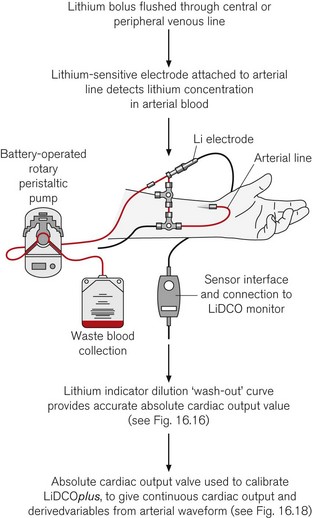
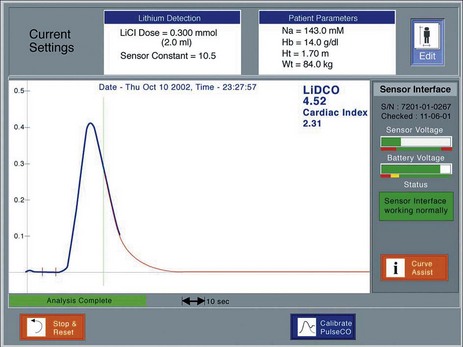
The principle of measuring CO by lithium-dilution is the same as for other indicator-dilution methods. A bolus of lithium chloride is injected into a peripheral or central vein. Lithium concentration is measured in blood from a peripheral artery by a sensor containing a lithium-selective electrode. The sensor is prepared by flushing its flow-through cell with saline before connecting it, via a three-way tap, to any existing arterial line (Fig. 16.15). The saline soaks the internal wick that makes the electrical connection between the blood in the cell and a reference electrode. To measure CO, blood is drawn from the arterial line at a constant rate (4.5 ml min−1) by a battery-operated pump. Once the baseline voltage of the sensor stabilizes, a 2 ml bolus of lithium chloride (0.15 mM/ml) is rapidly flushed into a vein. The voltage response of the sensor is related to the change in lithium concentration; hence, a plot of lithium concentration against time can be obtained and used to calculate CO (Fig. 16.16). Because the lithium is only distributed in the plasma, the haemoglobin concentration is necessary to convert plasma lithium concentration to whole blood concentration in order to derive blood flow.
PulseCO continuous cardiac output
The pressure waveform data sampled at 100 Hz is compliance corrected based on cadaveric aortic pressure/volume data and scaled for individual aortic capacitance to produce a corresponding volume waveform in the same time domain. Modified auto covariance (a type of signal processing analysis) is then applied to derive the input function for this waveform, i.e. the stroke volume (Fig. 16.17).
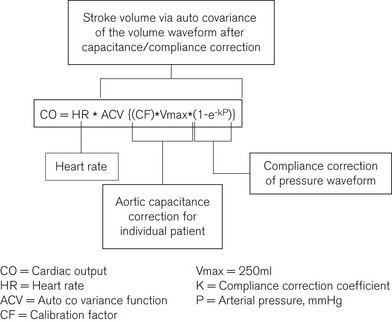
The algorithm is calibrated in the LiDCOplus using the CO value obtained by lithium-dilution. The calibration factor is in effect the ratio of the nominal and lithium-dilution CO values. The calibration factor reflects the aortic capacitance, which is patient-specific and assumed to remain relatively unchanged over a period of a few days. However, depending on the underling hemodynamic condition, the frequency of calibration may need to be as frequently as every 4 h.10
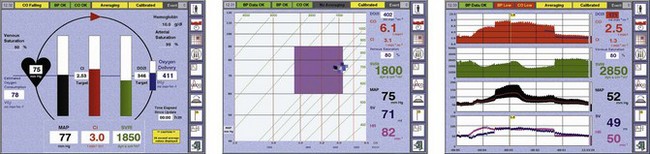
The LiDCOplus screen can be configured to display the haemodynamic data as trends or graphically to assist decision-making (Fig. 16.18).
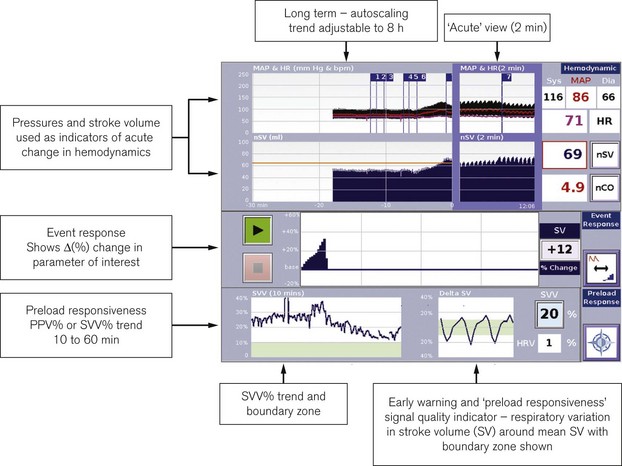
LiDCOrapid
This device is intended to be minimally invasive and has been designed specifically for intraoperative monitoring. It has a single comprehensive screen displaying a combination of preload indicators such as pulse or stroke volume variation and standard haemodynamic trends (Fig. 16.19). A credit-card style smart card slots into the side of the monitor to activate it for use. The monitor requires only the arterial pressure to be slaved from the patient monitor. The PulseCO algorithm is used to convert arterial pressure to a nominal CO. Using in vivo calibration data previously obtained in postoperative patients, the nominal CO is converted to an estimated CO adjusted for the patient’s age, weight and height. The resulting CO values are known to be less accurate than those from LiDCOplus calibrated using lithium-dilution, but trends in estimated variables and observed responses to therapeutic interventions should hold as true as for calibrated CO. The LiDCOrapid can also be calibrated using a reference CO obtained from another source.
FloTrac-Vigileo (Edwards Lifesciences, USA)
The FloTrac sensor in conjunction with the Vigileo monitor continuously estimates CO from a peripherally measured arterial pressure. The standard arterial pressure transducer is replaced by the FloTrac sensor (Fig. 16.20), which is connected to a cannula in the femoral (preferred), brachial or radial artery. The sensor and associated pressure transducer tubing are packaged for single-patient use. After zeroing the sensor to atmosphere the patient’s age, gender, height and weight are entered in the Vigileo (Fig. 16.20). The patient bedside monitor and the Vigileo are both connected to the FloTrac so that the arterial pressure can be monitored in the usual fashion while the data are used simultaneously to derive CO. As for any arterial pressure-derived CO monitor, under- or over-damping of the arterial waveform should be avoided by ensuring that the cannula is not malpositioned and the lumen remains patent.
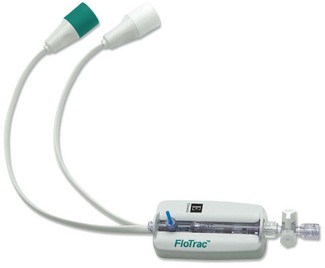
Figure 16.20 The FloTrac sensor.
Photograph courtesy of Edwards Lifesciences Corporation, Irvine, California.
FloTrac algorithm
The FloTrac algorithm for ‘arterial pressure based cardiac output’ is given as:
where PR is the transduced pulse rate and δAP. χ represents stroke volume.
Stroke volume is derived from a complex process of statistical analysis and signal processing.11 In essence, stroke volume is determined by two elements: the amplitude of arterial pressure and the characteristics of the arterial tree. The first element is represented by the standard deviation of arterial pressure (δAP), which is calculated from a large number of arterial pressures sampled at 100 Hz over 20 s (i.e. about 2000 values). The second element, denoted by ‘chi’ (χ), is a dynamic polynomial function accounting for arterial compliance and vascular tone. Arterial compliance is estimated from the patient’s age, mean arterial pressure, gender and size. The skewness and kurtosis of the arterial waveform is also analyzed to determine changes in vascular tone. Since it was first introduced in 2005, the FloTrac algorithm has undergone two major revisions. In the second-generation software, the χ function was updated more frequently at 1-min instead of 10-min intervals. The current third-generation software, launched in 2009, improved the accuracy of CO estimation in patients with low systemic vascular resistance (e.g. sepsis).
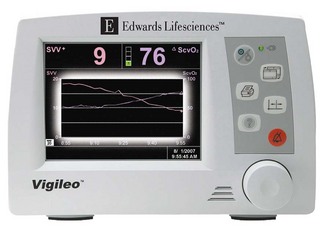
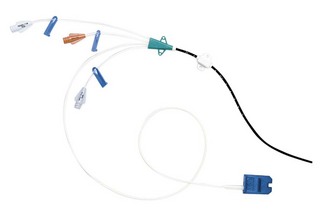
The Vigileo monitor (Fig. 16.21) has the capability to measure central venous oxygen saturation (ScVO2) continuously using the PreSep central venous oximetry catheter (Fig. 16.22). ScVO2 has been shown to correlate reasonably well with mixed venous oxygen saturation (SvO2) and, therefore, can be used to assess the adequacy of oxygen delivery. The Vigileo displays stroke volume variation as a predictor of preload responsiveness during positive pressure ventilation. The current FloTrac algorithm cannot be used in adults below 40 kg.
The NICOM
The NICOM (Cheetah Medical Inc, USA) is a completely non-invasive CO monitor. Four dual electrode pads are applied symmetrically on the thorax, approximately at mid-clavicle above and at the lower margin of the rib cage below (Fig. 16.23). Each electrode pad is positioned so that the two sections of the electrode are orientated vertically. The exact location of the electrode is not critical and they can also be placed on the back of the thorax. Cardiac output is measured using the proprietary Bioreactance method. A 75 KHz radiofrequency signal is transmitted across the thorax from the outer section of the electrodes. The propagated signal is sensed by the inner sections of the electrodes located at the opposite side of the thorax. Pulsatile changes in aortic blood volume in the thorax, which are correlated to the stroke volume, cause changes in amplitude of the propagated electrical signal. Changes in intrathoracic volume also produce changes in electrical capacitative and inductive properties (reactance), which are seen as phase shifts between the applied and sensed signal.12 Traditional bioimpedance measures the change in the amplitude of the propagated signal. Bioreactance measures the change in phase (Fig. 16.24). Because of this, signal-to-noise ratio is improved in the NICOM compared to thoracic bioimpedance-based devices. In practical terms, the NICOM is less affected by the patient’s body shape, movement or the exact location of the electrodes on the thorax. Potential interference from other radiofrequency signals in the clinical environment can also be filtered out without loss of the target signal.
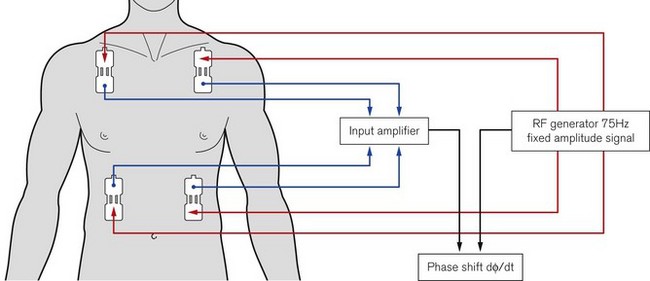
Figure 16.23 Schematic showing the electrode placements and operating principles of the NICOM device.
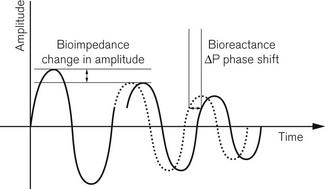
Figure 16.24 Signal analysis for bioimpedance and Bioreactance.
Diagram courtesy of Cheetah Medical Inc.
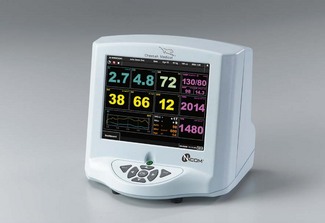
There are built-in connectors for oscillotonometric blood pressure measurement. In addition to CO, which is updated at either 0.5 or 1.0 min intervals, the monitor will also calculate peripheral resistance, cardiac power, stroke volume variation, oxygen delivery and thoracic fluid content (derived from the measured impedance). The parameters to be displayed on the monitor can be customized by the user (Fig. 16.25). These features and non-invasive CO monitoring allow the NICOM to be used in a wider variety of clinical environments than most of the currently available CO devices.13
1 Swan HJ, Ganz W, Forrester J, Marcus H, Diamond G, Chonette D. Catheterization of the heart in man with use of a flow-directed balloon-tipped catheter. NEJM. 1970;283:447–451.
2 Richard C, Warszawski J, Anguel N, Deye N, Combes A, Barnoud D, et al. Early use of the pulmonary artery catheter and outcomes in patients with shock and acute respiratory distress syndrome: a randomized controlled trial. JAMA. 2003;290:2713–2720.
3 Harvey S, Harrison DA, Singer M, Ashcroft J, Jones CM, Elbourne D, et al. Assessment of the clinical effectiveness of pulmonary artery catheters in management of patients in intensive care (PAC-Man): a randomised controlled trial. Lancet. 2005;366:472–477.
4 Binanay C, Califf RM, Hasselblad V, O’Connor CM, Shah MR, Sopko G, et al. Evaluation study of congestive heart failure and pulmonary artery catheterization effectiveness: the ESCAPE trial. JAMA. 2005;294:1625–1633.
5 Wheeler AP, Bernard GR, Thompson BT, Schoenfeld D, et al. The National Heart Lung and Blood Institute Acute Respiratory Distress Syndrome (ARDS) Clinical Trials Network. Pulmonary artery versus central venous catheter to guide treatment of acute lung injury. 2006;354:2213–2224.
6 Kong R. Transoesophageal diagnostic Doppler monitoring. In: Arthurs G, Nicholls B, eds. Ultrasound in anesthetic practice. Cambridge: Cambridge University Press; 2008:58–66.
7 Newman EV, Merrell M, Genecin A, Monge C, Milnor WR, McKeever WP. The dye dilution method for describing the central circulation. An analysis of factors shaping the time-concentration curves. Circulation. 1951;4:735–746.
8 Wolf S, Riess A, Landscheidt JF, Lumenta CB, Friederich P, Schürer L. Global end-diastolic volume acquired by transpulmonary thermodilution depends on age and gender in awake and spontaneously breathing patients. Crit Care. 2009;13:R202.
9 Effros RM, Pornsuriyasak P, Porszasz J, Casaburi R. Indicator dilution measurements of extravascular lung water: basic assumptions and observations. Am J Physiol Lung Cell Mol Physiol. 2008;294:L1023–L1031.
10 Cecconi M, Fawcett J, Grounds RM, Rhodes A. A prospective study to evaluate the accuracy of pulse power analysis to monitor cardiac output in critically ill patients. BMC Anesthesiol. 2008;8:3.
11 Pratt B, Roteliuk L, Hatib F, Frazier J, Wallen RD. Calculating arterial pressure-based cardiac output using a novel measurement and analysis method. Biomed Instrum Technol. 2007;41:403–411.
12 Keren H, Burkhoff D, Squara P. Evaluation of a noninvasive continuous cardiac output monitoring system based on thoracic bioreactance, American Journal of Physiology. Am J Physiol Heart Circ Physiol. 2007;293:H583–H589.
13 Squara P, Denjean D, Estagnasie P, Brusset A, Dib JC, Dubois C. Noninvasive cardiac output monitoring (NICOM): a clinical validation. Intensive Care Med. 2007;33:1191–1194.