Chapter 3 Cardiac Magnetic Resonance Imaging
INTRODUCTION
Cardiac magnetic resonance imaging (CMRI) provides reproducible morphologic and functional information for the evaluation and management of patients with cardiovascular disease. CMRI has improved substantially over the past decade, and it is now entering the mainstream of diagnostic cardiac imaging. CMRI is already considered the procedure of choice for quantification of ventricular volume and mass, as well as in the evaluation of myocardial viability, pericardial disease, and intracardiac and pericardiac masses, for imaging the right ventricle and pulmonary vessels, and for assessing many forms of congenital heart disease, especially after corrective surgery.
MAGNETIC RESONANCE IMAGING TECHNIQUES
Spin Echo Magnetic Resonance Imaging
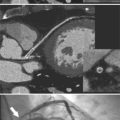
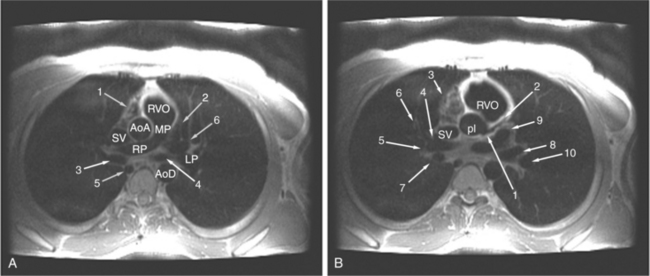
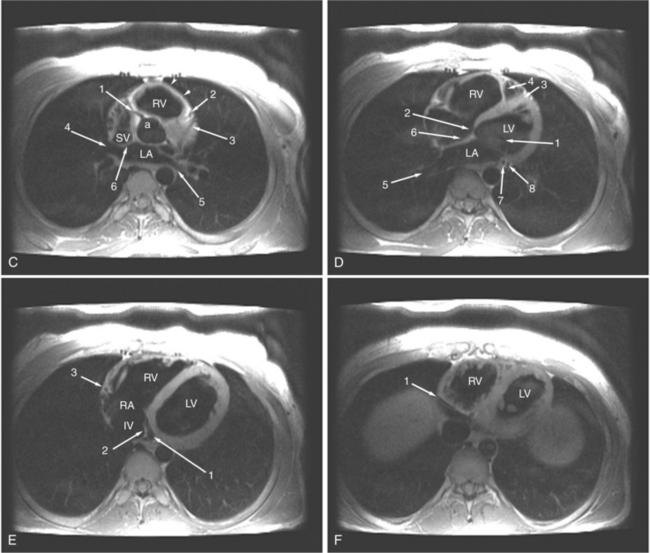
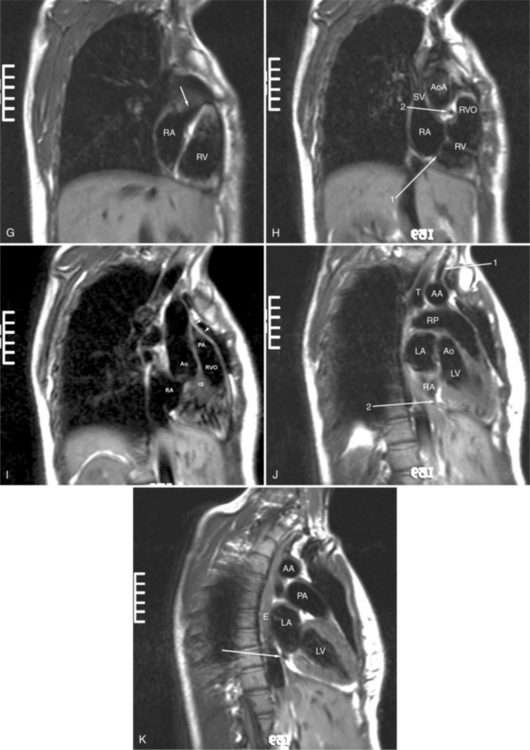
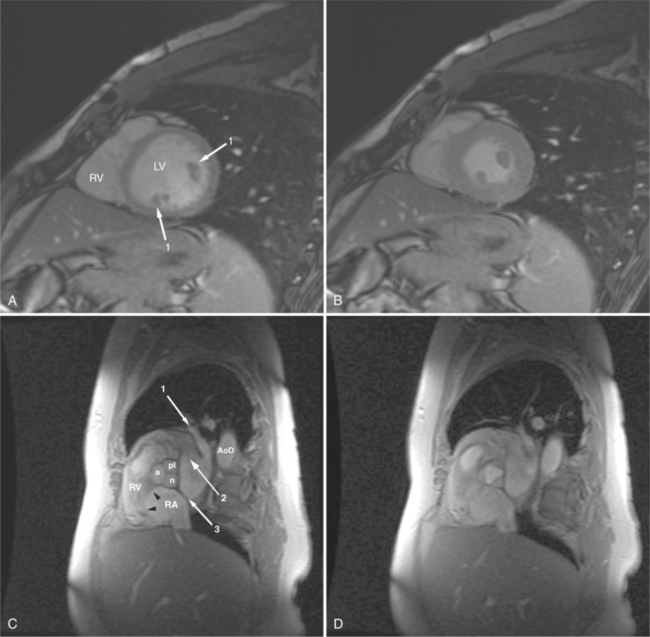
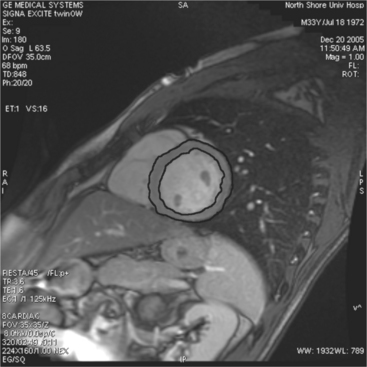
ECG gated spin echo (SE) MRI provides imaging with the highest contrast resolution, resulting in high anatomic detail (Fig. 3-1). Furthermore, characterization of wall thickness and content of the arterial wall provides tissue-specific findings encouraging early diagnosis. Adaptation of k-space segmentation to the acquisition of image data allows rapid image acquisition within single breath holds. These techniques (namely, turbo SE and double inversion recovery) are actually modified gradient echo pulse sequences and provide the same high contrast imagery of conventional SE in dramatically less imaging time.
Multi-Echo Spin Echo Imaging
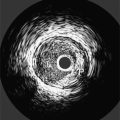
In an SE acquisition, a rephasing pulse is applied at a time interval after the spins have dispersed, resulting in an SE. If these spins are allowed to diphase again, their signal decreases, and if a second rephrasing pulse is applied, a second SE is obtained, of signal exponentially less than the first. If this process is continued, using a chain of rephrasing pulses, a series of sequentially exponentially decreased signal SEs are obtained. The loss of signal over time is directly related to the transverse relaxation time (T2) of a particular tissue. Thus, imagery obtained with each successive SE will display a map of signal intensities reflecting the T2s of the tissues in the imaging field (Fig. 3-2). The more or less rapid loss of signal in a particular region or tissue can then be used to characterize that tissue (i.e., tissues that lose signal rapidly over the chain of echoes have shorter T2 than those that lose signal less rapidly). This technique may be useful for differentiating cystic from solid masses or for enhancing the appearance of interstitial tissue involvement in a disease process.
Gradient Echo Magnetic Resonance Imaging
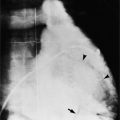
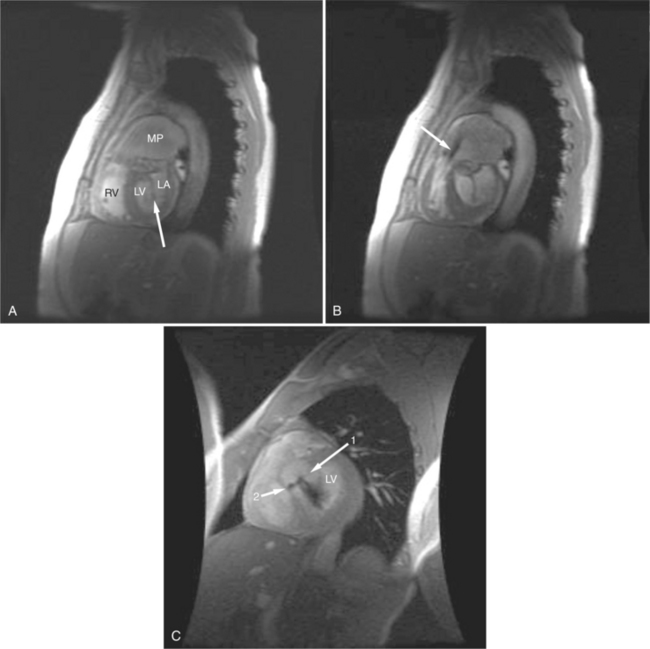
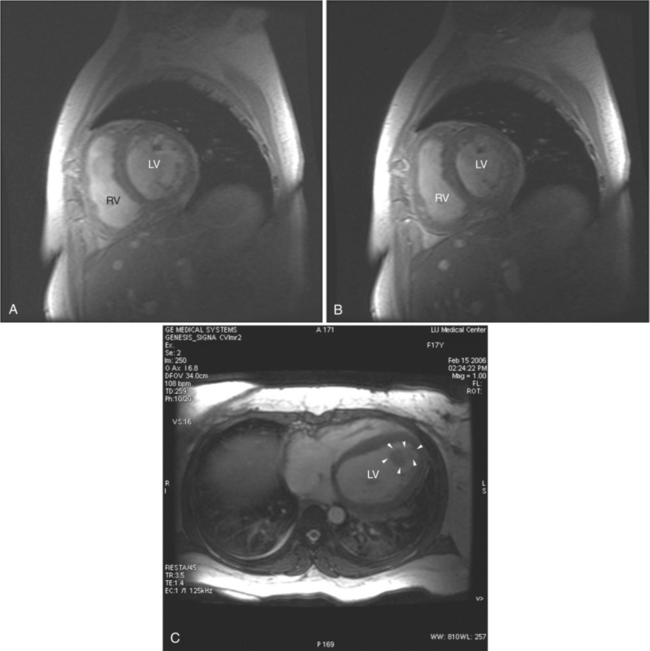
Gradient echo (GE) cine imaging allows a short acquisition time. The bright signal of the blood pool in these images results from flow-related enhancement obtained by applying intermittent rapid radiofrequency pulses to saturate a volume of tissue. The images may be reconstructed in the different phases of the cardiac cycle and can be displayed in cine format (Fig. 3-3). Consistent imaging artifacts caused by flow accelerating across a luminal stenosis or turbulence within a dilated chamber may be used to identify these conditions and to assess their significance (Fig. 3-4). Cine loop display demonstrates dynamic changes in the morphology of the heart, providing a means for evaluating regional wall motion, ventricular function, and valvular dysfunction. GE images may be analyzed quantitatively, providing accurate indices of ventricular function and valvular dysfunction.
Phase Contrast (Blood Flow) Mapping
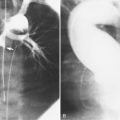
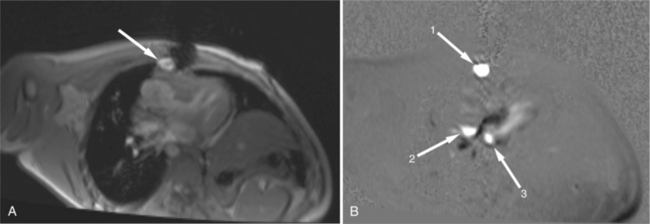
When a pulse sequence is applied to a patient in an MRI scanner, two sets of data are obtained. The “real” (amplitude) data contains the map of protons within the slice, that is, the “stuff” of a cross-sectional image. The other set of data obtained is the “imaginary” (phase) data. This latter data provides a map of the net velocity of the protons within the slice. The intensity of a pixel in an imaginary image reflects the velocity and phase of the protons within that pixel. Following the intensity of a region of pixels in a series of images provides us with time-intensity curves reflecting the flow of blood through a portion of the heart in a manner analogous to the peak velocity measured by continuous wave Doppler echocardiography. This technique uses modified GE sequences with image reconstruction from the phase rather than the amplitude of the MR signal. On phase images, the gray value of a pixel depends on velocity and direction with respect to the imaging plane (Fig. 3-5). Thus, the flow mapping technique allows determination of the peak velocity of blood flow within a stenosed blood vessel or total flow through a vessel over time. Flow velocity, flow volume, and mean blood flow may be quantitated within areas of interest.
Myocardial Tagging
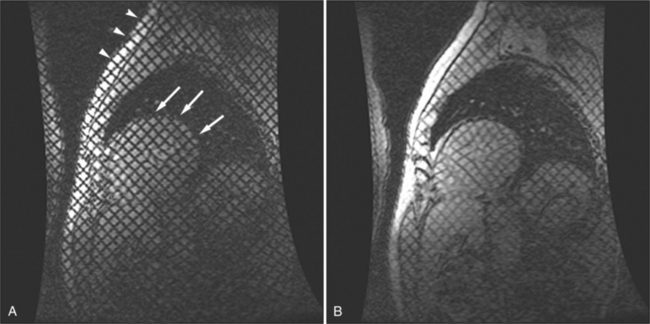
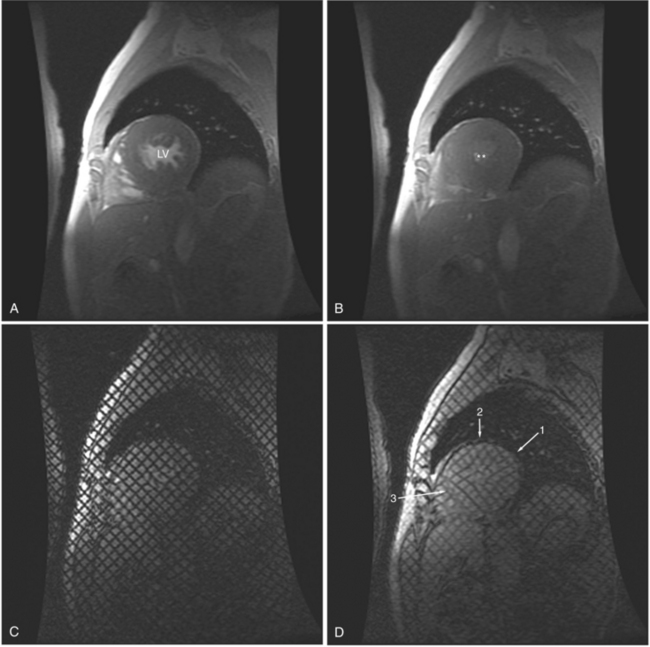
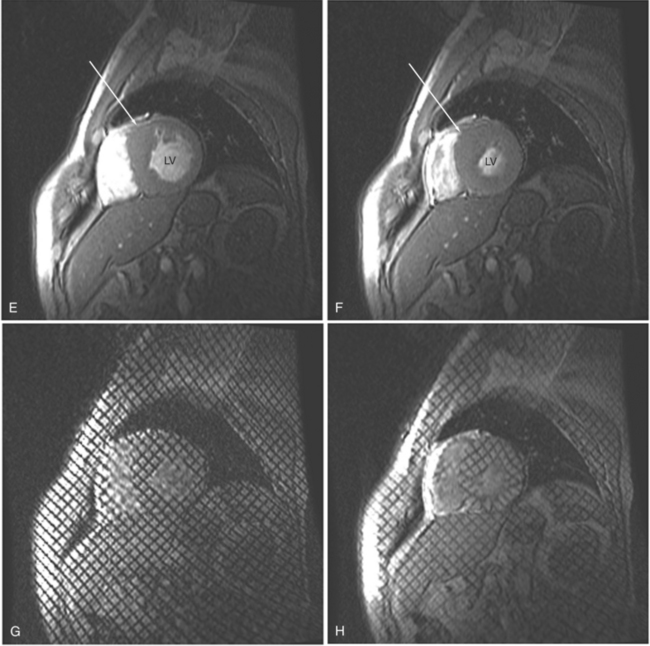
By applying saturation planes perpendicular to the imaging plane at the electrocardiographic trigger signal before image acquisition, tagging sequences create noninvasive markers within the heart wall. During image acquisition, reduced signal is obtained from the presaturated tissue, resulting in images formed with orthogonal or radial black lines on the images (depending on the method of tagging). Because the tag lines are a property of the tissue (i.e., the slice of the heart), the lines move with the myocardium through the cardiac cycle. When created at end diastole, the lines deform as the myocardium contracts and then become undeformed as the myocardium relaxes. Tracking the motion of the tag lines through the cardiac cycle allows visual evaluation of intramural myocardial deformation (Fig. 3-6). In this way intramyocardial motion can be evaluated. Application of sharp, closely spaced tag lines allows qualitative or quantitative analysis of myocardial deformation from which strain analysis, that is, change in the shape of the myocardium, can be performed.
Perfusion and Delayed Hyperenhancement Imaging
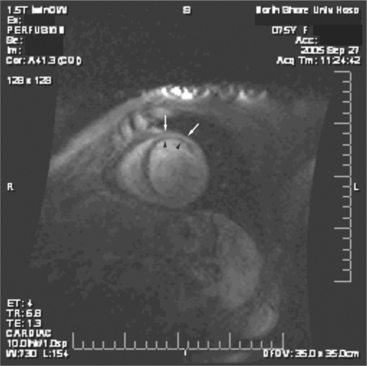
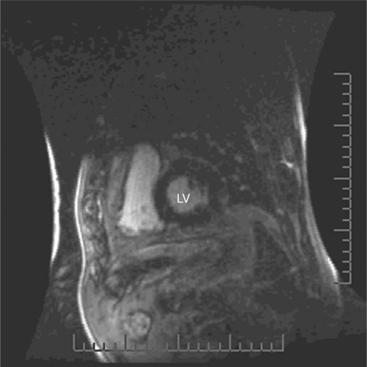
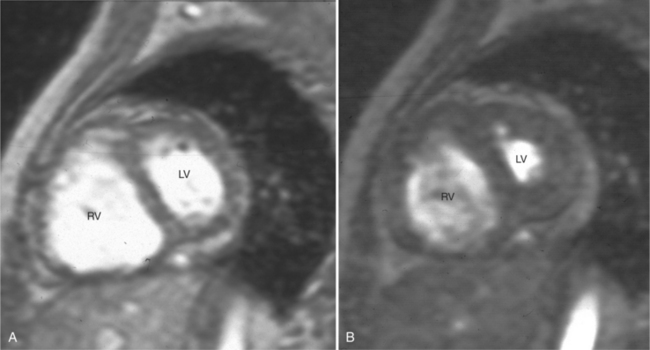
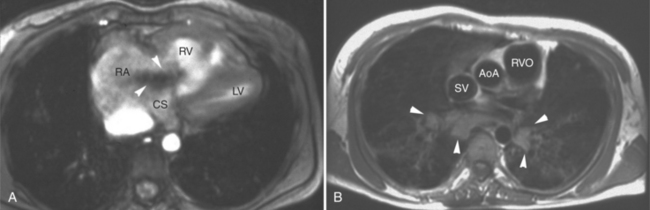
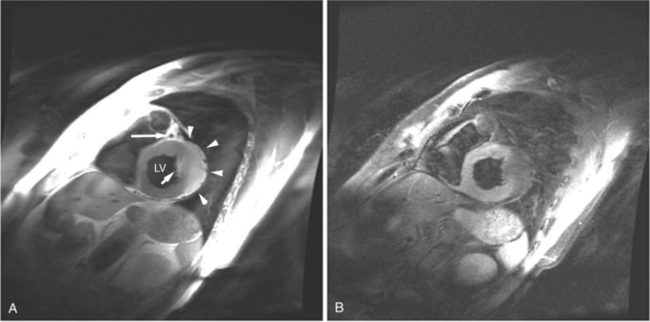
Rapid imaging over the heart after bolus intravenous contrast administration will produce a series of images displaying the passage of the contrast through the cardiac circulation. Contrast enhancement of the blood pool within the right atrium and ventricle is followed, after passage through the lungs, to the cavities of the left atrium and left ventricle, and then via the coronary circulation into the interstitial space of the ventricular myocardium (Fig. 3-7). Areas of decreased myocardial blood flow appear as relative signal voids within a segmental distribution corresponding to the upstream arterial narrowing. Thus, regional distribution of blood flow and the assessment of myocardial perfusion can be performed in much the same manner as in a nuclear perfusion examination. The sensitivity of detecting myocardial ischemia is improved by imaging after administration of a pharmacologic vasodilator. A hemodynamically significant coronary arterial stenosis is present if coronary blood flow cannot be increased by vasodilator stimulus. When hybrid echo planar pulse sequences and pharmacologic vasodilatation are used, 87% to 90% sensitivity and 85% specificity for detecting significant coronary stenosis can be obtained. Gadolinium-chelate contrast material remains in the extracellular space when administered by intravenous route. If the normal signal of ventricular myocardium is nulled by administration of a presaturation pulse, delayed imaging 10 minutes after intravenous contrast administration visualizes the heart after the contrast has cleared the cardiac cavities and the myocardium, revealing a relative signal void in normal myocardium (Fig. 3-8). Delayed washout kinetics and an increased volume of gadolinium distribution in the interstitial space of abnormal myocardium result in delayed myocardial enhancement. This technique has been found useful in characterizing myocardial infarction and fibrosis in other cardiac disorders.
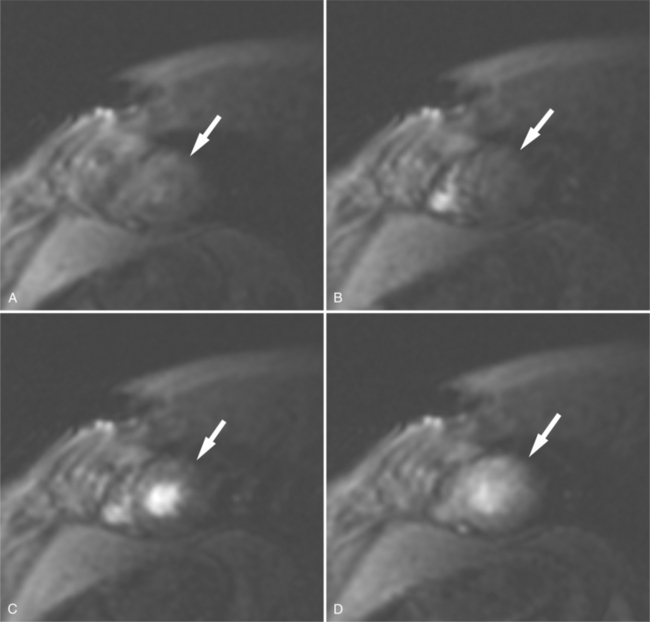
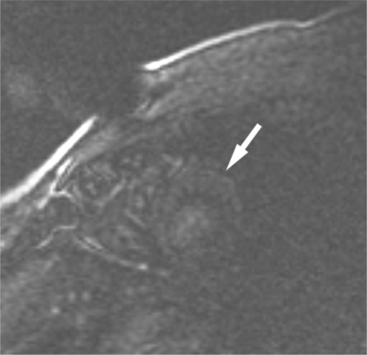
FIGURE 3-8 Short-axis image of the heart obtained 10 minutes after intravenous administration of Gd-DTPA (see Figure 3-7A) and immediately after a presaturation pulse. The viable left ventricular myocardium (arrow) is barely visible.
In this chapter, we will review the use of ECG-gated MRI techniques for the diagnosis and evaluation of patients with acquired heart disease. This chapter details the process of planning, performing, and interpreting a CMRI examination. We focus our comments on discussing pathophysiologic mechanisms and recognizing their effect on cardiac morphology and function as displayed in MR images.
PERICARDIAL DISEASES
Normal Pericardium
The visceral pericardium is normally thin and not visualized separately by any imaging modality. The combination of the visceral pericardium and the small volume of physiologic pericardial fluid constitutes the normal pericardium routinely visualized on MRI as a 1- to 2-mm-thick layer, which can appear focally thicker at the sites of its major attachments. On SE MR the normal pericardium appears as a pencil-thin line of low signal intensity between the epicardial and pericardial fat (Fig. 3-9). The low signal is attributed to the fibrous nature of the parietal pericardium, the low protein content of pericardial fluid, and the nonlaminar flow patterns caused by cardiac pulsation.
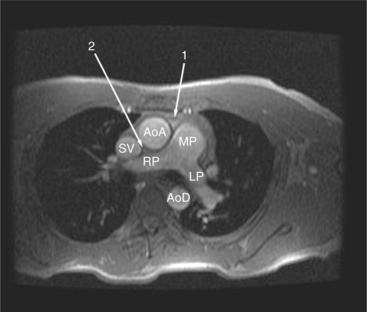
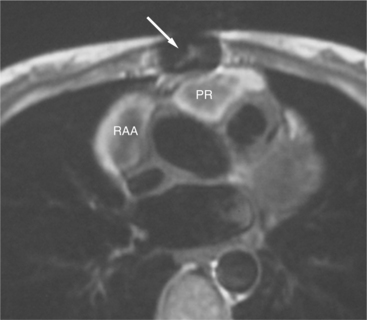
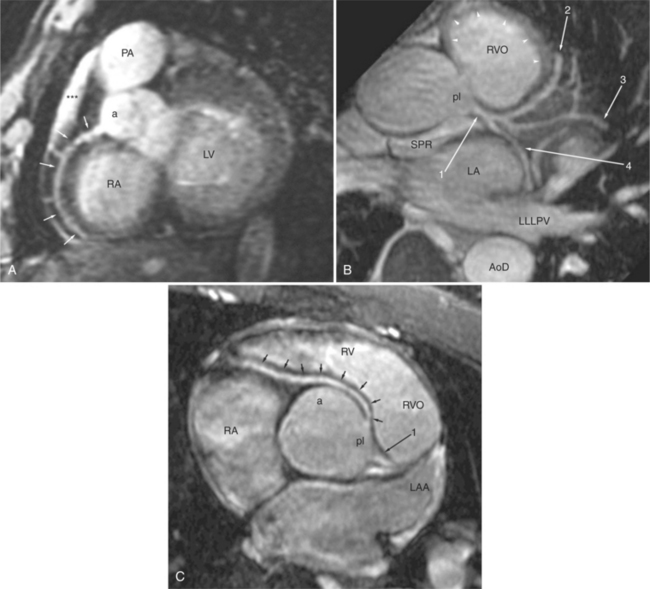
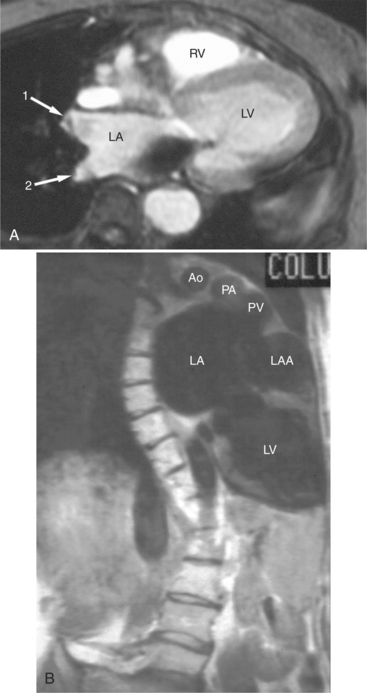
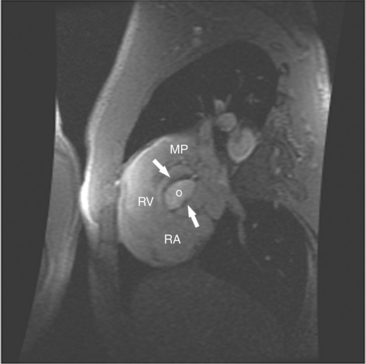
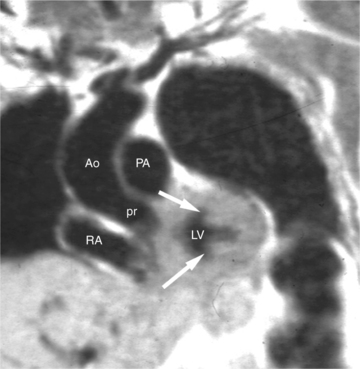
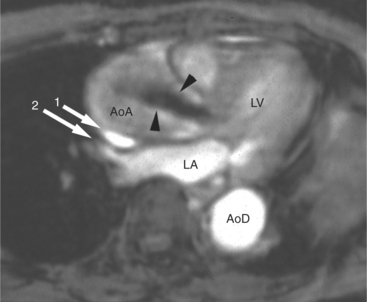
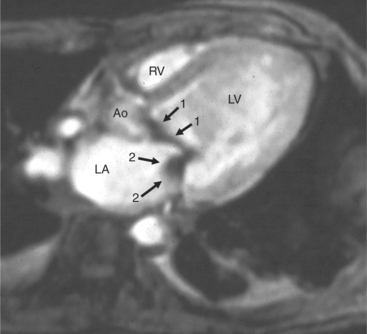
The reflection of pericardium around the great arteries and veins forms the two pericardial “appendages.” Anterior to the aorta this contiguous pericardial space is called the “preaortic recess,” whereas posteriorly it is called the “retroaortic” or superior pericardial recess (Fig. 3-10). Posterior and lateral to the heart, the extraparenchymal pulmonary veins and the superior and inferior venae cavae are enveloped by the pericardium. The intrapericardial space between the pulmonary veins is called the oblique sinus. It is essential to appreciate the anatomic extent and location of these pericardial sinuses since they are normally seen on MR.
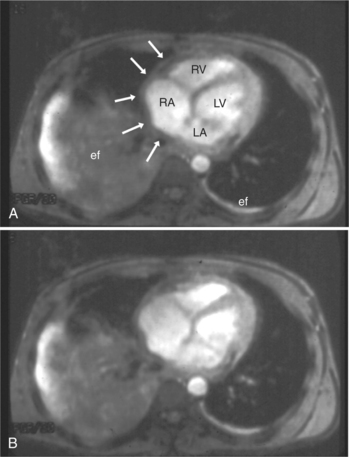
Pericarditis and Pericardial Effusions
Normal pericardium most commonly responds to insult by cellular proliferation or the production of fluid. Pericarditis results in pericardial thickening. The abnormal pericardium is characterized by intermediate signal intensity on both SE and GE examination (Fig. 3-11). The most common manifestation of acute pericarditis is an effusion. The character of the fluid varies with the underlying cause of the effusion. Transudative pericardial effusion may develop after cardiac surgery or in congestive heart failure, uremia, postpericardiectomy syndrome, myxedema, and collagen-vascular diseases (Fig. 3-12). Hemopericardium may be found after trauma, aortic dissection, aortic rupture, or in cases of pericardial neoplasm (especially primary pericardial mesothelioma). The typical appearance of common pericardial effusion in increased distance between the epicardial and pericardial fat, characterized by low-to-absent signal on SE and bright signal on GE images. Thus, pericarditis (with or without associated effusion) and pericardial effusion are differentiated by the signal of the pericardium and its contents.
On SE examination, hemorrhagic pericardial effusion presents as areas of mixed low, intermediate, and high signal, depending on the age of the blood. Nonhemorrhagic effusions on SE MR have predominantly low signal intensity as a result of spin phase change of the pericardial fluid. GE MR sequences display freely mobile pericardial fluid as high signal intensity. The high protein content of inflammatory pericardial fluid seen in uremia, tuberculosis, or trauma may have intermediate signal intensity components on SE MR, especially in dependent areas (Fig. 3-13). Furthermore, because adhesions are common in pericardial inflammation, inflammatory effusions may not have the normal free flow patterns of pericardial fluid leading to loci of increased signal intensity on SE sequences similar in appearance to loculated pericardial effusions. Pericardial inflammation, as seen in uremic or tuberculous pericarditis or trauma following resuscitation, appears as increased signal intensity as compared with myocardium on SE MR acquisition (Fig. 3-14).

Congenital Absence of the Pericardium
Absence of the pericardium is thought to be a result of compromise of the vascular supply to the pleuropericardial membrane that surrounds the ventral cardiac tube during embryologic development. Pericardial defects may vary in size from small communications between the pleural and pericardial cavities to complete (bilateral) absence of the pericardium. The most common form is complete absence of the left pericardium, with preservation of the pericardium on the right side (Fig. 3-15).
Pericardial Cysts and Diverticula
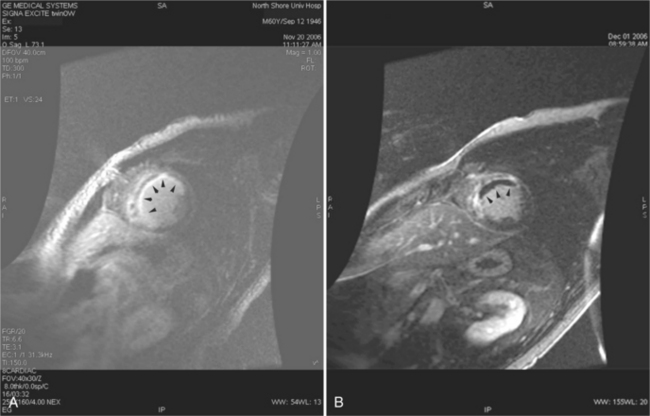
If a portion of the pericardium pinches off completely from the pleuropericardial membrane during embryologic development, a pericardial cyst forms, containing the same mesothelial lining as the normal pericardium (Fig. 3-16). Similarly, a pericardial diverticulum is a cyst that fails to completely separate, leaving persistent communication with the pericardial space. SE MR acquisition depicts these findings as fluid-filled paracardiac masses. If multi-echo acquisition is obtained, then the cyst appears to increase in signal (with respect to the surrounding organs) on longer echo time (TE) images (see Figure 3-2).
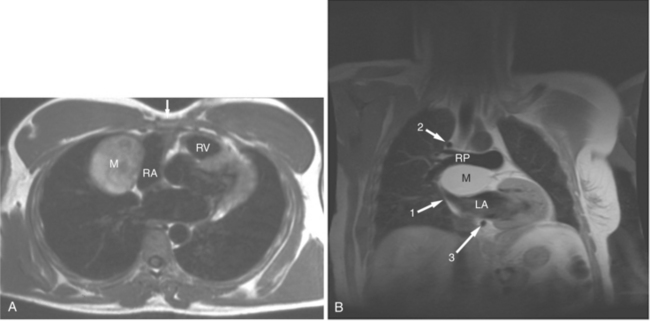
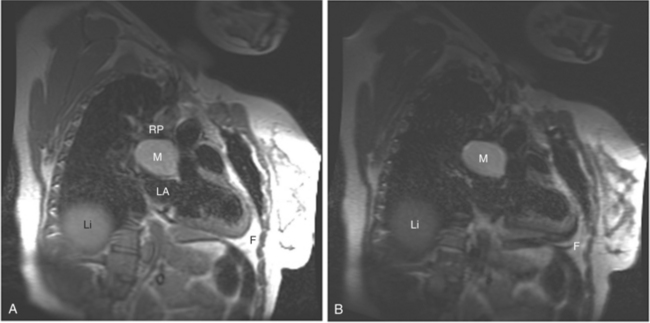
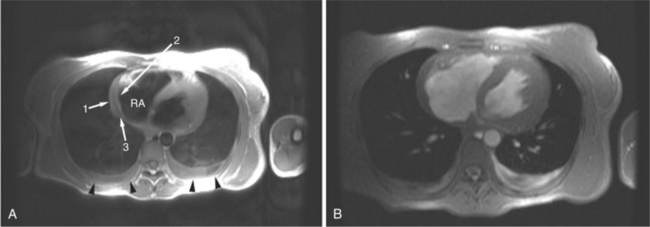
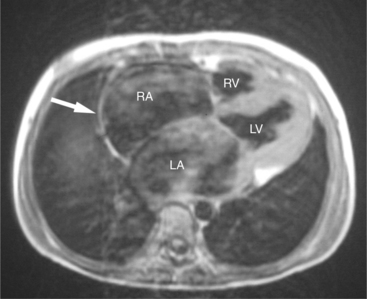
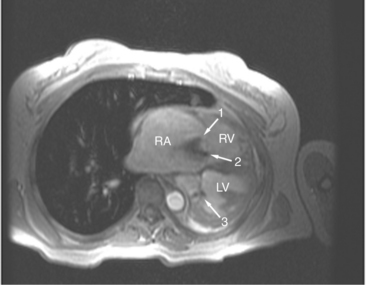
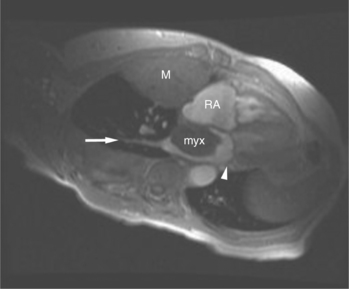
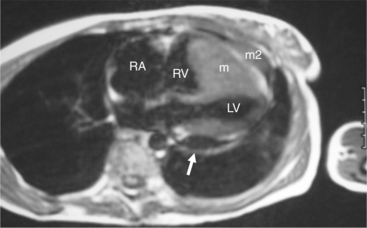
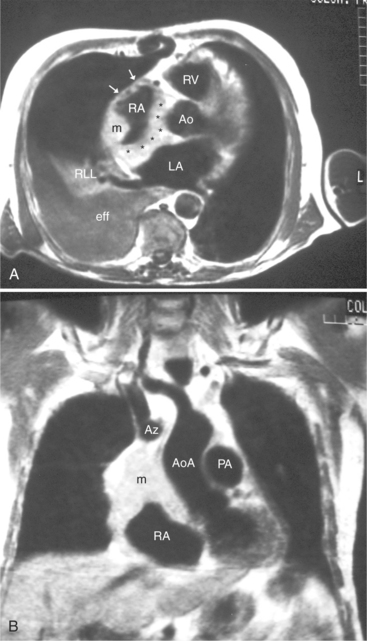
FIGURE 3-16 Two patients with pericardial cysts. A, Axial double inversion acquisition from an asymptomatic 26-year-old man with an unusual chest film. A large, circumscribed, nearly homogeneous high signal intensity mass (M) extrinsically compresses the right atrium (RA) and displaces the heart toward the left. Notice how the right ventricular (RV) free wall lies to the left of the sternum (arrow). B, Coronal spin echo acquisition from a 40-year-old woman with an unusual chest film (same patient as in Figure 3-2). A circumscribed, homogeneous, high signal intensity mass (M) elevates the right pulmonary artery (RP) and compresses the left atrium (LA) and right upper lobe pulmonary vein (arrow 1). This is an intrapericardial pericardial cyst. The azygos vein (arrow 2) and coronary sinus (arrow 3) are viewed in cross section.
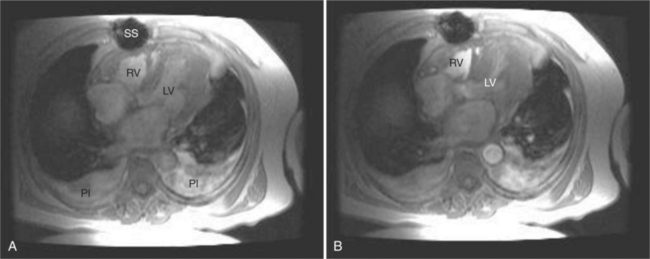
Pericardial Tamponade
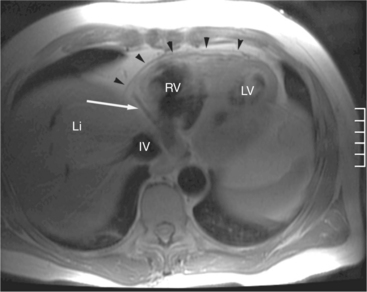
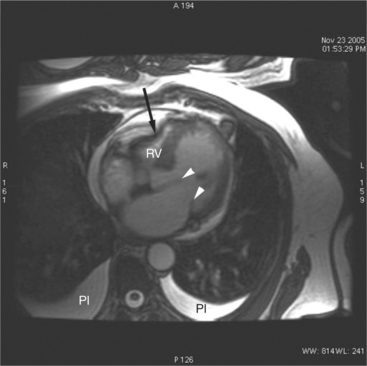
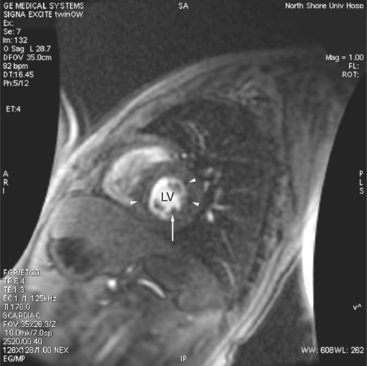
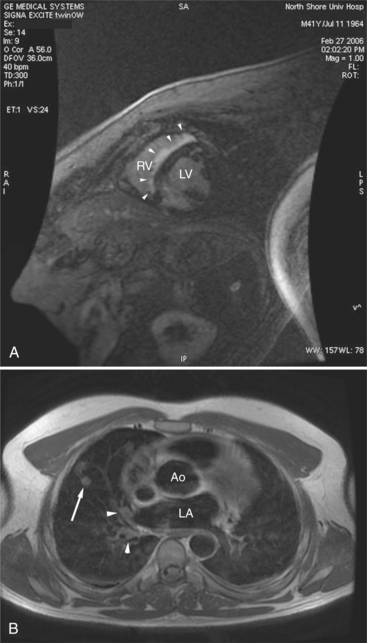
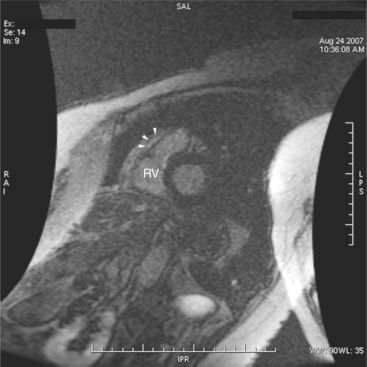
The rapid accumulation of as little as 100 to 200 ml of fluid can impede diastolic ventricular filling and lead to pericardial tamponade. Pericardial tamponade occurs when reduced stroke volume limits maintenance of cardiac output. Although MRI is not the initial diagnostic modality for evaluating tamponade, it is frequently instrumental in suggesting the cause of the effusion (i.e., hemorrhage, neoplastic involvement, inflammation resulting from tuberculosis or other infectious processes) in this acutely emergent situation. Double inversion recovery demonstrates pericardial thickening and a “tubular” right ventricle (Fig. 3-17). Cine MRI may be useful to demonstrate diastolic atrial or ventricular collapse (Fig. 3-18). In many cases, the motion of the interventricular septum is paradoxical. Earlier right ventricular filling results in diastolic bowing of the septum toward the left ventricle.
Pericardial Constriction
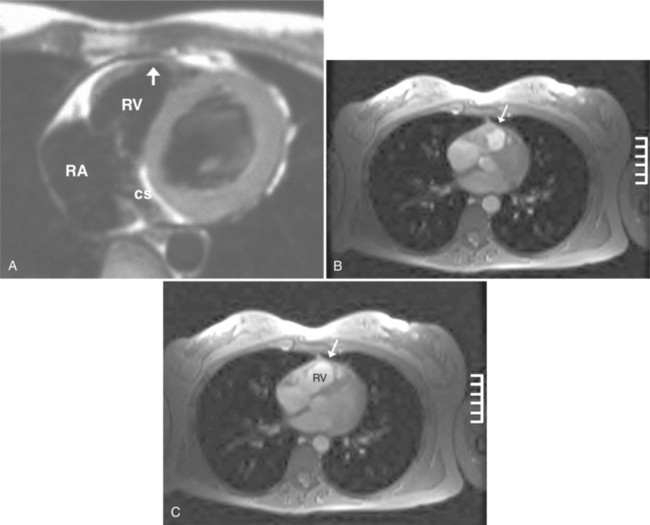
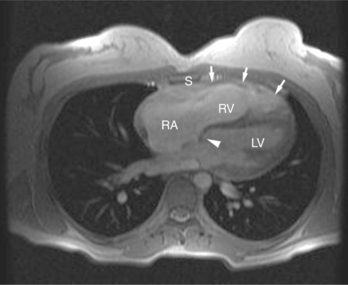
The hallmark of pericardial constriction is pericardial thickening (with or without pericardial calcification) and abnormal diastolic ventricular function. In the majority of cases, constrictive pericarditis involves the entire pericardium, compromising filling of both the right and left heart. Occasionally, however, local chronic pericardial thickening has been reported. Focal pericardial thickening is more commonly seen in the postoperative patient and is frequently located anterior to the right ventricle (Fig. 3-19). The clinical findings of constrictive pericarditis overlap with those of restrictive cardiomyopathy, a primary disorder of the myocardium. Differentiation between these two entities is imperative because patients with pericardial constriction may benefit from pericardiectomy; myocardial restriction may be rapidly progressive and necessitate cardiac transplantation. In pericardial constriction, the right ventricle may appear tubular in appearance. Gradient echo acquisition demonstrates decreased right ventricular contractile function and limited diastolic excursion, common to both restriction and constriction (Fig. 3-20). Dilatation of the right atrium, venae cavae, coronary sinus, and hepatic veins, reflecting right heart failure may be found in cases of constrictive pericarditis and in cases of restrictive cardiomyopathy. Abnormal right heart filling in constriction is visualized as early diastolic right atrial or right ventricular collapse and the septal “bounce,” which is early reversal of septal curvature.
Symptomatic pericardial constriction may be found in the absence of conventional radiographically detectable pericardial thickening, however. Pericardial thickening is not diagnostic of pericardial constriction; demonstration of pericardial thickening greater than 4 mm in face of characteristic hemodynamic findings distinguishes constrictive pericarditis from restrictive cardiomyopathy.
Myocardial Ischemia and Infarction
Cardiac MR has become the clinical gold standard for quantitation of cardiac chamber volume and myocardial mass. The accurate and reproducible quantitative data obtained from MR examination makes GE MRI appealing as an imaging modality for long-term follow-up of patients with ischemic heart disease. MRI is valuable for assessment of regional and global contractile function; clinically, this is usually achieved by visual inspection of cines in standard imaging planes. Quantification of wall motion and thickening using conventional techniques is possible for both the left ventricle and the right ventricle. Regions of myocardial ischemia or infarction appear as areas of thinned ventricular myocardium and segments of decreased or absent contraction (Fig. 3-21).
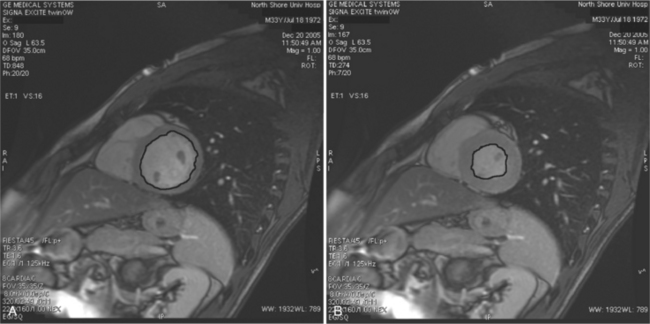
Quantitation of ventricular function is based on GE acquisition and planimetry of the endocardial and epicardial contours of images obtained at intervals in the cardiac cycle (Fig. 3-22). The volume of the left ventricular chamber within each slice is the planimetered endocardial area multiplied by the slice thickness (Fig. 3-23). The left ventricular end-diastolic volume is calculated as the sum of the volumes of the slices of the heart through the left ventricle obtained at end diastole. Similarly, the left ventricular end-systolic volume is the sum of the slice volumes obtained at end systole. Ventricular stroke volume is the difference between end-diastolic volume and end-systolic volume. Ejection fraction is the stroke volume indexed to (divided by) the end-diastolic volume. Cardiac output is the stroke volume multiplied by the heart rate.
Left ventricular mass is calculated in an analogous manner (Fig. 3-24). The area of the left ventricular myocardium in a slice is the difference between the area of the epicardial contour and the endocardial contour. The slice myocardial volume is this area multiplied by the slice thickness, and the total left ventricular myocardial volume is the sum of these volumes over the entire myocardium. Myocardial mass is obtained by multiplying the calculated myocardial mass by the specific gravity of myocardium (1.05 g/ml).
Myocardial perfusion MRI has the potential for significant impact because of the combination of greatly enhanced resolution with no ionizing radiation. A fast intravenous bolus of gadolinium contrast agent is given using a power injector, and the myocardial signal changes during the first pass are measured. Each slice is usually imaged with each cardiac cycle to maximize the quality of the analysis. Low signal areas representing reduced perfusion can be visualized directly or computer quantification of parameters, such as the signal upslope, can be used to generate parametric relative perfusion maps or measures of perfusion index at rest and stress. Using fast MR acquisition techniques defects in the subendocardium can be differentiated from transmural myocardial defects (Fig. 3-25).
Infarcted myocardium can be detected using delayed hyper-enhancement imaging. Gadolinium-DTPA (Gd-DTPA) is an extracellular agent. Bolus intravenous injection results in a pattern of time-related chamber and myocardial signal enhancement. All the contrast material washes out from the interstitium of normal ventricular myocardium, so that imaging of the heart 10 minutes later will demonstrate normal myocardial signal. When myocytes die after an acute myocardial infarction, their cell membranes break down, exposing the intracellular space to the extracellular milieu, thus increasing the extracellular space; Gd-DTPA is retained in these regions. Inversion recovery imaging performed 10 minutes after contrast injection allows the normal myocardium to clear of Gd-DTPA. Suppression of the normal myocardial signal by application of an inversion pulse before gradient inversion reveals areas of nonviable (infarcted) myocardium as areas of high signal against low (nulled, normal) myocardial signal. This technique allows differentiation between infarcted myocardium and viable myocardium (Fig. 3-26). The likely benefit of coronary bypass surgery can be assessed by application of both conventional and delayed hyperenhancement MR techniques. Using the premise that preserved myocardial thickness (>5 mm) indicates preserved viability, one approach is to measure myocardial wall thickness in areas of chronic myocardial infarction. In regions of apparently akinetic myocardium, low-dose dobutamine “stress” MR will elicit regional thickening, indicating tissue viability. The high spatial resolution inherent in CMRI allows visualizing the transmural distribution of infarcted myocardium. This technique can demonstrate small infarctions that are not apparent using gated perfusion SPECT, and microinfarcts can be shown after percutaneous coronary intervention. Delayed gadolinium hyperenhancement does not depend on demonstration of regional wall thickening after acute myocardial infarction. There is high concordance of delayed hyperenhancement MRI with PET, and superior results have been shown in comparison with thallium-201 SPECT. Studies comparing the ability of MR myocardial perfusion techniques to detect hypoperfused myocardial regions with 201TI and 99mTc radionuclide imaging and coronary angiography showed sensitivity rates ranging between 64% and 92% and specificity rates between 75% and 100%. The combination of MR perfusion and cine MRI improved the sensitivity from 72% (using only MR perfusion) to 100%, whereas the specificity decreased slightly (98% to 93%).
ASSESSMENT OF THE CORONARY ARTERIES
Magnetic Resonance Coronary Arteriography
MRI is exquisitely sensitive to cardiac motion and turbulent blood flow artifacts within the coronary arterial lumen and adjacent cardiac chambers. Furthermore, the acquisition time necessary for adequate resolution of luminal stenosis is long with respect to the cardiac cycle, necessitating prolonged breath holding, or application of navigator pulses to correct for diaphragmatic motion. Despite such techniques, MR coronary artery imagery is dramatically degraded by irregular breathing patterns. Application of three-dimensional respiratory-gated magnetic resonance coronary arteriography permits diagnosis of left main coronary artery stenosis and the exclusion of three-vessel coronary artery disease.
The overall vessel diagnostic accuracy of CMRI for detection of arterial stenosis is 73% sensitive and 86% specific (Fig. 3-27). The diagnosis of left main stenosis is 69% and 91%, respectively. Left anterior descending artery stenosis is 79% and 81%, respectively. Left circumflex stenosis is 61% and 85%, respectively. Right coronary artery stenosis was 71% and 84%, respectively. Overall patient-based accuracy is 88% and 56%, respectively. The application of newer whole-heart free-breathing acquisition can be summarized as follows. Overall accuracy for the diagnosis of abnormal coronary segments is 78% sensitive and 96% specific. On a vessel-by-vessel basis, detection of left main coronary stenosis was 98% specific. Left anterior descending artery accuracy was 77% sensitive and 95% specific. Accuracy for detection of left circumflex artery stenosis was 70% and 93%, respectively, and that for detection of right coronary stenosis was 85% and 95%, respectively.
NONISCHEMIC LEFT VENTRICULAR DISEASE
Cardiomyopathy
By direct visualization of the ventricular myocardium, MR can be used to describe the distribution of abnormal muscle, an important criterion for characterizing the nature of a cardiomyopathy. Cine acquisition displays the epicardial and endocardial borders of the ventricular myocardium, providing temporally resolved imagery from which myocardial mass and ventricular chamber volumes and stroke volume can be computed. In this way, regional and global myocardial dysfunction can be differentiated, and the severity of dysfunction evaluated after medical or surgical therapeutic intervention. Advanced tagging and phase contrast acquisition techniques provide a means of investigating regional functional disturbance and myocardial blood flow. Perfusion and delayed hyperenhancement imaging provide important tools for the evaluation of these patients. Demonstration of segmental abnormality is helpful in characterizing the nature of a myopathic ventricle. Furthermore, characterization of a segmental abnormality may be helpful in establishing the etiology of the myopathy.
Dilated Cardiomyopathy
Dilated cardiomyopathy (DCM) is characterized by ventricular dilatation, decreased contractility, and alterations in ventricular diastolic function (Fig. 3-28). Cine MR reliably quantitates ventricular volume and mass, ejection fraction, and wall stress in patients with DCM; it may be used to monitor the functional status of the ventricle over time. Myocardial tagging techniques may be used to quantitate regional changes in myocardial function, reflecting both regional stress-strain relationships and the fibrous anatomy of the heart. Depressed strain values correlate with depressed chamber function, and both of these parameters are markedly decreased in patients with DCM. These findings suggest that myocardial tagging may also be a useful tool for testing therapeutic regimens in these patients.
A key clinical question in the diagnosis of DCM is its differentiation from heart failure resulting from ischemic coronary artery disease. Although coronary angiography is typically used to make this determination, delayed gadolium hyperenhancement has been shown to be useful in this evaluation. In patients with DCM and normal coronary angiography, 59% show no gadolinium enhancement, whereas 28% show patchy midwall ventricular enhancement, clearly different than the distribution in patients with coronary artery disease of whom 13% had gadolinium enhancement (Fig. 3-29). Furthermore, midwall fibrosis as demonstrated by delayed hyperenhancement was a predictor of all-cause mortality and sudden cardiac death in these patients.
Hypertrophic Cardiomyopathy
The dramatically thickened ventricular myocardium in hypertrophic cardiomyopathy (HCM) has a distinctive appearance on MRI. Regional hypertrophy found on MRI correlates with electrocardiographic Q wave abnormalities; T-wave configuration is reflected in the distribution of hypertrophy between the basal and apical segments. MRI allows accurate direct characterization of the distribution of hypertrophic myocardium. Distribution can be described as symmetric, asymmetric, or only involving the cardiac apex (Fig. 3-30). In a longitudinal study, MRI was used to demonstrate that the characteristic angiographic spadelike configuration of the left ventricular chamber may begin with a nonspade configuration.
After intravenous administration of Gd-DTPA, normal ventricular myocardium gradually increases in signal to a maximum value and then rapidly loses signal as contrast passes out of the interstitium. In patients with HCM, nonhomogenous patterns of myocardial enhancement may be observed (Fig. 3-31). Increased myocardial enhancement is associated with increased risk of sudden death and heart failure. Delayed myocardial enhancement is often related to fibrosis in regions of myocyte disarray, expanded interstitial spaces, and replacement fibrosis resulting from ischemia, and is frequently seen in patients with HCM. The most common pattern of delayed hyperenhancement is patchy and mid-wall in location.
Restrictive Cardiomyopathy
Sarcoidosis is a multisystem disease of unknown origin that involves the heart more commonly than it produces cardiac symptoms. Symptomatic disease (arrhythmia and heart failure) is found in only about 5% of patients with sarcoidosis, although noncaseating granulomatous myocardial infiltration is found in 20% to 50% of patients at autopsy. In patients with cardiomyopathy as a result of cardiac sarcoidosis, regional wall thinning and dysfunction and loci of high myocardial signal intensity may be found on delayed hyperenhancement images after administration of intravenous gadolinium (Fig. 3-32). Typically, abnormalities found on cardiac MRI do not correspond to the distribution of the coronary circulation and can thus be differentiated from areas of myocardial infarction. Certainly, the association of cardiac changes with mediastinal adenopathy or pulmonary parenchymal changes argue strongly for cardiac involvement by the disease.
The clinical presentation and hemodynamic findings of restrictive cardiomyopathy may be difficult to differentiate from patients with constrictive pericarditis. MRI is useful in this setting because it allows the characterization of the ventricular functional abnormality and direct demonstration of the pericardium and ventricular myocardium. If the pericardium is not greater than 4 mm in thickness, then pericardial constriction is excluded, and the diagnosis of myocardial restriction is made (Fig. 3-33).
Arrhythmogenic Right Ventricular Cardiomyopathy
Most individuals have localized or patchy areas of segmental right ventricular thinning and akinesia or dyskinesia and are minimally symptomatic (Fig. 3-34). Differentiation between right ventricular dysplasia and pathological fatty infiltration can be made on clinical and histologic grounds. Fatty infiltration usually does not cause clinical symptoms, whereas right ventricular dysplasia does. In addition, in right ventricular dysplasia, abnormal foci of fat extend from the epicardial surface through the interstitium displacing myocardial fibers.
Regions of delayed-enhancement in the right ventricle had excellent correlation with histopathologic changes in patients with ARVC (Fig. 3-35). These MRI findings predicted inducible ventricular tachycardia on programmed electrical stimulation, suggesting a possible role in the evaluation and diagnosis of patients with suspected ARVC. Increased signal in the right ventricle of patients diagnosed with ARVC on delayed-enhancement scans correlates with fibro-fatty changes found on biopsy. Electrophysiologic testing more likely reveals inducible sustained ventricular tachycardia in patients with ARVC with delayed enhancement than in patients with ARVC without delayed enhancement.
Myocarditis
Segmental delayed hyperenhanced lesions, taking a noncoronary distribution, reflect the myocardial inflammation. Clinical progression may be associated with global myocardial enhancement, depicting evolution of myocarditis into a diffuse process. Hyperenhanced lesions normalize in signal with healing. Contrast enhancement 4 weeks after the onset of symptoms has been predictive for poor functional and clinical long-term outcomes.
VALVULAR HEART DISEASE
Magnetic Resonance Imaging Quantitation of Valvular Disease
CMRI quantification of stenosis can be assessed by measuring the velocity of a jet through a stenotic orifice. For high velocities, this requires a short TE to prevent signal loss or other artifacts interfering with the measurement. Turbulence is commonly seen adjacent to the jet core, appearing dark on the cine acquisition. There is good agreement between CMRI and other techniques in evaluating mitral and aortic valve stenosis (Fig. 3-36). The valve area can also be directly planimetered in patients with aortic stenosis. The pressure gradient across a valve can be indirectly quantitated using the modified Bernoulli equation.
Mitral Stenosis
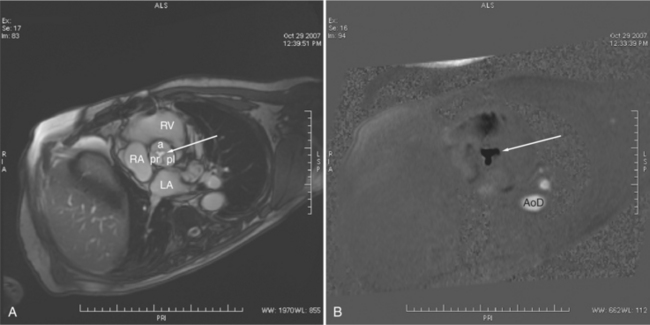
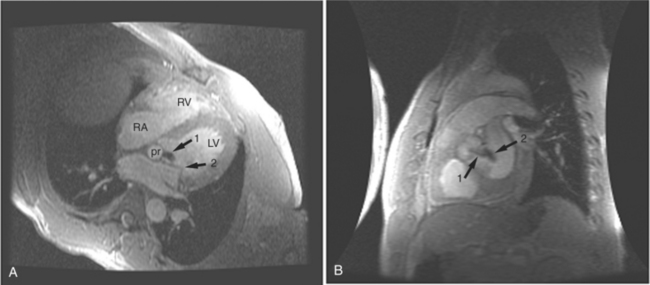
In the early phases of mitral stenosis, elevated pulmonary venous pressure is transmitted across the capillary bed, resulting in “passive” pulmonary arterial hypertension. This may be identified as increase in the caliber of the central pulmonary artery segments. Intestinal edema produces increased intra parenchymal lung signal. On SE MR examination, increased pulmonary resistance may be reflected in slowing of pulmonary blood flow, resulting in some degree of intraluminal signal within the pulmonary arteries. Chronically elevated pulmonary resistance results in right ventricular hypertension and myocardial hypertrophy. On GE MR acquisition, intracavitary muscle bundles will be large and numerous. Thickening of the right ventricular free wall or interventricular septum will be evident. Furthermore, the hypertrophic response changes the shape (geometry) of the right ventricular cavity by changing the curvature of the interventricular septum. This is first reflected as straightening and subsequently reversal of the expected systolic bowing of the septum toward the right ventricle. Change in the geometry of the interventricular septum affects the function of the tricuspid valve papillary muscles, inducing tricuspid regurgitation, right ventricular dilatation, and cardiac rotation. Chronic rheumatic changes visualized on MRI include thickened valve leaflets and shortened chordae. Furthermore, signal void jets reflecting accelerating transvalvular flow, extending from the mitral annulus into the ventricular cavity, may be used to quantitate pressure gradients and flow velocity across the valve.
Therefore, mitral stenosis frequently presents as a complex lesion, affecting both atria and atrioventricular valves and the right ventricle (Fig. 3-37). Throughout the course of mitral stenosis, until late in the disease, the left ventricular volume, mass, and function remain normal.
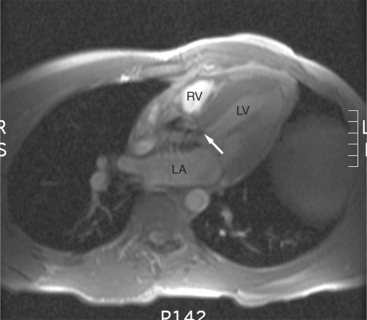
Mitral Regurgitation
The initial insult in chronic mitral regurgitation is minor and not sufficient to produce the signs and symptoms of low cardiac output and pulmonary congestion (Fig. 3-38). Adequate time transpires for the ventricular myocardium to hypertrophy and for individual myocardial fibers to lengthen. This compensatory increase in left ventricular end-diastolic volume permits increased total stroke volume and maintenance of forward cardiac output. In an analogous manner, left atrial dilatation accommodates the regurgitant volume at a lower left atrial pressure (Fig. 3-39). Chronic mitral regurgitation may result from the abnormalities of the leaflets, such as seen in myxomatous degeneration. Dilatation of the mitral orifice and loss of opposition of the mitral cusp edges resulting from alteration in the left ventricular geometry may also result in mitral regurgitation. This is not uncommon in DCM due to ischemic or hypertensive heart disease. It takes more severe left ventricular dilatation to cause mitral regurgitation than it takes right ventricular dilatation to cause tricuspid regurgitation.
Aortic Stenosis
In cases of congenital aortic stenosis, the aortic valve may be unicuspid or bicuspid (Fig. 3-40). A unicuspid valve usually presents in the newborn period with a critical left ventricular outflow obstruction and acute heart failure. CMRI is rarely indicated in these patients. Although a congenitally bicuspid aortic valve is malformed at birth, it rarely causes a significant gradient in infancy. In the early occult stages of the disease, the distorted leaflet architecture causes turbulent blood flow across the valve, traumatizing the leaflet edges. This results in a tissue reaction similar to that found much later in life in individuals with stenosis of tricuspid aortic valves. Gradually, the leaflets become more rigid, and the valve orifice narrows, resulting in a pressure gradient. The congenital malformation makes the valve more susceptible to infectious endocarditis and this may result in mixed aortic regurgitation and stenosis.
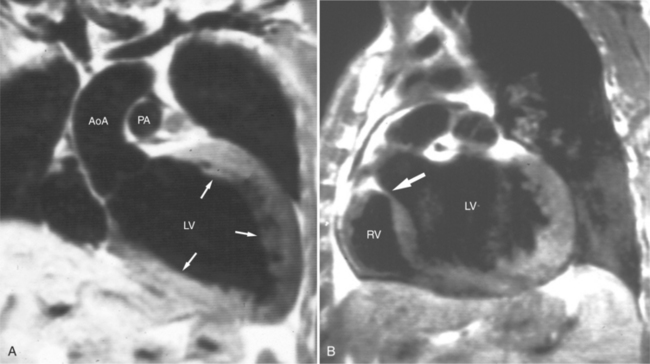
Patients who present with signs and symptoms of aortic stenosis in middle age or later life usually have tricuspid aortic valves. Their valvular disease is the result of slow progressive degeneration, calcification of the valve annulus and leaflets, and consequent narrowing of the effective valve orifice (see Figure 3-36). This abnormality is thought to be the result of normal wear on the valve over decades. Hypercholesterolemia and diabetes are important predisposing factors for degenerative aortic stenosis. The left ventricular obstruction found in patients with aortic stenosis generally develops gradually, resulting in increased left ventricular mass which increases wall thickness while maintaining normal chamber volume. In this way, the left ventricle adapts to the systolic pressure overload. MRI reveals the thickened left ventricular myocardium in the absence of left ventricular dilatation (Fig. 3-41). Furthermore, it is useful to demonstrate the abnormal architecture of congenitally malformed valves.
In cases of valvular aortic stenosis, MR demonstrates the poststenotic dilatation of the ascending aorta. The aortic caliber is normal at the level of the annulus and increases to its maximum at about the level of the transverse right pulmonary artery. The aorta then returns to normal diameter proximal to the arch (Figures 3-41, 3-42). The aortic arch and descending aorta are usually normal in caliber. The shape and size of the signal void jet and its variable extension into the ascending aorta depend on the shape of the orifice and the degree of its narrowing. The severity of the valvular gradient correlates with the size of the stenotic jet and its extension into the aorta. If left ventricular outflow obstruction is subvalvular, such as in hypertrophic obstructive cardiomyopathy, then there is no poststenotic dilatation of the aorta (Fig. 3-43). In these patients, however, systolic anterior motion (SAM) of their anterior mitral leaflet often results in mitral regurgitation (Fig. 3-44). Membranelike subvalvular aortic stenosis usually does not result in SAM and mitral regurgitation.
Aortic Regurgitation
The left ventricular response to aortic insufficiency depends largely on the rate at which the volume overload develops. Acute dilatation does not allow for ventricular adaptation, resulting in decreased forward cardiac output, elevated left atrial pressure, pulmonary edema, and in severe cases, shock. The value of MR examination in patients with acute aortic regurgitation is in noninvasive demonstration of the underlying etiology for the acute left ventricular volume load if echocardiography cannot fully characterize the abnormalities and establish the diagnosis.
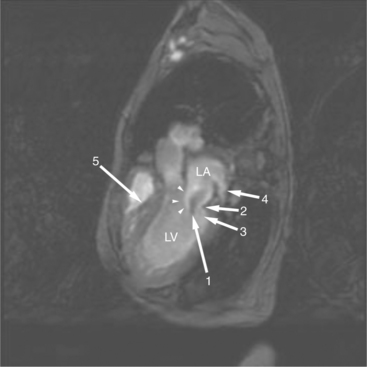
Chronic aortic regurgitation is characterized by increased left ventricular and aortic volume without increase in left ventricular pressure. Concentric and eccentric ventricular myocardial hypertrophy compensates for the increased wall stress induced by the regurgitant volume load. MR quantitation of left ventricular mass shows that although left ventricular wall thickness may appear normal, myocardial mass does in fact increase in these patients. Thus, left ventricular performance (as reflected in normal ejection fraction) remains normal. Left ventricular dilatation is progressive and may become pronounced. MR examination in these patients demonstrates left ventricular and aortic dilatation (Fig. 3-45). The extent of the aortic dilatation varies with the severity and chronicity of the valvular dysfunction. MR examination in these patients has the added advantage of direct demonstration of the jet of aortic regurgitation. Typically, this appears as an early diastolic signal void, seen along the anterior mitral leaflet, extending from the aortic valve to the back wall of the left ventricle but, depending on the shape of aortic valvular orifice, may be directed elsewhere in the left ventricle (Fig. 3-46).
Tricuspid Regurgitation
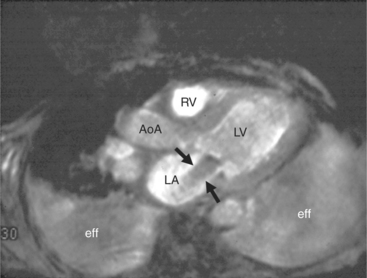
The most common cause of tricuspid regurgitation is pulmonary hypertension. Elevated right ventricular pressure, as seen in pulmonary hypertension of various etiologies, leads to right ventricular hypertrophy and bowing of the interventricular septum. This distorts the papillary muscles originating from the septum, alters right ventricular geometry and causes tricuspid annular dilatation, all of which results in valvular incompetence (Fig. 3-47).
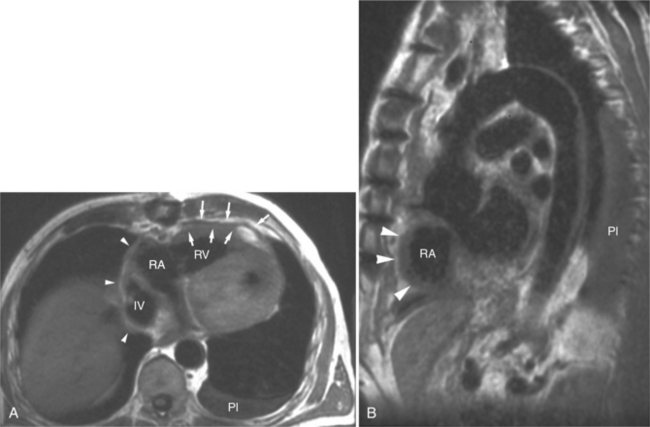
SE and GE MR sequences demonstrate the morphologic stigmata of tricuspid regurgitation. The right ventricle is normally found immediately behind the sternum. In patients with tricuspid regurgitation and other forms of right heart dilatation, the heart rotates, displacing the right ventricle toward the left (Fig. 3-48). The right ventricular free wall lies behind the left chest wall, and right atrium assumes a position behind the sternum. The superior vena cava is displaced medially. The clockwise rotation of the cardiac apex changes the angle the plane of the interventricular septum makes with the coronal body plane. The intraventricular septum appears to lie horizontal within the coronal plane. Changes in the appearance of the interventricular septum may be found during both cardiac systole and diastole. Chronic tricuspid regurgitation flattens and subsequently bows the septum toward the left ventricle in diastole. In severe cases, the interventricular septum bows to the left and may even extrinsically compress the left ventricle impeding filling (Fig. 3-49).
Multivalvular Heart Disease
The most common cause of multivalvular heart disease is rheumatic heart disease. The most common combinations are mixed regurgitant and stenotic mitral and aortic disease with associated tricuspid regurgitation (Fig. 3-50). In combined valvular heart disease, the dominant physiologic alteration is determined by the proximal lesion. However, the radiologic appearance will vary depending on the relative severity and the physiologic sequelae of each particular valve lesion.
RIGHT VENTRICULAR DISEASE AND PULMONARY DISEASE LEADING TO CARDIAC DYSFUNCTION
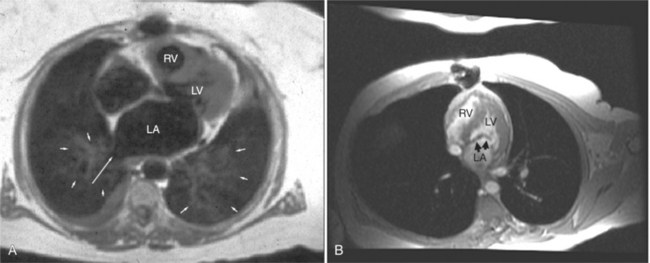
Right ventricular function is commonly affected by disorders of the left-sided cardiac structures and the lungs. The most common cardiac causes for right ventricular dysfunction are chronic left ventricular ischemia and (rheumatic) mitral valve disease. Pulmonary diseases causing right ventricular dysfunction include chronic obstructive pulmonary disease and chronic interstitial diseases (i.e., idiopathic pulmonary fibrosis and cystic fibrosis; Fig. 3-51). Chronic pulmonary vascular disease, including chronic thromboembolism and idiopathic pulmonary hypertension, also has a significant effect on right ventricular function.
Both the left and right ventricles share the interventricular septum. Thus, the septum acts as an “interface” between the left and right hearts. By this mechanism, right heart disease affects left ventricular function and vice versa. Normally, the septum acts as if a part of the left ventricle. The curvature of the interventricular septum is convex toward the right ventricular cavity during both ventricular diastole and systole. Changes in right ventricular shape bow the interventricular septum at the expense of left ventricular shape. That is, right ventricular dilatation may straighten, or even reverse, the contour of the interventricular septum toward the left ventricle (see Figures 3-48, 3-49, 3-51A). In such cases, left ventricular filling and thus end-diastolic volume may be impaired, limiting left ventricular output.
CARDIAC TUMORS
Myocardial Tumors
Cardiac tumors are rare and are usually first diagnosed or suspected after transthoracic echocardiography. They tend to grow slowly and present with signs and symptoms caused by their distortion of adjacent structures or organs. Although it may be difficult to characterize a particular tissue origin from MR examination, these examinations are extremely helpful for characterization of tumor morphology, evaluation of adjacent and distal structure involvement, and the effects of the tumor on cardiac function. The most common cardiac tumors are metastatic malignancies. The most common of these lesions reach the heart by direct extension from the lungs and breast. MR examination is helpful for determining surgical respectability by demonstrating intact ventricular myocardium. In autopsy studies, metastatic foci of melanoma are a common incidental finding.
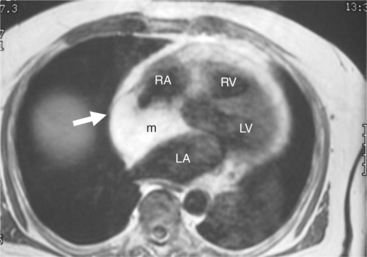
Most (75%) of all primary tumors of the heart are benign and of soft tissue origin: rhabdomyoma, fibroma, lipoma, angioma, and myxoma (Fig. 3-52). These tumors generally appear as infiltrating masses with signal intensity characteristic of the tissue of origin (i.e., high signal lipoma and intermediate signal intensity rhabdomyoma). Differentiation of these benign masses from their sarcomatous counterparts can be inferred by identifying a high signal intensity necrotic core, or other evidence of hemorrhage, distant metastasis, or extensive pericardial and pleural effusion. Myxoma is the most common benign cardiac mass found in all age groups (Fig. 3-53). Myxomas may be highly vascular and enhance with intravenous contrast administration.
Benign cardiac tumors are usually of intermediate, but homogeneous signal intensity. Areas of increased signal intensity may represent areas of focal hemorrhage, indicating tumor necrosis or deposits of fat, reflecting tissue inhomogeneity. Most benign tumors may be “peeled” away from the heart at operation. However, both benign and malignant lesions usually appear to infiltrate adjacent ventricular myocardium. Lipomatous hypertrophy of the interatrial septum is not truly a tumor, but rather, it is a collection of large fat deposits. It may be isolated to the interatrial septum or may extend along the lateral aspect of the right atrium into the right ventricle (Fig. 3-54). Application of fat saturation during image acquisition may directly characterize the lesion.
Malignant cardiac tumors are usually metastatic (Fig. 3-55). About 10% of patients with malignant neoplasms have cardiac metastases. Clinical dysfunction is usually caused by pericardial involvement. This may be visualized as pericardial effusion, pericardial thickening, or both. Pericardial effusion may be serous or hemorrhagic. The most common metastasis in men is from lung; the most common in women is from breast. These are followed by leukemia and lymphoma. Cardiac involvement is often accompanied by involvement of other organs. Primary cardiac malignant tumors (Fig. 3-56) are mostly angiosarcoma, rhabdomyosarcoma, mesothelioma, and fibrosarcoma; pericardial involvement is usually found.
Pericardial Tumors
Focal or generalized pericardial thickening and pericardial effusion may be found in patients with malignant pericardial involvement. Direct invasion can be inferred if the normally pencil-thin pericardium appears thickened or interrupted in close proximity to a neoplasm. CMRI is useful in suggesting the origin of the neoplasm. Intrapericardial neoplasms compress and deform the normal intrapericardial structures, whereas extrapericardial masses tend to displace the intrapericardial structures without compression or distortion.
Malignant pericardial neoplasms tend to be bulky, often septated, inhomogeneous in signal intensity, and confined to or immediately contiguous with the pericardium and pericardial space (Fig. 3-57). MR is excellent at providing information regarding the size, location, and extent of pericardial involvement, but it is not tissue specific. The fatty tumors (lipomas, fat-containing teratomas) are the exception because of their increased signal intensity on SE T1-weighted MR. Fatty tumors must be differentiated from focal deposits of subepicardial fat and nonneoplastic lesions and focal hemorrhage.
Amparo EG, Higgins CB, Farmer D, et al. Gated MRI of cardiac and paracardiac lesions. AJR. 1984;143:1151-1156.
Applegate PM, Tajik AJ, Ehman RL, et al. Two-dimensional echocardiographic and MRI observations in massive lipomatous hypertrophy of the atrial septum. Am J Cardiol. 1987;59:1151-1156.
Axel L, Dougherty L. MR imaging of motion with spatial modulation of magnetization. Radiology. 1989;171:841-845.
Barakos JA, Brown JJ, Higgins CB. MR imaging of secondary cardiac and paracardiac lesions. AJR. 1989;153:47-50.
Boxt LM, Katz J, Kolb T, et al. Direct quantitation of right and left ventricular volumes using nuclear magnetic resonance imaging in patients with primary pulmonary hypertension. J Am Coll Cardiol. 1992;19:1508-1515.
Braunwald E, Goldblatt A, Aygen MM, et al. Congenital aortic stenosis: I. Clinical and hemodynamic findings in 100 patients. II. Surgical treatment and results of operation. Circulation. 1963;27:426-462.
Canter CE, Gutierrez FR, Mirowitz SA, et al. Evaluation of pulmonary arterial morphology in cyanotic congenital heart disease by magnetic resonance imaging. Am Heart J. 1989;118:347-354.
Daliento L, Turrini P, Nava A, et al. Arrhythmogenic right ventricular cardiomyopathy in young versus adult patients: Similarities and differences. J Am Coll Cardiol. 1995;25:655-664.
Danias PG. Gadolinium-enhanced cardiac magnetic resonance imaging: expanding the spectrum of clinical applications. Am J Med. 2001;110:591-592.
Danias PG, Roussakis A, Ioannidis JP A. Diagnostic performance of coronary magnetic resonance angiography as compared against conventional x-ray angiography. J Am Coll Cardiol. 2004;44:1867-1876.
Dewey M, Teige F, Schnapauff D, et al. Noninvasive detection of coronary artery stenoses with multislice computed tomography or magnetic resonance imaging. Ann Intern Med. 2006;145:407-415.
Didier D, Ratib O, Lerch R, et al. Detection and quantification of valvular heart disease with dynamic cardiac MR imaging. Radiographics. 2000;20(5):1279-1299.
Edelman RR, Li W. Contrast-enhanced echo-planar MR imaging of myocardial perfusion: preliminary study in humans. Radiology. 1994;190:771-777.
Friedrich MG, Schulz-Menger J, Poetsch T, et al. Quantification of valvular aortic stenosis by magnetic resonance imaging. Am Heart J. 2002;144:329-334.
Ishida N, Sakuma H, Motoyasu M, et al. Noninfarcted myocardium: correlation between dynamic first-pass contrast-enhanced myocardial MR imaging and quantitative coronary angiography. Radiology. 2003;229:209-216.
Katz J, Boxt LM, Sciacca RR, et al. Motion dependence of myocardial transverse relaxation time in magnetic resonance imaging. Magnetic Resonance Imaging. 1990;8:449-458.
Katz J, Whang J, Boxt LM, et al. Estimation of right ventricular mass in normal subjects and patients with primary pulmonary hypertension by nuclear magnetic resonance imaging. J Am Coll Cardiol. 1993;21:1475-1481.
Kilner PJ, Manzara CC, Mohiaddin RH, et al. Magnetic resonance jet velocity mapping in mitral and aortic stenosis. Circulation. 1993;87:1239-1248.
Kim RJ, Fieno DS, Parrish TB, et al. Relationship of MRI delayed contrast enhancement to irreversible injury, infarct age, and contractile function. Circulation. 1999;100:1992-2002.
Kim RJ, Wu E, Rafael A, et al. The use of contrast-enhanced magnetic resonance imaging to identify reversible myocardial dysfunction. N Engl J Med. 2000;343:1445-1453.
Kitagawa K, Sakuma H, Hirano T, et al. Acute myocardial infarction: Myocardial viability assessment in patients early thereafter: Comparison of contrast enhanced MR imaging with resting 201-Tl SPECT. Radiology. 2003;226:138-144.
Kizilbash AM, Hundley WG, Willett DL, et al. Comparison of quantitative Doppler with magnetic resonance imaging for assessment of the severity of mitral regurgitation. Am J Cardiol. 1998;81:792-795.
Klein C, Nekolla SG, Bengel FM, et al. Assessment of myocardial viability with contrast-enhanced magnetic resonance imaging: Comparison with positron emission tomography. Circulation. 2002;105:162-167.
Lanzer P, Barta C, Botvinick EH, et al. ECG-synchronized cardiac MR imaging: Method and evaluation. Radiology. 1985;155:681-686.
Lotz J, Meier C, Leppert A, et al. Cardiovascular flow measurement with phase contrast MR Imaging: basic facts and implementation. Radiographics. 2002;22:651-671.
Lund TJ, Ehman RL, Julsrud PR. Cardiac masses: assessment by MR imaging. AJR. 1989;152:473-486.
Mahrholdt H, Wagner A, Judd RM, et al. Delayed enhancement cardiovascular magnetic resonance assessment of non-ischemic cardiomyopathies. Eur Heart J. 2005;26:1461-1474.
Markiewicz W, Sechtem U, Higgins CB. Evaluation of the right ventricle by magnetic resonance in aging. Am Heart J. 1987;113:8-15.
Masui T, Finck S, Higgins CB. Constrictive pericarditis and restrictive cardiomyopathy: evaluation with MR imaging. Radiology. 1992:182-373.
McCrohon JA, Moon JC, Prasad SK, et al. Differentiation of heart failure related to dilated cardiomyopathy and coronary artery disease using gadolinium-enhanced cardiovascular magnetic resonance. Circulation. 2003;108:54-59.
Moon JC, McKenna WJ, McCrohon JA, et al. Toward clinical risk assessment in hypertrophic cardiomyopathy with gadolinium cardiovascular magnetic resonance. J Am Coll Cardiol. 2003;41:1561-1567.
Nava A, Thiene G, Canciani B, et al. Familial occurrence of right ventricular dysplasia: a study involving nine families. J Am Coll Cardiol. 1988;12:1222-1228.
Ramani K, Judd RM, Holly TA, et al. Contrast magnetic resonance imaging in the assessment of myocardial viability in patients with stable coronary artery disease and left ventricular dysfunction. Circulation. 1998;98:2687-2694.
Rebergen SA, van der Wall EE, Doornbos J, et al. Magnetic resonance measurements of velocity and flow: technique, validation, and cardiovascular applications. Am Heart J. 1993;126:1439-1456.
Roberts WC, Spray TL. Pericardial heart disease: A study of its causes, consequences, and morphologic features. Cardiovasc Clin. 1976;7:11-65.
Sakuma H, Ichikawa Y, Chino S, et al. Detection of coronary artery stenosis with whole-heart coronary magnetic resonance angiography. J Am Coll Cardiol. 2006;48:1946-1950.
Sakuma H, Takeda K, Higgins CB. Fast magnetic resonance imaging of the heart. Eur J Radiol. 1999;29:101-113.
Schwitter J, Nanz D, Kneifel S, et al. Assessment of myocardial perfusion in coronary artery disease by magnetic resonance: a comparison with positron emission tomography and coronary angiography. Circulation. 2001;103:2230-2235.
Sechtem U, Pflugfelder PW, Gould RG, et al. Measurement of right and left ventricular volumes in healthy individuals with cine MR imaging. Radiology. 1987;163:697-702.
Sechtem U, Pflugfelder PW, White R, et al. Cine MR Imaging: potential for the evaluation of cardiovascular function. AJR. 1987;148:239-246.
Soulen RL, Stark DD, Higgins CB. Magnetic resonance imaging of constrictive pericardial disease. Am J Cardiol. 1985;55:480-484.
Suzuki JI, Caputo GR, Kondo C, et al. Cine MR imaging of valvular heart disease: display and imaging parameters affect the size of the signal void caused by valvular regurgitation. AJR. 1990;155:723-727.
Suzuki JI, Chang JM, Caputo GR, et al. Evaluation of right ventricular early diastolic filling by cine nuclear magnetic resonance imaging in patients with hypertrophic cardiomyopathy. J Am Coll Cardiol. 1991;18:120-126.
Tandri H, Saranathan M, Rodriguez ER, et al. Noninvasive detection of myocardial fibrosis in arrhythmogenic right ventricular cardiomyopathy using delayed-enhancement magnetic resonance imaging. J Am Coll Cardiol. 2005;45(1):98-103.
Thiene G, Nava A, Corrado D, et al. Right ventricular cardiomyopathy and sudden death in young people. N Engl J Med. 1988;318:129-133.
Waller BF, Howard J, Fess S. Pathology of tricuspid valve stenosis and pure tricuspid regurgitation: part III. Clin Cardiol. 1995;18:225-230.
Weinberg BA, Conces DJJr, Waller BF. Cardiac manifestations of noncardiac tumors. Part I: Direct effects. Clin Cardiol. 1989;12:289-296.
Wood P. An appreciation of mitral stenosis: part I. BMJ. 1954;1:1051-1063.
Zerhouni E, Parish DM, Rogers WF, et al. Human heart: tagging with MR imaging—a method for noninvasive assessment of myocardial motion. Radiology. 1988;169:59-63.