Chapter 4 Cardiac Angiography
TECHNIQUES
Indications
In 1999, the Committee on Coronary Angiography of the American College of Cardiology and American Heart Association Task Force established guidelines for coronary angiography (Box 4-1). The final decision must ultimately be based on an analysis of the expected benefits of the procedure balanced against the risks of the technique. Patients who undergo cardiac surgery are usually catheterized first, although with evolving noninvasive techniques, some aspects of the catheterization may be modified or omitted. The clinical variables that can be determined by cardiac catheterization include coronary angiograms, measurement of chamber pressures, detection of intracardiac shunts, characterization of myocardial performance, quantification of valvular stenoses and regurgitation, and imaging of cardiac anatomy. When such information is essential for a management decision, a catheterization is warranted.
Box 4-1 American College of Cardiology and American Heart Association guidelines for coronary angiography
See Box 4-2 for relative contraindications to coronary angiography.
Box 4-2 Relative contraindications to coronary angiography
From Scanlon PJ, Faxon DP, Audet AM, et al.: ACC/AHA Guidelines for coronary angiography. A report of the American College of Cardiology/American Heart Association Task Force on practice guidelines (Committee on coronary angiography), J Am Coll Cardiol 33:1756-1824, 1999.
Catheterization Techniques
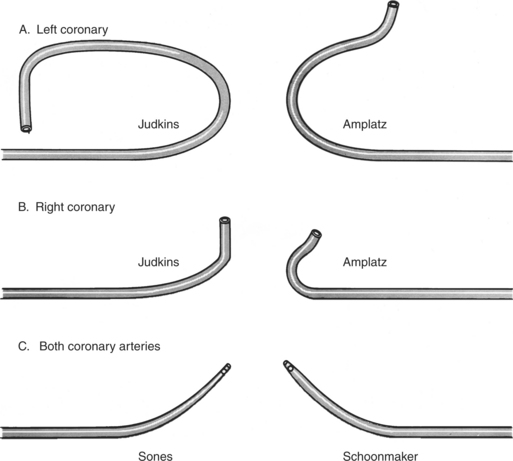
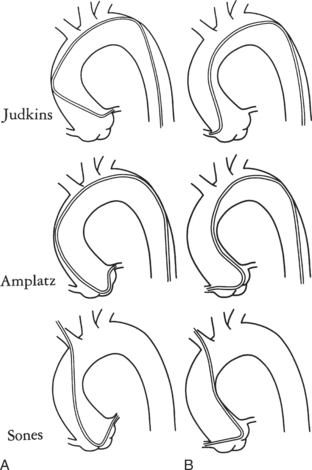
Ricketts and Abrams extended the concept of selective coronary catheterization by devising two catheters, one for each coronary artery, that could be introduced percutaneously into the femoral artery by the Seldinger technique. The concept of a preshaped catheter for selective catheterization was refined by Amplatz and others; various shapes were devised to surmount the difficulties of different aortic sizes and ectopic locations of coronary arteries (Fig. 4-1). In 1967 radiologist Melvin Judkins designed preshaped catheters for both the right and left coronary arteries. The left coronary catheter, if properly aligned, needed only to be advanced around a normal aortic arch to fall into the ostium; whereas the right coronary catheter needed a 180-degree twist after it had passed around the arch (Fig. 4-2). Different catheter shapes and other refinements were introduced by Bourassa and associates, Schoonmaker, and others.
Cineangiography
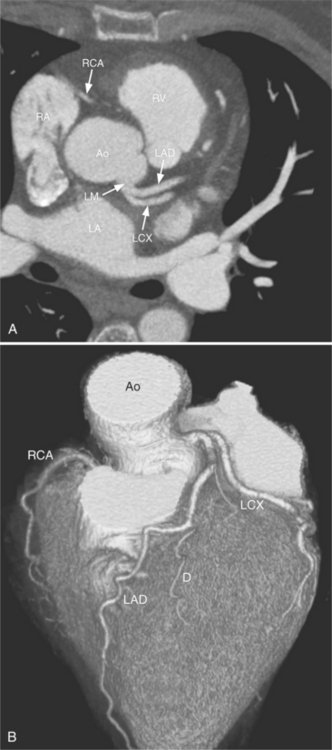
Despite years of development and improved acquisition techniques (gating with or without breath hold) magnetic resonance imaging (MRI) still cannot depict coronary arteries with results equivalent to angiography, even with blood pool contrast agent. Furthermore, MRI has limitations when cardiac patients, such as those with pacemakers, are imaged and this technique requires still, cooperative subjects. Recent developments with electrocardiography gated 64-detector row computed tomography (CT) units (Fig. 4-3) have provided higher resolution than MRI, but CT has its own limitations including the need for iodinated contrast, a high radiation dose, and a heart rate below 65 beats per minute.
Because coronary angiograms are obtained with digital imaging, immediate reviewing is possible during the procedure, which allows the operator to be confident or prompts him or her to obtain additional views.
Projection Positions
The catheter techniques, injection rates, and other technical factors are summarized in Tables 4-1 and 4-2. Power injection techniques are used for all types of cardiac angiography except for coronary arteriography, in which injection is carried out by hand. When high flow exists in the coronary arteries, as in arteriovenous fistulas and in aortic regurgitation, a power injection can be used safely with the same techniques used to inject small arteries in other parts of the body.
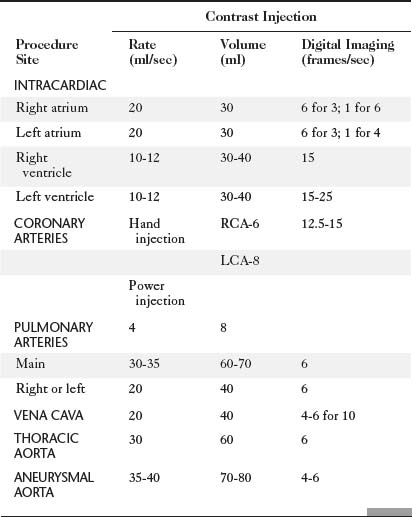
TABLE 4-2 Technical factors for thoracic angiography in children
| Contrast Injection | ||
|---|---|---|
| Procedure Site | Volume (ml/kg) | Delivery Time (sec) |
| INTRACARDIAC | 1-1.5 | 1-1.5 |
| Right atrium | ||
| Right ventricle | ||
| Left atrium | ||
| Left ventricle | ||
| PULMONARY ARTERY | 2 | 1.5 |
| THORACIC AORTA | 2 | 1.5 |
Volume is adjusted to the size of the vascular bed and flow through it.
Delivery time is roughly that of two heartbeats (e.g., at heart rate of 120 beats per sec, inject contrast over 1 sec).
Absolute maximum contrast dose is 5 milliliters per kilogram per day adjusted downward if renal function is decreased and if baby is less than 1 month old.
Radiation Exposure and Protection
The hazards of ionizing radiation are well known to radiologists and should be understood by all physicians who use x-ray equipment. Guidelines for maximum yearly occupational exposure have been established by the National Council on Radiation Protection (NCRP; Table 4-3). The NCRP is considering lowering the total body limit to 20 mSv annually. Lead eyeglasses and thyroid shielding help to diminish the dose received by the angiographer. The effective dose for a physician wearing a lead apron and thyroid shield is about 1.7 mSv/year, rising to 3.5 mSv/year without the thyroid shield. The average effective dose per application, for all types of procedures, is around 1 to 2 μSv for the physician when fully protected.
| OCCUPATIONAL EXPOSURE FOR PEOPLE WORKING WITH RADIATION | |
| Annual | 20 mSv/year over 5 years (ICRP) or 50 mSv/year (NCRP) |
| Cumulative | 10 mSv (1 rem) × age |
| PUBLIC EXPOSURE | |
| Annual | 1 mSv/year over 5 years (100 mrem) (ICRP and NCRP) |
| Lens of eye | 15 mSv (1.5 rem) |
| Skin | 50 mSv (5 rem) |
| Embryo/fetus during gestation | 0.5 mSv (50 mrem) |
Note: Average annual background radiation from natural sources: 3 mSv (300 mrem).
ICRP, International Council on Radiation Protection; NCRP, National Council on Radiation Protection and Measurements.
Adapted with permission from National Council on Radiation Protection and Measurements, Limitation of exposure to ionizing radiation, Report No 116, Bethesda, MD, 1993, National Council on Radiation Protection and Measurements.
Operator radiation exposure during interventional procedures is much higher than for diagnostic angiography. Mikalason and colleagues surveyed interventional angiographers from 17 institutions and calculated a mean annual effective dose to the angiographer of 0.3 to 1 rem (3 to 10 mSv). Dash and colleagues found that during percutaneous angioplasty, operator radiation exposure is nearly doubled compared to routine coronary angiography.
Radiation exposure to the patient undergoing cardiac catheterization is higher than for any other type of radiologic examination but has been justified because the information gained is considered to be necessary for clinical management (Table 4-4). Repeated catheterization, particularly in critically ill children, may give a large radiation dose over a relatively short time span.
TABLE 4-4 Summary of mean radiation exposure during cardiac catheterization to patient and physician
| Mean Dose (mrem) | ||
|---|---|---|
| Site | Patient | Physician |
| ADULTS | ||
| Eye | — | 20 |
| Thyroid | 250 | 16 |
| Chest | 1,100 | 500 |
| Chest (inside apron) | — | 50 |
| Hand | — | 1-30 |
| Gonads | 12 | <10 |
| Skin (direct beam) | 25,000-50,000 (25-50R) | |
| CHILDREN | ||
| Eye | 25 | |
| Thyroid | 430 | |
| Chest | 7,500 | |
| Abdomen | 150 | |
| Gonads | 10 | |
| COMPARISON EXPOSURES | ||
| 1-year cumulative background from natural sources | 100 | |
| Chest radiograph | 10 | |
| Upper gastrointestinal | 3000 series | |
| Lumbar spine series | 3000 | |
| Pulmonary angiography | 15,000 | |
| Chest fluoroscopy | 1-2 rad/min | |
Reprinted with permission of American Journal of Cardiology from Miller SW, Castronovo FP Jr: Radiation exposure and protection in cardiac catheterization laboratories, Am J Cardiol 55:171–176, 1985. Copyright © 1985 by Excerpta Medica, Inc.
Additional local lead shielding should be considered to help limit scattered radiation. The smallest x-ray beam possible will help to reduce the exposure of both the patient and the operator. Movable shields or drapes are available for most of the current angiographic units. Side drapes between the patient and the operator reduce scatter passing through the patient that would ordinarily be received by the operator. Cranial and caudal angulations considerably increase the x-ray tube output, the radiation received by the patient, and the secondary scatter received by the angiographer.
Because radiation decreases as the square of the distance, all personnel who are not needed in the room should be located elsewhere. For instance, the electrophysiologic data collection can be performed from a remote location rather than from beside the fluoroscopy table. Those nurses and technicians remaining in the room should stay as far as practical from the x-ray tube. The radiation physicist can monitor the radiation burden, evaluate the fluoroscopy techniques for each angiographer, and periodically measure the radiation output at various places in the room.
Table 4-5 compares the radiation dose of coronary angiography with other radiology examinations.
TABLE 4-5 Typical effective dose values for radiology examinations
| Imaging Examination | Typical Effective Dose Values (mSv) |
|---|---|
| Dental bite wing radiography | <0.1 |
| Chest radiography | 0.1-0.2 |
| Mammography | 0.3-0.6 |
| Lumbar spine radiography | 0.5-1.5 |
| Barium enema | 3-6 |
| Sestamibi myocardial perfusion study | 13-16 |
| Head CT | 1-2 |
| Chest CT | 5-7 |
| Abdominal CT | 5-7 |
| Coronary artery calcium CT | 1-3 |
| Coronary CT angiography | 5-14 |
| Coronary angiography | 5-10 |
| Average U.S. annual effective dose equivalent from all sources | 3 |
CT, computed tomography.
Modified and reprinted with permission from Bauhs JA, Vrieze TJ, Primak AN, et al.: CT dosimetry: comparison of measurement techniques and devices, Radiographics 28:245-253, 2008.
CORONARY ARTERY ANATOMY
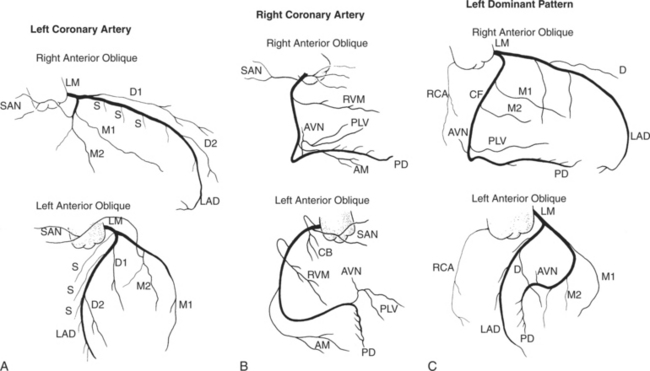
Coronary angiography is performed in at least two projections because it is a projectional technique and atherosclerotic lesions are typically eccentric. The initial RAO and LAO angiograms project the coronary arteries away from the spine (Fig. 4-4). The stenoses are then defined and overlapping branches are eliminated with compound views by adding cranial and caudal angulation. There are no defined rules about the order in which the coronary arteries should be imaged, not even whether this should be done before or after left ventriculography. Some institutions start with the left main and left coronary arteries, whereas others image the right coronary artery first.
Right Coronary Artery
The right coronary artery originates from the right sinus of Valsalva and continues in the right atrioventricular groove to the crux of the heart. Its ostium is usually in the upper two thirds of the sinus but may be ectopically located from slightly below the aortic valve leaflets in the left ventricle to a few centimeters above in the ascending aorta. In bicuspid aortic valves in which the two sinuses of Valsalva are placed anteriorly and posteriorly, the right coronary artery may go anterior from the sinus as compared to the more common angulation of 30 degrees to the right of the sternum in patients with tricuspid aortic valves. The right coronary artery in the LAO view is C-shaped and is conveniently divided into proximal, middle, and distal segments (Fig. 4-5). The proximal right coronary segment lies beneath the right atrial appendage.
Sinoatrial Nodal Artery
The sinoatrial nodal artery branches from the proximal right coronary artery in roughly 50% of patients (see Figure 4-5). When it does not come from the right coronary artery, a longer atrial artery originates from the left circumflex artery and terminates in the same location by sending an anterior and posterior branch around the superior vena cava at the right atrial junction.
Conus Artery
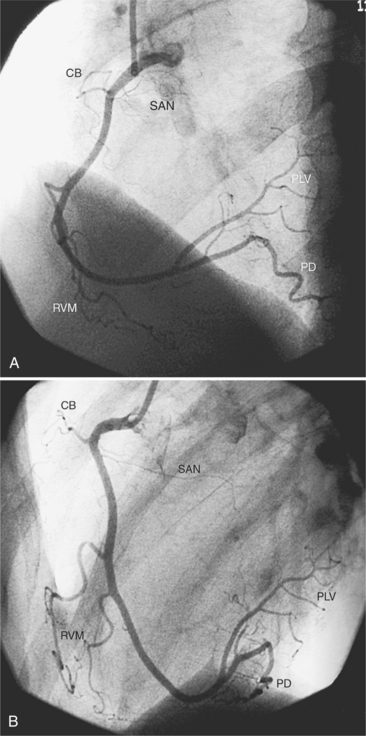
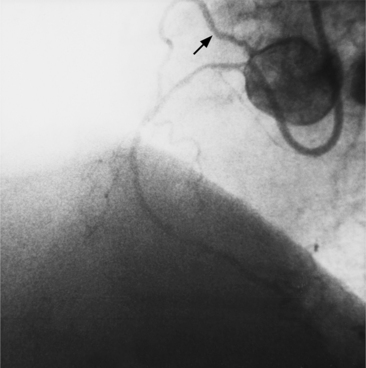
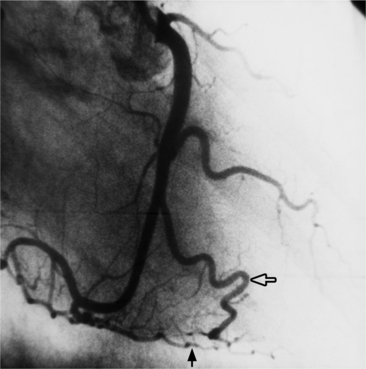
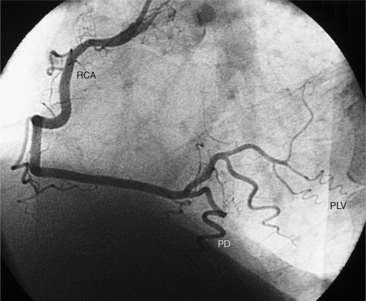
The conus artery is the first ventricular branch of the proximal right coronary artery. This artery has a separate origin from the sinus of Valsalva in about half of all angiograms (Fig. 4-6). The conus artery goes anteriorly around the right ventricular conus or infundibulum and frequently ends in three short branches that resemble a pitchfork. This artery is a common collateral channel to the left anterior descending artery and is then called the circle of Vieussens. The conus artery may also go inferiorly over the right ventricular free wall to form a distal marginal branch. Other right ventricular branches from the middle and distal segments of the right coronary artery are called marginal branches. The acute marginal artery is a large right ventricular marginal artery near the bend in the artery between the middle and distal segments (the acute margin of the heart). Any right ventricular marginal branch may continue along the diaphragmatic wall of the right ventricle to become a short posterior descending artery (Fig. 4-7).
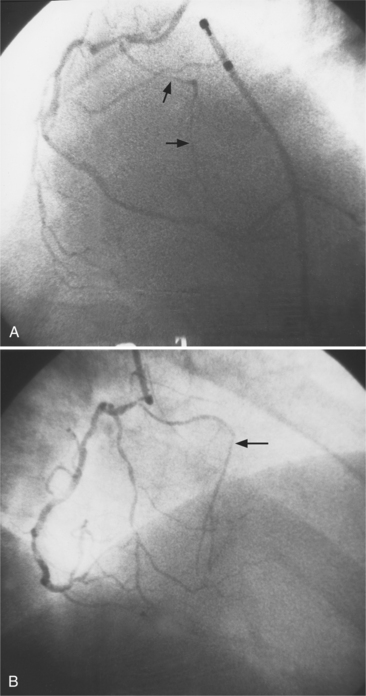
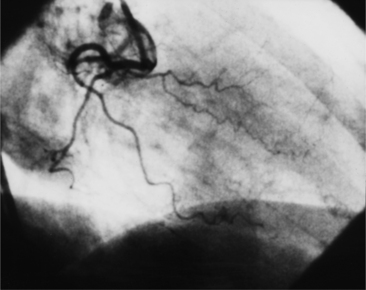
In about 3% of patients a small artery originates near the conus artery that supplies the superior portion of the interventricular septum. The right superior septal perforator artery goes deeper into the myocardium than is usually the case with the conus artery and ends in several straight branches parallel to the interventricular septum (Fig. 4-8).
Distal Right Coronary Artery
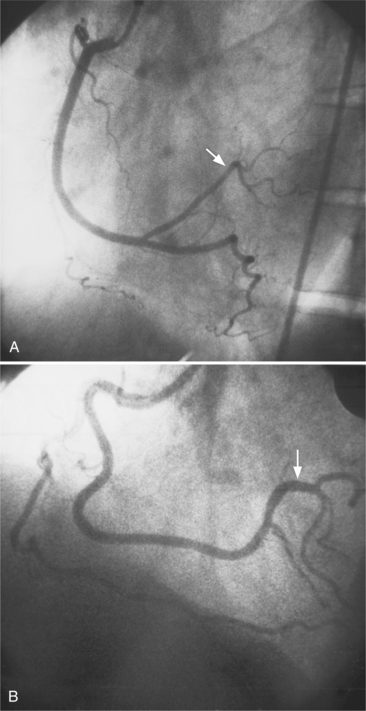
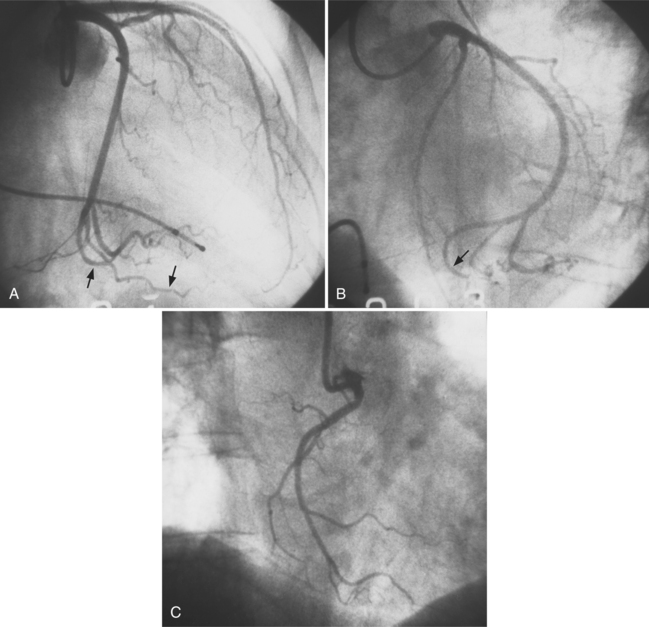
The distal right coronary artery has so many variations that the naming of small branches is at times difficult. The distal right coronary artery typically ends by dividing into a posterior descending artery and a posterolateral left ventricular artery (Fig. 4-9). In about 90% of people the right coronary artery ends in the posterior descending artery and is therefore called the dominant artery. When the left circumflex artery ends in the posterior descending artery, the right coronary artery is nondominant, and the left circumflex artery is then the dominant blood supply inferiorly (Fig. 4-10).
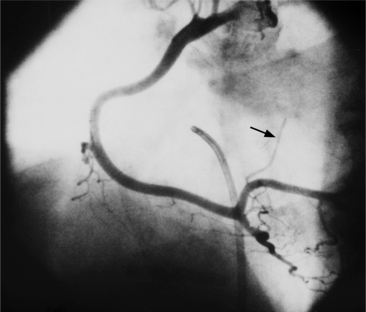
There are many variations in the vascular pattern of the inferior part of the ventricular septum. A codominant pattern is when either a posterior descending artery originates from both the distal right coronary and the left circumflex arteries or the posterior descending artery comes from the right coronary artery and a long left circumflex artery supplies the posterior left ventricular wall. There may be between one and five posterior descending arteries, some of which begin as either right ventricular marginal arteries or left circumflex marginal arteries. The posterolateral left ventricular artery lies in the distal atrioventricular groove and supplies several posterior left ventricular arteries over the posterolateral wall of the left ventricle. This segment frequently has a middle part that is shaped like an inverted U at the crux of the heart (Fig. 4-11). The atrioventricular nodal artery originates near this U-bend and goes superiorly for about 1 cm to the region of the atrioventricular node (Fig. 4-12).
Left Coronary Artery
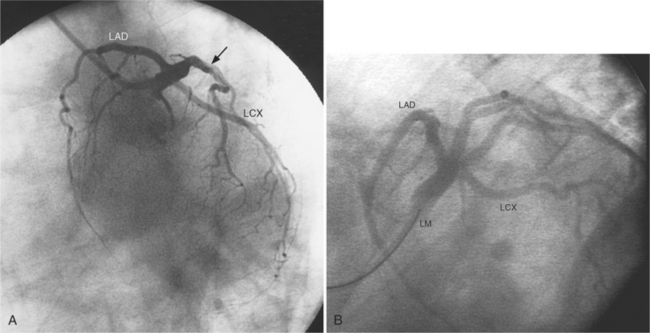
The left sinus of Valsalva is the origin of the left coronary artery. The left main artery does not taper and typically is about 1 cm long (Fig. 4-13). However, there may be no left main artery, with the left anterior descending artery and left circumflex arteries originating separately from the left sinus. The left main coronary artery may trifurcate into a left anterior descending artery, an intermediate artery or ramus medianus (Fig. 4-14), and the left circumflex artery. The caudal LAO (also called the “spider” view because of the arachnoid shape of the proximal left coronary artery) puts the left main and proximal circumflex arteries in the plane of the film but foreshortens the left anterior descending artery (Fig. 4-15).
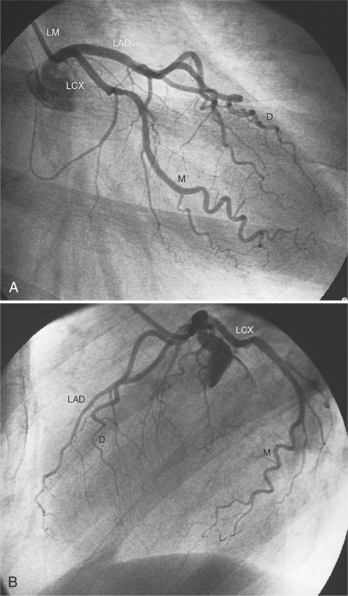
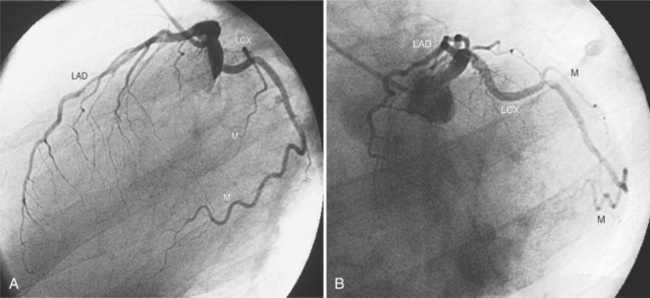
Left Circumflex Artery
The left circumflex artery lies in the left atrioventricular groove and may exist only as a vestigial twig or may be so long that it ends by becoming the left posterior descending artery (Fig. 4-16). Its major branches are called left circumflex marginal arteries and are numbered first, second, and so on. Because the inferior and left side of the heart is the obtuse border, marginal branches in this location may be called obtuse marginal arteries (Fig. 4-17). Late filming of a left coronary artery injection shows the coronary veins. The great cardiac vein, which becomes the coronary sinus, is in the left atrioventricular groove and serves as a landmark for the left circumflex artery.
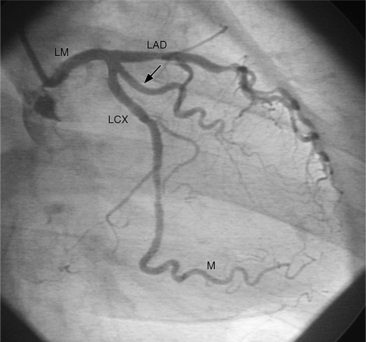
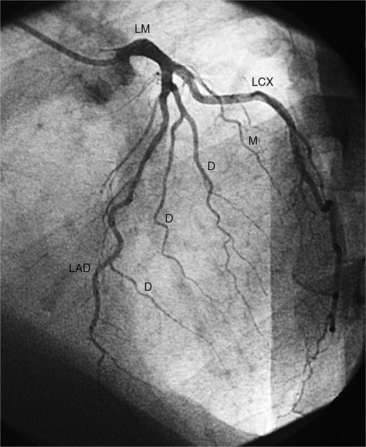
Left Anterior Descending Artery
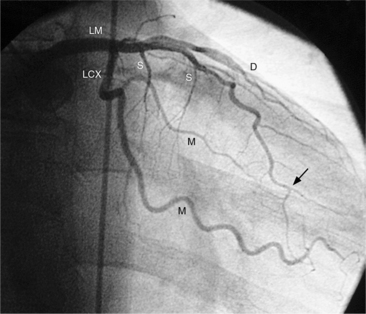
The left anterior descending artery lies in the interventricular groove and supplies two distinctive types of branches, septal and epicardial (Fig. 4-18). Septal branches go to the interventricular septum, usually along the right ventricular side of the septum, and originate from the left anterior descending artery in a nearly perpendicular direction. The septal branches may themselves have branches, and commonly the first septal branch may have a broomlike appearance. Epicardial branches over the anterolateral wall are called diagonal arteries and number from one to many.
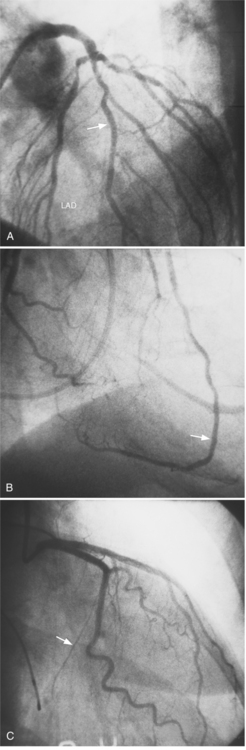
Several characteristics of the left anterior descending artery are unique and help to identify this artery on a coronary angiogram. The anterior descending artery is usually the longest branch of the left coronary artery and ends at the cardiac apex or occasionally continues to supply most of the inferior septum. The termination characteristically looks like an inverted Y (Fig. 4-19). Unlike other branches of the left coronary artery, the left anterior descending artery has numerous septal branches throughout its length (Fig. 4-20). A rare septal branch may come from the left main, a diagonal, or a circumflex marginal artery proximally. There is little motion of the left anterior descending artery in contrast to the 1-cm excursion of the left circumflex artery adjacent to the left atrium.
Cardiac Veins
Identification of the cardiac veins is useful in angiography because they mark the atrioventricular and interventricular boundaries of the chambers. Occasionally they demonstrate anomalies such as persistent left superior vena cava terminating in the coronary sinus, absence of the coronary sinus, or anomalous pulmonary venous connection to the coronary sinus. Veins are distinguished from coronary arteries because the veins opacify several seconds after arterial injection, have less opacification than the corresponding adjacent arteries, are generally larger than the adjacent arteries, and drain into the coronary sinus or a cardiac chamber.
The left ventricle has veins that lie roughly beside the major arteries (Figure 4-21). The anterior interventricular vein lies adjacent to the left anterior descending artery; it extends superiorly from the apex to pass beneath the left atrial appendage and joins the great cardiac vein beside the left circumflex artery.
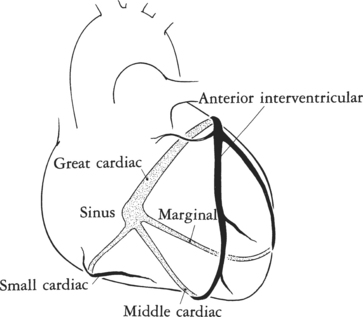
The posterior interventricular vein, also called the middle cardiac vein, runs beside the posterior descending artery from the apex to the crux and either drains into the coronary sinus or separately enters the right atrium.
CARDIAC CHAMBERS
Each of the four cardiac chambers has distinctive features that aid in its identification in all but the most primitive hearts (Box 4-3).
Box 4-3 Angiographic characteristics of the cardiac chambers
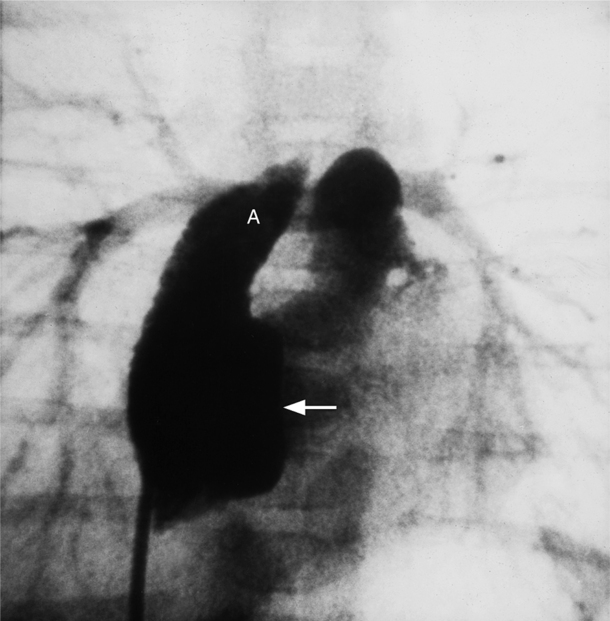
Right Atrium
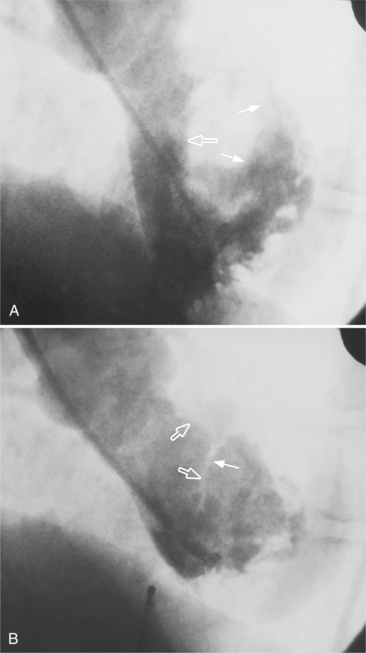
The right atrium has an appendage that is larger than the left atrial appendage and has a broad-based connection to the main chamber (Fig. 4-22). The inflow structures of the right atrium are the inferior vena cava, the superior vena cava, and the coronary sinus. The internal structures are difficult to identify angiographically but MRI usually shows the fossa ovalis, the crista terminalis, and the pectinate muscles.
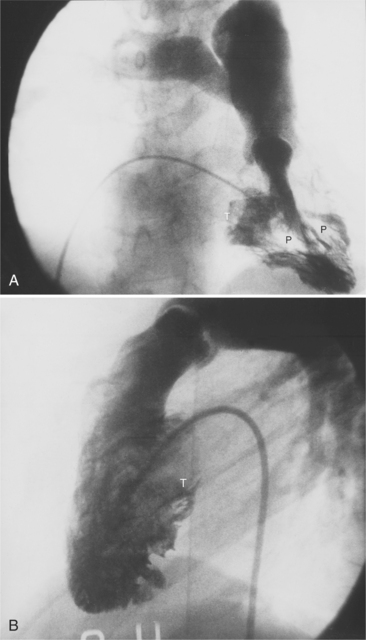
Right Ventricle
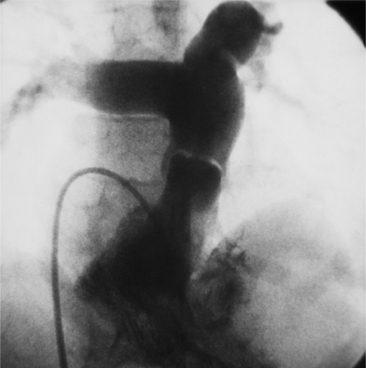
The right ventricle has a complex shape consisting of a triangular body and a cylindrical outflow tract. Its three parts are the inflow segment, the body, and the outflow segment (Fig. 4-23). The inflow region is the tricuspid valve and its apparatus, including the papillary muscles. The anterior, posterior, and septal leaflets of the tricuspid valve are easily identified on an echocardiogram and can frequently be separately distinguished during angiography and MRI. Compared to the left ventricle, the right ventricle has larger trabeculations that extend on to the septum. The moderator band is usually the largest trabeculation near the septum. The walls of the right ventricle are named according to their location: anteroseptal, apical, and diaphragmatic in the RAO view and septal and anterior in the LAO view. The outflow tract of the right ventricle is the infundibulum or conus and is cylindrical (Fig. 4-24). The pulmonary valve is separated from the tricuspid valve by the infundibulum—a landmark difference from the left ventricle in which the aortic and mitral annuli join posteriorly. This conal segment has normal contractions and may narrow considerably in systole in right ventricular hypertrophy.
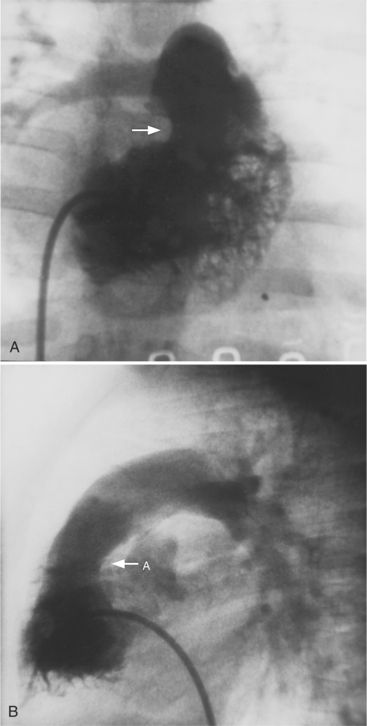
Left Atrium
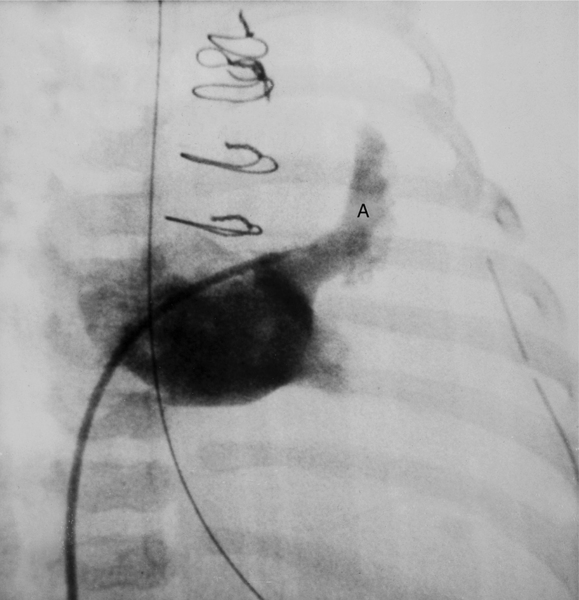
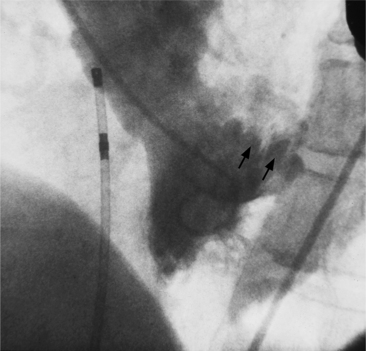
The left atrium is behind and to the left of the right atrium. The pulmonary veins either connect with this chamber as four individual vessels, or occasionally, the superior and inferior pulmonary veins on each side have joined before connecting to the heart. The body of the left atrium has no trabeculations but the interior of the left atrial appendage may be finely striated. In contrast to the right atrium, the left atrial appendage has a narrow neck and is normally smaller (Fig. 4-25).
Left Ventricle
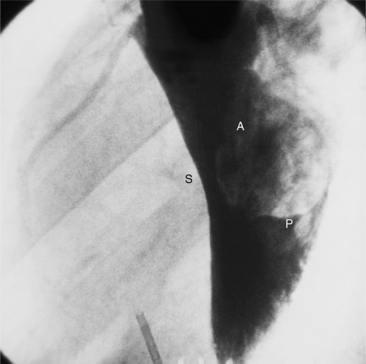
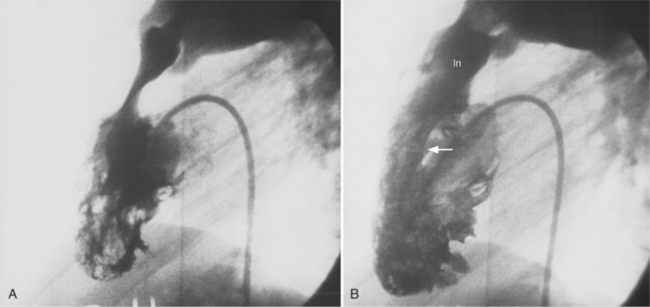
The left ventricle has an oval shape and finer trabeculations than the right ventricle (Fig. 4-26). The mitral valve (considered part of the left ventricle) consists of anterior and posterior leaflets. The anterior or septal leaflet covers about one third of the mitral circumference and has a smoothly rounded border. The posterior leaflet typically has several scallops and covers two thirds of the mitral circumference. The chordae can occasionally be seen as thin lucencies on a left ventriculogram. The papillary muscles may have single or multiple heads and connect about half of the distance between the base and the apex of the left ventricle. Because the papillary muscles look like filling defects on the left ventriculogram, they are occasionally confused with thrombus. However, the papillary muscles contract during systole as the adjacent wall also contracts, a criterion that distinguishes thrombus or tumor from papillary muscles. A major landmark of the left ventricle is the continuity of the mitral and aortic valves. Unlike the right ventricle, there is no muscle between the aortic and mitral valves.
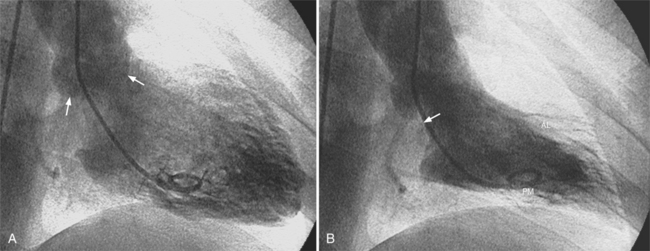
The walls of the left ventricle are arbitrarily divided into five segments in the RAO projection and into four segments in the LAO view (Fig. 4-27). The septum and the anterior leaflet of the mitral valve are better seen if cranial angulation is added in the LAO projection (Fig. 4-28).
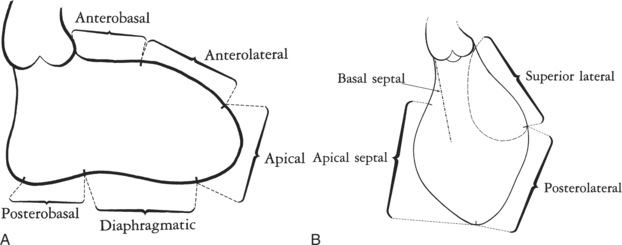
FIGURE 4-27 Left ventricular wall segments. A, Right anterior oblique view. B, Left anterior oblique view.
CARDIAC VALVES
Mitral Valve
The mitral apparatus consists of five related structures (Fig. 4-29):
Disorders in any of these structures may result in dysfunction of the valve. Furthermore, abnormalities in the left ventricular wall adjacent to the papillary muscles, such as infarct or aneurysm, may also cause mitral regurgitation.
The chordae tendineae extend from the heads of the anterolateral and posteromedial papillary muscles, branch into several divisions, and then insert both on to the leaflets and into the subjacent left ventricular endocardium. The chordae from one papillary muscle extend to both mitral leaflets so that a rupture of the papillary muscle leads to severe instability in both valve leaflets during systole. Chordae originating from a papillary muscle typically split into three smaller chords before inserting into the leaflet (however, the division is inconstant). The clinical significance of this split is that rupture of a single chorda usually has no effect on mitral valve competency, and rupture of several chordae may produce only mild mitral regurgitation. Chordae are usually not seen on a normal left ventriculogram but may become visible if thickened because of a rheumatic process or if stretched and elongated, as in the prolapsing mitral leaflet syndrome (Fig. 4-30).
Normally the papillary muscles contract before the adjacent left ventricular wall does, which brings the leaflets back into position for the ensuing rise in the left ventricular systolic pressure. When this sequence is altered, for example, during a premature ventricular contraction, the mitral valve becomes slightly incompetent. In systole, as the left ventricular apex moves toward the base of the heart, the papillary muscles tense and counterbalance the shortened distance between the chordal insertions and the mitral leaflets, thus preventing regurgitation. In the papillary muscle dysfunction syndrome, the area around a papillary muscle is infarcted or ischemic, which prevents contraction of this muscle. Mitral regurgitation then ensues and the leaflets can occasionally be seen prolapsing into the left atrium.
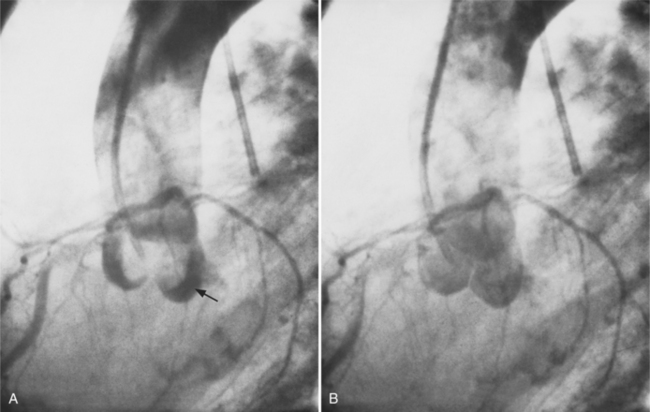
Pulmonary Valve
The sinuses and cusps of the pulmonary valve are designated as anterior, left, and right. The cusps of the pulmonary valve are visible on an angiogram during diastole; however, during the ejection phase the leaflets are thin and are positioned against the main pulmonary artery in such a way that they are usually not visible (Fig. 4-31). The attachments of the pulmonary cusps serve as an important landmark for identifying the upper portion of the right ventricular conus. On a lateral projection (Fig. 4-32) the angle of the blood flow through the pulmonary valve follows a vertical line roughly parallel to the sternum. In pathologic conditions, such as tetralogy of Fallot, the angle of blood flow becomes more horizontal. The practical implication is that in a normally formed heart the pulmonary valve is roughly in tangent in the posteroanterior view but in the patient with tetralogy of Fallot a steep cranial angulation is necessary to profile the valve. During right heart catheterization, a pulmonary capillary wedge pressure can be also obtained, distally in the pulmonary artery, with an occlusive balloon catheter (Swan-Ganz). A true wedge pressure can be measured only in the absence of flow. In this condition, the pressure equilibrates across the capillary bed. The pressure recorded with this technique will provide a measurement of the pulmonary venous pressure, which may be affected by mitral valve diseases or left ventricular dysfunction. In normal conditions, the pulmonary venous and left atrial pressures are equal.
Aortic Valve
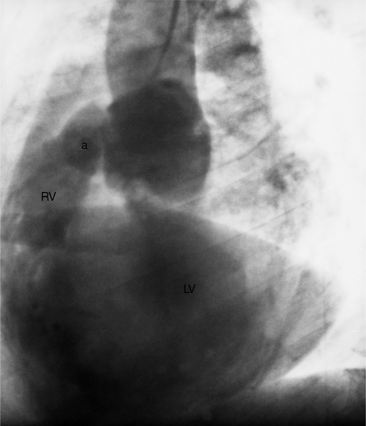
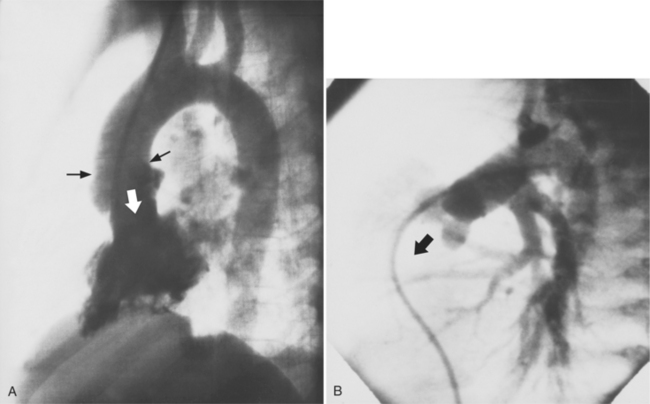
The aortic sinuses of Valsalva and their cusps are named the right, left, and posterior or noncoronary (Fig. 4-33). The sinuses of Valsalva extend to the sinotubular ridge, which marks their junction with the aorta. The coronary arteries usually originate in their respective sinuses about two thirds of the distance superiorly between the aortic valve and the sinotubular ridge. The posterior sinus is next to the atrial septum so that a rupture of this sinus could extend into either atrium. The right sinus of Valsalva is adjacent to the right atrium and the right ventricle (Fig. 4-34), and the left sinus of Valsalva is next to the left atrium and the left ventricle. On the lateral projection of an ascending thoracic aortogram, the plane of the aortic valve is tilted so that the caudal extension of a line perpendicular to this plane goes posteriorly. When the aorta is “untucked,” which occurs in truncus arteriosus and in transposition of the great vessels, a line perpendicular to the plane of the aorta is more anterior (Fig. 4-35).
INTRAVASCULAR ULTRASOUND
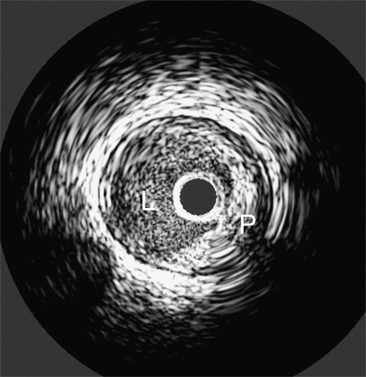
Coronary angiography remains limited by several factors. This technique depicts only the vessel lumen. Angiography does not depict the tissue elements below the intimal surface, and direct visualization of the cross-sectional luminal area is not feasible. IVUS is also sensitive in detecting plaques (Fig. 4-36), as in positive remodeling. This technique also provides accurate qualitative and quantitative data after interventional therapies. IVUS may also provide interesting data about the characterization of plaque (lipid-rich or not). IVUS allows accurate measurement of vessel dimensions when compared to histology and is considered the gold standard because angiograms have been shown to be less accurate in dimension measurements.
HEMODYNAMIC STUDIES
During coronary angiography, the operator can easily assess significant (≥75%) and nonsignificant (<50%) stenosis. Nevertheless, it is still difficult, in some circumstances, to decide whether a lesion is hemodynamically significant or not, especially without noninvasive stress tests or when other tests are inconclusive. A technique has been developed to assess the severity of a narrowing by means of hemodynamic measurements. Pressure measurements are obtained simultaneously at the ostium of the coronary artery and beyond the narrowed segment, under pharmacological stress (adenosine). At maximum hyperemia, the ratio of the ostial coronary and distal coronary pressures is obtained. This ratio is called myocardial fractional flow reserve (FFR). The distal coronary artery pressure is obtained with a wire similar in size with the ones used for percutaneous transluminal coronary angioplasty (PTCA). When the FFR is above 0.75, the narrowing is not considered significant and no intervention is performed. The FFR is independent of change in blood pressure and heart rate and also takes account of collateral blood flow to the dependent myocardium. FFR can also easily be performed after angioplasty or stenting to assess the hemodynamic modification after treatment.
Amplatz K, Formanek G, Stanger P, et al. Mechanics of selective coronary artery catheterization via femoral approach. Radiology. 1967;89:1040-1047.
Bech GJ, De Bruyne B, Bonnier HJ, et al. Long-term follow-up after deferral of percutaneous transluminal coronary angioplasty of intermediate stenosis on the basis of coronary pressure measurement. J Am Coll Cardiol. 1998;31:841-847.
Bech GJ, De Bruyne B, Pijls NH J, et al. Fractional flow reserve to determine the appropriateness of angioplasty in moderate coronary stenosis. A randomized trial. Circulation. 2001;103:2928-2934.
Betsou S, Efstathopoulos EP, Katritsis D, et al. Patient radiation doses during cardiac catheterization procedures. Br J Radiol. 1998;71:634-639.
Cerqueira MD, Wiessman NJ, Dilsizian V, et al. Standardized myocardial segmentation and nomenclature for tomographic imaging of the heart: a statement for healthcare professionals from the Cardiac Imaging Committee of the Council on Clinical Cardiology of the American Heart Association. Circulation. 2002;105:539-542.
Davis K, Kennedy JW, Kemp HG, et al. Complications of coronary arteriography from the collaborative study of coronary artery surgery (CASS). Circulation. 1979;59:1105-1112.
Edwards M. Development of radiation protection standards. Radiographics. 1991;11:699-712.
Efstathopoulos EP, Makrygiannis SS, Kottou S, et al. Medical personal and patient dosimetry during coronary angiography and intervention. Phys Med Biol. 2003;48:3059-3068.
Einstein AJ, Moser KW, Thompsom RC, et al. Radiation dose to patients from cardiac diagnostic imaging. Circulation. 2007;116:1290-1305.
Fearon WF, Yeung AC. Evaluating intermediate coronary lesions in the cardiac catheterization laboratory. Rev Cardiovasc Med. 2003;4:1-7.
Flohr TG, Shoepf UJ, Kuettner A, et al. Advances in cardiac imaging with 16-section CT systems. Acad Radiol. 2003;10:386-401.
Grossman W, Baim DS. Cardiac catheterization, angiography and intervention, ed 7. Philadelphia: Lippincott, Williams & Wilkins, 2006.
Jakobs TF, Becker CR, Wintersperger BJ, et al. CT angiography of the coronary arteries with a 16-row spiral tomography. Effect of spatial resolution on image quality. Radiologe. 2002;42:733-738.
Johnson LW, Lozner EC, Johnson S, et al. Coronary angiography 1984–1987: a report of the Registry of the Society for Cardiac Angiography and Interventions. I. Results and complications. Cathet Cardiovasc Diagn. 1989;17:5-10.
Judkins MP. Selective coronary arteriography, a percutaneous transfemoral technique. Radiology. 1967;89:815-824.
Kohn HI, Fry RJ M. Radiation carcinogenesis. N Engl J Med. 1984;310:504-511.
Leung KC, Martin CJ. Effective doses for coronary angiography. Br J Radiol. 1996;69:426-431.
Lozner EC, Johnson LW, Johnson S, et al. Coronary arteriography 1984–1987: a report of the Registry of the Society for Cardiac Angiography and Interventions. 2. An analysis of 218 deaths related to coronary angiography. Cathet Cardiovasc Diagn. 1989;17:11-14.
Mettler FAJr, Upton AC. Medical effects of ionizing radiation. Philadelphia: WB Saunders, 2008.
Miller RA, Warkentin DL, Felix WG, et al. Angulated views in coronary angiography. AJR. 1980;134:407-412.
Miller SW, Castronovo FP. Radiation exposure and protection in cardiac catheterization laboratories. Am J Cardiol. 1985;55:171-176.
Miller SW. Cardiac angiography. Boston: Little, Brown, 1984.
National Council on Radiation Protection and Measurements: Basic radiation protection criteria Rep No 60, Washington, DC, 1991, National Council on Radiation Protection and Measurements.
Niklason LT, Marx MV, Chan HP. Interventional radiologists: occupational radiation doses and risks. Radiology. 1993;187:729-733.
Perloff JK, Roberts WC. The mitral apparatus. Functional anatomy of mitral regurgitation. Circulation. 1972;46:227-239.
Richman AH, Chan B, Katz M. Effectiveness of lead lenses in reducing radiation exposure. Radiology. 1976;121:357-359.
Roberts WC, Cohen LS. Left ventricular papillary muscles. Description of the normal and a survey of conditions causing them to be abnormal. Circulation. 1972;46:138-154.
Roberts WC, Perloff JK. Mitral valvular disease. A clinicopathologic survey of the conditions causing the mitral valve to function abnormally. Ann Intern Med. 1972;77:939-975.
Ropers D, Baum U, Pohle K, et al. Detection of coronary artery stenosis with thin-slice multi-detector row spiral computed tomography and multiplanar reconstruction. Circulation. 2003;107:664-666.
Scanlon PJ, Faxon DP, Audet AM, et al. ACC/AHA guidelines for coronary angiography. A report of the American College of Cardiology/American Heart Association Task Force on practice guidelines (Committee on coronary angiography). J Am Coll Cardiol. 1999;33:1756-1824.
Sinclair WK. Radiation protection recommendations on dose limits: the role of the NCRP and the ICRP and future developments. Int J Radiat Oncol Biol Phys. 1995;31:387-392.
Waldman JD, Rummerfield PS, Gilpin EA, et al. Radiation exposure to the child during cardiac catheterization. Circulation. 1981;64:158-163.
Webster EW. On the question of cancer induction by small x-ray doses. AJR. 1981;137:647-666.
Wicky S, Rosol M, Hoffmann U, et al. Comparative study with a moving heart phantom of the impact of temporal resolution on image quality with two multidetector electrocardiography-gated computed tomography units. J Comput Assist Tomogr. 2003;27:392-398.
Wyman RM, Safian RD, Portway V, et al. Current complications of diagnostic and therapeutic cardiac catheterization. J Am Coll Cardiol. 1988;12:1400-1406.