Basic Electrocardiographic Techniques
Background
In 1903, Dutch physiologist Willem Einthoven1 first published his recordings of the cardiac cycle with a new device, the string galvanometer. Einthoven’s instrument consisted of a thin, silver-coated quartz filament stretched across a magnetic field. When an electrical current passed through the string, it caused movement from side to side. The filament was connected to electrodes placed on the limbs to measure differences in potential caused by the electrical activity of the heart. Einthoven magnified these measurements with a projecting microscope and recorded them photographically.2
Although others had previously recorded cardiac electrical activity, Einthoven’s instrument laid the basis for modern clinical electrocardiography. His work described the standard frontal-plane limb lead ECG using bipolar electrodes and established standards for recording rate and amplitude. In addition, he described five separate electrical deflections, which he termed P, Q, R, S, and T, thereby establishing the basic electrocardiographic nomenclature.3 Einthoven won the Nobel Prize in 1924 for his electrocardiographic recording machine, which has been called “probably the most sophisticated scientific instrument in existence when it was first invented.”4
Thomas Lewis visited Einthoven’s laboratory and recognized the potential clinical utility of the electrocardiography machine. Lewis became the leading authority on electrocardiography in the early 1900s and was instrumental in the development and clinical application of this new technology.2 Using the electrocardiographic machine, Lewis determined that atrial fibrillation was due to a “circus conduction” involving the auricle of the heart and published much of his clinical work on ECGs in his landmark texts “The Mechanisms of the Heart Beat” in 19115 and “Clinical Electrocardiography” in 1913.6
The development of smaller, portable bedside electrocardiographic recording machines after World War I led to the rapid dissemination and use of ECGs in the clinical setting. In the early 1930s, Francis Wood and Charles Wolferth first reported the use of ECGs to differentiate cardiac and noncardiac chest pain.2 Along with Frank Wilson, their work also led to development of the unipolar “exploring” electrode, which measured electrical activity anywhere in the body with a zero-potential central terminal as a reference. These electrodes could be placed directly over the chest and formed the basis for the standard precordial leads.7
In 1938, the American Heart Association in conjunction with the Cardiac Society of Great Britain established the standard six precordial chest lead positions (V1 to V6).8 These precordial leads, along with Einthoven’s original bipolar limb lead system (I, II, III) and the augmented unipolar limb leads developed by Emmanual Goldberger (aVR, aVL, and aVF) in 1942, make up the standard 12-lead ECG used today.
Indications
The most frequent indication for electrocardiography in the ED is the presence of chest pain. Other common indications include abnormal rhythm, palpitations, dyspnea, syncope, and diagnosis-based (e.g., acute coronary syndrome [ACS], suspected pulmonary embolism) and system-related (e.g., “rule out myocardial infarction [MI]” protocol, admission purposes, and operative clearance) indications.9 The ECG is used to help establish a diagnosis, select appropriate therapy, determine the response to treatment, assist in correct disposition of the patient, and help predict risk for both cardiovascular complication and death.
The initial 12-lead ECG obtained in the ED can be an important tool for determination of cardiovascular risk and, accordingly, the choice of in-hospital admission location. Brush and coworkers10 classified the initial ECG into high- and low-risk groups. The low-risk electrocardiographic group had normal ECGs, nonspecific ST-T-wave changes, or no change when compared with a previous ECG. High-risk ECGs had significant abnormalities or confounding patterns—such as pathologic Q waves, ischemic ST-segment or T-wave changes, left ventricular hypertrophy, left bundle branch block, or ventricular paced rhythms. Patients with initial ECGs classified as low risk had a 14% incidence of acute myocardial infarction (AMI), a 0.6% incidence of life-threatening complications, and a 0% mortality rate. Patients with initial ECGs classified as high risk had a 42% incidence of AMI, a 14% incidence of life-threatening complications, and a 10% mortality rate.10 Another approach to risk prediction involves simple calculation of the number of electrocardiographic leads with ST-segment deviation (elevation or depression)—with an increasing number of leads being associated with higher risk. Along similar lines, the clinician is also able to predict risk with a summation of the total millivolts of ST-segment deviation; once again, higher totals are associated with greater risk.10
The limitations of the ECG must be recognized, however. The ECG is widely reported to have a sensitivity for AMI of only approximately 55%; in one study of 1000 patients with ischemic symptoms, sensitivity improved to 68% with serial ECGs and monitoring of ST-segment trends.11 In another series, the sensitivity of the ECG for AMI ranged from 43% to 65% over a 12-hour period after the onset of ischemic symptom, yet the negative predictive value of a normal ECG (defined as normal or with nonspecific changes or isolated fascicular blocks) for AMI did not improve above 93% during this period.12 In a large series of more than 10,000 patients, in 889 (8%) of whom AMI was ultimately diagnosed, 19 (2%) were inappropriately discharged from the ED. A nonischemic ECG emerged as one of five risk factors for that inappropriate disposition decision (along with female gender, age <55 years, nonwhite race, and dyspnea as a chief complaint); 2 of those 19 had a normal tracing, whereas the other 17 had nonischemic findings on their ECGs.13
Basic Equipment
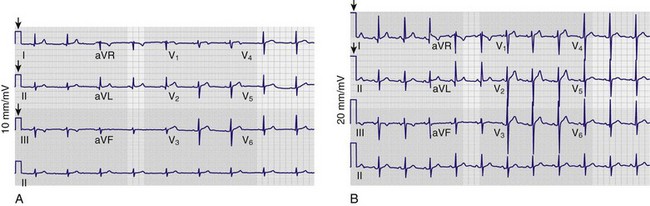
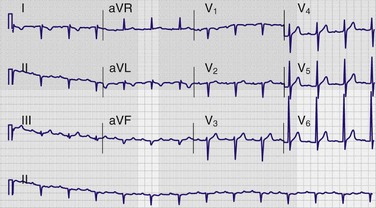
Although there is variability depending on the workplace, most ECGs in use today are three-channel recorders with computer memory. Such multichannel systems, which record electrical events in several leads concurrently, offer advantages over the antiquated single-channel recorder systems: capturing transient events on multiple leads simultaneously; banking the data in computer memory for storage, comparison, and transmission; and allowing presentation of data on a single sheet of paper.14 The electrocardiographic tracing is printed in a standardized manner on standardized paper by the electrocardiograph, which has default settings regarding the speed at which the paper moves through the machine, as well as the amplitude of the deflections to be made on the tracing (Fig. 14-1A). Electrocardiographic paper is divided into a grid with a series of horizontal and vertical lines; the thin lines are 1 mm apart, and the thick lines are separated by 5 mm. At the standard paper speed of 25 mm/sec, each vertical thin line thus represents 0.04 second (or 40 msec), and the thick vertical lines correspond to 0.20 second (or 200 msec). Recordings from each of the 12 leads are typically displayed for 2.5 seconds by default setting; the leads appearing horizontally adjacent to each other are separated by a small vertical hash mark to represent lead change.
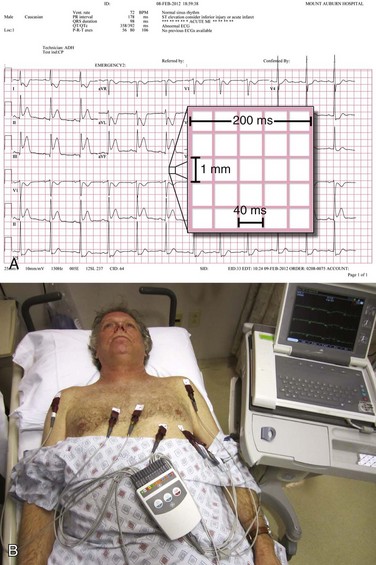
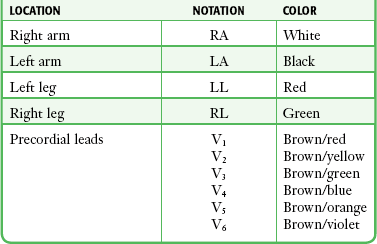
The standard ECG includes 12 leads derived from 10 electrodes placed on the patient; each is color-coded and represented by a two-character abbreviation (Table 14-1; see also Fig. 14-1B). Placement of limb leads on the left and right arms (LA and RA, respectively) and the left and right legs (LL and RL, respectively) by color can be recalled with the help of several mnemonics, including the following: “Christmas trees below the knees (the green and red leads are placed on the lower extremities), “white on right and green to go” (the white lead is placed on the RA, the green lead is placed on the leg that controls the gas pedal, and the red lead is correspondingly placed on the leg that is closer to the brake), and “smoke over fire” (the black LA lead is placed over the red LL lead, as with telemetric monitoring pads). Use of these mnemonics may help prevent right/left confusion during electrode placement—and the consequences of limb electrode reversal and misinterpretation of the ECG (see “Electrode Misplacement and Misconnection” later in this chapter).
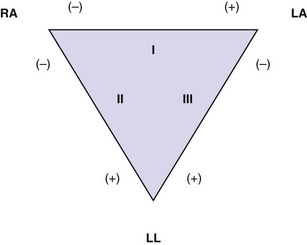
Standard 12 Leads
The standard 12-lead ECG depicts cardiac electrical activity from 12 points of view, or leads, that can be grouped according to planar orientation. Six leads (I, II, III, aVR, aVL, and aVF) are oriented in the frontal, or coronal, plane and derived from the four limb electrodes. The six precordial leads (V1, V2, V3, V4, V5, and V6) are oriented in the horizontal, or transverse, plane, with each representing cardiac electrical activity from that perspective. Leads I, II, and III are termed limb leads and are bipolar in that they record the potential difference between two electrodes (Fig. 14-2). The fourth electrode located on the right leg serves as an electrical ground. The positive poles of these bipolar leads lie to the left and inferior, a position approximating the major vector forces of the normal heart. This early convention was established so that the tracing would feature primarily upright complexes. In contrast, augmented leads aVR, aVL, and aVF are unipolar leads with the positive electrode located at the respective extremities. These augmented leads serve to fill the electrical gaps between leads I, II, and III. Lead aVR stands alone with a polarity and resultant orientation opposite that of the other limb and augmented leads because of the fact that its positive electrode is located in the opposite direction (superior and to the right) of the major vector force of the normal heart (inferior and to the left); thus its complexes usually appear “opposite” those in most or all of the other leads.
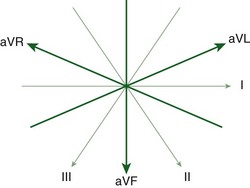
Merging of the vector axes of the limb and augmented leads around a central axis yields a hexaxial system representing cardiac electrical activity in the frontal plane (Fig. 14-3). The six precordial leads, oriented in the horizontal plane, represent six unipolar electrodes with vector positivity oriented toward the chest surface and the central terminal of the hexaxial system serving as a negative pole. In contrast to the frontal-plane leads, the angles between each of the precordial leads in the horizontal plane are not equal. They can vary depending on electrode placement and body habitus.
Electrode Placement
The four limb electrodes are conventionally placed on the extremities as follows: RA on the right wrist, LA on the left wrist, RL on the right ankle, and LL on the left ankle. Electrodes may be affixed more proximally on the limbs if necessary (e.g., amputation, severe injuries), ideally with a notation made on the ECG.15 Others note that the electrodes may be placed on any part of the arms or legs, provided that they are distal to the shoulders or inguinal/gluteal folds, respectively.16
Mason-Likar electrode placement is commonly used by hospital staff and paramedics; this approach does not alter precordial electrode placement but instead moves the limb electrodes to the torso. Originally described in 1966, the Mason-Likar configuration differs from standard electrode placement in that the arm electrodes are relocated to the infraclavicular fossae (medial to the borders of the deltoid muscles and 2 cm below the clavicles) and the leg electrodes are positioned along the anterior axillary lines (halfway between the costal margins and the iliac crests). Actual torso positioning may differ in practice because of individual variation or an attempt to simulate limb electrode placement. A rightward frontal-plane access shift has been described when torso electrode placement is used for the limb electrodes instead of standard positioning on the extremities. Mason-Likar positioning has also been associated with diminution of inferior Q waves, thus making detection of inferior MI more difficult.17 An alternative electrode configuration is the Lund system, in which the arm electrodes are placed laterally on the left and right arms at the level of the axillary folds and the leg electrodes are positioned laterally on the major femoral trochanters. The Lund system has been found to more directly approximate the electrocardiographic recordings obtained with conventional positioning than the Mason-Likar configuration does.18,19
The precordial electrodes should be placed as follows: V1—right sternal border, fourth intercostal space; V2—left sternal border, fourth intercostal space; V3—midway between V2 and V4; V4—left midclavicular line, fifth intercostal space; V5—left anterior axillary line, same horizontal level as V4; and V6—left midaxillary line, same horizontal level as V4 and V5 (Fig. 14-4). Note that V4 to V6 are placed at the same horizontal level, not all in the fifth intercostal space. If V5 and V6 are situated so that they follow the contour of the intercostal space rather than being on the same horizontal level, they will be superiorly displaced as the ribs curve around the side of the thorax. Minor changes in the position of the precordial leads will alter the ECG tracing, so it is important to keep the adhesive leads in place throughout the ED stay so that lead placement is identical during serial ECG comparisons.
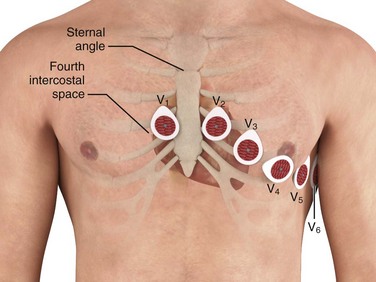
Intercostal space number can be determined by first palpating the sternal angle (angle of Louis), which is the junction of the manubrium and body of the sternum (see Fig. 14-4). This transverse bony ridge is located about 5 cm caudad from the sternal notch in adults. Immediately lateral and inferior to it is the second intercostal space; two spaces farther down lies the fourth intercostal space, where V1 and V2 should be placed. Alternatively, one can count down from the medial aspect of the clavicle; beneath the clavicle lies the first rib, below which is the first intercostal space. The precordial electrodes should not be simply “eyeballed” by the technician because as little as 1 to 2 cm of electrode displacement can result in significant morphologic alteration in the precordial QRS complexes.17,20
If the patient’s anatomy or injury precludes placement of a precordial electrode as just described, it is permissible to attach it within the radius of the width of one interspace of the recommended position, with appropriate notation on the tracing. If the situation demands further displacement, it is recommended that the lead be omitted, with appropriate documentation on the tracing.15
A recent study compared conventional 12-lead electrocardiography with the use of disposable, prewired electrodes linked together and placed on the precordium and torso in a manner similar to Mason-Likar positioning. The prewired device saved time (median, 25 seconds, or 20% faster) and featured significantly less artifact than did the conventional method—at four times the cost, however. Only a slight shift in the mean QRS axis was noted (6 degrees when comparing group means).21
Pediatric Electrode Placement
In addition to the standard 12-lead tracing, leads V4R and V3R should also be recorded; these are mirror images of their left-sided counterparts (see “Additional Leads” later in this chapter). The chest of a tiny infant may not accommodate all the precordial electrodes; in such cases the following array is recommended: V3R or V4R, V1, V3, and V6. Limb electrode placement is the same as in adults.22
Features of the ECG
Information Provided by the Computer
In addition to the patient demographic data entered by the operator, the tracing will often feature computations regarding rate, intervals, and axes along the top of the paper. On some tracings a computer-generated “reading” will also be displayed at the top of the tracing. These interpretations are not infallible. A sample of nine of these programs was compared with the readings of eight cardiologists; the “gold standard” in this study was clinical diagnosis made independently of the interpretations of these tracings based on other objective data (e.g., echocardiography, cardiac catheterization). The performance of the programs was good, with correct interpretations in a median of 91% of cases, but the cardiologists were significantly better (median of 96% correct).23 The computer programs demonstrated a median sensitivity for anterior and inferior MI of only 77% and 59%, respectively.23 Of note, this study did not evaluate interpretation of acute ischemia and cardiac rhythm disturbance—perhaps the most critical issues in electrocardiographic interpretation. Others have found both the computer programs and clinicians to be lacking in their ability to exclude cardiac disease with the ECG, with a negative predictive value for each of between 80% and 85%.24 When diagnosing atrial fibrillation, both general practitioners (sensitivity, 80%; specificity, 83%) and computer software (sensitivity, 83%; specificity, 99%) are flawed; when combined, diagnostic accuracy improves but is still imperfect (sensitivity, 92%; specificity, 91%).25
Adjustable Features
Somewhere on the tracing—usually in the left lower corner of the recording—notation of electrocardiographic paper speed (in millimeters per second), calibration (in millimeters per millivolt), and the frequency response (in hertz) will be evident. Calibration, or standardization, refers to the amplitude of the waveforms on the tracing. It is usually set at a default value of 10 mm/mV and is graphically depicted by a plateau-shaped waveform that appears at the extreme left side of the tracing, in front of the first complex (Fig. 14-5A). This calibration can be modified by the operator or by the computer itself, as was the case in Figure 14-5B, in which the patient appeared to have acquired voltage criteria for left ventricular hypertrophy when in reality the tracing was unchanged from his baseline (see Fig. 14-5A). Increasing the calibration to 20 mm/mV is helpful when trying to decipher P-wave morphology. Decreasing the calibration to 5 mm/mV is helpful in cases in which the amplitude of the QRS complex (usually in the precordial leads) is so large that it encroaches on those of adjacent leads. Standardization may not be uniform throughout a given tracing. At times, calibration will be automatically adjusted by the computer based on the waveform amplitudes that it perceives. For example, it is possible to have normal calibration (10 mm/mV) in the limb and augmented leads with half-standard calibration in the precordial leads (5 mm/mV). This may occur in instances of marked left ventricular hypertrophy. In this case the calibration pulse at the left-hand side of the paper will have a downward stairstep appearance.
Paper speed is usually set at a default of 25 mm/sec. It may be manipulated for purposes of deciphering a dysrhythmia, as described later (see “Alteration in Amplitude and Paper Speed”). It is important that the clinician examine all electrocardiographic tracings for standardization and paper speed parameters before rendering an interpretation.
Additional Leads
15-Lead ECG
In a study of all ED patients with chest pain, Brady and associates26 reported that the 15-lead ECG provided a more accurate description of myocardial injury in patients with AMI yet failed to alter rates of diagnosis or use of reperfusion therapies or to change disposition locations. Looking at a more selected population of ED patients, Zalenski and colleagues27 investigated use of the 15-lead ECG in patients with chest pain and a moderate to high pretest probability of AMI who were already identified as candidates for hospital admission. In this 15-lead ECG study, the authors reported a 12% increase in sensitivity with no loss of specificity (i.e., no increase in false-positive findings) for the diagnosis of ST-segment elevation AMI (STEMI). They concluded that “the findings of ST segment elevation by use of these extra leads can strengthen the ED diagnosis of acute myocardial infarction on the initial tracing and may provide an indication for thrombolytic treatment.” They further suggested that in the diagnosis of posterior AMI, leads V8 and V9 are superior to reliance on detecting the reciprocal ST-segment depression seen in leads V1 to V3. Aqel and colleagues used balloon inflation during coronary angiography for ostial or proximal left circumflex disease to simulate proximal left circumflex STEMI; they found that the posterior leads were significantly better at detecting simulated STEMI when this vessel was occluded. Interestingly, 11% of their 53 patients had 1-mm or greater ST-segment elevation in a posterior lead with no ST-segment elevation or depression in any other lead.28
In a novel approach, consideration of the 12 traditional leads plus their vector opposites to render a “24-lead ECG” using only the standard 10 electrodes has been advanced as a means of deriving more data to both increase sensitivity for STEMI and more accurately localize coronary occlusion with the 12-lead ECG. For example, ST-segment elevation in lead III with ST-segment depression in lead aVL is equivalent to ST-segment elevation in two contiguous leads: lead III and lead (−) aVL, which are 30 degrees apart.29
Posterior Leads
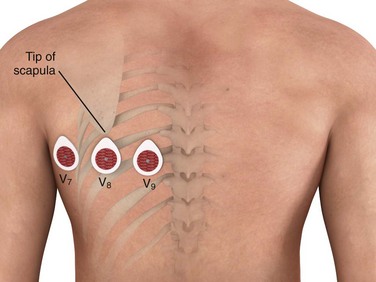
The posterior electrodes V8 and V9 are placed on the patient’s back—V8 at the tip of the left scapula and V9 in an intermediate position between lead V8 and the left paraspinal muscles. An additional electrode, V7, may also be used and is placed on the posterior axillary line equidistant from electrode V8 (Fig. 14-6). The degree of ST-segment elevation in the posterior leads is often less pronounced than the ST-segment elevation seen in the standard 12 leads in patients with STEMI. This diminution in posterior lead ST-segment elevation results from both the relatively greater distance of these leads from the posterior surface of the heart and the presence of air and soft tissue between the epicardium and the electrocardiographic electrodes. It has been suggested that the threshold criterion for intervention be lowered from the standard 1 mm of ST-segment elevation to 0.5 mm when evaluating the posterior leads for STEMI.30
Right-Sided Leads
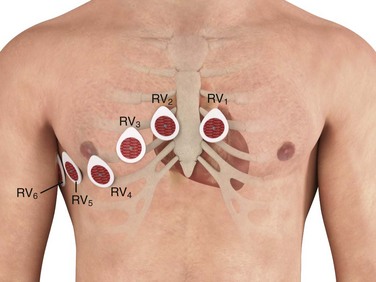
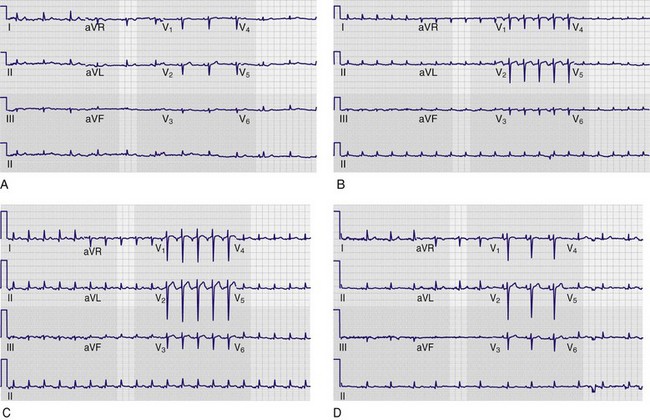
The right ventricular electrocardiographic electrodes are placed across the right side of the chest in a mirror image of the standard left-sided electrodes and are labeled V1R to V6R; alternatively, RV1 to RV6 is another commonly used nomenclature for this electrode distribution (Fig. 14-7). Lead V4R (right fifth intercostal space, midclavicular line) is the most useful lead for detecting ST-segment elevation associated with right ventricular infarction and may be used solely for the evaluation of possible right ventricular infarction. The ST-segment elevation that occurs in association with right ventricular infarction is frequently quite subtle because of the relatively small muscle mass of the right ventricle; at other times the ST-segment elevation is quite prominent, similar in appearance to the ST-segment changes seen with the standard 12 leads (Fig. 14-8).
Invasive Procedural Leads
Patients with severely compromising bradydysrhythmia may require a transvenous pacemaker. In such instances it may be necessary to place the pacing wire without the benefit of fluoroscopy. Advance the wire under electrocardiographic guidance with the patient connected to the limb leads of a grounded electrocardiographic machine and the pacing wire connected to the V lead (see Figs. 15-5 and 15-6). As the electrode enters the superior vena cava and high right atrium, the P wave and QRS complex will be negative. While traversing the atrium, the P wave and QRS complex will become positive, and the latter will become larger as the ventricle is approached. If a balloon-tipped flotation catheter is used, deflate the balloon once it is in the right ventricle. Next, advance it until contact is made with the endocardium and the ventricle is captured. Ventricular wall contact will be indicated by marked ST-segment elevation. Further details regarding emergency cardiac pacing can be found in Chapter 15.
For patients with suspected pericardial effusion who are undergoing urgent pericardiocentesis, an electrocardiographic lead may be placed on the syringe needle. This form of monitoring will assist in correct positioning of the catheter in the pericardial space. Monitor the ST segments while advancing the needle. A sudden appearance of ST-segment elevation indicates that the needle has moved too far internally (i.e., beyond the pericardial space) and has made contact with the epicardium. The emergence of bedside ultrasonography in the ED has made this technique less relevant. Further details regarding pericardiocentesis can be found in Chapter 16.
Body Surface Mapping
An emerging electrocardiographic tool, body surface mapping uses numerous leads to provide a more detailed electrical description of the heart than possible with the 12-lead ECG. The body map ECG that is most commonly used is based on an 80-lead ECG with 64 anterior and 16 posterior leads. This more detailed imaging of the myocardium allows potentially greater diagnostic accuracy in the early detection of STEMI, as well as detection of infarction in more traditionally electrocardiographic “silent” areas of the heart.31–33
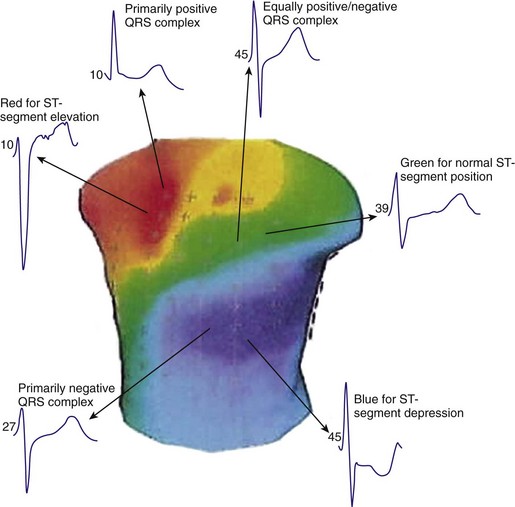
Clinical information is displayed in three basic formats: a standard 12-lead ECG, an 80-lead ECG (Fig. 14-9), and torso maps (Fig. 14-10). The 80-lead ECG demonstrates a single electrocardiographic P-QRS-T cycle for all 80 leads. In the torso maps, colorimetric imaging is used. Positive structures (i.e., electrocardiographic waveforms located above the baseline) are indicated by red—either a QRS complex with an R wave, an ST segment with elevation, or a prominent upright T wave. Electrocardiographic structures found below the baseline are blue in color—a QRS complex with either prominent Q or S waves, ST-segment depression, or inverted T waves. The color green notes a QRS complex that is isoelectric (i.e., no net positive or negative deflection) and ST segments and T waves that are normal.
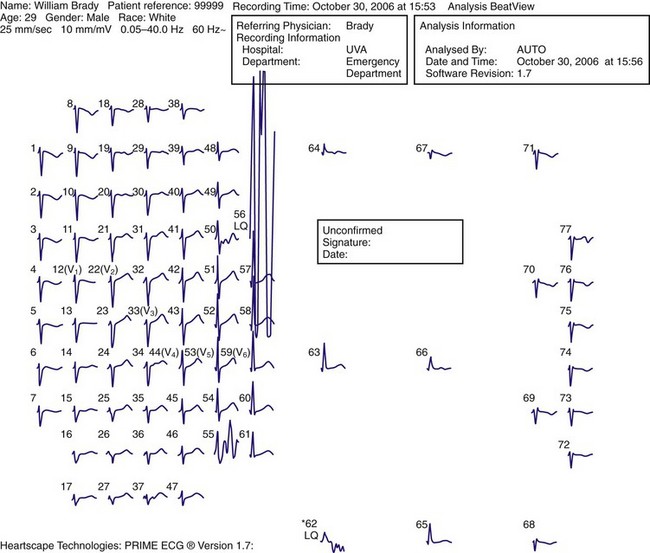
Figure 14-9 The 80-lead electrocardiogram.
The body map ECG should not replace the typical 12-lead ECG in patients with chest pain. It should be used only as a second-tier tool in the evaluation of patients with intermediate to high clinical suspicion for ACS and an unrevealing initial 12-lead ECG. In this instance the clinician is in search of STEMI in electrocardiographically silent areas—namely, the far inferior and lateral walls, the posterior wall, and the right ventricle. Secondary indications include (1) patients with an initially lower suspicion for ACS and a nondiagnostic ECG who later demonstrate a significantly positive serum marker and (2) patients with inferior wall STEMI and additional cardiac segment involvement (e.g., inferoposterior STEMI or inferior STEMI with right ventricular infarction). In a recent study, the OCCULT MI (Optimal Cardiovascular Diagnostic Evaluation Enabling Faster Treatment of Myocardial Infarction) study group obtained simultaneous 12-lead and 80-lead ECGs in patients suspected of having ACS. The 80-lead ECG improved the rate of diagnosis of STEMI by an incremental 27.5% when compared with the embedded 12-lead ECG. In this small study, time to percutaneous coronary intervention was markedly longer, however, in the STEMI group evaluated with an 80-lead ECG only (1002 minutes versus 54 minutes, 80 lead versus 12 lead, respectively), although the outcomes were similar.34
Alternative Techniques for Assessment of Rhythm
Lead V1 is generally considered the best lead for detecting the P wave, followed by lead II. In a study of 62 measurements in 28 patients, lead V1 demonstrated the tallest P wave 53% of the time, followed by lead II (29%), lead I (7%), and lead III (3%).35 A number of alternative techniques have been developed to improve assessment of rhythm, including alterations in the standard 12-lead ECG, as well as the addition of nonstandard leads to monitor cardiac and, in particular, atrial rhythm activity.
Alteration in Amplitude and Paper Speed
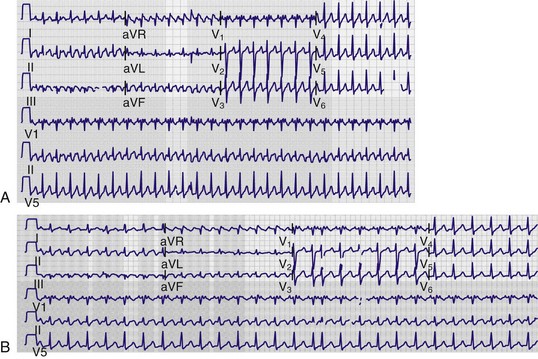
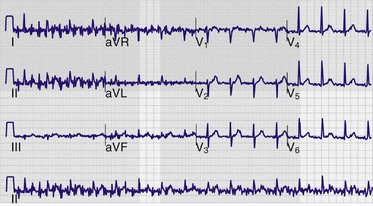
Most 12-lead electrocardiography machines today allow alteration of both amplitude and paper speed from the basic 10-mm/mV and 25-mm/sec standards, respectively. Increasing the amplitude, most commonly to double the standard, or 20 mm/mV, can increase the prominence of smaller deflections, such as the P wave, and improve recognition of the atrial rhythm (Fig. 14-11). In addition, clinicians have also used photocopy enlargements of the standard ECG to visually enhance smaller deflections.36
Increasing the paper speed, again most commonly to double the standard, or 50 mm/sec, has the effect of artificially slowing the rhythm. This technique is most advantageous when assessing patients with marked atrial or ventricular tachycardia. Increasing the paper speed exaggerates any existing irregularity (such as in atrial fibrillation) and can improve recognition of smaller deflections, such as P waves, in the presence of a significant tachycardia. Faster paper speeds also make it possible to measure short electrocardiographic intervals (such as PR or R-R) more accurately (Fig. 14-12).
Accardi and coworkers37 found that overall diagnostic accuracy improved when clinicians were provided ECGs recorded at the faster 50-mm/sec paper speed, as opposed to a standard 12-lead ECG, in patients with narrow-complex tachycardia. Moreover, they reported that this improved rhythm assessment probably would have resulted in fewer treatment errors.
Alternative Leads
Lewis Leads
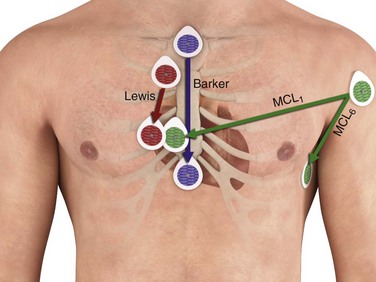
In 1910, Thomas Lewis38 first described alternative positions for the RA and LL leads to enhance detection of atrial fibrillation. The RA lead was placed over the right second costochondral junction, whereas the LL lead was placed in the right fourth intercostal space 1 inch to the right of the sternum—with the LA and RL leads left in their usual positions. Lewis38 reported enhancement of atrial activity when the RA served as the negative electrode and LL as the positive electrode (lead II) in this new configuration. Other alternative lead placements to enhance detection of atrial activity have also been described39–41 (Table 14-2 and Fig. 14-13).
TABLE 14-2
Alternative Leads for Assessment of Rhythm
| Lead I* | RA = negative electrode | LA = positive electrode |
| Lead II* | RA = negative electrode | LL = positive electrode |
| Lead III* | LA = negative electrode | LL = positive electrode |
| ALTERNATIVE LEAD | NEGATIVE ELECTRODE POSITION | POSITIVE ELECTRODE POSITION |
| Lewis† | Right second costochondral junction | Right fourth intercostal space, 1 inch right of the sternum |
| Drury | Second right costochondral junction Center of the sternum |
Seventh right costal cartilage Inferior angle of the scapula 2 inches right of the spine |
| Schoenwald | Third intercostal space along the right sternal border Third intercostal space along the R sternal border |
Left leg Right arm |
| Lu | 1st intercostal space directly above V1 | Approximately 3 inches directly below V4 |
| Vertical sternal (“Barker leads”) | Below the suprasternal notch at the manubrium | Xiphoid process |
| MCL1 | Left shoulder (1 cm inferior to the left midclavicle) | V1 (fourth intercostal space, right sternal border) |
| MCL6 | Left shoulder (1 cm inferior to the left midclavicle) | V6 (≈sixth rib, midaxillary line) |
*First, set the electrocardiographic machine to record the rhythm strip with this lead. If the recording rhythm strip is lead I, the RA wire becomes the negative electrode, which is placed as noted in the table, and the LA wire becomes the positive electrode, which is placed as noted in the table. If lead II or lead III is the lead that is set to record the rhythm strip, the positive and negative electrodes will vary.
†Example: One way to record the Lewis lead is to set the electrocardiographic machine to record lead I, use the RA wire as the negative electrode, and place it in the right second costochondral junction. Use the LA wire as the positive electrode and place it in the right fourth intercostal space, 1 inch to the right of the sternum. The Lewis lead may also be recorded on lead II and lead III, but the wires that serve as the positive and negative electrodes will vary.
Vertical Sternal “Barker” Leads
In this alternative lead system, the positive electrode is placed at the xiphoid process and the negative electrode is placed just below the suprasternal notch on the manubrium. Herzog and associates36 reported that vertical sternal leads produce a larger P wave than other systems do, including the Lewis leads. In addition, the vertical sternal leads are placed over bone, which may reduce artifact from muscle activity on recordings (see Fig. 14-13).
Limb-Precordium Leads
A sequential pattern of bipolar leads on the chest, termed limb-precordium leads, has been proposed in combination with the original Einthoven limb leads. In this system, standard limb leads are placed on the patient. The RA electrode is then repositioned sequentially at the fourth intercostal space just to the right of the sternum, the fourth intercostal space just to the left of the sternum (low parasternal), the first intercostal space just to the left of the sternum, and the first intercostal space just to the right of the sternum (high parasternal). During this sequential mapping, tracings are recorded for leads I and II until atrial activity is identified. Brenes-Pereira42 reported that this mapping system allowed the identification of P waves in a majority of patients when none were detected initially on the standard 12-lead ECG.
Modified Bipolar Chest Leads
Modified bipolar chest leads (MCLs) are the most commonly used leads for monitoring cardiac rhythm. The positive electrode is placed on the chest at a precordial position (V) concordant with the MCL desired (e.g., the V1 position for MCL1). The negative electrode is placed on the left shoulder. On standard electrocardiographic machines, the LA electrode is placed at V1, RA at the left shoulder, LL at V6, and RL at a remote location on the chest to serve as ground. Lead I would then reflect MCL1 and lead II, MCL6. MCL1 may be useful in distinguishing atrial activity, MCL5 and MCL6 more commonly in monitoring of the ST-T wave, and both MCL1 and MCL6 in evaluating wide-complex tachycardias43 (see Fig. 14-13).
Esophageal Leads
The esophageal lead (E) was first described by Brown in the 1930s.44 Since that time, both unipolar and bipolar esophageal leads have been developed.45 Because of its posterior location, this lead is often superior in detecting atrial deflections and recording the activity of the posterior surface of the left ventricle. The electrode, which is connected to the ECG by thin wires, is either swallowed or passed through the nares into the esophagus. Once in the esophagus, the location of the electrode is determined either by fluoroscopy or by making a series of low to high esophageal recordings. The position of the electrode in the esophagus is adjusted by slowly pulling the electrode wire out the nares or mouth. In normal adults, leads E15-25 (the electrode is located in the esophagus 15 to 25 cm from the nares) generally records atrial activity; E25-35, activity of the atrioventricular groove; and E40-50, activity of the left ventricular posterior surface. The E lead should be recorded through lead channel I simultaneously with lead channel II and the other surface channels.
Central Venous Catheter Intracardiac Leads
In patients in whom a central venous catheter was placed for vascular access (or for other reasons such as cardiac pacing, hemodialysis, or Swan-Ganz monitoring), that catheter, when filled with saline, can be used as a modified intracardiac electrode for recording of atrial activity. Once filled with saline, a needle was then left in a side access port of the catheter and attached via an alligator clip to lead V1. With this method, the distal port of the saline-filled central venous catheter demonstrated significantly larger P waves than the standard 12-lead ECG and the Lewis lead did.35
Electrode Misplacement and Misconnection
Although the limb electrodes are not often misplaced, the cables that link them to the ECG are at times improperly connected. This can result in “electrocardiographic changes” that are, in actuality, artifacts. A multitude of possibilities for misconnection of the limb electrodes exists; some of the most probable are summarized here. It is helpful to categorize these possibilities into those that are easily recognizable without comparison to an old ECG versus those that are not. Failure to recognize limb electrode reversal may lead to misattribution of ECG “changes” to a disease that is, in fact, due to technical misadventure. Even though the incidence of electrode reversal in the ED has not been quantified, it has been observed to occur in an intensive care unit setting in 4% to 5% of tracings.46,47
Easily Recognizable without an Old ECG
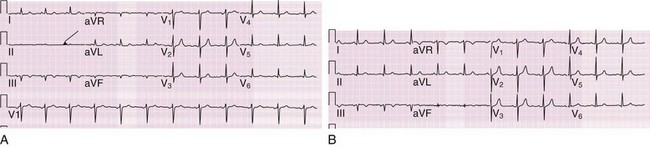
The most common of all misconnections is reversal of the LA and RA electrodes48 (Fig. 14-14). The hallmark is a negative P wave and a primarily negative QRS complex in lead I, which creates a right or extreme axis deviation (depending on the principal vector of the QRS complex in lead aVF). Dextrocardia should also be considered with such findings; the pattern of precordial lead transition will differentiate between dextrocardia and arm electrode reversal, however, with dextrocardia featuring progressive diminution in QRS amplitude as the eye moves from lead V1 (right sided) toward lead V6 (left sided). Moreover, lead aVR is actually aVL in this circumstance, and thus lead aVR may feature both an upright P wave and QRS complex; the former does not occur in normal sinus rhythm, and the latter is clinically unusual—the QRS vectors in leads aVR and V6 are usually opposite unless the heart has a superior frontal-plane axis.49 A further clue to arm electrode reversal is the resultant discrepancy in the major QRS vectors of leads I and V6. Because the vectors of these two leads are leftward, the QRS complexes are expected to point in similar directions when the ECG is performed properly. These two leads will feature discordant QRS vectors when the arm electrodes are reversed (see Fig. 14-14). Transposition of the RA and LL cables is also easily recognized; all leads are upside down in comparison to the usual patterns, with the exception of aVL, which is unchanged.48,50
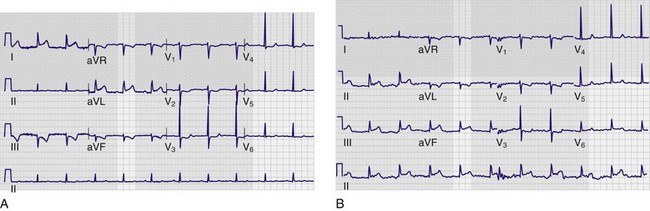
Anytime that the RL electrode is transposed with another extremity lead, one of the limb leads will appear as virtually a straight line and thus is easily recognized if this finding is not incorrectly ascribed to poor electrode contact or function. The most common is RA/RL reversal,51 which causes a nearly flat line in lead II (Fig. 14-15). An exception to this rule is if the leg electrodes are reversed (RL ↔ LL), in which case the ECG is virtually identical to one with correct placement of the limb electrodes. Reversal of the leg electrodes is largely insignificant in that the potentials at the left and right legs are essentially the same.50
Not Easily Recognizable without an Old ECG
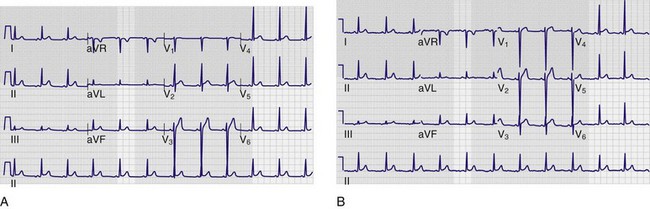
One limb electrode reversal that is not readily recognizable without comparison to a previous tracing is transposition of the LA and LL electrodes. This causes transposition of lead I with lead II on the tracing, as well as lead aVL with aVF. In effect, two inferior leads (II and aVF) have become the lateral leads (I and aVL) and vice versa—thus making this misconnection difficult to detect at times without a baseline ECG for comparison. Furthermore, lead III will be upside down (although a negative QRS complex in lead III is not unusual), and aVR will be unchanged (Fig. 14-16).50 Suspect LA/LL reversal when comparing two ECGs with changes that do not make clinical sense; if the P-QRS-T–wave morphologies in lead III in the two tracings are mirror opposites, repeat the ECG with close attention to correct electrode connection. Clues to limb electrode reversal are summarized in Table 14-3.
TABLE 14-3
Clues to Improper Limb Electrode Connections
| REVERSED LEADS | NEED OLD ECG FOR DETECTION? | KEY FINDINGS |
| LA ↔ RA | No | P-QRS-T waves upside down in lead I Precordial leads normal (not dextrocardia) |
| LA ↔ LL | Yes | III upside down from baseline I ↔ II, aVL ↔ aVF, no change in aVR |
| LA ↔ RL | No | III is a straight line |
| RA ↔ LL | No | P-QRS-T waves upside down in all leads except aVL |
| RA ↔ RL | No | II is a straight line |
| LL ↔ RL | Cannot detect change | Looks like normal electrode placement |
| LA ↔ LL + RA ↔ RL | No | I is a straight line aVL and aVR are the same polarity and amplitude and II is upside down III |
LA, left arm; LL, left leg; RA, right arm; RL, right leg.
From Surawicz B, Knilans TK. Chou’s Electrocardiography in Clinical Practice, 5th ed. Philadelphia: Saunders; 2001.
Precordial Electrode Misplacement and Misconnection
Unlike the limb electrodes, the precordial electrodes are more prone to misplacement, especially when variations in body habitus (e.g., obesity, breast tissue, pectus excavatum, chronic lung disease) make proper electrode placement more difficult. This may cause some variability in the amplitude and morphology of the complexes in the precordial leads. However, these changes are not usually grossly abnormal and therefore can be difficult to detect. Variation often becomes evident when comparing the current tracing with an old ECG.50 In such cases it is useful to go to the bedside and examine where the electrodes were positioned relative to the recommended placement (see “Electrode Placement” earlier in this chapter). One cannot ensure, however, that the baseline ECG was done with proper electrode placement. When comparing the precordial leads on the current ECG with a baseline tracing, ST-segment and T-wave changes should be viewed in the context of the relative morphologies of the associated QRS complexes. If a marked difference is noted between the two tracings in the amplitude or polarity of the QRS complex in a given precordial lead—the R/S ratio for that QRS complex—the corresponding ST-T-wave changes may be due to variability in electrode placement, although cardiac ischemia cannot be completely excluded as the cause.
Some studies have reported that placement of chest electrodes by more than 20 to 25 mm from the standard positions can be associated with clinically significant changes on the ECG. It has been observed that leads V1 and V2 are typically placed too high and that the lateral leads are placed too laterally and too low. McCann and colleagues52 demonstrated a high degree of variability between experienced clinicians in identifying anatomic landmarks for precordial electrocardiographic electrode placement. There was frequently a large difference in the measured distance from the actual to the “standardized” electrode position that ranged between 0 and 105 mm in the vertical direction (mean, 14 mm; median, 10 mm) and between 0 and 120 mm in the horizontal plane (mean, 17 mm; median, 10 mm). Overall, 20.8% of the paired measurements in the vertical direction and 26.6% of those in the horizontal plane differed by more than 25 mm.
Misconnection of the precordial cables is usually easy to detect. The expected progression of P-, QRS-, and T-wave morphologies across the precordium will be disrupted (Fig. 14-17). An abrupt change in wave morphology evolution—followed by a seeming return to normalcy in the next lead—is a good clue to misconnection of the precordial electrodes.50
Artifact
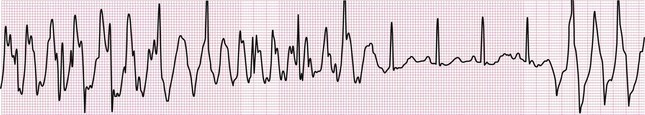
Electrocardiographic artifact is commonly encountered yet not always easy to recognize. It can be attributed to either physiologic (internal) or nonphysiologic (external) sources; the former includes muscle activity, patient motion, and poor electrode contact with the skin. Tremors, hiccups, and shivering may produce frequent, narrow spikes on the tracing and simulate atrial and ventricular dysrhythmias48,53 (Fig. 14-18). A wandering baseline featuring wide undulations, as well as other “noise” on the ECG, can often be traced to patient movement and high skin impedance, which leads to inadequate contact of the electrode with the skin. Minimizing skin impedance and artifact may be achieved by (1) avoiding electrode placement over bony prominences, major muscles, or pulsating arteries; (2) clipping rather than shaving thick hair at electrode sites; and (3) cleaning and, most importantly, drying the skin surface before reapplying the electrode if the tracing features substantial artifact.48,54 Nonphysiologic artifact is most often due to 60-Hz electrical interference, which is ascribable to various other sources of alternating current near the patient. This will be manifested as a wide, indistinct isoelectric baseline. Electrocardiographic artifact should be considered when the clinical picture indicates stability and status quo and coincident procedures are in progress (e.g., hemodialysis, blood warmer, bronchoscopy) or devices are in use (e.g., nerve stimulators)—the list of causative equipment is long and varied.55 Other sources of nonphysiologic artifact include those attributable to the monitoring equipment: loose connections, broken monitor cables, and mechanical issues with the machine (e.g., broken stylus, uneven paper transport). The 60-Hz artifact caused by electrical current interference can be minimized by shutting off nonessential sources of current in the vicinity, as well as by straightening the lead wires so that they are parallel to the patient’s body in the long axis.48,53,56
Differentiation of artifact from true electrocardiographic abnormality is intuitively important; moreover, clinical consequences have been reported that are directly attributable to confusion of artifact with disease. Unnecessary treatment and procedures—including cardiac catheterization, electrophysiologic testing, and even implantation of a pacemaker and an automatic defibrillator—have been reported.57 Characteristics that may aid in differentiating artifact from dysrhythmia include the absence of hemodynamic instability during the event (or even absence of any symptoms), normal QRS complexes occurring during the “dysrhythmia,” instability of the baseline on the tracing during and immediately after the “dysrhythmic” event, association with body movement, and observance of “notches” amid the complexes of the pseudodysrhythmia that “march out” with the normal QRS complexes that precede and follow the disturbance58,59 (Fig. 14-19).
References
1. Einthoven, W. The string galvanometer and the human electrocardiogram. Proc Kon Akademie voor Wetenschappen. 1903;6:107.
2. Fye, WB. A history of the origin, evolution, and impact of electrocardiography. Am J Cardiol. 1994;73:937.
3. Henson, JR. Descartes and the ECG lettering series. J Hist Med Allied Sci. 1971;26:181.
4. Burnett, J. The origins of the electrocardiograph as a clinical instrument. Med Hist Suppl. 1985;5:53.
5. Lewis, T. The Mechanisms of the Heart Beat. London: Shaw and Sons; 1911.
6. Lewis, T. Clinical Electrocardiography. London: Shaw and Sons; 1913.
7. Kossmann, CE. Unipolar electrocardiography of Wilson: a half century later. Am Heart J. 1985;110:901.
8. Barnes, AR, Pardee, HEB, White, PD, et al. Standardization of precordial leads: supplementary report. Am Heart J. 1938;15:235.
9. Brady, W, Adams, M, Perron, A, et al. The impact of the 12-lead electrocardiogram in the evaluation of the emergency department patient [abstract]. Ann Emerg Med. 2002;40:S47.
10. Brush, JE, Brand, DA, Acampora, D, et al. Use of the initial electrocardiogram to predict in-hospital complications of acute myocardial infarction. N Engl J Med. 1985;312:1137.
11. Fesmire, FM, Percy, RF, Bardoner, JB, et al. Usefulness of automated serial 12-lead ECG monitoring during the initial emergency department evaluation of patients with chest pain. Ann Emerg Med. 1998;31:3.
12. Singer, AJ, Brogan, GX, Valentine, SM, et al. Effect of duration from symptom onset on the negative predictive value of a normal ECG for exclusion of acute myocardial infarction. Ann Emerg Med. 1997;29:575.
13. Pope, JH, Aufderheide, TP, Ruthazer, R, et al. Missed diagnosis of acute cardiac ischemia in the emergency department. N Engl J Med. 2000;342:1163.
14. Surawicz, B, Uhley, H, Borun, R, et al. Task Force I: standardization of terminology and interpretation. Am J Cardiol. 1978;41:130.
15. Sheffield, T, Prineas, R, Cohen, HC, et al. Task Force II: quality of electrocardiographic records. Am J Cardiol. 1978;41:146.
16. American Heart Association Committee Report. Recommendations for standardization of leads and of specifications for instruments in electrocardiography and vectorcardiography. Circulation. 1975;52:11.
17. Sejersten, M, Pahlm, O, Pettersson, J, et al. Comparison of EASI-derived 12-lead electrocardiograms versus paramedic-acquired 12-lead electrocardiograms using Mason-Likar limb lead configuration in patients with chest pain. J Electrocardiol. 2006;29:13.
18. Weilinder, A, Wagner, GS, Maynard, C, et al. Differences in QRS axis measurements, classification of inferior myocardial infarction, and noise tolerance for 12-lead electrocardiograms acquired from monitoring electrode positions compared to standard locations. Am J Cardiol. 2010;106:581.
19. Tragardh-Johansson, E, Weilinder, A, Pahlm, O. Similarity of ST and T waveforms of 12-lead electrocardiogram acquired from different monitoring electrode positions. J Electrocardiol. 2011;44:109.
20. Herman, MV, Ingram, DA, Levy, JA, et al. Variability of electrocardiographic precordial lead placement: a method to improve accuracy. Clin Cardiol. 1991;14:469.
21. Lapostolle, F, Petrovic, T, Bernot, B, et al. Comparison of the use of conventional and prewired electrodes for electrocardiography in an emergency setting: the Spaghetti Study. Ann Emerg Med. 2011;57:357.
22. Resnekov, L, Fox, S, Selzer, A, et al. Task Force IV: use of electrocardiograms in practice. Am J Cardiol. 1978;41:170.
23. Willems, JH, Abreu-Lima, C, Arnaud, P, et al. The diagnostic performance of computer programs for the interpretation of electrocardiograms. N Engl J Med. 1991;325:1767.
24. Kudenchuk, PJ, Ho, MT, Weaver, WD, et al. Accuracy of computer-interpreted electrocardiography in selecting patients for thrombolytic therapy. MITI Project Investigators. J Am Coll Cardiol. 1991;17:1486.
25. Mant, J, Fitzmaurice, DA, Hobbs, FDR, et al. Accuracy of diagnosing atrial fibrillation on electrocardiogram by primary care practitioners and interpretive diagnostic software: analysis of data from screening for atrial fibrillation in the elderly (SAFE) trial. BMJ. 2007;335:380.
26. Brady, WJ, Hwang, V, Sullivan, R, et al. A comparison of the 12-lead ECG to the 15-lead ECG in emergency department chest pain patients: impact on diagnosis, therapy, and disposition. Am J Emerg Med. 2000;18:239.
27. Zalenski, RJ, Cook, D, Rydman, R. Assessing the diagnostic value of an ECG containing leads V4R, V8, and V9: the 15-lead ECG. Ann Emerg Med. 1993;22:786.
28. Aqel, RA, Hage, FG, Ellipeddi, P, et al. Usefulness of three posterior chest leads for the detection of posterior wall acute myocardial infarction. Am J Cardiol. 2009;103:159.
29. Wagner, GS, Pahlm-Webb, U, Paylm, O. Use of the 24-lead “standard” electrocardiogram to identify the site of acute coronary occlusion. J Electrocardiol. 2008;41:238.
30. Wung, SF, Drew, BJ. New electrocardiographic criteria for posterior wall acute myocardial ischemia validated by a percutaneious transluminal coronary angioplasty model of acute myocardial infarction. Am J Cardiol. 2001;87:970.
31. Menown, IB, Allen, J, Anderson, JM, et al. Early diagnosis of right ventricular or posterior infarction associated with inferior wall left ventricular acute myocardial infarction. Am J Cardiol. 2000;85:934.
32. Ornato, JP, Menown, IB, Riddell, JW, et al. 80-Lead body may detects acute ST-elevation myocardial infarction missed by standard 12-lead electrocardiography. for the PRIME Investigators. J Am Coll Cardiol. 2002;39:332A.
33. Self, WH, Mattu, A, Martin, M, et al. Body surface mapping in the emergency department evaluation of the chest pain patient: use of the 80-lead ECG system. Am J Emerg Med. 2006;24:87.
34. Hoekstra, JW, O’Neill, BJ, Pride, YB, et al. Acute detection of ST-elevation myocardial infarction missed on standard 12-lead ECG with a novel 80-lead real-time digital body surface map: primary results from the multicenter OCCULT MI trial. Ann Emerg Med. 2009;54:779.
35. Madias, JE. Comparison of P waves on the standard electrocardiogram, the “Lewis lead,” and “saline-filled central venous catheter”–based intracardiac electrocardiogram. Am J Cardiol. 2004;94:474.
36. Herzog, LDR, Marcus, FI, Scott, WA, et al. Evaluation of electrocardiographic leads for detection of atrial activity (P wave) in ambulatory ECG monitoring: a pilot study. Pacing Clin Electrophysiol. 1992;15:131.
37. Accardi, AJ, Miller, R, Holmes, JF. Enhanced diagnosis of narrow complex tachycardias with increased electrocardiograph speed. J Emerg Med. 2002;22:123.
38. Lewis, T. Auricular fibrillation and its relation to clinical irregularity of the heart. Heart. 1910;1:306.
39. Drury, A, Iliescu, CC. Observations upon flutter and fibrillation. Part VIII—the electrocardiograms of clinical fibrillation. Heart. 1921;8:171.
40. Schoenwald, G. Chest leads for the demonstration of auricular activity. Middle Hosp J. 1939;39:183.
41. Lu, RMT, Steinhaus, BM, Bailey, W, et al. Clinical significance of a new P wave lead vector for pacemaker follow-up of atrial functions. Pacing Clin Electrophysiol. 1996;19:1805.
42. Brenes-Pereira, C. New bipolar leads for the study of atrial arrhythmias. Tex Heart Inst J. 1997;24:118.
43. Drew, BJ, Scheinman, MM. Value of electrocardiographic leads MCL1, MCL6 and other selected leads in the diagnosis of wide QRS complex tachycardia. J Am Coll Cardiol. 1991;18:1025.
44. Brown, WH. A study of the esophageal lead in clinical electrocardiography. Am Heart J. 1936;12:1.
45. Schnittger, I, Rodriguez, IM, Winkle, RA. Esophageal electrocardiography: a new technology revives an old technique. Am J Cardiol. 1986;57:604.
46. Rudiger, A, Hellermann, JP, Mukherjee, R, et al. Electrocardiographic artifacts due to electrode misplacement and their frequency in different clinical settings. Am J Emerg Med. 2007;25:174.
47. Thaler, T, Tempelmann, V, Maggiorini, M, et al. The frequency of electrocardiographic errors due to electrode cable switches: a before and after study. J Electrocardiol. 2010;43:676.
48. Surawicz, B. Assessing abnormal ECG patterns in the absence of heart disease. Cardiovasc Med. 1977;2:629.
49. Bennett, KR, Bennett, FT, Markov, AK. Observations on the use of the aVR-V6 relationship to recognize limb lead error. J Emerg Med. 2007;36:381.
50. Surawicz, B, Knilans, TK. Chou’s Electrocardiography in Clinical Practice, 5th ed. Philadelphia: Saunders; 2001.
51. Greenfield, JC, Rembert, JC. Mechanisms of very-low-voltage waveforms in either lead I, II, or III. J Electrocardiol. 2009;42:233.
52. McCann, K, Holdgate, A, Mahammad, R, et al. Accuracy of ECG electrode placement by emergency department clinicians. Emerg Med Australas. 2007;19:442.
53. Chase, C, Brady, WJ. Artifactual electrocardiographic change mimicking clinical abnormality on the ECG. Am J Emerg Med. 2000;18:312.
54. Oster, CD. Improving ECG trace quality. Biomed Instrum Technol. 2000;34:219.
55. Patel, SI, Souter, MJ. Equipment-related electrocardiographic artifacts. Anesthesiology. 2008;108:138.
56. Wagner, G. Marriott’s Practical Electrocardiography, 10th ed. Philadelphia: Lippincott, Williams & Wilkins; 2001.
57. Knight, BP, Pelosi, F, Michaud, GF, et al. Clinical consequences of electrocardiographic artifact mimicking ventricular tachycardia. N Engl J Med. 1999;341:1270.
58. Lin, SL, Wang, SP, Kong, CW, et al. Artifact simulating ventricular and atrial arrhythmia. Jpn Heart J. 1991;32:847.
59. Littmann, L, Monroe, MH. Electrocardiographic artifact [letter]. N Engl J Med. 2000;342:590.