Chapter 4 Autofluorescence Imaging
Basic principles
Fundus autofluorescence
Fundus autofluorescence (FAF) imaging is a noninvasive imaging method for in vivo mapping of naturally or pathologically occurring fluorophores of the ocular fundus. The dominant sources are fluorophores accumulating in lipofuscin (LF) granules in the retinal pigment epithelium (RPE).1 In the absence of RPE cells, minor fluorophores including collagen and elastin, e.g., in choroidal blood vessel walls, may also become visible. Bleaching phenomena and loss of photopigment may result in increased FAF by reduced absorbance anterior to the RPE level.
Retinal pigment epithelium and lipofuscin
The RPE constitutes a polygonal monolayer between the neurosensory retina and the choroid and is essential for vision. Given multiple essential physiological functions of the RPE, it is not surprising that RPE dysfunction has been implicated in a variety of retinal diseases (reviewed by Schmitz-Valckenberg et al.2).
A hallmark of aging is the gradual accumulation of LF granules in the cytoplasm of RPE cells. It is thought that progressive LF accumulation is mainly a byproduct of the constant phagocytosis of shed photoreceptor outer-segment discs.3–5 Several lines of evidence indicate that adverse effects of excessive LF accumulation represent a common downstream pathogenetic mechanism in various monogenic macular and retinal dystrophies as well as in multifactorial complex retinal disease entities, including age-related macular degeneration (AMD).3,4,6–8
Apparently, once formed, the RPE cell has no means of either degrading or transporting LF material and granules into the extracellular space via exocytosis. Subsequently, these granules are trapped in the cytoplasmic space of the postmitotic RPE cells. Previous studies have shown that various LF components such as A2-E (N-retinylidene-N-retinylethanol-amine), a dominant fluorophore, possess toxic properties which may interfere with normal cell function via various molecular mechanisms, including impairment of lysosomal degradation due to inhibition of the lysosomal adenosine triphosphate-dependent proton pump.9–12 Other components of LF include precursors of A2-E, molecules formed by the mixture of oxygen-containing moieties within photo-oxidized A2-E, reactions between retinoids and other constituents other than ethanolamine, and peroxidation products of proteins and lipids.13,14 The molecular composition of LF may possibly be dependent on specific underlying molecular mechanisms. Zhou and associates demonstrated with an in vitro assay a link between inflammation, activation of the complement system, oxidative damage, drusen, and RPE LF.15 They suggested that products of the photo-oxidation of RPE LF components could serve as a trigger for the complement system which could predispose the macular area to a chronic, low-grade inflammatory process over time.
Detection of LF and its constituents is facilitated by its autofluorescent properties. When stimulated with light in the blue range, LF granules typically emit a green-yellow fluorescence.16,17 The distribution of LF in postmitotic human RPE cells and its accumulation with age have been extensively studied in vitro, applying fluorescence microscopic techniques.5,6,8
Near-infrared autofluorescence
Near-infrared autofluorescence (NIA) images can also be obtained in vivo, most commonly and easily by using the indocyanine green angiography mode of the scanning laser ophthalmoscope, i.e., without dye injection.18,19 Due to the excitation and emission in the red end of the spectrum, the topographic distribution of fluorophores other than LF may be studied by this technique. It has been suggested that the NIA signal is largely melanin-derived.18–20 As such, Keilhauer and Delori18 further speculated that, to varying degrees, choroidal sources contributed to this signal. Gibbs et al.21 investigated NIA in humans and mice and suggested that melanosomes in the RPE and choroid were likely the dominant origin of the signal. Except for measurements in cell cultures at low magnification, their analyses were limited to excitation at 633 nm, in contrast to in vivo NIA, which is generated at 795 nm. Using a customized magnification lens attached to the front of the confocal scanning laser ophthalmoscope (cSLO), Schmitz-Valckenberg and coworkers studied the distribution of the NIA signal in retinal cross-sections of a human donor eye and correlated ex vivo autofluorescence measurements to in vivo findings in a rat animal model.22 They observed that the NIA signal was spatially confined to the RPE monolayer and melanin in the choroid.
Macular pigment imaging
Macular pigment, consisting of lutein and zeaxanthin, extensively accumulates along the axons of the cone photoreceptors in the central retina.23–25 As has been reported, a number of functions have been proposed for macular pigment,24,25 including filtration of blue light which may reduce photo damage and glare, minimization of the effects of chromatic aberration on visual acuity, improvement in fine-detail discrimination, and enhancement of contrast sensitivity. Neutralization of reactive oxygen species by macular pigment may have a protective effect on the neurosensory retina. Although there may be a large variation with regard to the concentration of macular pigment, the pattern of distribution is relatively uniform in the normal population. It generally shows a peak concentration at the foveal center and rapidly decreases with eccentricity, with very little present at about 8° of eccentricity.
Peak absorption of luteal pigment is at 460 nm. These absorption properties can be readily recorded in vivo by blue-light autofluorescence imaging.26 Therefore, blue FAF imaging can also be used to determine the topographic distribution of macular pigment. Compared to other methods, including heterochromatic flicker photometry, the advantage of FAF imaging is its objective acquisition technique which is not dependent on psychophysical cooperation by the examined individual.
Techniques of fundus autofluorescence imaging
Recording of autofluorescence images is noninvasive and requires relatively little time.
The intensity of naturally occurring fluorescence of the ocular fundus is about 2 orders of magnitude lower than the background of a fluorescein angiogram at the most intense part of the dye transit.1 Absorption of light with reduction of the fluorescence signal, or excitation and emission of light with an increase in the fluorescence signal by anatomical structures anterior to the retina, may further complicate or interfere with the detection of the FAF signal. In the eye, the principal barrier is the crystalline lens which has highly fluorescent properties in the short-wavelength range (excitation between 400 and 600 nm results in peak emission at c. 520 nm). With increasing age and particularly the development of nuclear lens opacities, the fluorescence of the lens becomes even more prominent.
Pioneering work on the spectral analysis of the origin of the autofluorescence signal was performed by Delori and coworkers1 using a fundus spectrometer. In parallel, von Rückmann et al., in their landmark paper, described the use of cSLO for FAF imaging.27
Fundus spectrophotometer
The fundus spectrophotometer by Delori and coworkers1 was designed to analyse systematically the excitation and emission spectra of the autofluorescence signals originating from small retinal areas (2° diameter) of the fundus. By incorporating an image intensifier diode array as a detector, a beam separation in the pupil, and confocal detection to minimize contribution of autofluorescence from the crystalline lens, this device allowed the absolute measurements of autofluorescence. These authors showed that fundus fluorescence is emitted across a broad band from 500 to 800 nm. Both at the center of the fovea and at 7° temporally, optimal excitation occurred at 510 nm with peak emission at approximately 630 nm, indicating the predominance of a fluorophore at these excitation and emission spectra. There was a significant increase with age and the recording along a horizontal line through the fovea showed a minimum fluorescence at the fovea, a maximum intensity at 7–15° from the fovea, and a decrease toward the periphery, most likely reflecting the concomitant distribution of macular pigment and melanin interfering with the emission of the dominant fluorophore. The optic disc was characterized by a less intense signal. The relationship with age and the topographic distribution of the dominant fundus fluorophore were consistent with those of RPE LF as measured in the RPE of human donor eyes.3,5
Along with autofluorescence recordings in patients with several pathological conditions, the initial work by Delori et al.1 demonstrated that LF is the dominant source of intrinsic fluorescence of the ocular fundus. However, the small area sampled by the fundus spectrometer as well as the customized relatively complex instrumentation and techniques were not practical for recording fundus autofluorescence from patients in a clinical setting.
Scanning laser ophthalmoscopy
Confocal scanning laser ophthalmoscopy (cSLO) optimally addresses the limitations of the low intensity of the autofluorescence signal and the interference of the crystalline lens. It was used initially by von Rückmann and coworkers in a clinical imaging system.27 The confocal scanning laser ophthalmoscope projects a low-power laser beam on the retina which is swept across the fundus in a raster pattern.28 The intensity of the reflected light at each point, after passing through the confocal pinhole, is registered by means of a detector, and a two-dimensional image is subsequently generated. Confocal optics insure that out-of-focus light (i.e., light originating outside the adjusted focal plane, but within the light beam) is suppressed and, thus, the image contrast is enhanced. This suppression increases with the distance from the focal plane and signals from sources anterior to the retina, i.e., the lens or the cornea, are effectively reduced.
In contrast to the 2° retinal field of the fundus spectrophotometer, the cSLO allows imaging over larger retinal areas. To reduce background noise and to enhance image contrast, a series of several single images is usually recorded (reviewed by Schmitz-Valckenberg et al.2). For the final fundus autofluorescence image, a number of these frames (usually out of 4–32) are averaged and pixel values are normalized. Given the high sensitivity of the cSLO and the high frame rate of up to 16 frames per second, FAF imaging can be performed within seconds and at low excitation energies which are well below the maximum retinal irradiance limits of lasers established by the American National Standards Institute and other international standards.29
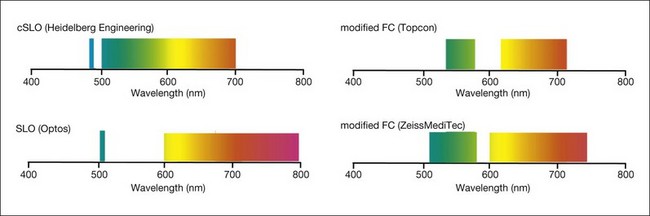
With the cSLO, excitation is usually induced in the blue range (λ = 488 nm), and an emission filter between 500 and 700 nm is used to detect emission of the autofluorescence signal. The most widely used cSLO system for FAF imaging is the Heidelberg retina angiograph/Heidelberg Spectralis. One key advantage of the Spectralis system is the simultaneous acquisition of optical coherence tomography (OCT) recordings that allows for both averaging of several OCT B-scans in order to enhance the signal-to-noise ratio and the synchronous topographic alignment of FAF intensities with OCT findings.30 Other previous systems, such as the Rodenstock cSLO and the Zeiss prototype SM 30 4024 for FAF imaging, are no longer commercially available. Nidek has recently introduced the F-10 cSLO platform that also allows for FAF imaging (Fig. 4.1).
Fundus camera
The relatively weak fundus autofluorescence signal, absorption effects of the crystalline lens, nonconfocality, and light-scattering effects are important limitations of fundus camera-based systems for FAF recordings. Delori and coworkers described a modified fundus camera for FAF imaging.31 Their design included the insertion of an aperture in the illumination optics of the camera in order to minimize the loss of contrast caused by light scattering and fluorescence from the crystalline lens. However, the modification also resulted in the restriction of the field of view to a 13° diameter circle; this, together with the complex design, is the likely reason why this configuration has not been further pursued. In 2003, Spaide32 reported the modification of a commercially available fundus camera system by shifting the excitation and emission wavelengths for fundus autofluorescence imaging towards the red end of the spectrum in order to suppress the fluorescence originating from the lens (Fig. 4.2). The relatively inexpensive purchase of an additional filter set, together with the broad availability of the flash fundus camera, may make thus an attractive alternative. These operate with excitation in the green spectrum and emission is recorded in the yellow-orange spectrum.33
In addition to the different excitation light (green versus blue) for FAF recording, other major technical differences between fundus camera systems and the cSLO setup must be considered (Table 4.1). In particular, the absence of confocal optics makes the fundus camera prone to light scattering and generation of secondary reflectance light that interferes with the FAF detection. The visualization of subtle FAF alterations is challenging with the modified fundus camera, as shown in one study of patients with geographic atrophy (GA) secondary to AMD.34
Table 4.1 Summary of technical differences between the confocal scanning laser ophthalmoscope (cSLO) and the modified fundus camera for fundus autofluorescence imaging
| cSLO | Modified fundus camera |
|---|---|
| One excitation wavelength (laser source) Large emission spectrum (cutoff filter) |
Bandwidth filters for excitation and emission |
| Continuous scanning at low light intensities in a raster pattern | One single flash at maximum intensities |
| Confocal system | Entire cone of light |
| Laser power fixed by manufacturer, detector sensitivity adjustable | Flash light intensity, gain and gamma of detector adjustable |
| Imaging processing with averaging of single frames and pixel normalization | Manual contrast and brightness |
Wide-field imaging
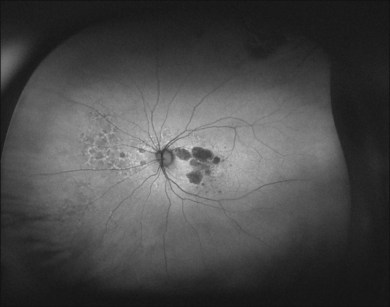
Peripheral FAF images can also be recorded with a recently introduced wide-field scanning laser ophthalmoscope (P200Tx, Optos). This system allows for FAF acquisition in less than 2 seconds by using green light excitation (532 nm). FAF recordings beyond the vascular arcades may be particularly helpful for assessment of the peripheral extension of retinal diseases (Fig. 4.3).
Interpretation of fundus autofluorescence images
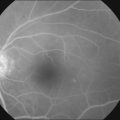
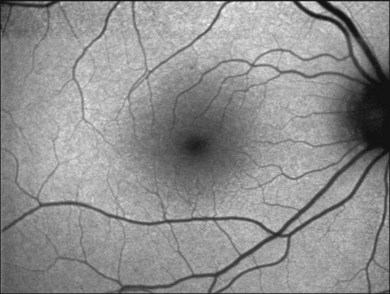
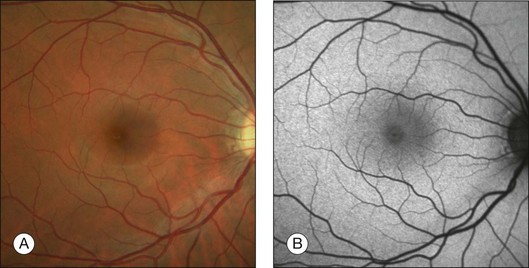
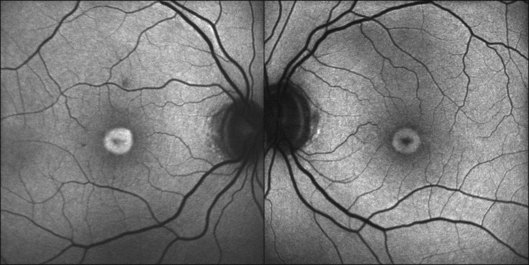
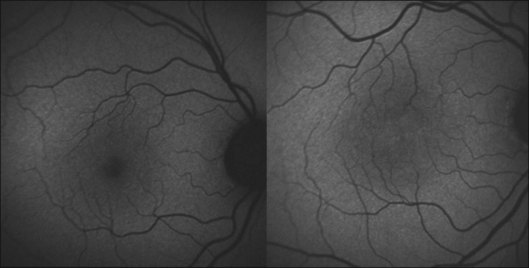
The FAF image shows the spatial distribution of the intensity of the FAF signal for each pixel in gray values (arbitrary values from 0 to 255). Per definition, low pixel values (dark) illustrate low intensities and high pixel values (bright) high intensities, respectively. The topographical distribution of FAF in normal eyes demonstrates a consistent pattern, as illustrated in Fig. 4.4.27 A diffuse FAF signal over the posterior pole can be seen, while retinal vessels (due to an absorption phenomenon by blood contents, i.e., hemoglobin) and the optic nerve head (absence of autofluorescent material) are characterized by a very low signal and appear dark. Showing a high degree of interindividual variability, decreased FAF intensities at the macular area with a minimum in the fovea are observed; these are caused by absorption of short-wavelength light due to luteal pigment (lutein and zeaxanthin).
Using pixel gray values, typical ratios between the intensity of the fovea and perifoveal macula have been established in normal subjects (reviewed by Schmitz-Valckenberg et al.2). Based on these findings, qualitative descriptions of localized FAF changes are widely used. Usually, the FAF signal over a certain retinal location is categorized in decreased, normal, or increased intensities in comparison to the background signal of the same image.
When analyzing absolute intensities on averaged but nonnormalized FAF images (after ensuring that the normalization of the pixel histogram is turned off), a great variability of the mean gray value for a certain retinal location is usually noted when FAF images are subsequently acquired from the same subject directly one after the other using the same imaging device. A systematic analysis by Lois and coworkers35 reported good intraobserver and moderate interobserver reproducibility when comparing the absolute mean pixel value of a 16 × 16 pixel square on the retina. In this report, the image resolution is not provided. When assuming an image resolution of 256 × 256 pixels and a 40° × 30° field (as these settings were published in previous studies using the same cSLO by the same group), the 16 × 16 pixel box would encompass a retinal area of c. 2° × 1.9°. Hence, moderate interobserver reproducibility would just have been achieved over a rather large retinal area, but was not shown for the anatomical resolution of the imaging system.
Several confounding factors have to be taken into account when comparing absolute FAF intensities between different examinations and different individuals. This not only includes standardization of settings (laser power, detector sensitivity, correction of refractive errors, and image-processing steps, including the number of averaged images), but also eye movements, position of the patient in the chin rest, orientation of the camera, distance between the camera and the cornea, fluctuations of laser power, and short-term dynamic changes in FAF intensities caused by prolonged exposure to the excitation light or previous dark adaption (reviewed by Schmitz-Valckenberg et al.2).
Recently, Delori and coworkers introduced a method for quantitative autofluorescence measurements by insertion of an internal FAF reference to account for variable laser power and detector sensitivity.36 Quantified autofluorescence is calculated accounting for the calibrated reference, the zero gray level, and the magnification (refractive error). For retinal degenerations and related diseases, this approach may enhance the understanding of disease processes, and may serve as a diagnostic aid, as a more sensitive marker of natural disease progression, and as a tool to monitor the effects of therapeutic interventions targeting LF accumulations.
Clinical applications
Age-related macular degeneration
Early AMD
Early manifestation of AMD include focal hypo- and hyperpigmentation at the level of the RPE as well as drusen with extracellular material accumulating in the inner aspects of Bruch’s membrane.37 Drusen may be distinguished based on size (small versus large) and morphology (hard versus soft). Postmortem analyses demonstrated that some molecular species in drusen material possess autofluorescent properties.
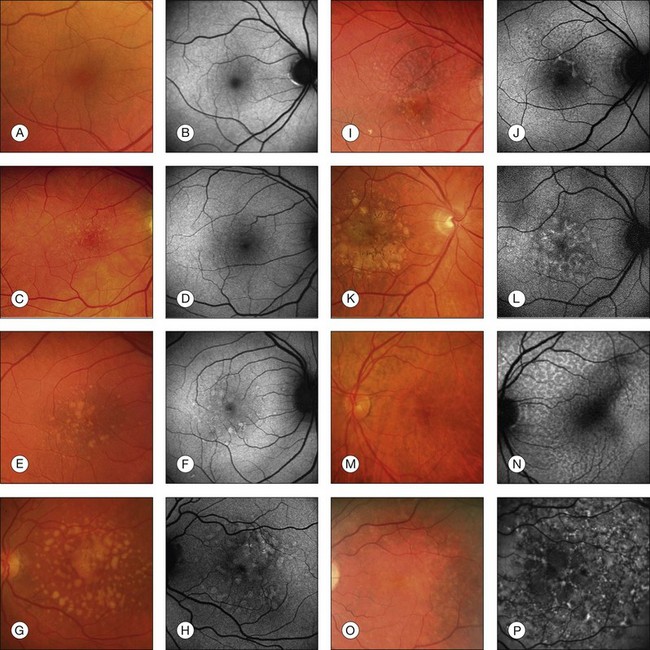
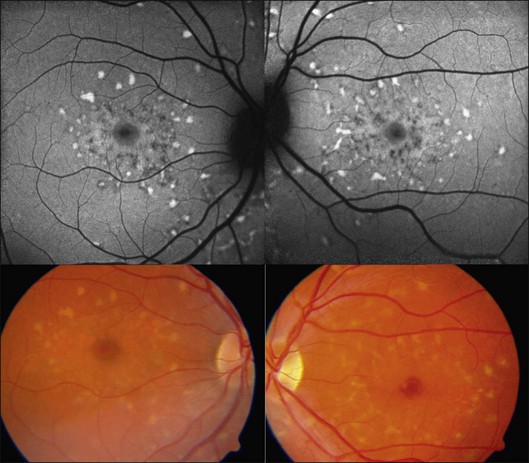
In vivo FAF changes in early AMD have been described by several authors using the cSLO and the fundus camera, respectively (reviewed by Schmitz-Valckenberg et al.2). Interestingly, drusen visible on fundus photography are not necessarily correlated with notable FAF changes and areas of increased FAF may or may not correspond with areas of hyperpigmentation or soft or hard drusen (Fig. 4.5). Overall, larger drusen are more frequently associated with notable FAF abnormalities than smaller ones, with the exception of basal laminar drusen. Crystalline drusen typically demonstrate a corresponding decreased FAF signal.
Delori and coworkers described a pattern of FAF distribution associated with drusen which consists of decreased FAF in the center of the druse with a surrounding annulus of increased FAF.31 It has been speculated that this appearance is caused by attenuated RPE at the center and tangential orientation of RPE cells at the edges of the druse. A reduced turnover and a net increase in the amount of LF of the RPE cells at the edges would lead to the increased signal. Interestingly, this ring-like appearance of drusen with FAF imaging is much more pronounced when imaged with a flash fundus camera. Several authors have consistently reported that confluent drusen and large foveal soft drusen (drusenoid RPE detachments) topographically correspond well with mildly increased FAF using cSLO.38–40 With a fundus camera-based system, large soft drusen have a slightly decreased FAF signal at their centers and are surrounded by a faint ring of increased signal. Multiple foci and/or irregular areas of FAF are observed when several small hard or soft drusen coalesce. Focal areas of increased FAF are typically found in the vicinity of drusen with overlying areas of pigment-clumping or adjacent to long-standing and crystalline drusen.
So-called reticular pseudodrusen have been identified as a risk factor for the development of late-stage AMD. In patients with GA this specific phenotypic pattern, which is best recognizable by infrared reflectance and FAF imaging, can be detected in over 60% of eyes with GA.41 The precise morphological correlate of this distinct pattern is controversial. Speculations range from abnormalities in the inner choroid42 to subretinal deposits43; the latter speculation is based on the spectral domain (SD)-OCT changes recorded in the presence of reticular pseudodrusen.30,43,44
The spectrum of FAF findings in patients with early AMD was classified by an international expert group.40 Pooling data from several retinal centers, a system with eight different FAF patterns was developed, including normal, minimal change, focal increased, patchy, linear, lace-like, reticular, and speckled pattern (Fig. 4.5). This classification demonstrates the relatively poor correlation between visible alterations on fundus photography and notable FAF changes. Based on these results, it was speculated that FAF findings in early AMD may indicate more widespread abnormalities and a greater extent of disease than is ophthalmoscopically visible. The changes seen in FAF imaging at the RPE cell level may precede the occurrence of visible lesions as the disease progresses. This classification system may help to identify specific high-risk characteristics for disease progression and may be of value in future interventional trials. Furthermore, it may be of use in molecular genetic analysis to identify one or several genes conferring risk for the development of certain AMD manifestations.
Recent approaches to investigate FAF findings in AMD patients have included the use of image analysis software to compare pixel values and topographically map and register alterations visible on FAF images with fundus photographs or reflectance images.32,38 Differences in the percentage of areas with focally increased FAF intensity between eyes with various AMD manifestations have been reported. One study reported that the fellow eyes of patients with unilateral exudative AMD in the other eye tended not to exhibit FAF abnormalities. Another analysis showed that patients with exudative AMD in one eye had larger amounts of areas with abnormal autofluorescence in the fellow eye than did eyes of patients with early disease and without a history of exudative AMD. Unfortunately, because of differences in imaging devices and the use of different image analysis protocols, comparisons between these studies are difficult and further investigation is required (reviewed by Schmitz-Valckenberg et al.2).
Geographic atrophy
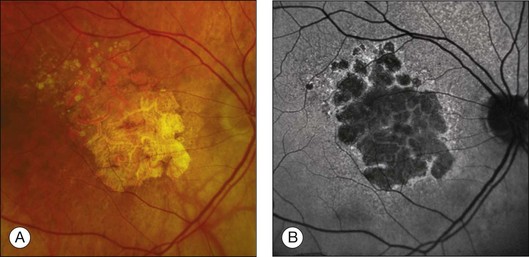
Areas of GA are associated with RPE cell death as well as with loss or attenuation of adjacent layers, in particular the outer neurosensory retina and the choriocapillaris. 45 With disappearance of the RPE, LF is also lost, resulting in a corresponding marked decrease in FAF intensity (Figs 4.6 and 4.7).27 Compared to drusen which may also exhibit a decreased FAF signal, atrophic areas typically show an even more profound reduction of FAF. 31 The high-contrast difference between atrophic and nonatrophic regions of retina allows more easy and reliable delineation of the area of atrophy than from conventional fundus photographs. 46 These advantages of documenting and studying GA by FAF imaging have been used in many natural history studies47,48 (Figs 4.6 and 4.7).
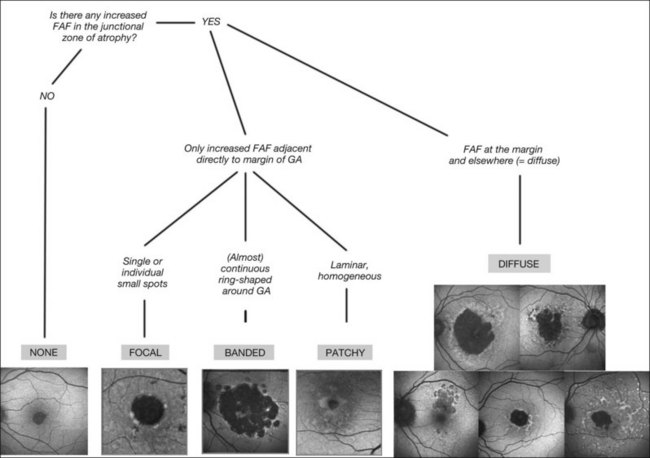
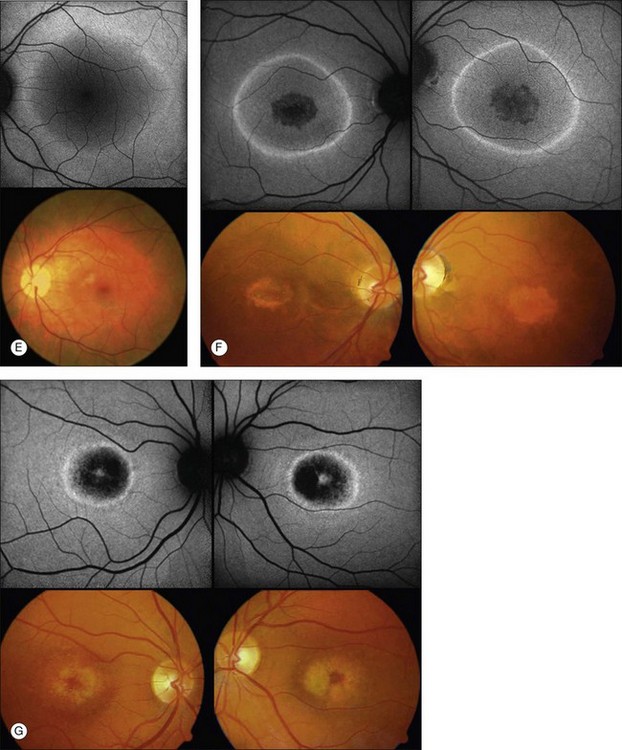
An even more striking finding of FAF imaging in GA patients is the frequent presence of areas of hyperautoflourescence in the junctional zone surrounding the patch of atrophy.49 Distinct patterns of abnormal FAF in the junctional zone of atrophy and a high degree of intraindividual symmetry between fellow eyes have been described (Fig. 4.8).50,51
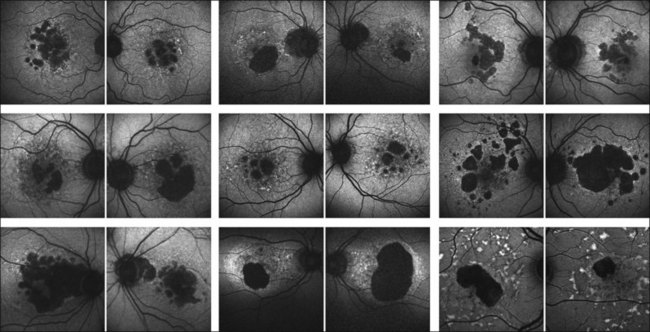
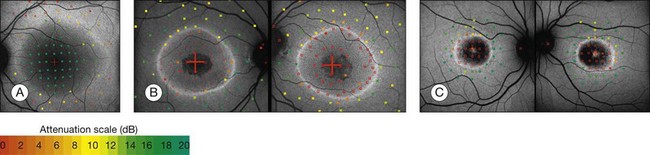
Recently, a classification system of FAF patterns in the junctional zone of atrophy in GA patients has been proposed (Fig. 4.9).52 Studies of retinal sensitivity have underscored the importance of increased FAF surrounding areas of GA and, thus, the pathophysiological role of increased RPE LF accumulation in such patients. Scholl and coworkers have demonstrated that rod photoreceptor function is more severely affected than cone function over areas with increased FAF using fine matrix mapping.53 Combining SLO microperimetry and FAF imaging in another study, impaired photopic sensitivity has been observed in areas of abnormal FAF in the junctional zone54.
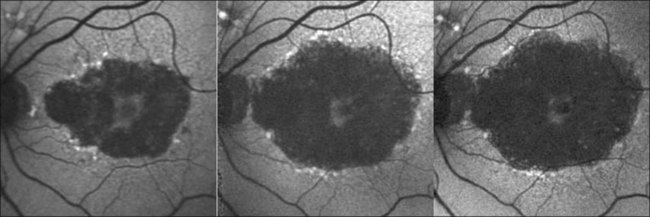
Outer retinal atrophy in the context of AMD is a dynamic process with gradual enlargement of atrophic areas over time. Initial natural history studies on atrophy progression in GA patients using FAF imaging demonstrated the occurrence of new atrophic patches and the spread of pre-existing atrophy in areas with abnormally high levels of FAF at baseline.49 Looking at larger patient groups with longer review periods, the significance of increased junctional FAF for foreshadowing atrophy enlargement has been highlighted.47,48 In accordance with other natural history studies, the FAM (Fundus Autofluorescence Imaging in Age-related Macular Degeneration) study identified a large variability in the rate of atrophy enlargement between patients, which was neither explained by the extent of baseline atrophy nor by any other comorbid factor such as smoking, lens status, or family history. Interestingly, the initial studies using FAF imaging on patients with GA have already reported various patterns of changes in FAF in the junctional zone of GA (reviewed by Schmitz-Valckenberg et al.2). These investigators speculated that their observations might reflect heterogeneity of the underlying disease process. In addition, Bellmann and coworkers reported a high degree of symmetry of abnormal FAF patterns in patients with bilateral GA in the presence of a high degree of interindividual variability, suggesting that genetic determinants rather than nonspecific aging changes may be involved. 50
A more recent analysis of the FAM study of 195 eyes of 129 patients shows that variable rates of progression of GA are dependent on the specific phenotype of abnormal FAF pattern at baseline.48 Atrophy enlargement was the slowest in eyes with no abnormal FAF pattern (median 0.38 mm2/year), followed by eyes with the focal FAF pattern (median 0.81 mm2/year), then by eyes with the diffuse FAF pattern (median 1.77 mm2/year), and finally, by eyes with the banded FAF pattern (1.81 mm2/year). The difference in atrophy progression between the groups of no abnormal and focal FAF patterns and the groups of the diffuse and banded FAF patterns was statistically significant (P < 0.0001). These results have subsequently been confirmed in another large-scale study (the Natural History of Geographic Atrophy Progression (GAP) study).55,56 These findings underscore the importance of abnormal FAF intensities around atrophy and the pathophysiological role of increased RPE LF accumulation in patients with GA due to AMD.
Pigment epithelium detachment
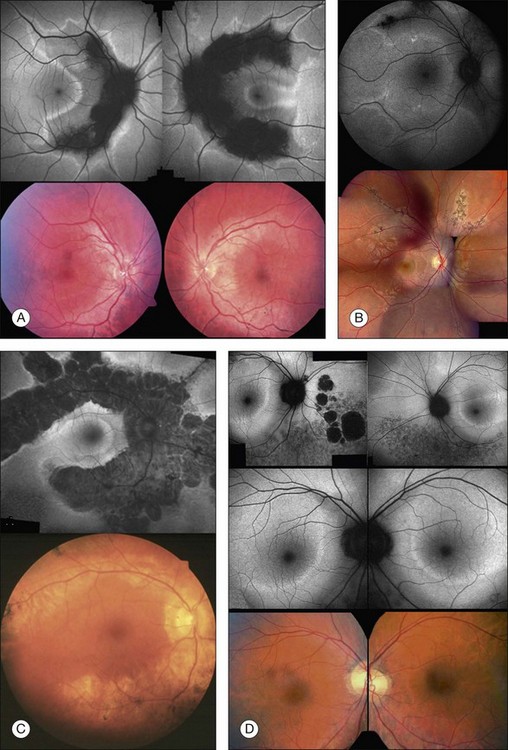
FAF imaging in eyes with pigment epithelium detachment (PED) secondary to AMD show variable FAF phenotypes which are not always detectable using conventional imaging techniques such as fundus photography, fluorescein, or indocyanine green angiography (Fig. 4.10). The majority of PEDs show a corresponding marked, evenly distributed increase of the FAF signal over the lesion surrounded by a well-defined, less autofluorescent halo delineating the entire border of the lesion. There are also PEDs with an intermediate or a decreased FAF signal over the lesion which may or may not correspond to areas of RPE atrophy or fibrovascular scarring. Additional investigation, however, is necessary to categorize fully the FAF features of PEDs and to correlate these findings with other imaging studies. Rarely, a PED shows a cartwheel pattern of increased autofluorescence corresponding with hyperpigmented radial lines. The hyperpigmented lines correlate with subretinal hyperreflective structures, as demonstrated by OCT.
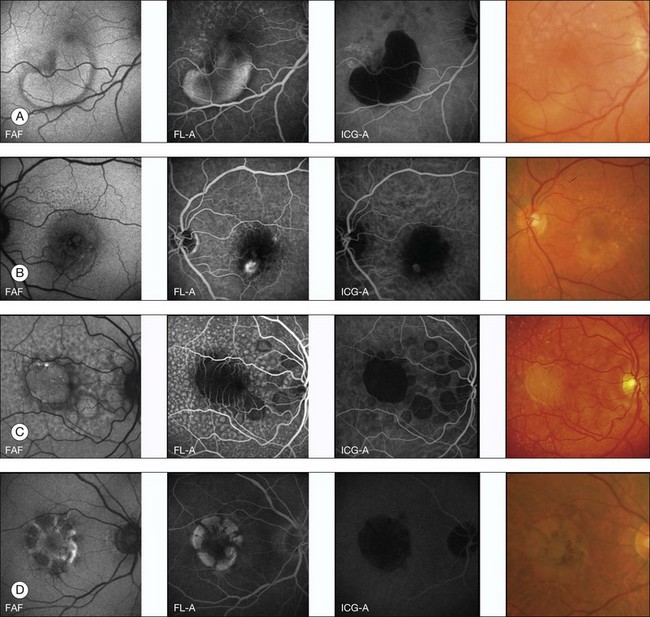
However, a systematic analysis of these FAF alterations with correlation to the underlying causes of PED such as choroidal neovascularization (CNV), retinal angiomatous proliferation, polypoidal vasculopathy, or serous, nonexudative PED is lacking to date. These changes are probably not only caused by increased or decreased amounts of LF, but may derive from other dominant fluorophores with similar excitation and emission spectra, such as extracellular fluid or degraded photoreceptors (Fig. 4.10).
Choroidal neovascularization
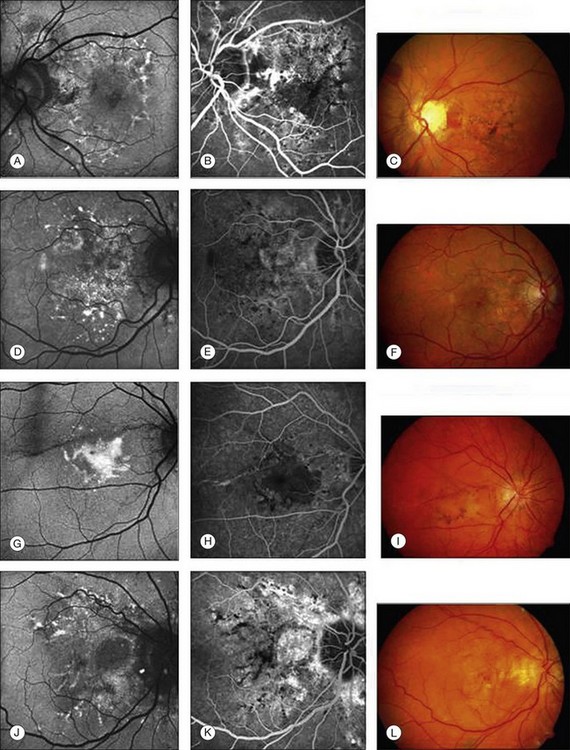
Patients with early CNV secondary to AMD tend to have patches of “continuous” or “normal” autofluorescence corresponding with areas of hyperfluorescence on the corresponding fluorescein angiograms, implying that RPE viability is preserved at least initially in CNV development (Fig. 4.11).57 By contrast, eyes with long-standing CNV typically exhibit more areas of decreased FAF signal, which could be explained by photoreceptor loss and scar formation with increased melanin deposition (Fig. 4.11).
One other important finding in eyes with CNV is that abnormal FAF intensities typically extend beyond the edge of the angiographically defined lesion, indicating a more widespread involvement than is apparent from conventional imaging studies. Increased FAF signal has also been described around the edge of lesions. It has been speculated that this observation may reflect the proliferation of RPE cells around the CNV.58 As in other exudative retinal disease, such as central serous chorioretinopathy, areas with increased FAF adjacent to CNV are commonly found inferior to the leakage on fluorescein angiography, most likely representing gravitational effects of fluid tracking. In contrast to fluid, hemorrhages and intraretinal exudates typically show a decreased FAF signal because of light absorption obscuring the underlying retinal details. When retinal hemorrhages undergo organization and evolve into an ocher color on fundoscopy, they may become intensely autofluorescent. Later, with disappearance of the yellowish material seen on biomicroscopy, a large RPE scar and atrophy with decreased autofluorescence may be visible.59 Other imaging studies, such as fundus photography, are often required to differentiate between hemorrhages, exudates, and RPE atrophy.
Comparing FAF findings with the classification of occult and classic CNV based on fluorescein angiography, Spital et al.59a reported that focal areas of decreased FAF are more prevalent in classic CNV in comparison to larger occult CNVs. McBain and associates confirmed this finding and speculated that typical decreased FAF signals at the site of the CNV are related to absorption phenomena caused by the CNV growing in the subretinal space, rather than being related to severe damage to the RPE. 58 These observations would be in accordance with histopathological studies which have shown that classic CNV membranes are composed of predominantly subretinal fibrovascular changes as opposed to most occult lesions, which remain external to the RPE. However, a more recent study could not demonstrate any significant difference in FAF alterations between occult and classic CNVs secondary to AMD.57 A continuous pattern of preserved autofluorescence in the central macula was observed in most patients and this was correlated with better visual acuity, shorter symptom length, and smaller lesion size. These observations would suggest that the new vessel complex, regardless of whether classic or occult, was either external (sclerad) to the RPE or had little impact on the attenuation of the FAF signal.
Recently, Heimes and coworkers analyzed the prognostic value of RPE autofluorescence with respect to the therapeutic outcome of anti-vascular endothelial growth factor therapy in exudative AMD.60 The analysis of 95 eyes showed a significant difference in visual acuity outcomes in eyes with changes in FAF within the central 500 and 1000 µm.
In patients with advanced atrophic AMD, the role of surrounding areas with increased FAF signal with regard to the development and progression of exudative AMD remains unclear, and large patient cohorts with longitudinal follow-up are still lacking. In a secondary analysis of one study of four eyes,58 no abnormal FAF changes were observed prior to development of CNV at the site or in the vicinity where the membrane later developed. Looking at 125 eyes with soft drusen and no history of laser treatment, a longitudinal analysis (mean follow-up 18 months) within the FAM study disclosed nine eyes which developed advanced exudative AMD during the follow-up period.61 Six of these nine eyes exhibited the so-called patchy FAF pattern at baseline, characterized by a homogeneous broad zone of increased FAF intensity. This finding, if confirmed in other studies, would suggest that the “patchy” FAF pattern in early AMD may represent a high-risk marker for progression to advanced AMD.
Macular and diffuse retinal dystrophies
In macular and diffuse retinal dystrophies, various associated abnormalities in FAF have been described (reviewed by von Rückmann et al.62). In areas of atrophy, the FAF signal is typically markedly decreased due to loss of the RPE and consequently a lack of autofluorescent LF. It is well established that autofluorescent material excessively accumulates in the RPE in association with various genetically determined retinal diseases. Increased FAF due to excessive LF accumulation in RPE cells may result from abnormally high turnover of photoreceptor outer segments or impaired RPE lysosomal degradation of normal or altered phagocytosed molecular substrates.
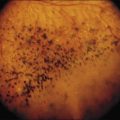
The fundoscopically visible pale/yellowish lesions at the level of RPE/Bruch’s membrane in Best macular dystrophy (Fig. 4.12), adult vitelliform macular dystrophy (Fig. 4.13), and other pattern dystrophies, as well as Stargardt macular dystrophy/fundus flavimaculatus (Fig. 4.14), are associated with an intense focally increased FAF signal.
Lorenz and coworkers63 described absent or minimal FAF intensities in patients with early-onset severe retinal dystrophy associated with mutations on both alleles of RPE65. The lack or severe decrease of FAF signal would be consistent with the biochemical defect and could be used as a clinical marker of this genotype. Another study demonstrated that patients with Leber congenital amaurosis having vision reduced to light perception and undetectable electroretinograms (ERGs) may still exhibit normal or minimally decreased FAF intensities.64 This suggests that the RPE–photoreceptor complex is, at least in part, functionally and anatomically intact. This finding would have implications for future treatment, suggesting that photoreceptor function may still be rescuable in such patients.
Discrete, well-defined lines of increased FAF may occur in various forms of retinal dystrophies.65–67 These lines have no prominent correlate on fundus biomicroscopy, although there is evidence that these lines precisely reflect the border of the regions of retinal dysfunction.65,67,68 Despite the variable orientation of this line in different entities, e.g., orientation along the retinal veins in pigmented paravenous chorioretinal atrophy (PPCRA) or as a ring-like structure in retinitis pigmentosa (RP) or macular dystrophies (Fig. 4.15), the similar appearance on FAF images and the concordance of functional findings indicate that these lines in heterogeneous diseases share a common underlying pathophysiological mechanism.67
In RP it could be demonstrated that patients with a larger-diameter FAF ring also had larger preserved central visual fields.65 Furthermore, Robson et al. firstly showed a high correlation between the pattern ERG P50 amplitude – a valuable indicator of macula function – and the size of the abnormal ring. Later, they could demonstrate by fine matrix mapping that photopic sensitivity was preserved over the central macular areas, but there was a gradient of sensitivity loss over high-density segments of the ring and severe threshold elevation outside the arc of the ring. Scotopic sensitivity losses were more severe, and they encroached on areas within the ring.65
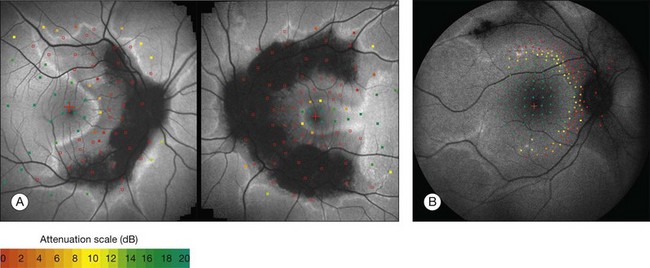
Popovic et al.68 confirmed by fundus perimetry, among other methods, that retinal sensitivity was preserved within the ring and was lost outside the ring, regardless of whether the FAF pattern was normal or whether atrophic lesions of the RPE were already present or not. Figure 4.16A shows fundus perimetry in a patient with autosomal dominant RP.
It has been concluded that the ring of increased FAF in RP demarcates areas of preserved central photopic function and that constriction of the ring may mirror progressive visual field loss by advancing dysfunction that encroaches over areas of central macular.65
Functional assessment in CRD, CD (cone dystrophy), and macular dystrophies exhibiting a parafoveal ring of increased FAF revealed inverted results compared to RP: Robson et al. could demonstrate that the pattern ERG P50 amplitude was inversely related to the size of the FAF ring; by fine matrix mapping they revealed a gradient of sensitivity loss across the arc of increased FAF.65
By fundus perimetry, in patients with macular dystrophy (Fig. 4.16), it could be demonstrated, that within the ring – independent of a normal or abnormal FAF signal – there was severe retinal dysfunction.67 Outside the ring, the FAF signal and retinal sensitivity were almost normal.
Despite a different orientation of the line in PPCRA, fundus perimetry revealed that photoreceptor dysfunction exceeded the area of RPE cell loss and was precisely delineated (Fig. 4.17). In the central retina and in the periphery that was not circumscribed by the FAF signal line, the FAF signal was normal and photoreceptor sensitivity was preserved. Within the area outlined by increased FAF, independently of whether a normal or abnormal FAF signal was present, there was severe photoreceptor impairment. Despite the variable orientation and morphology of the line, these observations reflect the findings in RP and CD whereby the ring or line of increased FAF represented the border between functional and dysfunctional retinal sensitivity.
Fleckenstein and coworkers69 first described the SD-OCT correlate of these lines of increased FAF. Specifically, these corresponded with a discrete junctional zone between an area with preserved OCT layers and an area where the outer aspects of the retina are lost and the external limiting membrane band appeared to rest directly on the RPE (Figs 4.18 and 4.19).
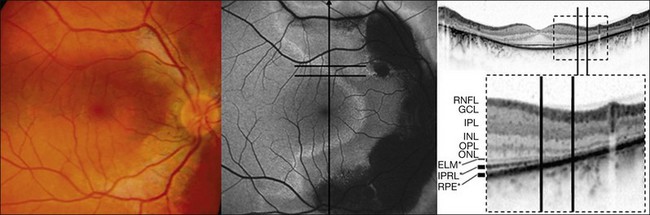
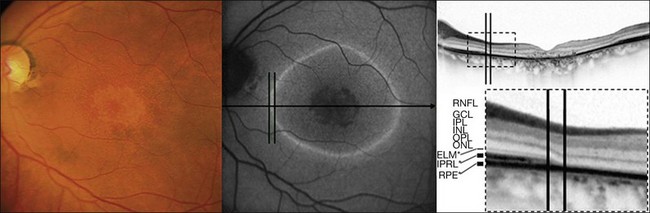
More recently, the same SD-OCT correlate has been demonstrated in patients with RP.70 This junction might be characterized by progressively altered photoreceptor outer and inner segments. While the pathophysiological mechanism is unknown, it may be hypothesized that the increased FAF signal observed in various retinal dystrophies might result from an increased metabolic burden of corresponding RPE cells and subsequent excessive accumulation of fluorophores in the lysosomal compartment due to phagocytosis of components of severely altered photoreceptors in such junctional zones. Changes in absorbtion of the FAF signal due to loss of photoreceptor outer segments may also contribute to this phenomenon. In the zone with a normal FAF signal but impaired retinal sensitivity, the structure of the photoreceptors seems to be severely distorted. A normal FAF signal, therefore, does not necessarily reflect an intact photoreceptor–RPE complex, but may rather correspond to a structurally intact-appearing RPE cell monolayer with or without the presence of intact photoreceptors.
Macular telangiectasia
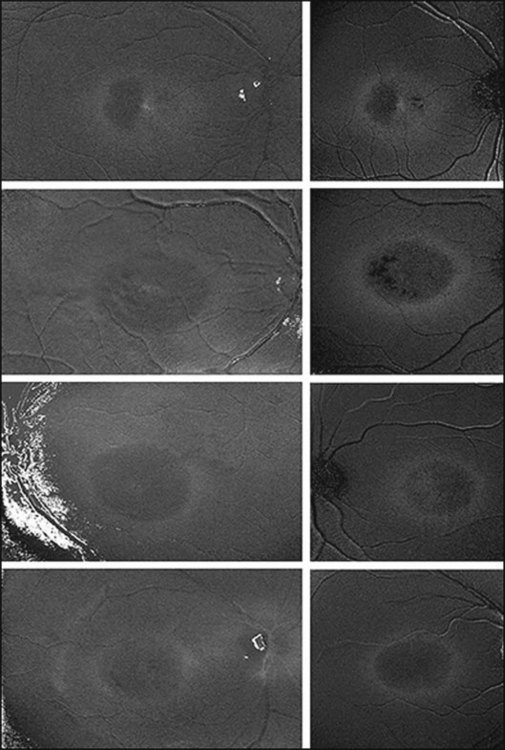
Macular telangiectasia (MacTel) type 2 is a bilateral disease of unknown cause with characteristic alterations of the macular capillary network and progressive retinal cell death (see Chapter 55, MacTel/parafoveal telangiectasia).71–73 The disease typically manifests temporal to the fovea, and may later encompass an oval-shaped area centered on the foveola.
As outlined above, normal eyes show masking of the foveal 488-nm blue-light FAF due to the accumulation of luteal pigment. Reduced macular pigment density in MacTel type 2 affects this masking. Eyes with MacTel type 2 show an abnormally increased signal in the macular area to a variable degree with blue-light FAF imaging (Figs 4.20 and 4.21). 74 A loss of luteal pigment may initially occur in the area temporal to the foveal center (Fig. 4.22).74,75 Quantitative analysis confirmed that the loss of luteal pigment was more pronounced in the temporal compared with the nasal parafoveolar area and suggested that zeaxanthin would be more reduced than lutein.75
Further proof for the depletion in macular pigment derived from a postmortem analysis of an eye with MacTel type 2. Macroscopic examination disclosed the absence of the central yellowish spot.76 A yellow ring of residual macular pigment was present eccentrically in accordance with the in vivo imaging observations. The loss of macular pigment was subsequently divided into three classes based on a cross-sectional analysis of two-wavelength (blue-light and green-light) FAF images77: Class 1 shows a wedge-shaped loss of macular pigment restricted to an area temporal to the foveal center. In class 2, the area is larger and also involves the foveal center. Class 3 is characterized by loss of luteal pigment within an oval-shaped area centered on the foveola. There was a significant association of these three classes of macular pigment loss with the consecutive disease stages of MacTel type 2 described by Gass and Blodi.71 Correlation studies with microperimetric data revealed a trend towards worse retinal function with increasing class of macular pigment changes.
Pseudoxanthoma elasticum
Pseudoxanthoma elasticum (PXE) is caused by a mutation in the ABCC6 gene. More than 300 distinct loss-of-function mutations representative of over 1000 mutant alleles in ABCC6 have been found. Many of the missense mutations occur at locations in the protein involving domain–domain interactions in the ABCC6 transporter. Even heterozygotes can show manifestations of disease. FAF abnormalities are common in eyes affected by PXE. Typical phenotypic alterations, including angioid streak, and drusen of the optic nerve, have autofluorescence correlates. Peau d’orange is hardly detectable on FAF, whereas comet-tail lesions are typically apparent. RPE atrophy can be widespread and heterogeneous, located mostly adjacent to angioid streaks or CNV.78,79
Furthermore, irregular patterns of increased FAF at the posterior pole with an appearance similar to that of pattern dystrophies can be found in eyes with PXE. In these eyes, areas of yellowish deposits and hyperpigmentation on color photography corresponded to areas of increased FAF (Fig. 4.23). Agarwal et al.80 suggested the following classification: a fundus appearance similar to a pattern dystrophy of the fundus flavimaculatus, the reticular, the vitelliform and the fundus pulverulentus types, respectively. The pattern dystrophy-like changes in PXE may occur unilaterally or bilaterally.
Recently, the abnormalities detected by multimodal imaging suggest a centrifugal spread of the retinal pathologic features of the Bruch’s membrane–RPE complex in PXE. These results suggest that three different areas centered on the posterior pole can be defined in the fundus of patients with PXE. These areas are separated by two consecutive transition zones. The central two areas may indicate different stages of pathologic fundus alterations.81
Central serous chorioretinopathy
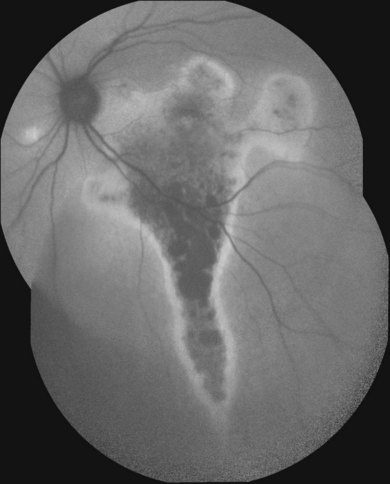
Central serous chorioretinopathy is a condition characterized by idiopathic leaks at the level of the RPE leading to serous pigment epithelial and neurosensory retinal detachments. In the early phases of the disease, the visual acuity may be good despite the presence of the macular detachment, and after resolution the acuity often shows improvement. More chronic forms of central serous chorioretinopathy are associated with atrophic and degenerative changes of the retina and RPE and consequently with visual acuity decline.82
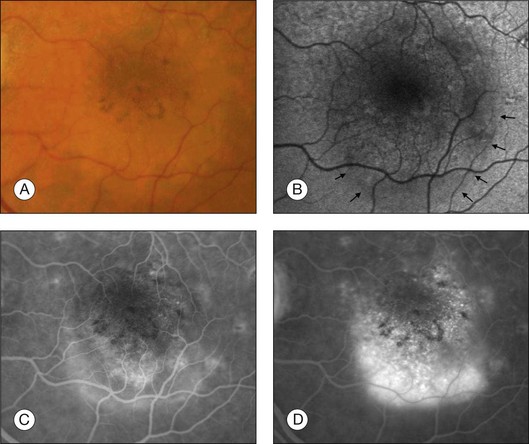
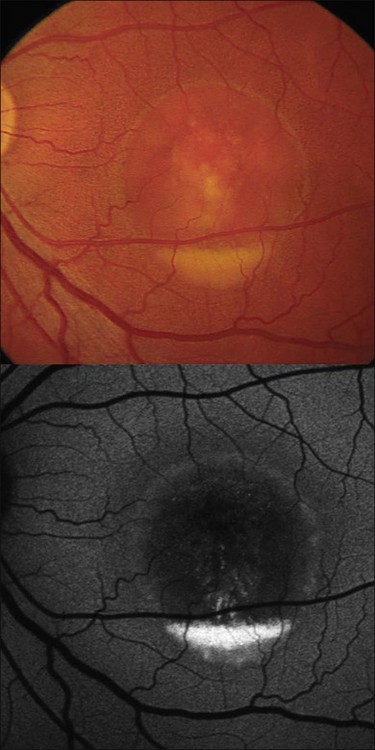
Accordingly, FAF findings in central serous chorioretinopathy are dependent on the extent of involvement of the RPE and the stage of the disease.83 Patients with acute leaks imaged within the first month have minimal abnormalities other than a slight increase in autofluorescence in the area of the serous retinal detachment. Over time, the area of the detachment increasingly exhibits more irregular increased autofluorescence. In some patients, discrete granules with increased intensity within the detachment are observed which correspond with the pinpoint subretinal precipitates seen on fundoscopy. It has been suggested that these dots may represent macrophages engorged with phagocytosed outer segments. Patients with chronic disease have irregular levels of autofluorescence with markedly decreased intensity over areas of atrophy. A typical finding also includes the visualization of fluid tracks in the inferior retina (Fig. 4.24). The area of the leak also undergoes change in autofluorescence over time. Soon after the development of central serous chorioretinopathy, little or no change in the autofluorescence pattern in the area around the leak is seen, although the leak site may be somewhat hypoautofluorescent. Patients with more chronic leaks can have decreased autofluorescence surrounding the known leaks. This area of hypoautofluorescence appears to expand in size with increasing chronicity of the leak. Patients who were known to have a history of chronic central serous chorioretinopathy that had been inactive for several years are left with hypoautofluorescent areas and no hyperautofluorescent regions.
Chloroquine and hydroxychloroquine retinopathy
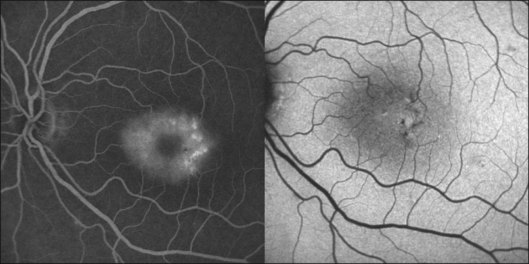
FAF imaging may show distinct alterations due to toxic retinal effects of long-term chloroquine and hydroxychloroquine therapy.84 Various methods have been proposed to detect early stages of chloroquine retinopathy. Early on, a pericentral ring of increased FAF intensity may occur associated with pericentral reduction in multifocal ERG amplitudes and pericentral interruption of the photoreceptor inner-segment–outer-segment junction on SD-OCT imaging.85 More advanced stages are associated with a more mottled appearance with increased and decreased FAF intensity in the pericentral macula (Fig. 4.25). While electrophysiological examination has been thought to represent an adequate tool to diagnose early chloroquine maculopathy, FAF imaging can be used as a highly sensitive tool.

Functional correlates of FAF abnormalities
The relevance of alterations in FAF images can further be addressed by assessing corresponding retinal sensitivity. Severe damage to the RPE such as atrophy, melanin pigment migration, or fibrosis leading to compromised photoreceptor function as confirmed by microperimetry to correspond topographically to areas of decreased autofluorescence.53,54 In patients with GA secondary to AMD, it has been shown that, in addition to absence of retinal sensitivity over atrophic areas, retinal function is relatively and significantly reduced over areas with increased FAF intensities compared to areas with normal background signal.54 Localized functional impairment over areas with increased FAF has also been recently confirmed in patients with early AMD. Using fine matrix mapping, it has been demonstrated that, interestingly, rod function is more severely affected than cone function over areas with increased FAF in patients with AMD.53 These studies are in accordance with the observation of increased accumulation of autofluorescent material at the level of the RPE prior to the occurrence of cell death. As normal photoreceptor function is dependent on normal RPE function, in particular with regard to the constant phagocytosis of shed distal outer-segment stacks for photoreceptor cell renewal, a negative-feedback mechanism has been proposed, whereby cells with LF-loaded secondary lysosomes would less efficiently phagocytose newly shed photoreceptor outer segments, subsequently leading to impaired retinal sensitivity. This would also be in line with experimental data showing that compounds of LF such as A2-E possess toxic properties and may interfere with normal RPE cell function.10
In patients with different retinal dystrophies, lines and rings of increased FAF have been noted (see above).65 Interestingly, functional testing by microperimetry and electrophysiology indicates that these rings circumscribe areas of preserved photoreceptor function (Fig. 4.16A).65,67,68
1 Delori FC, Dorey CK, Staurenghi G, et al. In vivo fluorescence of the ocular fundus exhibits retinal pigment epithelium lipofuscin characteristics. Invest Ophthalmol Vis Sci. 1995;36:718–729.
2 Schmitz-Valckenberg S, Fleckenstein M, Scholl HP, et al. Fundus autofluorescence and progression of age-related macular degeneration. Surv Ophthalmol. 2009;54:96–117.
3 Weiter JJ, Delori FC, Wing GL, et al. Retinal pigment epithelial lipofuscin and melanin and choroidal melanin in human eyes. Invest Ophthalmol Vis Sci. 1986;27:145–152.
4 Feeney-Burns L, Berman ER, Rothmann H. Lipofuscin of human retinal pigment epithelium. Am J Ophthalmol. 1980;90:783–791.
5 Wing GL, Blanchard GC, Weiter JJ. The topography and age relationship of lipofuscin concentration in the retinal pigment epithelium. Invest Ophthalmol Vis Sci. 1978;17:601–607.
6 Sparrow JR, Boulton M. RPE lipofuscin and its role in retinal pathobiology. Exp Eye Res. 2005;80:595–606.
7 Eldred GE, Lasky MR. Retinal age-pigments generated by self-assembling lysosomotrophic detergents. Nature. 1993;361:724–726.
8 Dorey CK, Wu G, Ebenstein D, et al. Cell loss in the aging retina. Relationship to lipofuscin accumulation and macular degeneration. Invest Ophthalmol Vis Sci. 1989;30:1691–1699.
9 Schütt F, Davies S, Kopitz J, et al. Photodamage to human RPE cells by A2-E, a retinoid component of lipofuscin. Invest Ophthalmol Vis Sci. 2000;41:2303–2308.
10 Bergmann M, Schutt F, Holz FG, et al. Inhibition of the ATP-driven proton pump in RPE lysosomes by the major lipofuscin fluorophore A2-E may contribute to the pathogenesis of age-related macular degeneration. FASEB J. 2004;18:562–564.
11 Brunk UT, Wihlmark U, Wrigstad A, et al. Accumulation of lipofuscin within retinal pigment epithelial cells results in enhanced sensitivity to photo-oxidation. Gerontology. 1995;41(Suppl 2):201–212.
12 Hammer M, Richter S, Guehrs KH, et al. Retinal pigment epithelium cell damage by A2-E and its photo-derivatives. Mol Vis. 2006;12:1348–1354.
13 Liu J, Itagaki Y, Ben-Shabat S, et al. The biosynthesis of A2E, a fluorophore of aging retina, involves the formation of the precursor, A2-PE, in the photoreceptor outer segment membrane. J Biol Chem. 2000;275:29354–29360.
14 Eldred GE, Katz ML. Fluorophores of the human retinal pigment epithelium: separation and spectral characterization. Exp Eye Res. 1988;47:71–86.
15 Zhou J, Jang YP, Kim SR, et al. Complement activation by photooxidation products of A2E, a lipofuscin constituent of the retinal pigment epithelium. Proc Natl Acad Sci U S A. 2006;103:16182–16187.
16 Lamb LE, Simon JD. A2E: a component of ocular lipofuscin. Photochem Photobiol. 2004;79:127–136.
17 Marmorstein AD, Marmorstein LY, Sakaguchi H, et al. Spectral profiling of autofluorescence associated with lipofuscin, Bruch’s membrane, and sub-RPE deposits in normal and AMD eyes. Invest Ophthalmol Vis Sci. 2002;43:2435–2441.
18 Keilhauer CN, Delori FC. Near-infrared autofluorescence imaging of the fundus: visualization of ocular melanin. Invest Ophthalmol Vis Sci. 2006;47:3556–3564.
19 Weinberger AW, Lappas A, Kirschkamp T, et al. Fundus near infrared fluorescence correlates with fundus near infrared reflectance. Invest Ophthalmol Vis Sci. 2006;47:3098–3108.
20 Kellner U, Kellner S, Weinitz S. Fundus autofluorescence (488 nm) and near-infrared autofluorescence (787 nm) visualize different retinal pigment epithelium alterations in patients with age-related macular degeneration. Retina. 2010;30:6–15.
21 Gibbs D, Cideciyan AV, Jacobson SG, et al. Retinal pigment epithelium defects in humans and mice with mutations in MYO7A: imaging melanosome-specific autofluorescence. Invest Ophthalmol Vis Sci. 2009;50:4386–4393.
22 Schmitz-Valckenberg S, Lara D, Nizari S, et al. Localisation and significance of in vivo near-infrared autofluorescent signal in retinal imaging. Br J Ophthalmol. 2011;95:1134–1139.
23 Snodderly DM, Brown PK, Delori FC, et al. The macular pigment. I. Absorbance spectra, localization, and discrimination from other yellow pigments in primate retinas. Invest Ophthalmol Vis Sci. 1984;25:660–673.
24 Whitehead AJ, Mares JA, Danis RP. Macular pigment: a review of current knowledge. Arch Ophthalmol. 2006;124:1038–1045.
25 Davies NP, Morland AB. Macular pigments: their characteristics and putative role. Prog Retin Eye Res. 2004;23:533–559.
26 Wolf S, Wolf-Schnurrbusch U. Macular pigment measurement – theoretical background. In: Holz FG, Schmitz-Valckenberg S, Spaide RF, et al. Atlas of autofluorescence imaging. Berlin: Springer, 2007.
27 von Rückmann A, Fitzke FW, Bird AC. Distribution of fundus autofluorescence with a scanning laser ophthalmoscope. Br J Ophthalmol. 1995;79:407–412.
28 Webb RH, Hughes GW, Delori FC. Confocal scanning laser ophthalmoscope. Appl Optics. 1987;26:1492–1499.
29 American National Standard for the Safe Use of Lasers Z136.1; 1993.
30 Fleckenstein M, Charbel Issa P, Helb HM, et al. High-resolution spectral domain-OCT imaging in geographic atrophy associated with age-related macular degeneration. Invest Ophthalmol Vis Sci. 2008;49:4137–4144.
31 Delori FC, Fleckner MR, Goger DG, et al. Autofluorescence distribution associated with drusen in age-related macular degeneration. Invest Ophthalmol Vis Sci. 2000;41:496–504.
32 Spaide RF. Fundus autofluorescence and age-related macular degeneration. Ophthalmology. 2003;110:392–399.
33 Spaide RF. Autofluorescence Imaging with the fundus camera. In: Holz FG, Schmitz-Valckenberg S, Spaide RF, et al. Atlas of autofluorescence imaging. Berlin: Springer; 2007:49–53.
34 Schmitz-Valckenberg S, Fleckenstein M, Gobel AP, et al. Evaluation of autofluorescence imaging with the scanning laser ophthalmoscope and the fundus camera in age-related geographic atrophy. Am J Ophthalmol. 2008;146:183–192.
35 Lois N, Halfyard AS, Bunce C, et al. Reproducibility of fundus autofluorescence measurements obtained using a confocal scanning laser ophthalmoscope. Br J Ophthalmol. 1999;83:276–279.
36 Delori F, Greenberg JP, Woods RL, et al. Quantitative measurements of autofluorescence with the scanning laser ophthalmoscope. Invest Ophthalmol Vis Sci. 2011;52:9379–9390.
37 Bird A. Age-related macular disease. Br J Ophthalmol. 1996;80:2–3.
38 Smith RT, Chan JK, Busuoic M, et al. Autofluorescence characteristics of early, atrophic, and high-risk fellow eyes in age-related macular degeneration. Invest Ophthalmol Vis Sci. 2006;47:5495–5504.
39 Lois N, Owens SL, Coco R, et al. Fundus autofluorescence in patients with age-related macular degeneration and high risk of visual loss. Am J Ophthalmol. 2002;133:341–349.
40 Bindewald A, Bird AC, Dandekar SS, et al. Classification of fundus autofluorescence patterns in early age-related macular disease. Invest Ophthalmol Vis Sci. 2005;46:3309–3314.
41 Schmitz-Valckenberg S, Alten F, Steinberg JS, et al. Reticular drusen associated with geographic atrophy in age-related macular degeneration. Invest Ophthalmol Vis Sci. 2011;52:5009–5015.
42 Arnold JJ, Sarks SH, Killingsworth MC, et al. Reticular pseudodrusen. A risk factor in age-related maculopathy. Retina. 1995;15:183–191.
43 Zweifel SA, Spaide RF, Curcio CA, et al. Reticular pseudodrusen are subretinal drusenoid deposits. Ophthalmology. 2010;117:303–312. e1
44 Schmitz-Valckenberg S, Steinberg JS, Fleckenstein M, et al. Combined confocal scanning laser ophthalmoscopy and spectral-domain optical coherence tomography imaging of reticular drusen associated with age-related macular degeneration. Ophthalmology. 2010;117:1169–1176.
45 Sarks SH. Ageing and degeneration in the macular region: a clinico-pathological study. Br J Ophthalmol. 1976;60:324–341.
46 Schmitz-Valckenberg S, Jorzik J, Unnebrink K, et al. Analysis of digital scanning laser ophthalmoscopy fundus autofluorescence images of geographic atrophy in advanced age-related macular degeneration. Graefes Arch Clin Exp Ophthalmol. 2002;240:73–78.
47 Schmitz-Valckenberg S, Bindewald-Wittich A, Dolar-Szczasny J, et al. Correlation between the area of increased autofluorescence surrounding geographic atrophy and disease progression in patients with AMD. Invest Ophthalmol Vis Sci. 2006;47:2648–2654.
48 Holz FG, Bindewald-Wittich A, Fleckenstein M, et al. Progression of geographic atrophy and impact of fundus autofluorescence patterns in age-related macular degeneration. Am J Ophthalmol. 2007;143:463–472.
49 Holz FG, Bellman C, Staudt S, et al. Fundus autofluorescence and development of geographic atrophy in age-related macular degeneration. Invest Ophthalmol Vis Sci. 2001;42:1051–1056.
50 Bellmann C, Jorzik J, Spital G, et al. Symmetry of bilateral lesions in geographic atrophy in patients with age-related macular degeneration. Arch Ophthalmol. 2002;120:579–584.
51 Holz FG, Bellmann C, Margaritidis M, et al. Patterns of increased in vivo fundus autofluorescence in the junctional zone of geographic atrophy of the retinal pigment epithelium associated with age-related macular degeneration. Graefes Arch Clin Exp Ophthalmol. 1999;237:145–152.
52 Bindewald A, Schmitz-Valckenberg S, Jorzik JJ, et al. Classification of abnormal fundus autofluorescence patterns in the junctional zone of geographic atrophy in patients with age related macular degeneration. Br J Ophthalmol. 2005;89:874–878.
53 Scholl HP, Bellmann C, Dandekar SS, et al. Photopic and scotopic fine matrix mapping of retinal areas of increased fundus autofluorescence in patients with age-related maculopathy. Invest Ophthalmol Vis Sci. 2004;45:574–583.
54 Schmitz-Valckenberg S, Bultmann S, Dreyhaupt J, et al. Fundus autofluorescence and fundus perimetry in the junctional zone of geographic atrophy in patients with age-related macular degeneration. Invest Ophthalmol Vis Sci. 2004;45:4470–4476.
55 Schmitz-Valckenberg S, Jaffe GJ, Fleckenstein M, et al. and GAP Study Group. Lesion characteristics and progression in the Natural History of Geographic Atrophy (GAP) Study. ARVO Meeting Abstracts. 2009;50:3914.
56 Holz FG, Schmitz-Valckenberg S, Fleckenstein M, et al. Lesion characteristics and progression in the Natural History of Geographic Atrophy (GAP) Study. ARVO Meeting Abstracts. 2010;51:94.
57 Vaclavik V, Vujosevic S, Dandekar SS, et al. Autofluorescence imaging in age-related macular degeneration complicated by choroidal neovascularization: a prospective study. Ophthalmology. 2008;115:342–346.
58 McBain VA, Townend J, Lois N. Fundus autofluorescence in exudative age-related macular degeneration. Br J Ophthalmol. 2007;91:491–496.
59 Sawa M, Ober MD, Spaide RF. Autofluorescence and retinal pigment epithelial atrophy after subretinal hemorrhage. Retina. 2006;26:119–120.
59a Spital G, Redermacher M, Müller C, et al. [Autofluorescence characteristics of lipofuscin components in different forms of late senile macular degeneration.]. Klin Monabl Augenheilkd. 1998;213:23–31.
60 Heimes B, Lommatzsch A, Zeimer M, et al. Foveal RPE autofluorescence as a prognostic factor for anti-VEGF therapy in exudative AMD. Graefes Arch Clin Exp Ophthalmol. 2008;246:1229–1234.
61 Einbock W, Moessner A, Schnurrbusch UE, et al. Changes in fundus autofluorescence in patients with age-related maculopathy. Correlation to visual function: a prospective study. Graefes Arch Clin Exp Ophthalmol. 2005;243:300–305.
62 von Rückmann A, Fitzke F, Schmitz-Valckenberg S, et al. Macular and retinal dystrophies. In: Holz FG, Schmitz-Valckenberg S, Spaide R, et al. Atlas of fundus and fluorescence imaging. Berlin: Springer, 2007.
63 Lorenz B, Wabbels B, Wegscheider E, et al. Lack of fundus autofluorescence to 488 nanometers from childhood on in patients with early-onset severe retinal dystrophy associated with mutations in RPE65. Ophthalmology. 2004;111:1585–1594.
64 Scholl HP, Chong NH, Robson AG, et al. Fundus autofluorescence in patients with leber congenital amaurosis. Invest Ophthalmol Vis Sci. 2004;45:2747–2752.
65 Robson AG, Michaelides M, Saihan Z, et al. Functional characteristics of patients with retinal dystrophy that manifest abnormal parafoveal annuli of high density fundus autofluorescence; a review and update. Doc Ophthalmol. 2008;116:79–89.
66 von Ruckmann A, Fitzke FW, Bird AC. In vivo fundus autofluorescence in macular dystrophies. Arch Ophthalmol. 1997;115:609–615.
67 Fleckenstein M, Charbel Issa P, Fuchs HA, et al. Discrete arcs of increased fundus autofluorescence in retinal dystrophies and functional correlate on microperimetry. Eye (Lond). 2009;23:567–575.
68 Popovic P, Jarc-Vidmar M, Hawlina M. Abnormal fundus autofluorescence in relation to retinal function in patients with retinitis pigmentosa. Graefes Arch Clin Exp Ophthalmol. 2005;243:1018–1027.
69 Fleckenstein M, Charbel Issa P, Helb HM, et al. Correlation of lines of increased autofluorescence in macular dystrophy and pigmented paravenous retinochoroidal atrophy by optical coherence tomography. Arch Ophthalmol. 2008;126:1461–1463.
70 Lima LH, Cella W, Greenstein VC, et al. Structural assessment of hyperautofluorescent ring in patients with retinitis pigmentosa. Retina. 2009;29:1025–1031.
71 Gass JD, Blodi BA. Idiopathic juxtafoveolar retinal telangiectasis. Update of classification and follow-up study. Ophthalmology. 1993;100:1536–1546.
72 Hutton WL, Snyder WB, Fuller D, et al. Focal parafoveal retinal telangiectasis. Arch Ophthalmol. 1978;96:1362–1367.
73 Gass JDM. Stereoscopic atlas of macular diseases: diagnosis and treatment, 2nd ed. St Louis: Mosby; 1977.
74 Helb HM, Charbel Issa P, van der Veen RL, et al. Abnormal macular pigment distribution in type 2 idiopathic macular telangiectasia. Retina. 2008;28:808–816.
75 Charbel Issa P, van der Veen RL, Stijfs A, et al. Quantification of reduced macular pigment optical density in the central retina in macular telangiectasia type 2. Exp Eye Res. 2009;89:25–31.
76 Powner MB, Gillies MC, Tretiach M, et al. Perifoveal muller cell depletion in a case of macular telangiectasia type 2. Ophthalmology. 2010;117:2407–2416.
77 Zeimer MB, Padge B, Heimes B, et al. Idiopathic macular telangiectasia type 2: distribution of macular pigment and functional investigations. Retina. 2010;30:586–595.
78 Charbel Issa P, Finger RP, Holz FG, et al. Multimodal imaging including spectral domain OCT and confocal near infrared reflectance for characterisation of outer retinal pathology in pseudoxanthoma elasticum. Invest Ophthalmol Vis Sci. 2009;50:5913–5918.
79 Finger RP, Charbel Issa P, Ladewig M, et al. Fundus autofluorescence in pseudoxanthoma elasticum. Retina. 2009;29:1496–1505.
80 Agarwal A, Patel P, Adkins T, et al. Spectrum of pattern dystrophy in pseudoxanthoma elasticum. Arch Ophthalmol. 2005;123:923–928.
81 Charbel Issa P, Finger RP, Gotting C, et al. Centrifugal fundus abnormalities in pseudoxanthoma elasticum. Ophthalmology. 2010;117:1406–1414.
82 Spaide RF, Campeas L, Haas A, et al. Central serous chorioretinopathy in younger and older adults. Ophthalmology. 1996;103:2070–2079. discussion 9-80
83 Spaide RF, Klancnik JM, Jr. Fundus autofluorescence and central serous chorioretinopathy. Ophthalmology. 2005;112:825–833.
84 Kellner U, Renner AB, Tillack H. Fundus autofluorescence and mfERG for early detection of retinal alterations in patients using chloroquine/hydroxychloroquine. Invest Ophthalmol Vis Sci. 2006;47:3531–3538.
85 Kellner S, Weinitz S, Kellner U. Spectral domain optical coherence tomography detects early stages of chloroquine retinopathy similar to multifocal electroretinography, fundus autofluorescence and near-infrared autofluorescence. Br J Ophthalmol. 2009;93:1444–1447.