Astrocytic neoplasms
DIFFUSE ASTROCYTIC NEOPLASMS – ASTROCYTOMA, ANAPLASTIC ASTROCYTOMA, GLIOBLASTOMA
GENETICS, MALIGNANT PROGRESSION, AND GRADING OF ASTROCYTIC NEOPLASMS
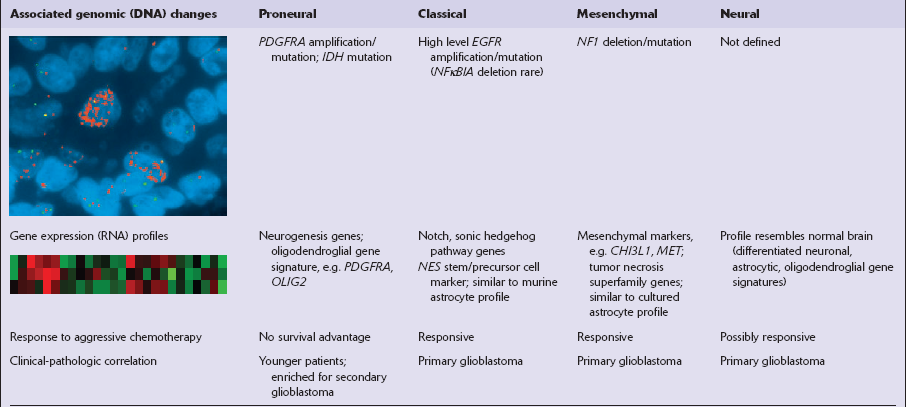
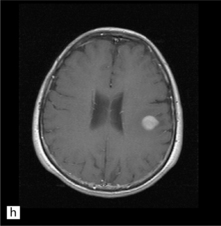
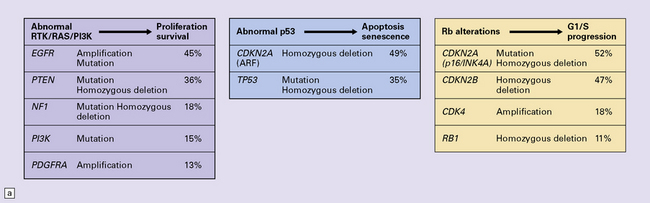
One important characteristic of the astrocytoma is its propensity for anaplastic transformation; 50–75% (in different series) of diffuse astrocytomas progress to anaplastic astrocytomas or, ultimately, glioblastomas. Time to anaplastic transformation is highly variable, often 3–5 years but occasionally 10 years. Neoplastic progression is associated with the sequential acquisition of multiple genetic abnormalities (Fig. 35.1). The origin of astrocytic neoplasms may include neural stem cells, progenitor cells, or differentiated glial cells. Isocitrate dehydrogenase (IDH1, IDH2) and TP53 gene mutations are considered to be early events in neoplastic progression. In contrast, allelic loss on chromosome 10 occurs predominantly in glioblastomas. Molecular genetic studies have revealed differences between glioblastomas that evolve over years from low grade astrocytomas (secondary) and those that arise de novo (primary) (Table 35.1, Fig. 35.2). In particular, EGFR overexpression is common in primary glioblastoma, while IDH1 mutations are common in secondary glioblastoma. The vast majority of glioblastomas are primary or de novo, rather than secondary in nature. Radiologic images may provide clues to the grade and type of astrocytic neoplasm (Fig. 35.3). Evidence from comprehensive analyses of molecular genetic abnormalities in primary glioblastomas suggests that a defect in at least one of three pathways controlling cell proliferation, survival, and apoptosis is crucial and common to their tumorigenesis (Fig. 35.4), but a majority of these primary glioblastomas show aberrations in all three pathways. More recently, there has been a growing understanding of epigenetic changes that modulate gene expression, but do not alter the DNA sequence itself, and how they can also affect tumor prognosis and response to therapy (Fig. 35.5). In addition, ongoing work suggests that global assessments of RNA transcription patterns can further sub-classify glioblastomas into prognostically significant groups that will likely be important for development of molecular-guided therapies (Table 35.2).
Table 35.1
Genetic characteristics of primary and secondary glioblastoma (GBM)
| Primary GBM | Secondary GBM | |
| EGFR overexpression | >60% | <10% |
| MDM2 overexpression | >50% | <10% |
| PTEN gene mutation | >30% | <10% |
| TP53 gene mutation present | <10% | >60% |
| Loss of chromosome 19q | <10% | >50% |
| RB1 promoter hypermethylation | <15% | >40% |
| IDH1/IDH2 mutation | <4% | >80% |
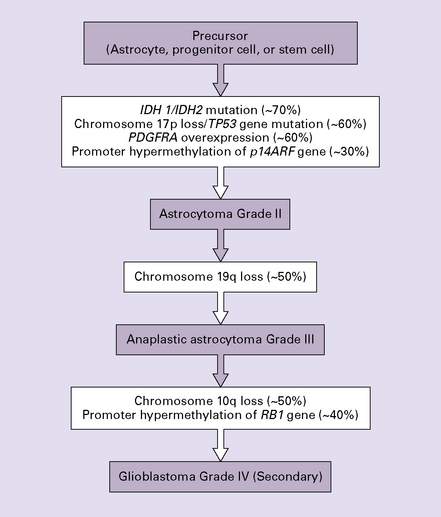
35.1 Acquisition of common genetic abnormalities through the range of diffuse astrocytic neoplasms.
IDH, isocitrate dehydrogenase; PDGFRA, platelet-derived growth factor, receptor A alpha polypeptide; RB1, retinoblastoma 1.
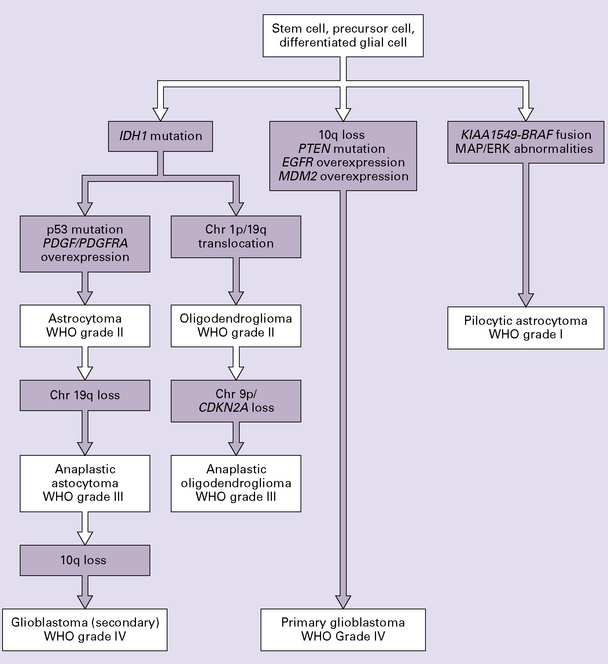
35.2 Genetic pathways to formation of gliomas.
Primary and secondary glioblastomas have different genetic pathways. Pilocytic astrocytomas are genetically distinct from the infiltrating astrocytomas. Oligodendrogliomas share the IDH1 mutation with other low grade astrocytomas but are distinguished by a high frequency of the chromosomes 1p/19q translocation. Chr, chromosome.
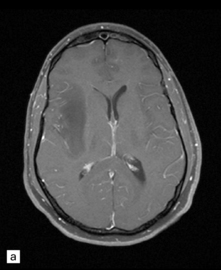
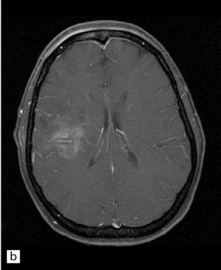
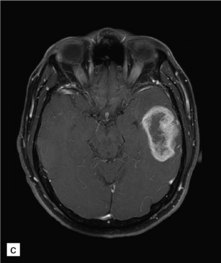
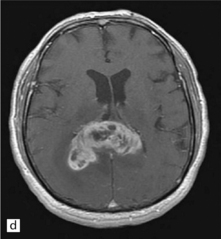
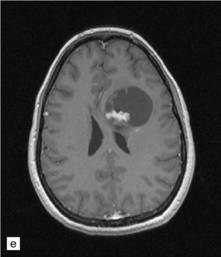
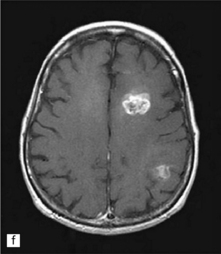
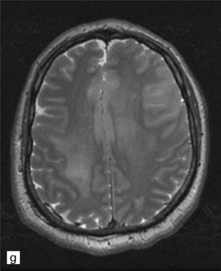
35.3 Common radiologic presentations of glial neoplasms.
(a) A low grade astrocytoma (WHO grade II) or other low grade infiltrating glioma often presents as a non-enhancing ill-defined lesion. A minority of non-enhancing tumors may be anaplastic in nature. (b) An enhancing, poorly defined glial neoplasm is most often an anaplastic astrocytoma, other anaplastic glioma, or glioblastoma. (c) A ring-enhancing lesion should prompt strong consideration for a glioblastoma. Abscesses and high grade non-glial malignancies can produce a similar pattern. (d) Astrocytic neoplasms not infrequently enter or cross the corpus callosum sometimes creating a ‘butterfly glioma’ pattern. (e) A cystic mass with an enhancing mural nodule is typical of ganglioglioma and pleomorphic xanthoastrocytoma (often in the temporal lobe) and of hemangioblastoma or pilocytic astrocytoma (often in the cerebellum). (f) While multicentric lesions may reflect metastases, lymphoma, or non-neoplastic lesions, gliomas occasionally can be multifocal as in this example. (g) Diffuse involvement of large areas rather than a distinct mass suggests gliomatosis cerebri. (h) While a solidly enhancing nodular mass may be seen with glioblastoma, a variety of low grade and high grade lesions may show this relatively non-specific pattern. Malignant lymphoma, as in this case, metastatic malignancies, pilocytic astrocytoma, and ganglioglioma may be solidly enhancing and circumscribed as well. (Courtesy of Dr A Lai, UCLA Medical Center, USA.)
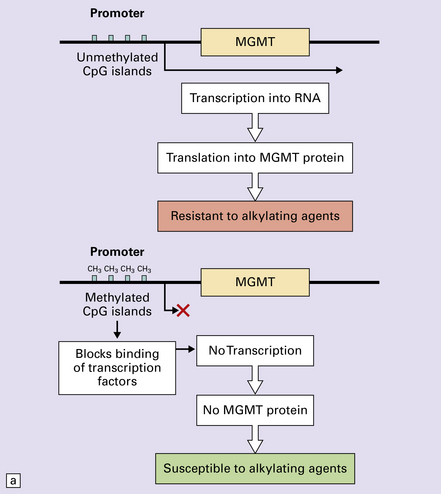
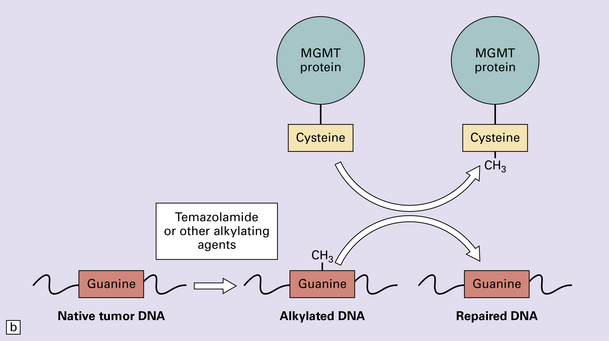
35.5 Promoter methylation of O6-methylguanine-DNA methyltransferase (MGMT).
(a) Promoter methylation shuts down gene expression of MGMT which is important for DNA repair. (b) Transfer of an alkyl group (CH3) from the O6 position of methylguanine to a cysteine residue on the MGMT protein ‘uses up’ the protein – hence the appellation, ‘suicide enzyme’. The amounts of MGMT protein within a tumor cell are crucial in repairing DNA damage and allowing the cell to avoid a G:C to A:T transition mutation that could result in deleterious or lethal mutations.
 STEM CELLS AND GLIOMAS
 Cancer stem cells (CSCs) are enriched in perivascular and perinecrotic/hypoxic ‘niches’ that provide the appropriate microenvironment for maintenance or propagation.
 CSCs are chemoresistant and radioresistant, providing a nidus for tumor regrowth.
 CSCs can also drive angiogenesis, invasion, and metastasis.


 Neural stem cells are located in the subventricular zone and dentate gyrus.
 Gliomas may arise from neural stem cells or progenitor cells.
 Genetic and epigenetic changes result in glioma formation and progression.

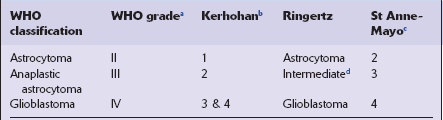
Historically, several grading systems have been applied to diffuse astrocytic neoplasms (Table 35.3). These use histologic parameters to separate the range of astrocytic neoplasms into three or four tiers, providing some indication of biologic behavior. Although there are some differences in the applied parameters, there is a broad correspondence between the systems and WHO nomenclature. Use of the WHO nomenclature is preferred (Table 35.4), because ambiguity may occur when the grading system is not specified; for example, the term ‘grade 2’ has different implications for treatment and prognosis in the WHO and Kernohan systems. In addition, there is no evidence to suggest that other grading systems offer any advantage over WHO nomenclature. Various clinical, pathologic, and genetic variables, including histopathologic diagnosis, are prognostic indicators in astrocytic neoplasms (Table 35.5).
Table 35.3
aGrade 1 neoplasms are pilocytic astrocytomas.
bGrade 1 neoplasms include pilocytic astrocytomas.
Table 35.4
WHO grading for diffuse astrocytomas
| Astrocytoma WHO grade II | Atypia but no mitosesa |
| Anaplastic astrocytoma WHO grade III | Atypia and mitoses |
| Glioblastoma WHO grade IV | Atypia, mitoses, vascular proliferationb and/or necrosis |
aA rare mitosis in an otherwise typical low grade astrocytoma does not require elevation to grade III.
bVascular proliferation is defined as ‘endothelial’ proliferation 2 cell layers or more. The term ‘endothelial’ is used loosely as smooth muscle markers are expressed in the hyperplastic vascular wall. This may mimic glomeruli; so-called ‘glomeruloid’ vascular proliferation.
Table 35.5
Prognostic indicators in diffuse astrocytic neoplasms
Age (young age – favorable)
Karnofsky performance score (high score – favorable)
Macroscopic surgical resection (gross resection – favorable)
Histological grade (low WHO grade – favorable)
MGMT methylation status (presence – favorable)
IDH1/IDH2 mutation status (presence – favorable)
Proneural gene expression profile (presence – favorable)
 DIFFUSE ASTROCYTOMAS


 ISOCITRATE DEHYDROGENASE (IDH) AND GLIOMAS
 The vast predominance of mutations affect residue 132 in exon 4 of IDH1.
 IDH1 mutation is associated with better prognosis.
 IDH1 mutation is not predictive of response to temozolomide or radiotherapy.
 Mutation of an homologous IDH2 gene has a similar effect on prognosis.

 IDH1/2 mutation is common in secondary glioblastoma, but rare in primary glioblastoma.


 Patients with L-2 hydroxyglutaric aciduria are prone to developing gliomas.


 O6-METHYLGUANINE-DNA METHYLTRANSFERASE (MGMT) METHYLATION


ASTROCYTOMA
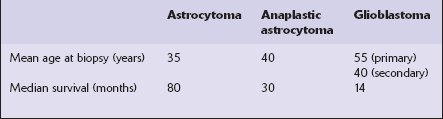
Generally, presenting in the third or fourth decade (Table 35.6), diffuse astrocytomas are divided into fibrillary, protoplasmic, and gemistocytic variants. The fibrillary astrocytoma is encountered most frequently. This variant may contain scattered cells with a gemistocytic phenotype, which by convention (WHO classification) constitute >20% of cells in the gemistocytic astrocytoma. The protoplasmic astrocytoma is very rare; some pathologists believe that it is not a distinct variant, but represents a phenotype present in other gliomas.
MACROSCOPIC APPEARANCES
Cerebral astrocytomas diffusely expand the white matter, sometimes distorting the overlying gray matter (Fig. 35.6). Radiologically, low grade astrocytomas are generally non-enhancing (Fig. 35.3a). Cortical or subcortical invasion plus associated edema produce expansion of gyri.
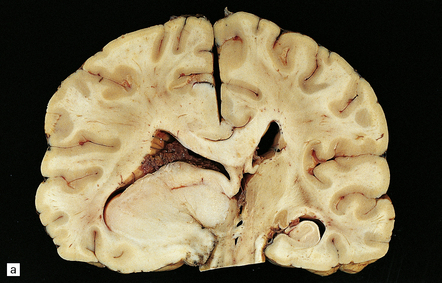
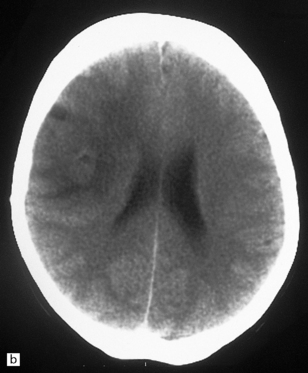
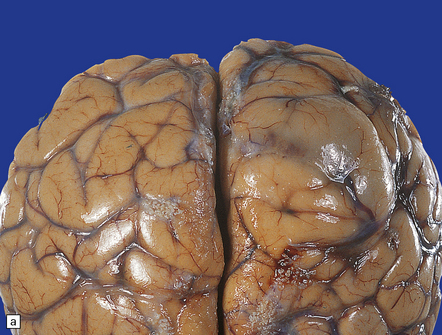
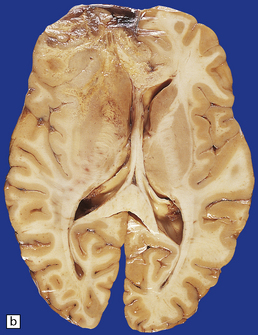
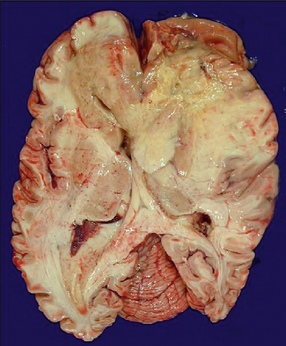
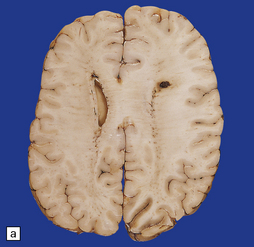
35.6 Astrocytoma.
(a) An astrocytoma diffusely invades the cerebrum producing distortion and expansion of normal structures. The neoplasm produces midline shift and is poorly demarcated. (b) CT scan. A poorly defined mass in the right frontal lobe has lower density than the surrounding cerebrum and has produced midline shift. (Courtesy of Dr J S Millar, Wessex Neurological Center, UK.)
 EPIGENETIC MODIFICATIONS IN GLIOBLASTOMA
 Hypermethylation of DNA. Transcription of specific genes is shut down, resulting in loss of protein product and impacting genes and pathways potentially regulating proliferation, apoptosis, migration, and invasion. RB, PTEN, TP53, and CDKN2/Ap16 are examples of tumor suppressor genes that are hypermethylated in some glioblastomas. Hypermethylation of the MGMT promoter is associated with better survival. A particular pattern of methylation called the glioma-CpG island methylator phenotype (G-CIMP) is strongly associated with a proneural gene expression phenotype as well as IDH1 mutation.


 GLIOMA-CPG ISLAND METHYLATOR PHENOTYPE (GCIMP)
 Specific cancer-related genes are believed to be methylated in a coordinated fashion, in contrast to random or stochastic global methylation.
 GCIMP predicts improved prognosis in glioblastoma patients.


 GCIMP is present in over 90% of oligodendrogliomas compared with 45% of astrocytomas.
 GCIMP is strongly associated with a ‘proneural’ gene expression profile.
MICROSCOPIC APPEARANCES
Cytologically, neoplastic cells in diffuse astrocytomas show mild atypia, particularly nuclear pleomorphism and hyperchromasia (Fig. 35.7). The cells of fibrillary astrocytomas may appear as bare nuclei, their tenuous fibrillary processes blending with the brain’s parenchyma. Alternatively, they show varying degrees of astrocytic differentiation, exhibiting prominent fibrillary strands of eosinophilic cytoplasm, or a plump cell body in which the nucleus is displaced by homogeneously eosinophilic cytoplasm, the gemistocytic phenotype (Fig. 35.8).
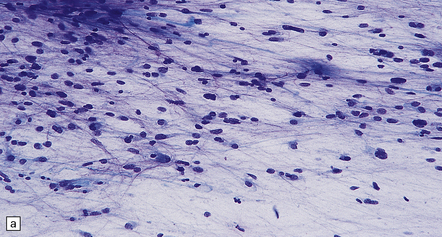
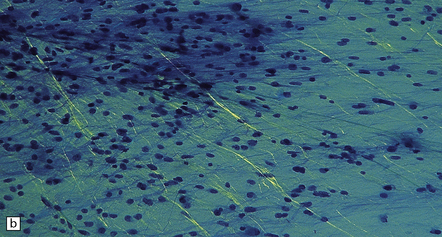
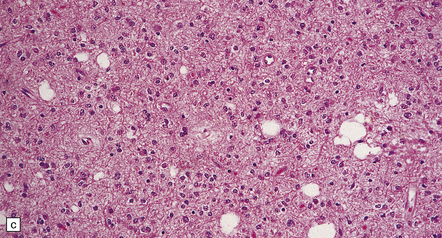
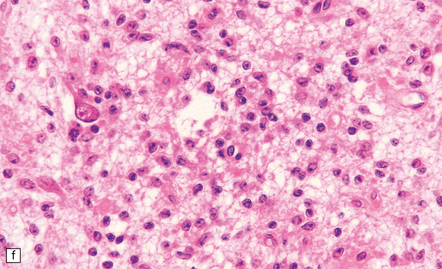
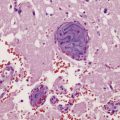
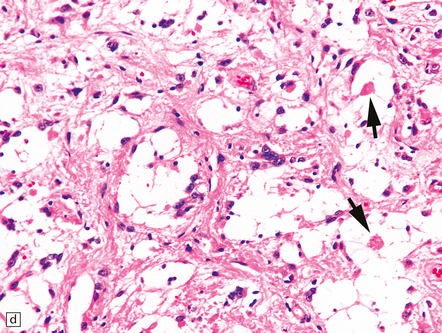
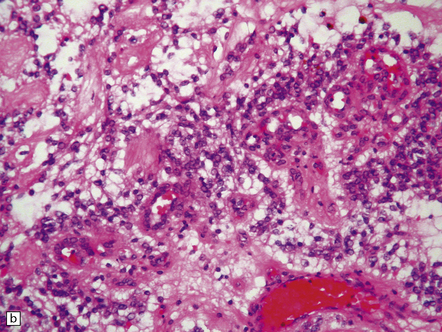
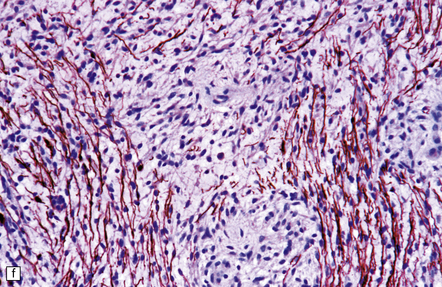
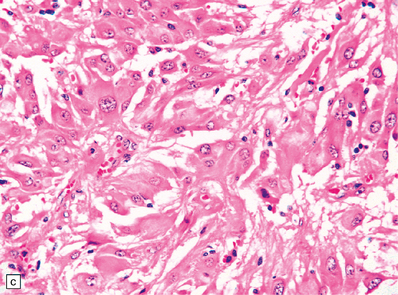
35.7 Fibrillary astrocytoma.
(a) In a smear preparation, the cells show mild nuclear pleomorphism and contain fine fibrillary processes in which glial filaments demonstrate pink metachromasia. (b) The processes show birefringence under polarized light. (c, d) Microcysts disrupt a meshwork of fibrillary processes, which appear relatively condensed around irregularly scattered pleomorphic and hyperchromatic nuclei (e). (f) Neoplastic cells entrap neurons. (g) Immunohistochemistry with a Ki-67 antibody shows a low labeling index.
About a third of cells in gemistocytic astrocytomas show this morphology, though in practice, the boundary between some fibrillary astrocytomas and gemistocytic astrocytomas is hard to delineate. The few short cytoplasmic processes and round nuclei of cells in the protoplasmic astrocytoma produce a truly stellate appearance (Fig. 35.9). Mitotic activity is not found in diffuse astrocytomas; it denotes anaplastic progression (Fig. 35.10). However, astrocytic tumors with a single mitosis in a limited biopsy tend to behave more like diffuse astrocytomas than anaplastic astrocytomas. If there is only limited material for histopathologic examination, e.g. from a stereotactically obtained biopsy, the diagnosis of astrocytoma may be difficult to make, especially if the biopsy is from the infiltrating edge of the tumor. The issue of whether the biopsy is representative of the rest of the neoplasm also arises. Infiltrated brain may be relatively undisturbed at the edge of the neoplasm, so subtle cytologic differences must be sought to identify the neoplastic cells. Their cytoplasm may blend with the fibrillary background and the diagnosis is made on the basis of nuclear characteristics and an uneven distribution of infiltrating cells. Immunohistochemistry with antibodies to P53 or the mutant IDH1 protein may assist in the identification of an astrocytoma in challenging histological circumstances. A high proportion of TP53 mutations produce conspicuous and widespread nuclear accumulation of P53 in tumor cells. This is not a feature of normal tissue, though some non-neoplastic pathologies, notably progressive multifocal leukoencephalopathy, also label with anti-P53 antibodies. More specific is immunoreactivity to the mutant IDH1 protein (Fig. 35.11), which would be expected in about 75% of adult fibrillary astrocytomas, though notably not childhood astrocytomas.
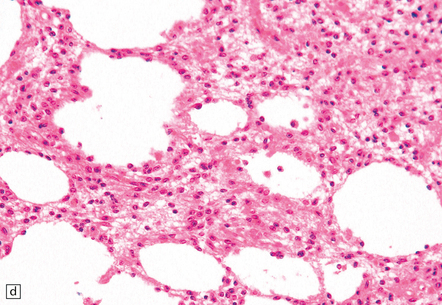
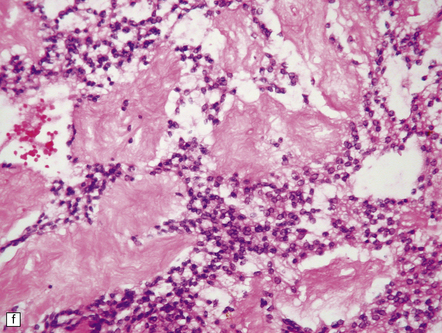
35.9 Protoplasmic astrocytoma.
(a) The neoplasm is quite superficially located, partly within the cerebral cortex. (b) The tumor consists of cells with small, round nuclei and relatively sparse cytoplasmic processes, though a stellate morphophenotype is evident. Microcysts are a prominent feature.
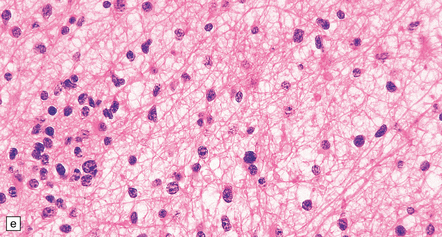
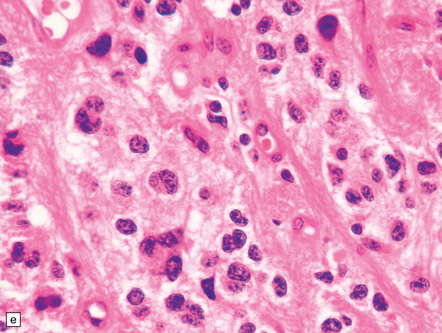
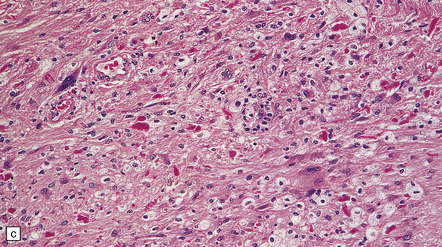
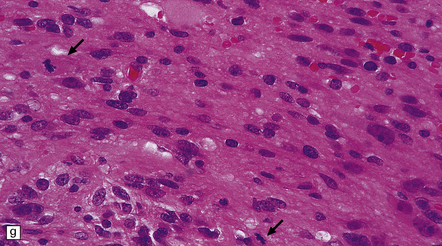
35.10 Anaplastic astrocytoma containing many gemistocytic cells.
The presence of mitoses puts this astrocytoma into the anaplastic category.
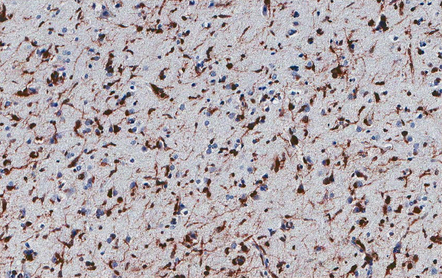
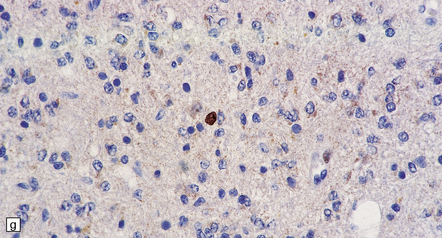
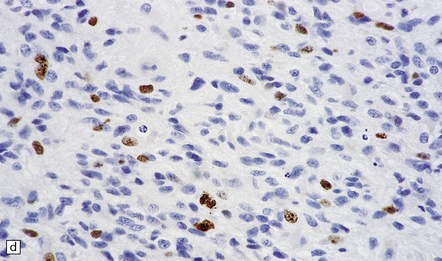
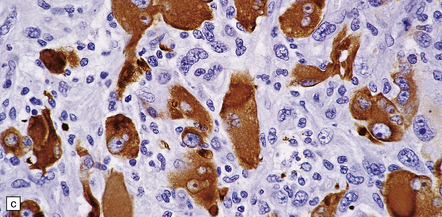
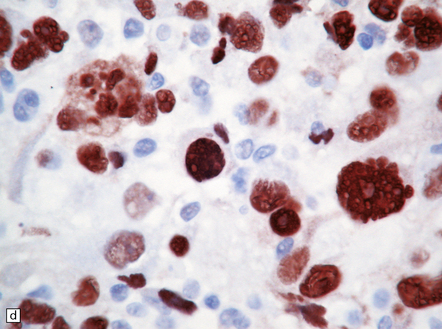
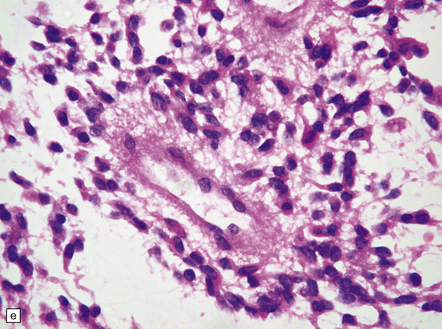
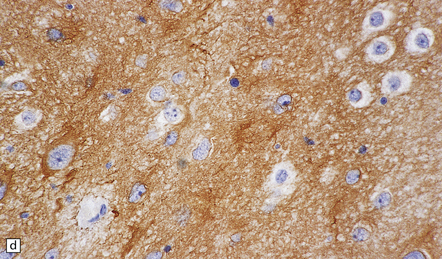
35.11 Immunohistochemical stain for mutant IDH1 protein highlights infiltrating neoplastic cells.
The antibody recognizes the IDH1R132H mutant protein. This stereotypical mutation occurs at codon 132 in over 90% of IDH1 mutant tumors.
 DIFFERENTIAL DIAGNOSIS OF ASTROCYTOMA
 Astrocytosis is generally characterized by an even distribution of reactive astrocytes with stellate processes. In addition, astrocyte hypertrophy is more evident than astrocyte hyperplasia, an increase in cell density is exceptional, and microcysts are rarely seen.

 Infarction is characterized by lipid-containing CD68-positive macrophages and reactive astrocytosis.


 MENINGEAL GLIOMATOSIS
 Characterized by the wide distribution of neoplastic cells showing an astrocytic or oligodendroglial morphology within the leptomeninges.
 Produces meningeal thickening and entrapment of nerve roots and blood vessels.
 Can sometimes be demonstrated to arise from a small glioma superficially located in the brain.
 LI–FRAUMENI SYNDROME


ANAPLASTIC ASTROCYTOMA
Anaplastic transformation of an astrocytoma is often heralded by the development of rapidly worsening neurologic symptoms and signs. Radiologically, conversion of a previously non-enhancing tumor in serial MRI scans of the brain to one that is enhancing is common (Fig. 35.3b). The prognosis is significantly poorer than for astrocytoma (Table 35.6).
MACROSCOPIC AND MICROSCOPIC APPEARANCES
Anaplastic transformation may be associated with little discernible macroscopic change in an astrocytoma, but a distinct mass may be identified in the expanded brain, reflecting a focal increase in cell proliferation. Some histologic features of an astrocytoma are exaggerated in an anaplastic astrocytoma; therefore, cytologic and nuclear pleomorphism may be more pronounced and the nuclear:cytoplasmic ratio increased, and multilobation of nuclei and a greater range of cell sizes may be apparent (Fig. 35.12). Mitotic activity distinguishes the anaplastic astrocytoma from diffuse astrocytoma variants. Neovascularization is enhanced, but glomeruloid microvascular proliferation with multiple layers of cells (see below) is a characteristic of glioblastomas. Necrosis is not found.
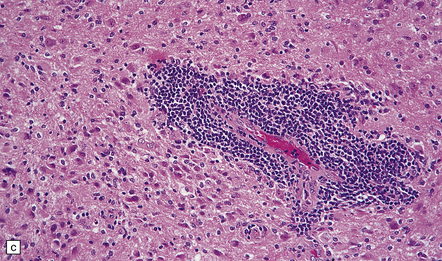
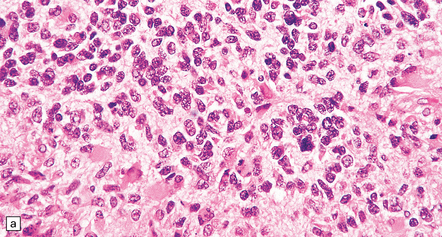
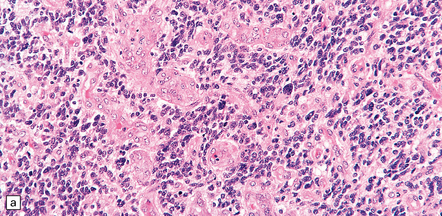
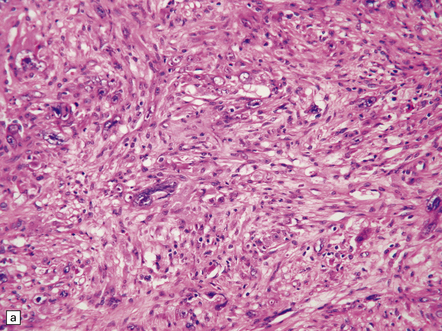
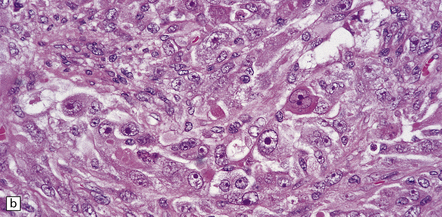
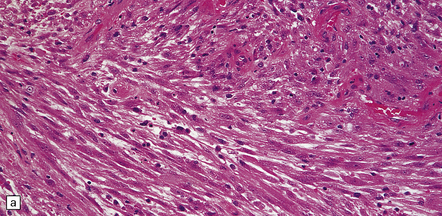
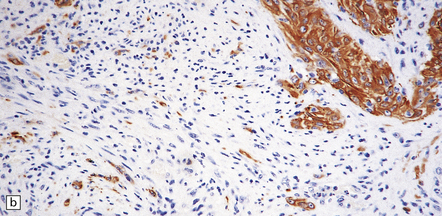
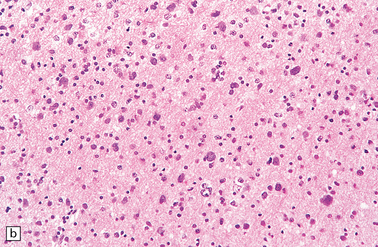
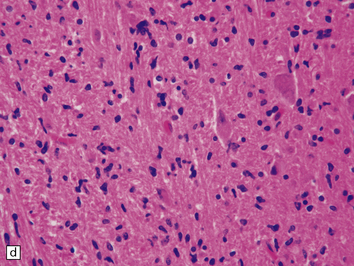
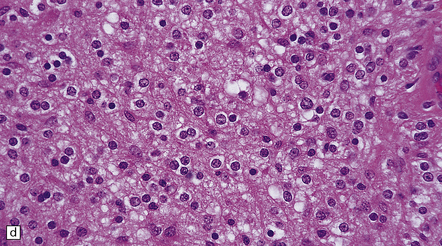
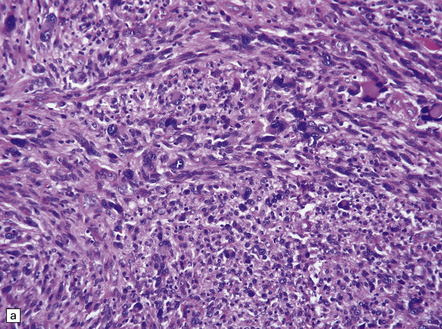
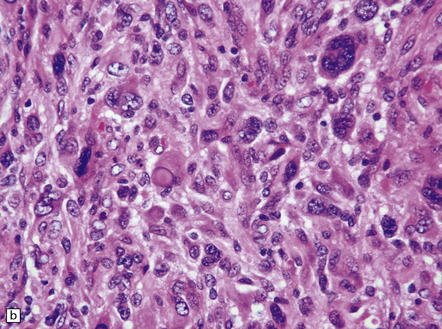
35.12 Anaplastic astrocytoma.
(a) Foci of increased cell density and pleomorphism and (b) mitotic figures (arrows) are the characteristics that distinguish anaplastic astrocytoma from astrocytoma. (c) Perivascular lymphoid aggregates are not unusual in diffuse astrocytic neoplasms. (d) The proportion of neoplastic cells with Ki-67 immunoreactivity is on average greater in anaplastic astrocytomas than in astrocytomas. A moderately high labeling index is seen here. In evaluating astrocytomas, a Ki-67 antibody helps to pick out cells in mitosis, which label strongly.
GLIOBLASTOMA
Glioblastomas arise de novo or represent the endpoint of neoplastic progression from an astrocytoma. Separation of these two types of glioblastoma has been proposed on the basis of genetic differences, but they are indistinguishable histopathologically (Table 35.1). Approximately 90% of glioblastomas are primary or de novo. Glioblastomas can be further categorized by their morphology (glioblastoma variants) or by their transcriptional profiles (Table 35.2).
MACROSCOPIC APPEARANCES
An infiltrating glioblastoma distorts the normal anatomy of the fixed post-mortem brain (Fig. 35.13). Glioblastomas quite commonly appear as a spherical mass with a necrotic center, which is seen on MRI imaging as a ring of contrast-enhancing tissue around a region of low attenuation (Fig. 35.3c). This appearance mimics an abscess, but the center of the glioblastoma is usually filled with straw-colored fluid and scanty necrotic debris, rather than pus. The tumor not infrequently enters or crosses the corpus callosum, sometimes forming a bihemispheric mass called a ‘butterfly glioma’ (Fig. 35.3d, 35.14). Foci of cyst formation, necrosis, and hemorrhage are admixed with mucoid gray neoplastic tissue (Fig. 35.15). The neoplasm often extends to distant parts of the brain along white matter tracts, and this can give it a multicentric appearance (Fig. 35.3f). Glioblastomas occasionally spread through cerebrospinal fluid pathways or otherwise metastasize distantly (Fig. 35.16).
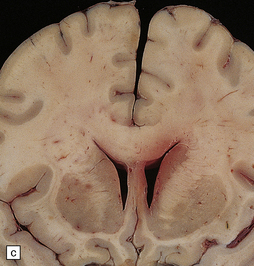
35.13 Glioblastoma.
(a) This example has produced bulging of the cerebrum and distortion of overlying gyri. (b) A horizontal section through the cerebrum reveals distortion of the normal architecture and foci of necrosis and hemorrhage.
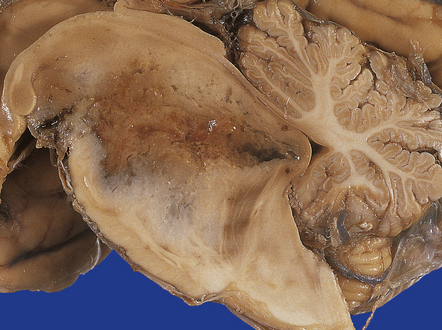
35.14 Butterfly glioma.
This glioblastoma crosses the corpus callosum and involves both frontal lobes resembling the two wings of a butterfly. Solid tan tumor can be seen on the left and yellow necrosis on the right.
MICROSCOPIC APPEARANCES
The appellation multiforme has been dropped from the glioblastoma, but this gave a good indication of its very varied histopathology (Figs 35.17–35.23). The cellular components can include admixtures of gemistocytes, fibrillary astrocytes, small cells, and multinucleated giant cells. Minor foci of ependymoma or oligodendroglial differentiation may be seen. Although some regions of a glioblastoma may appear like an astrocytoma or anaplastic astrocytoma, necrosis and a florid microvascular proliferation are the key features separating glioblastomas from the other two diffuse astrocytic neoplasms (Fig. 35.19).
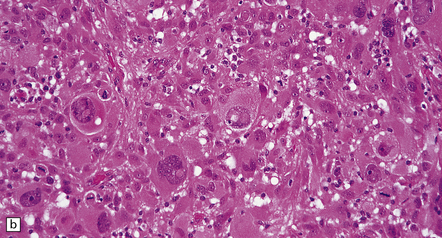
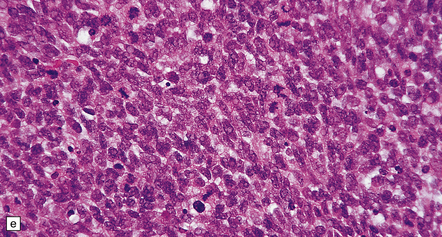
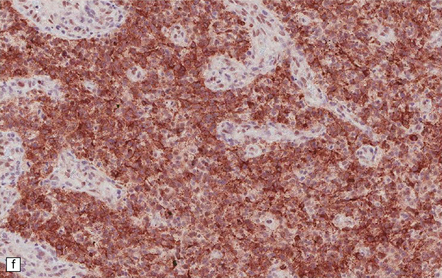
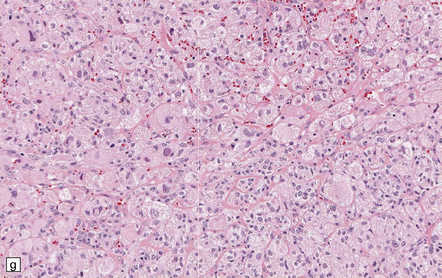
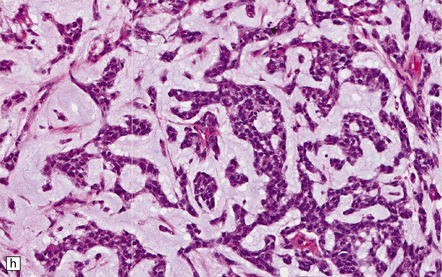
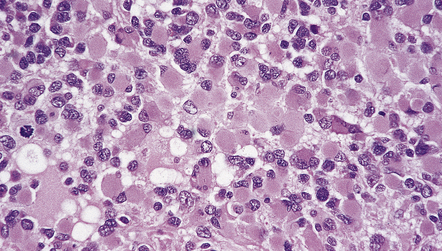
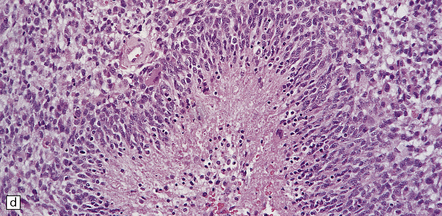
35.18 Extraordinary diversity of histologic appearance characterizes the glioblastoma.
(a) Variable nuclear:cytoplasmic ratio and a minority of cells with an astrocytic morphology are often seen. (b) Extreme cytologic pleomorphism. (c) Cells may contain deeply eosinophilic masses. (d–e) A small cell component may be mixed with other histologic patterns and usually contains many mitoses. (f) Synaptophysin immunopositivity is helpful for distinguishing glioblastoma with PNET from small cell glioblastoma. (g) Granular cytoplasm related to lysosomal content uncommonly predominates. (h) Epithelioid and pseudoglandular features may be seen in the adenoid variant.
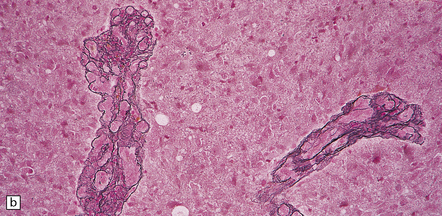
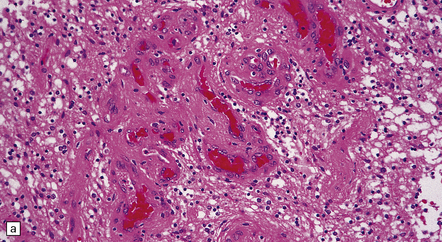
35.19 Glioblastoma.
In addition to diverse cytologic features, the glioblastoma is characterized by a distinctive neovascularization and micronecrosis. (a) Buds of capillary endothelial proliferation are seen among neoplastic cells, and (b) can be highlighted by a reticulin preparation. (c) Neovascularization may be induced in brain adjacent to a glioblastoma. (d) Pseudopalisading of cells around necrosis is sometimes seen.
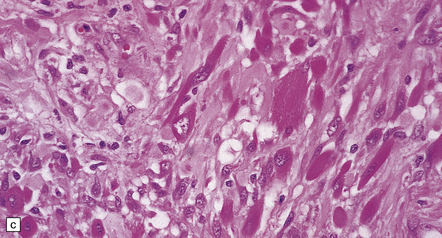
35.20 Cellular pleomorphism in glioblastomas.
(a) In the giant cell glioblastoma cytologic pleomorphism can be extreme. (b) Cells with a large nucleus and a single prominent nucleolus may be present in this variant of glioblastoma. (c) The cells seen in (b) bear some resemblance to neurons, but immunoreactivity for GFAP confirms their astrocytic nature. (d) About 80% of giant cell glioblastomas have a TP53 mutation, which produces strong immunoreactivity for the gene product in many tumor cell nuclei.
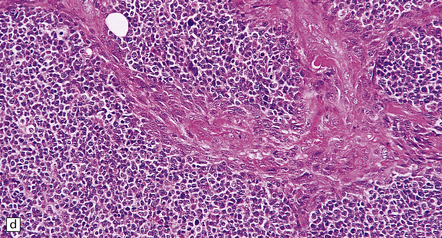
35.21 Gliosarcoma.
(a) Elongated cells are arranged in fascicles; mitotic figures are readily found in these sarcomatoid neoplasms which also contain foci of astrocytic cells. (b) Cells with astrocytic features are immunoreactive for GFAP, whereas the spindle-shaped cells tend not to be.
35.22 Post-radiotherapy vascular pathology.
The brain exposed to radiotherapy exhibits astrocytic gliosis and thickened blood vessels with inflammatory changes (a) or hyaline degeneration (b).
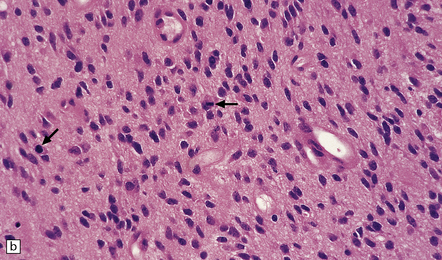
35.23 Gliomatosis cerebri.
(a) The brain is diffusely enlarged with some asymmetry of the cerebral hemispheres. Histology from this case (b) revealed a diffuse infiltrate of neoplastic glia and reactive changes in almost all cerebral lobes. (c) Another example demonstrates marked thickening of the corpus callosum. (Courtesy of Dr T Moss, Frenchay Hospital, Bristol, UK.) (d) Brain stem involvement may occur. Atypical infiltrating cells have produced an increase in cell density.
Thrombi are often found in these aberrant vessels, and are responsible for the foci of necrosis. Cellular pleomorphism in glioblastomas is typically more extreme than that in anaplastic astrocytomas, with giant cells being seen in some examples. GFAP immunoreactivity in glioblastomas is variable, but those cells with an astrocytic morphophenotype are generally positive. Immunoreactivity for vimentin is generally more widespread, and many glioblastomas are focally immunoreactive for S-100 protein. Glioblastomas previously treated with radiotherapy may be paucicellular and exhibit considerable cytologic atypia. Calcification and vascular changes are seen (Fig. 35.22). Delayed coagulative necrosis may produce a marked mass effect.
 DIFFERENTIAL DIAGNOSIS OF GLIOBLASTOMA


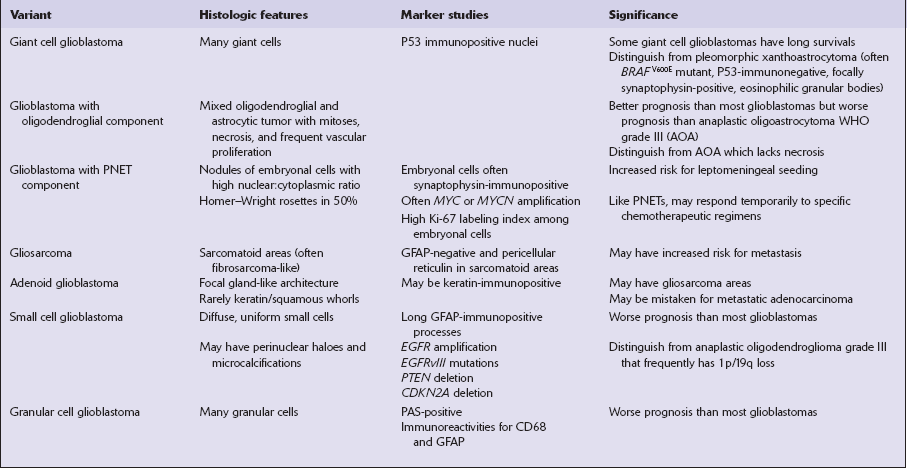
Some variants of glioblastoma such as small cell glioblastoma (Fig. 35.18d,e) and granular cell glioblastoma (Fig. 35.18g) are associated with a worse prognosis than the conventional glioblastoma (Table 35.7). In contrast, survival for glioblastoma with oligodendroglial component averages 24 months (compared with 14 months), and some giant cell glioblastoma patients can have an extended survival of many years (Fig. 35.20). Glioblastoma with primitive neuroectodermal tumor (PNET)-like features can seed the leptomeninges and may respond (partially) to PNET chemotherapeutic regimens (Fig. 35.18f). Adenoid glioblastoma has glandular and epithelioid features but should not be mistaken for adenocarcinoma (Fig. 35.18 h). Gliosarcomas are notable for their morphologic similarity to soft tissue sarcomas and a propensity to metastasize (Fig. 35.21).
GLIOMATOSIS CEREBRI
Gliomatosis cerebri is characterized by widespread infiltration of the CNS by small neoplastic glial cells (Fig. 35.23). Typically, a large proportion of the cerebrum is involved, and this is sometimes accompanied by spread of neoplastic cells into the brain stem and even the spinal cord. Differentiating gliomatosis cerebri from a diffusely infiltrating glial neoplasm may be difficult, because no strict criteria distinguish these entities, the difference being one of degree. The molecular genetics of this entity are poorly characterized given its relative rarity and diagnostic imprecision. However, a significant proportion of tumors classified as gliomatosis cerebri shares mutation profiles with the common diffuse astrocytoma and sometimes oligodendroglial neoplasms.
Gliomatosis cerebri can present like other neuroepithelial neoplasms, with headaches, focal neurological deficits, or epilepsy. However, symptoms and signs of dementia are relatively common, and gliomatosis cerebri must be considered in the differential diagnosis of this disorder. Neuroimaging studies may suggest the diagnosis (Fig. 35.3g), but an autopsy is sometimes required to confirm it.
MACROSCOPIC AND MICROSCOPIC APPEARANCES
Classic gliomatosis cerebri produces diffuse expansion of at least two cerebral lobes (Figs 35.3g,35.23a), without an obvious tumor mass (type 1 gliomatosis cerebri). However, some examples produce the characteristic diffuse expansion of CNS tissue plus a mass of neoplastic cells (type 2 gliomatosis cerebri), which most often has the features of a glioblastoma. Approximately 40% of type 2 gliomatosis cerebri lesions harbor IDH1 mutations. In contrast, type 1 gliomatosis lesions contain wild-type IDH1 sequences. Generally, a moderate increase in cell density is seen in regions infiltrated by neoplastic cells. These cells have mildly pleomorphic, elongated nuclei and indistinct cytoplasm (Fig. 35.23d).
PILOCYTIC ASTROCYTOMA
 does not share their genetic abnormalities
 does not infiltrate surrounding tissue in the same manner
 very rarely progresses to an anaplastic form
 has a predilection for sites not commonly involved by other astrocytic neoplasms

 GENETICS OF PILOCYTIC ASTROCYTOMA (PA)
 PAs have MAPK/ERK pathway aberrations, most commonly due to generation of a KIAA1549–BRAF fusion protein with tandem duplication of the BRAF gene (Figs 35.24, 35.25).
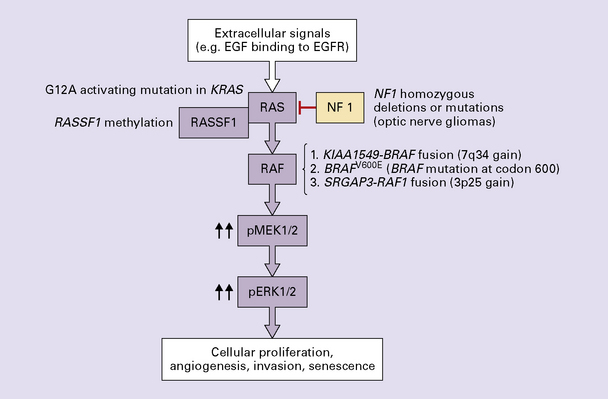
35.24 Activation of the MAPK/ERK pathway in pilocytic astrocytomas.
The majority of pilocytic neoplasms contain various mutually exclusive genetic changes affecting this pathway. A KIAA1549-BRAF fusion with tandem duplication of the BRAF gene is the most common event.
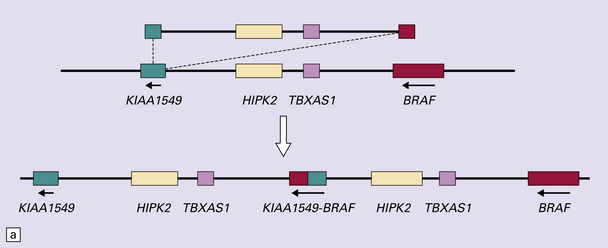
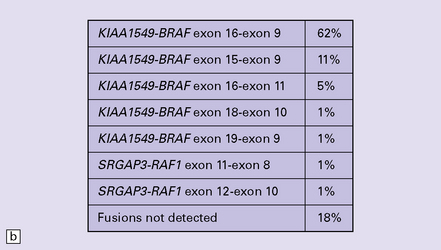
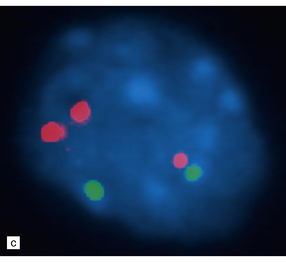
35.25 BRAF tandem duplication with gene fusion.
(a) The BRAF gene fuses with KIAA1549. (b) The site of KIAA1549-BRAF fusion may differ, resulting in fusion variants. Less commonly, the SRGAP3 and RAF1 genes may similarly fuse, but with a similar effect on the MAPK/ERK pathway. (c) Interphase FISH can detect BRAF duplication (one elongated red signal) in tumor cells in formalin-fixed paraffin-embedded sections.


 Of patients with neurofibromatosis type 1, approximately 15% develop a PA.
 Approximately 20% of sporadic PAs show loss of chromosome 17q, but not mutation of the NF1 gene.
MACROSCOPIC APPEARANCES
The pilocytic astrocytoma is relatively well circumscribed. It often has a heterogeneous consistency with both firm and mucoid areas. Focal calcification may be present. A pilocytic astrocytoma sometimes forms a mural nodule in association with a cyst (Fig. 35.3e). Invasion of the subarachnoid space and intratumoral hemorrhage may occur.
MICROSCOPIC APPEARANCES
Pilocytic astrocytomas typically have a biphasic appearance (Fig. 35.26). Some parts of the neoplasm consist of elongated cells arranged in compact fascicles. Elsewhere, a mixture of drawn-out (piloid) and stellate cells with branching cytoplasmic processes enclose a fine meshwork of microcysts. The two components are present to varying degrees, and the microcystic component may be lacking in some pilocytic astrocytomas from older patients. A lobulated architecture is sometimes seen. The nuclei of neoplastic cells in some areas are round and perinuclear clearing in these cells can mimic the appearance of an oligodendroglioma (Fig. 35.27). Alternatively, groups of cells with small round nuclei cluster between relatively anuclear fibrillary zones. Nuclear pleomorphism and hyperchromasia are usually present in a proportion of cells, but carry no prognostic significance, representing a degenerative change, rather like that seen in schwannomas. Some pilocytic astrocytomas include tumor cells with multiple, circumferentially-arranged, small round nuclei. Mitoses are scarce.
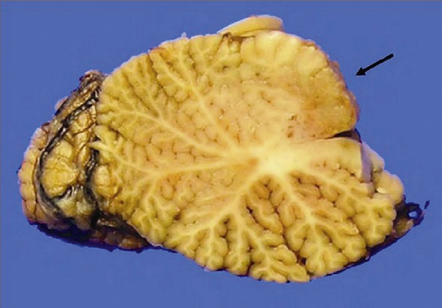
35.26 Pilocytic astrocytoma.
(a) Pilocytic astrocytomas often have a biphasic architecture with fascicular and cystic patterns. (b) A compact arrangement of elongated cells alone is found in some examples. (c) Rosenthal fibers may be numerous among fascicles of spindle-shaped cells. (d) Eosinophilic granular bodies (arrows) can be present. (e) A nodular pattern is sometimes evident. Scattered tumor cells may have hyperchromatic and grossly pleomorphic nuclei; this is a degenerative phenomenon in the typical pilocytic astrocytoma. (f) Some tumors contain clusters of small uniform cells. This example was from the optic nerve.
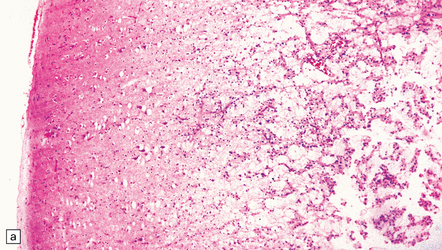
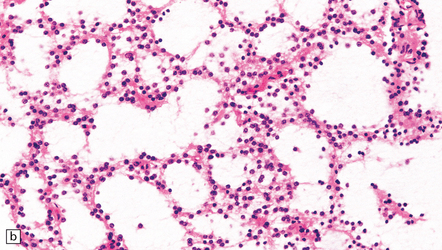
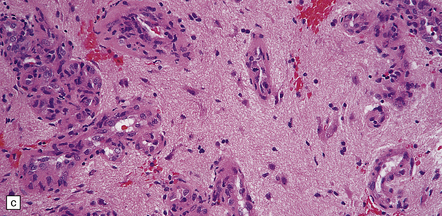
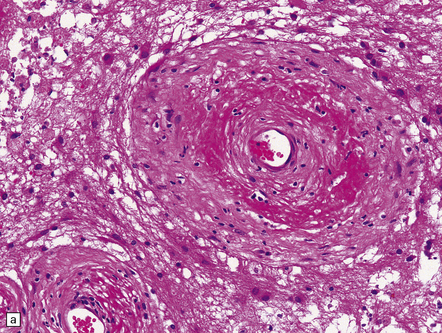
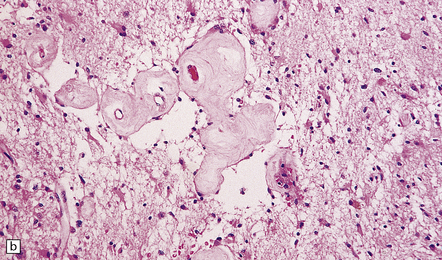
35.27 Pilocytic astrocytoma.
(a) Clusters of contiguous capillaries represent a distinctive neovascularization in pilocytic astrocytomas, which is not an indicator of anaplastic transformation; (b) even though they sometimes assume a glomeruloid form. (c) Foamy (xanthomatous) cells may be scattered among the astrocytic cells. (d) Oligodendrocyte-like cells, complete with perinuclear clearing, may be seen. (e) Monomorphic cells are disaggregated in the myxoid variant of pilocytic astrocytoma, except where they cluster around small blood vessels. (f) Focal infiltration of adjacent brain is demonstrated in this myxoid variant by immunoreactivity for neurofilament proteins in axons. (g) Anaplasia is uncommon in pilocytic astrocytomas and is evinced by mitotic activity (arrows) in association with micronecrosis and increased cytologic pleomorphism.
Areas of necrosis occur rarely, and should prompt consideration of other diagnoses. Rosenthal fibers and eosinophilic granular bodies, both of which label with antibodies to αB-crystallin, are classic features. They may be abundant, but are sometimes difficult to find in neoplasms from adult patients. Groups of neoplastic cells may be separated by strands of fibrovascular tissue that can be quite broad. Delicate thin-walled blood vessels may form distinctive small tangles (Fig. 35.27). True glomeruloid endothelial proliferation is occasionally found, but does not have an adverse prognostic significance in these neoplasms. Invasion of surrounding brain is typically limited to a narrow border around the neoplasm. Pilocytic astrocytomas may spread into perivascular and subarachnoid spaces, but rarely disseminate through CSF pathways.
A myxoid variant of pilocytic astrocytoma in the hypothalamic/diencephalic region called pilomyxoid astrocytoma has been described, in which monomorphic piloid tumor cells are dispersed in a mucopolysaccharide-rich matrix. Myxoid degeneration of blood vessels walls is highlighted by a tendency of perivascular cells to form a rosette-like pattern (Fig. 35.27e). Rosenthal fibers are missing, and foci of necrosis are not infrequent. Unlike the classic pilocytic astrocytoma, this variant tends to invade adjacent brain or spread throughout the neuraxis and has a poorer prognosis. It usually presents in infants.
Most cells in all pilocytic astrocytomas label with antibodies to GFAP. Ultrastructural examination reveals abundant cytoplasmic intermediate filaments. Pilocytic astrocytomas rarely become anaplastic. Increased cytologic pleomorphism and areas of micronecrosis in association with a high mitotic count in an otherwise typical pilocytic astrocytoma are signs of anaplastic transformation, which presages rapid recurrence (Fig. 35.27g).
 PILOCYTIC ASTROCYTOMA (PA)


 DIFFERENTIAL DIAGNOSIS OF PILOCYTIC ASTROCYTOMA (PA)
 Extensive astrocytic gliosis with Rosenthal fiber formation may mimic a PA, either as part of reactive conditions, adjacent to vascular malformations or around neoplasms, particularly craniopharyngiomas in the hypothalamus and hemangioblastomas in the cerebellum. Examination of all resected tissue is crucial for establishing the correct diagnosis.

 Rosenthal fibers are unusual in diffuse astrocytomas, and PAs have a distinctive neovascularization.


PLEOMORPHIC XANTHOASTROCYTOMA
MACROSCOPIC AND MICROSCOPIC APPEARANCES
PXA frequently forms a mural nodule within a cyst, and may be calcified. Spread within the subarachnoid space is common. As its name implies, the PXA shows considerable cytologic polymorphism (Fig. 35.28). Many cells are large and have abundant eosinophilic cytoplasm, but groups of small undifferentiated cells may also be found. Cytoplasmic lipid accumulation is found with variable frequency. Gross nuclear pleomorphism and hyperchromasia are evident in some cells. Eosinophilic granular bodies and perivascular lymphoid cell aggregates are frequent. Unlike most gliomas, the PXA exhibits characteristically dense pericellular reticulin. Mitoses are rarely found, and necrosis is absent from classic examples. PXAs with >5 mitoses/10 high power fields are designated as PXAs with anaplastic features. Necrosis may accompany such tumors. While the PXAs with anaplastic features are associated with a worse prognosis, the WHO schema does not upgrade the tumor to grade III as not all such tumors behave aggressively. Atypical ganglion cells are occasionally evident in gliomas with the features of PXA, suggesting that there is a histopathologic continuum with gangliogliomas (see Chapter 37).
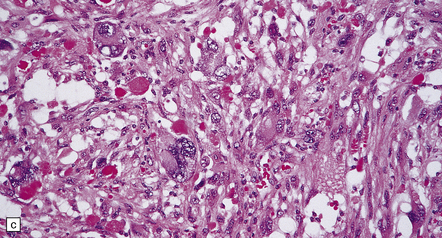
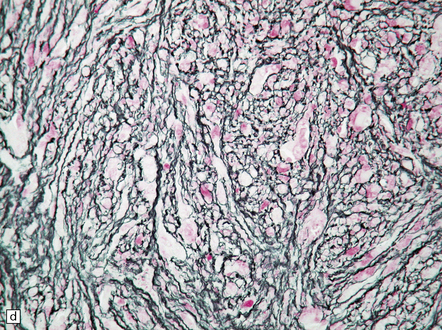
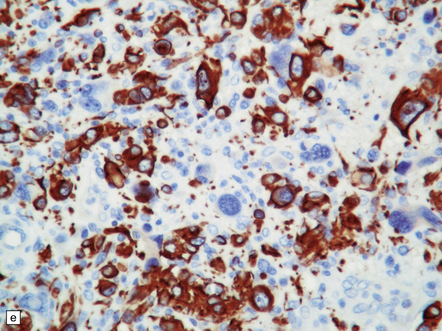
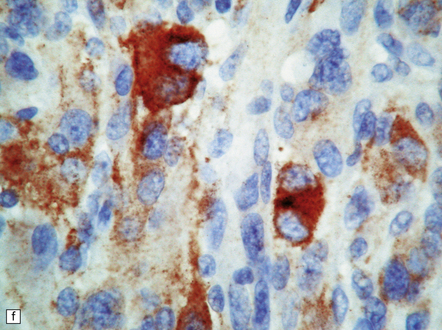
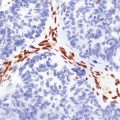
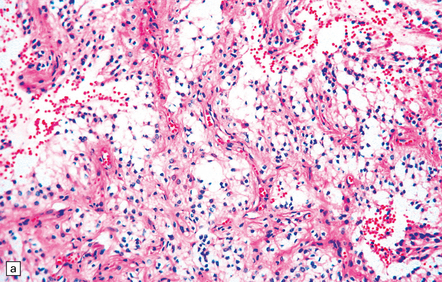
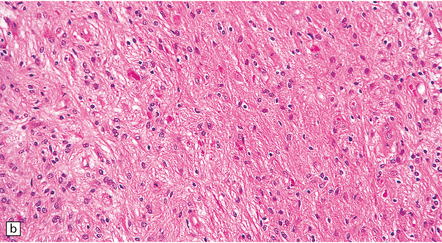
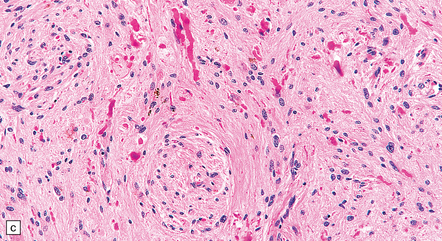
35.28 Pleomorphic xanthoastrocytoma.
(a–c) This neoplasm has a fascicular architecture and shows cytologic pleomorphism. (d) The reticulin pattern is characteristically dense. (e) There is variable immunoreactivity for GFAP. (f) Some cells without a neuronal morphophenotype show immunoreactivity for neuronal antigens, in this case synaptophysin.
 PLEOMORPHIC XANTHOASTROCYTOMA (PXA)
 Accounts for <1% of astrocytic neoplasms.
 Mainly presents in children and young adults, initially with epilepsy.
 Predominantly a superficial supratentorial neoplasm.
 Occurs most commonly in the temporal lobe.
 Radiologically often presents as a cyst with enhancing mural nodule.
 Usually has a more indolent biologic behavior than diffuse astrocytic neoplasms.
 May occasionally show anaplastic features and behave aggressively.
 DISTINGUISHING PXA FROM GLIOBLASTOMA
Pleomorphic xanthoastrocytoma (PXA):
 has distinctive clinical and radiologic features (see clinical box)


 includes neoplastic cells with a neuronal immunophenotype
 shows little invasion of adjacent brain
 displays extensive pericellular reticulin
 demonstrates intracellular eosinophilic protein droplets
 usually has a low mitotic count
 contains areas of necrosis only when undergoing progression to an anaplastic form.
SUBEPENDYMAL GIANT CELL ASTROCYTOMA (SEGA) AND TUBEROUS SCLEROSIS COMPLEX (TSC)
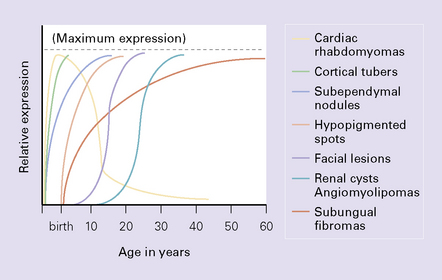
With very rare exceptions, SEGA occurs in the setting of TSC. TSC is a multi-system disorder characterized by hamartomatous and occasionally neoplastic abnormalities, which tend to present at different ages (Fig. 35.29). SEGAs CNS manifestations include:


MACROSCOPIC AND MICROSCOPIC APPEARANCES
TSC
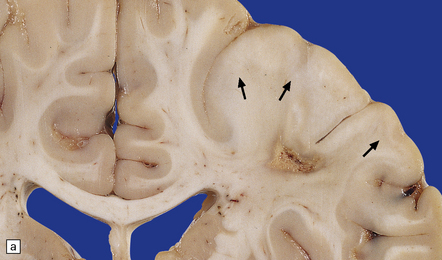
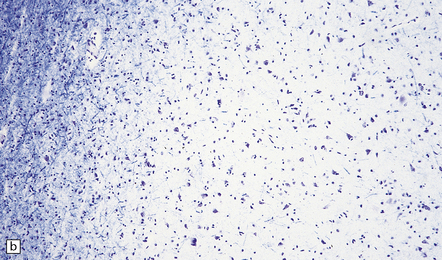
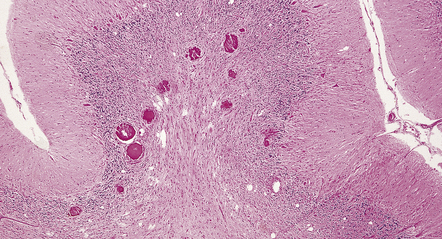
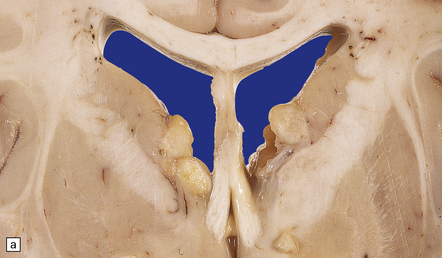
Cortical glioneuronal hamartomas (tubers) manifest as firm indistinct expansions of the gray matter and adjacent white matter (Fig. 35.30). Cortical dysplasia, neuronal heterotopia, and gliosis are evident microscopically. Vascularity is often increased. Scattered within the hamartomas are large cells with the cytologic and immunohistochemical characteristics of both glia and neurons. Hamartomas may contain foci of calcification. Hamartomas occasionally occur in the cerebellum, where focal atrophy, dystrophic calcification, and focal loss of Purkinje and internal granular cells may be evident (Fig. 35.31). Subependymal nodules occur mainly around the lateral ventricles, particularly in the region of the foramen of Monro (Fig. 35.32). Enlargement of a subependymal nodule signals the development of a SEGA.
SEGA
A well-defined soft mass of gray tissue protrudes into the ventricle. The SEGA is predominantly exophytic, and does not invade surrounding parenchyma in the manner of diffuse astrocytic neoplasms. Calcification may be present. At the microscopic level, many large oval cells have abundant glassy eosinophilic cytoplasm and a large eccentric nucleus, but elongated cells with smaller nuclei and fibrillary processes may surround groups of the plump cells, forming a nodular pattern (Fig. 35.33). Many neoplastic cells are GFAP-immunopositive, but some express neuronal antigens, such as synaptophysin and class III β-tubulin, and others
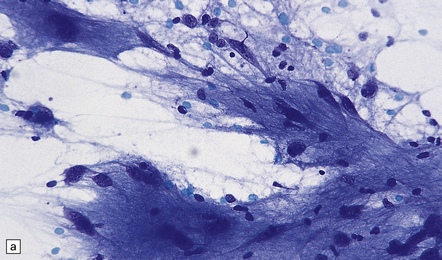
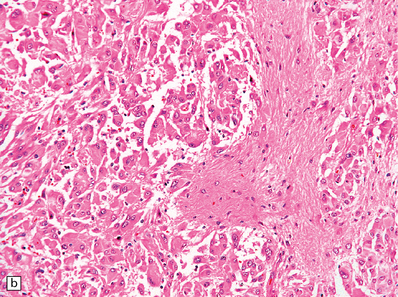
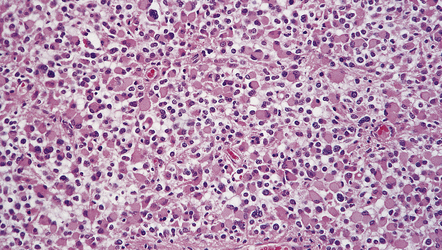
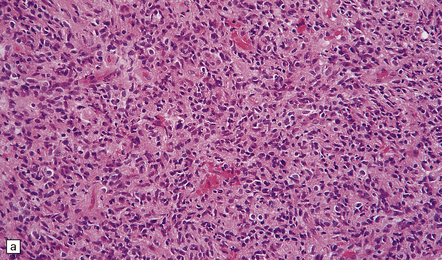
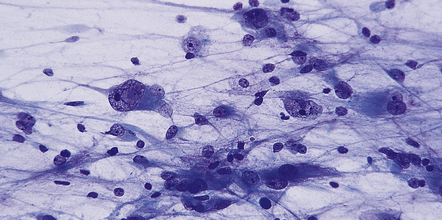
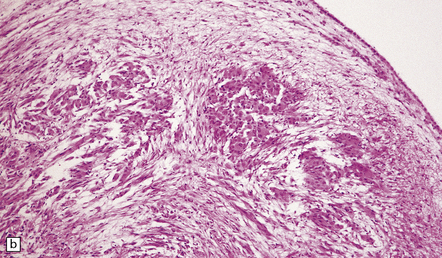
35.33 SEGA associated with TSC.
(a) Cytologic pleomorphism is evident in this smear preparation. (b,c) Large astrocytic cells with eccentric nuclei are evident in these histologic sections. (d) Only some of the large cells label with antibodies to GFAP.
 TUBEROUS SCLEROSIS COMPLEX


 SUBEPENDYMAL GIANT CELL ASTROCYTOMA


 GENETICS OF TSC
 With an established family history, TSC shows autosomal dominant inheritance with high penetrance.
 TSC shows linkage to the TSC1 gene on chromosome 9q34 in about half of affected families.
 The TSC1 gene encodes a 130 kD protein, hamartin, which is strongly expressed in the brain.


 Hamartin and tuberin form an intracellular complex, having inhibitory functions in the mTOR pathway, which explains the extensive overlap shown by TSC1 and TSC2 clinical phenotypes (Fig. 35.34).
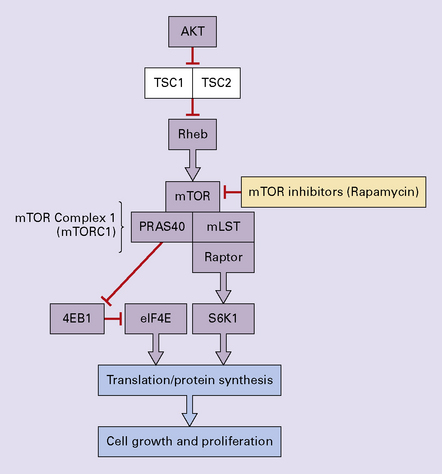
35.34 mTOR pathway in SEGA and TSC.
mTOR Complex 1 integrates signals from growth factors, energy status, oxygen levels, and amino acids to drive translation that promotes cell growth and proliferation. Defects in TSC1 or TSC2 remove inhibition of Rheb thus driving mTORC1 activation and ultimately tumor growth. mTOR inhibitors such as rapamycin can stop cellular proliferation and cause shrinkage of a SEGA. TSC1, tuberous sclerosis complex 1/hamartin; TSC2, tuberous sclerosis complex 2/tuberin; mTOR, mammalian target of rapamycin; mLST8, mammalian LST8; PRAS40, proline-rich AKT substrate 40; 4EBP1, 4E-binding protein 1; eIF4E, eukaryotic initiation factor 4E; S6K1, S6 kinase 1.


have an indeterminate phenotype, with combined immunoreactivities for glial and neuronal markers. Mitoses are unusual, but their presence does not signify aggressive behavior. Capillary endothelial proliferation and necrosis are exceptional, and should prompt consideration of other diagnoses, such as glioblastoma. Rare recurrences are not linked to any particular histopathologic feature.
REFERENCES
Louis, D.N., Ohgaki, H., Wiestler, O.D., et al. The 2007 WHO classification of tumours of the central nervous system. Acta Neuropathol (Berl).. 2007;114:97–109.
Miller, C.R., Perry, A. Glioblastoma. Morphologic and molecular diversity. Arch Pathol Lab Med.. 2007;131:397–406.
Nagarajan, R.P., Costello, J.F. Epigenetic mechanisms in glioblastoma multiforme. Semin Cancer Biol.. 2009;19:188–197.
Ohgaki, H., Kleihues, P. Genetic alterations and signaling pathways in the evolution of gliomas. Cancer Sci.. 2009;100:2235–2241.
Pfister, S., Hartmann, C., Korshunov, A. Histology and molecular pathology of pediatric brain tumors. J Child Neurol.. 2009;24:1375–1386.
Prayson, R.A. Gliofibroma: a distinct entity or a subtype of desmoplastic astrocytoma? Hum Pathol.. 1996;27:610–613.
Reuss, D., von Deimling, A. Hereditary tumor syndromes and gliomas. Recent Results Cancer Res.. 2009;171:83–102.
Scheithauer, B.W., Fuller, G.N., VandenBerg, S.R. The 2007 WHO classification of tumors of the nervous system: controversies in surgical neuropathology. Brain Pathol.. 2008;18:307–316.
Taratuto, A.L., Monges, J., Lylyk, P., et al. Superficial cerebral astrocytoma attached to dura. Report of six cases in infants. Cancer.. 1984;54:2505–2512.
Van Meir, E.G., Hadjipanayis, C.G., Norden, A.D., et al. Exciting new advances in neuro-oncology: the avenue to a cure for malignant glioma. CA Cancer J Clin.. 2010;60:166–193.
VandenBerg, S.R. Desmoplastic infantile ganglioglioma and desmoplastic cerebral astrocytoma of infancy. Brain Pathol.. 1993;3:275–281.
von Deimling, A., Korshunov, A., Hartmann, C. The next generation of glioma biomarkers: MGMT methylation, BRAF fusions and IDH1 mutations. Brain Pathol.. 2011;21:74–87.
Cancer Genome Atlas Research Network. Comprehensive genomic characterization defines human glioblastoma genes and core pathways. Nature. 2008;455:1061–1068.
Daumas-Duport, C., Scheithauer, B., O’Fallon, J., et al. Grading of astrocytomas. A simple and reproducible method. Cancer.. 1988;62:2152–2165.
Hegi, M.E., Diserens, A.C., Gorlia, T., et al. MGMT gene silencing and benefit from temozolomide in glioblastoma. N Engl J Med.. 2005;352:997–1003.
Perry, A., Miller, C.R., Gujrati, M., et al. Malignant gliomas with primitive neuroectodermal tumor-like components: a clinicopathologic and genetic study of 53 cases. Brain Pathol.. 2009;19:81–90.
Perry, A., Aldape, K.D., George, D.H., et al. Small cell astrocytoma: an aggressive variant that is clinicopathologically and genetically distinct from anaplastic oligodendroglioma. Cancer.. 2004;101:2318–2326.
Pfister, S., Witt, O. Pediatric gliomas. Recent Results Cancer Res.. 2009;171:67–81.
Sievert, A.J., Fisher, M.J. Pediatric low-grade gliomas. J Child Neurol.. 2009;24:1397–1408.
Verhaak, R.G., Hoadley, K.A., Purdom, E., et al. Integrated genomic analysis identifies clinically relevant subtypes of glioblastoma characterized by abnormalities in PDGFRA, IDH1, EGFR, and NF1. Cancer Cell.. 2010;17:98–110.
Ware, M.L., Hirose, Y., Scheithauer, B.W., et al. Genetic aberrations in gliomatosis cerebri. Neurosurgery.. 2007;60:150–158.
Yan, H., Bigner, D.D., Velculescu, V., et al. Mutant metabolic enzymes are at the origin of gliomas. Cancer Res.. 2009;69:9157–9159.
Pilocytic astrocytoma/Pilomyxoid astrocytoma
Ellis, J.A., Waziri, A., Balmaceda, C., et al. Rapid recurrence and malignant transformation of pilocytic astrocytoma in adult patients. J Neurooncol.. 2009;95:377–382.
Forshew, T., Tatevossian, R.G., Lawson, A.R., et al. Activation of the ERK/MAPK pathway: a signature genetic defect in posterior fossa pilocytic astrocytomas. J Pathol.. 2009;218:172–181.
Korshunov, A., Meyer, J., Capper, D., et al. Combined molecular analysis of BRAF and IDH1 distinguishes pilocytic astrocytoma from diffuse astrocytoma. Acta Neuropathol (Berl).. 2009;118:401–405.
Rodriguez, F.J., Scheithauer, B.W., Burger, P.C., et al. Anaplasia in pilocytic astrocytoma predicts aggressive behavior. Am J Surg Pathol.. 2010;34:147–160.
Tihan, T., Fisher, P.G., Kepner, J.L., et al. Pediatric astrocytomas with monomorphous pilomyxoid features and a less favorable outcome. J Neuropathol Exp Neurol.. 1999;58:1061–1068.
Giannini, C., Scheithauer, B.W., Lopes, M.B., et al. Immunophenotype of pleomorphic xanthoastrocytoma. Am J Surg Pathol.. 2002;26:479–485.
Kepes, J.J., Rubinstein, L.J., Eng, L.F. Pleomorphic xanthoastrocytoma: a distinctive meningocerebral glioma of young subjects with relatively favorable prognosis. A study of 12 cases. Cancer. 1979;44:1839–1852.
Powell, S.Z., Yachnis, A.T., Rorke, L.B., et al. Divergent differentiation in pleomorphic xanthoastrocytoma. Am J Surg Pathol.. 1996;20:80–85.
Schindler, G., Capper, D., Meyer, J., et al. Analysis of BRAF V600E mutation in 1,320 nervous system tumors reveals high mutation frequencies in pleomorphic xanthoastrocytoma, ganglioglioma and extra-cerebellar pilocytic astrocytoma. Acta Neuropathol (Berl).. 2011;121:397–405.
Weber, R.G., Hoischen, A., Ehrler, M., et al. Frequent loss of chromosome 9, homozygous CDKN2A/p14(ARF)/CDKN2B deletion and low TSC1 mRNA expression in Pleomorphic xanthoastrocytomas. Oncogene.. 2007;26:1088–1097.
Subependymal giant cell astrocytoma
Franz, D.N., Leonard, J., Tudor, C., et al. Rapamycin causes regression of astrocytomas in tuberous sclerosis complex. Ann Neurol.. 2006;59:490–498.
Goh, S., Butler, W., Thiele, E.A. Subependymal giant cell tumors in tuberous sclerosis complex. Neurology.. 2004;63:1457–1461.
Jozwiak, J., Jozwiak, S., Wlodarski, P. Possible mechanisms of disease development in tuberous sclerosis. Lancet Oncol.. 2008;9:73–79.