Arterial Blood Gases
Guidelines for Interpretation and Sample Problems
The following guidelines are meant to expand on the material presented in Chapter 3 and to simplify the interpretation of arterial blood gas values. Because memorizing a “cookbook” approach can sometimes be counterproductive if the reason why the approach is being used is not clear, these guidelines are meant to supplement a basic understanding of the underlying physiologic principles.
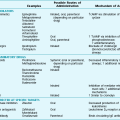
Numerous formulas are used to assess the appropriateness of compensation for a primary acid-base disorder. These formulas are particularly useful for suggesting whether a mixed acid-base disorder is present. Table C-1 lists commonly used formulas that predict the expected degree of respiratory compensation for a primary metabolic problem and metabolic compensation for a primary respiratory problem. These formulas relate arterial PCO2 and measured HCO3−. However, measured values from arterial blood gases include arterial PCO2 and pH, not serum HCO3−. Therefore, to use the formulas in the table, one must either measure serum HCO3− (as part of serum electrolyte values) or use a value calculated from PCO2 and pH according to the Henderson-Hasselbalch equation.
Table C-1
EXPECTED COMPENSATION FOR PRIMARY ACID-BASE DISORDERS
| Primary Disorder | Compensatory Response | Expected Magnitude of Response |
| Metabolic acidosis | ↓ PCO2 | PCO2 = 1.5 × (HCO3−) + 8 ± 2 |
| Metabolic alkalosis | ↑ PCO2 | PCO2 increases 6 mm Hg for each 10 mEq/L increase in HCO3− |
| Respiratory acidosis | ↑ HCO3− | Acute: HCO3− increases 1 mEq/L for each 10 mm Hg increase in PCO2 |
| Chronic: HCO3− increases 3.5 mEq/L for each 10 mm Hg increase in PCO2 | ||
| Respiratory alkalosis | ↓ HCO3− | Acute: HCO3− falls 2 mEq/L for each 10 mm Hg decrease in PCO2 |
| Chronic: HCO3− falls 5 mEq/L for each 10 mm Hg decrease in PCO2 |
Adapted from Narins RG, Emmett M: Medicine 59:161–186, 1980. © by Williams & Wilkins, 1980.
Analysis of Acid-Base Status
1. Look at the pH value to determine the net disturbance in acid-base balance. An alkalotic pH (>7.44) indicates the presence of a primary respiratory alkalosis, a metabolic alkalosis, or both. An acidotic pH (<7.36) indicates the presence of a primary respiratory acidosis, a metabolic acidosis, or both. A normal pH (approximately 7.36-7.44) indicates normal acid-base status or a mixed disturbance (of two balancing problems).
2. Look at PCO2. A high PCO2 (>44) indicates that a respiratory acidosis is present. A low PCO2 (<36) indicates that a respiratory alkalosis is present. If the pH value moves in the appropriate direction for the PCO2 change (i.e., ↓ pH with ↑ PCO2; ↑ pH with ↓ PCO2), the respiratory disorder is the primary disturbance. If the pH value does not move in the appropriate direction for the PCO2 change, a metabolic disorder is the primary disorder.
3. When a primary respiratory disorder is present, the pH value should change approximately 0.08 units for each 10 mm Hg change in PCO2 if the process is acute. If the process is chronic, the kidneys compensate (by retaining or losing HCO3−) and blunt the pH change in response to any change in PCO2. The resulting change in pH when the respiratory disorder is chronic is slightly different for acidosis versus alkalosis. With a chronic respiratory acidosis, the expected pH decrease is approximately 0.03 for each 10 mm Hg increase in PCO2. With a chronic respiratory alkalosis, the expected pH increase is approximately 0.02 for each 10 mm Hg decrease in PCO2.
4. If a pH change cannot be explained by an alteration in PCO2, a primary metabolic disturbance is present. A low pH value with a low PCO2 indicates a primary metabolic acidosis with respiratory compensation. A high pH value with a high PCO2 can indicate a primary metabolic alkalosis with secondary suppression of respiratory drive. However, in many patients the latter pattern of a high pH value with a high PCO2 often represents a complex acid-base disturbance, such as a chronic compensated respiratory acidosis with a superimposed primary metabolic alkalosis (e.g., as a result of diuretics, vomiting, or nasogastric suction).
5. To determine whether there has been appropriate respiratory compensation for a primary metabolic disorder, a rough guideline is that PCO2 should approximate the last two digits of the pH value. For example, a PCO2 of 25 mm Hg accompanying a pH value of 7.25 indicates appropriate respiratory compensation for a primary metabolic acidosis. However, the degree of compensatory hyperventilation (i.e., lowering of PCO2) for a metabolic acidosis tends to be more predictable than the degree of compensatory hypoventilation (i.e., CO2 retention) accompanying a metabolic alkalosis.
Analysis of Oxygenation
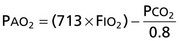
1. When analyzing arterial PO2, first calculate alveolar PO2 according to the following equation:
2. If the patient is hypoxemic, PCO2 is elevated, and AaDO2 is normal (<15 mm Hg on room air in a young person, although it increases with age), hypoventilation is the cause of the hypoxemia.
3. If the patient is hypoxemic, PCO2 is normal or low, and AaDO2 is increased, either  mismatch or shunting is present. With
  mismatch, the patient’s PaO2 has a good response to administration of supplemental O2. With a true shunt, PaO2 does not rise much with supplemental O2 (even 100% O2).
4. If the patient is hypoxemic, PCO2 is high, and AaDO2 is increased, the patient has both hypoventilation and either  mismatch or shunt as the cause of the low PaO2.
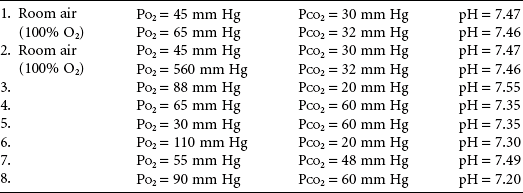
Answers
1. Acute respiratory alkalosis. On room air, the patient’s AaDO2 = 67.5 mm Hg, which is elevated. The minimal elevation in PO2 with 100% O2 indicates that a shunt is the major cause of the hypoxemia.
2. Identical to Problem 1, except that the dramatic increase in PO2 with 100% O2 indicates that ventilation-perfusion mismatch is the major cause of the hypoxemia.
3. Acute respiratory alkalosis. Even though PO2 appears normal, AaDO2 is elevated to 37 mm Hg, indicating the presence of a disorder impairing normal oxygenation of blood.
4. Chronic respiratory acidosis. AaDO2 = 10 mm Hg, indicating that hypoxemia is due to hypoventilation.
5. Chronic respiratory acidosis, as in Problem 4. However, unlike Problem 4, AaDO2 is elevated (to 45 mm Hg), indicating that both hypoventilation and either ventilation-perfusion mismatch or shunting (most likely the former) are responsible for the hypoxemia.
6. Mixed acid-base disorder with a primary metabolic acidosis complicated by a primary respiratory alkalosis. PCO2 is too low to represent just compensation for the metabolic acidosis, indicating the presence of a respiratory alkalosis as well. AaDO2 = 15 mm Hg, the upper limit of normal for a young adult.
7. The simplest explanation of the acid-base status is a compensated metabolic alkalosis. However, this pattern is probably seen more commonly with a mixed acid-base disorder consisting of a compensated respiratory acidosis complicated by a superimposed primary metabolic alkalosis. AaDO2 = 35 mm Hg. Therefore, hypoxemia is due partly to hypoventilation but mostly to ventilation-perfusion mismatch or shunt, probably the former.
8. Something is wrong because AaDO2 is negative (−15 mm Hg). Several possible explanations are: (a) the patient was receiving supplemental O2, (b) a laboratory error was made, or (c) the blood was not collected or transported properly under anaerobic conditions.