Pulmonary Anatomy and Physiology
The Basics
To be effective at gas exchange, the lungs cannot act in isolation. They must interact with the central nervous system (which provides the rhythmic drive to breathe), the diaphragm and muscular apparatus of the chest wall (which respond to signals from the central nervous system and act as a bellows for movement of air), and the circulatory system (which provides blood flow and thus gas transport between the tissues and lungs). The processes of oxygen uptake and carbon dioxide elimination by the lungs depend on proper functioning of all these systems, and a disturbance in any of them can result in clinically important abnormalities in gas transport and thus arterial blood gases. This chapter begins with an initial overview of pulmonary anatomy, followed by a discussion of mechanical properties of the lungs and chest wall, and a consideration of some aspects of the contribution of the lungs and the circulatory system to gas exchange. Additional discussion of pulmonary and circulatory physiology is presented in Chapters 4, 8, and 12; neural, muscular, and chest wall interactions with the lungs are discussed further in Chapter 17.
Anatomy
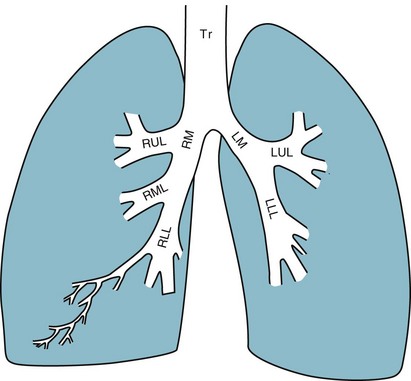
It is appropriate when discussing the anatomy of the respiratory system to include the entire pathway for airflow from the mouth or nose down to the alveolar sacs. En route to the alveoli, gas flows through the oropharynx or nasopharynx, larynx, trachea, and finally a progressively arborizing system of bronchi and bronchioles (Fig. 1-1). The trachea divides at the carina into right and left mainstem bronchi, which branch into lobar bronchi (three on the right, two on the left), segmental bronchi, and an extensive system of subsegmental and smaller bronchi. These conducting airways divide approximately 15 to 20 times down to the level of terminal bronchioles, which are the smallest units that do not actually participate in gas exchange.
Further details about the anatomy of airways, alveoli, and the pulmonary vasculature, particularly with regard to structure-function relationships and cellular anatomy, are given in Chapters 4, 8, and 12.
Physiology
Mechanical Aspects of the Lungs and Chest Wall
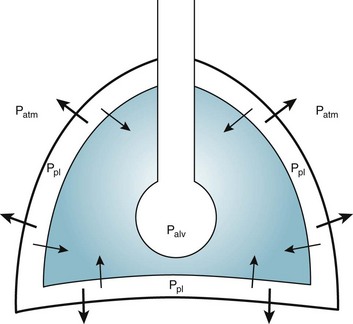
Alternatively, instead of positive pressure exerted on alveoli through the airways, negative pressure could be applied outside the lungs to cause their expansion. Thus, what increases the volume of the isolated lungs from the resting, essentially airless, state is application of a positive transpulmonary pressure—the pressure inside the lungs relative to the pressure outside. Internal pressure can be made positive, or external pressure can be made negative; the net effect is the same. With the lungs inside the chest wall, the internal pressure is alveolar pressure, whereas external pressure is the pressure within the pleural space (Fig. 1-2). Therefore, transpulmonary pressure is defined as alveolar pressure (Palv) minus pleural pressure (Ppl). For air to be present in the lungs, pleural pressure must be relatively negative compared with alveolar pressure.
The relationship between transpulmonary pressure and lung volume can be described for a range of transpulmonary pressures. The plot of this relationship is the compliance curve of the lung (Fig. 1-3, A). As transpulmonary pressure increases, lung volume naturally increases. However, the relationship is not linear but curvilinear. At relatively high volumes, the lungs reach their limit of distensibility, and even rather large increases in transpulmonary pressure do not result in significant increases in lung volume.
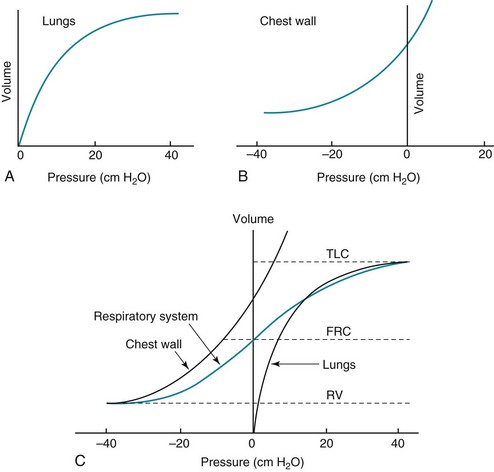
The compliance curve of the chest wall relates the volume enclosed by the chest wall to the pressure across the chest wall (Fig. 1-3, B). The curve becomes relatively flat at low lung volumes at which the chest wall becomes stiff. Further changes in pressure across the chest wall cause little further decrement in volume.
To examine how the lungs and chest wall behave in situ, remember that the elastic properties of each are acting in opposite directions. At the normal resting end-expiratory position of the respiratory system (functional residual capacity [FRC]), the lung is expanded to a volume greater than the resting volume it would have in isolation, whereas the chest wall is contracted to a volume smaller than it would have in isolation. However, at FRC the tendency of the lung to become smaller (the inward or elastic recoil of the lung) is exactly balanced by the tendency of the chest wall to expand (the outward recoil of the chest wall). The transpulmonary pressure at FRC is equal in magnitude to the pressure across the chest wall but acts in an opposite direction (Fig. 1-3, C). Therefore pleural pressure is negative, a consequence of the inward recoil of the lungs and the outward recoil of the chest wall.
The chest wall and the lungs can be considered as a unit, the respiratory system. The respiratory system has its own compliance curve, which is essentially a combination of the individual compliance curves of the lungs and chest wall (see Fig. 1-3, C). The transrespiratory system pressure, again defined as internal pressure minus external pressure, is airway pressure minus atmospheric pressure. At a transrespiratory system pressure of 0, the respiratory system is at its normal resting end-expiratory position, and the volume within the lungs is FRC.
At the other extreme, when we exhale as much as possible, we reach residual volume (RV). At this point a significant amount of gas still is present within the lungs—that is, we can never exhale enough to empty the lungs entirely of gas. Again, the reason can be seen by looking at the compliance curves in Figure 1-3, C. The chest wall becomes so stiff at low volumes that additional effort by the expiratory muscles is unable to decrease the volume any further. Therefore, RV is determined primarily by the balance of the outward recoil of the chest wall and the contracting action of the expiratory musculature. However, this simple model for RV applies only to the young individual with normal lungs and airways. With age or airway disease, further expulsion of gas during expiration is limited not only by the outward recoil of the chest wall but also by the tendency for airways to close during expiration and for gas to be trapped behind the closed airways.
Ventilation
To maintain normal gas exchange to the tissues, an adequate volume of air must pass through the lungs for provision of O2 to and removal of CO2 from the blood. A normal person at rest typically breathes approximately 500 mL of air per breath at a frequency of 12 to 16 times per minute, resulting in a ventilation of 6 to 8 L/min (minute ventilation [ ]).* The volume of each breath (tidal volume [VT]) is not used entirely for gas exchange; a portion stays in the conducting airways and does not reach the distal part of the lung capable of gas exchange. The portion of the tidal volume that is “wasted” (in the sense of gas exchange) is termed the volume of dead space (VD), and the volume that reaches the gas-exchanging portion of the lung is the alveolar volume (VA). The anatomic dead space, which includes the larynx, trachea, and bronchi down to the level of the terminal bronchioles, is approximately 150 mL in a normal person; thus, 30% of a tidal volume of 500 mL is wasted.
 ), which is equal to the breathing frequency (f) multiplied by V
 ; as
; as  increases, Pa
 ); if
); if  increases without any change in
  , Pa
, Pa
 ) and directly proportional to CO2 production (
 ).
).This defines the major factors determining PaCO2. When a normal individual exercises,  increases, but
  increases proportionately so that PaCO2 remains relatively constant.

For gas coming directly from alveoli that have participated in gas exchange, PCO2 approximates that of arterial blood. For gas coming from the dead space, PCO2 is 0 because the gas never came into contact with pulmonary capillary blood.
Circulation
West developed a model of pulmonary blood flow that divides the lung into zones, based on the relationships among pulmonary arterial, venous, and alveolar pressures (Fig. 1-4). As stated earlier, the vascular pressures—that is, pulmonary arterial and venous—depend in part on the vertical location of the vessels in the lung because of the hydrostatic effect. Apical vessels have much lower pressure than basilar vessels, the difference being the vertical distance between them (divided by a correction factor of 1.3 to convert from cm H2O to mm Hg).
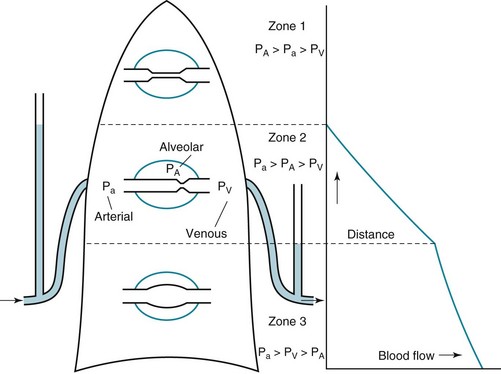
At the apex of the lung (zone 1 in Fig. 1-4), alveolar pressure exceeds arterial and venous pressures and no flow results. Normally, such a condition does not arise unless pulmonary arterial pressure is decreased or alveolar pressure is increased (by exogenous pressure applied to the airways and alveoli). In zone 2, arterial but not venous pressure exceeds alveolar pressure, and the driving force for flow is determined by the difference between arterial and alveolar pressures. In zone 3, arterial and venous pressures exceed alveolar pressure, and the driving force is the difference between arterial and venous pressures, as is the case in the systemic vasculature.
Diffusion
For O2 and CO2 to be transferred between the alveolar space and blood in the pulmonary capillary, diffusion must take place through several compartments: alveolar gas, alveolar and capillary walls, plasma, and membrane and cytoplasm of the red blood cell. In normal circumstances, the process of diffusion of both gases is relatively rapid, and full equilibration occurs during the transit time of blood flowing through the pulmonary capillary bed. In fact, the PO2 in capillary blood rises from the mixed venous level of 40 mm Hg* to the end-capillary level of 100 mm Hg in approximately 0.25 second, or one third the total transit time (0.75 second) an erythrocyte normally spends within the pulmonary capillaries. Similarly, CO2 transfer is complete within approximately the same amount of time.
Even though diffusion limitation rarely contributes to hypoxemia, an abnormality in diffusion may be a useful marker for diseases of the pulmonary parenchyma that affect the alveolar-capillary membrane, the volume of blood in the pulmonary capillaries, or both. Rather than using O2 to measure diffusion within the lung, clinicians generally use carbon monoxide, which also combines with hemoglobin and is a technically easier test to perform and interpret. The usefulness and meaning of the measurement of diffusing capacity are discussed in Chapter 3.
Oxygen Transport
Oxygen is transported in blood in two ways, either dissolved in the blood or bound to the heme portion of hemoglobin. Oxygen is not very soluble in plasma, and only a small amount of O2 is carried this way under normal conditions. The amount dissolved is proportional to the partial pressure of O2, with 0.0031 mL dissolved for each millimeter of mercury of partial pressure. The amount bound to hemoglobin is a function of the oxyhemoglobin dissociation curve, which relates the driving pressure (PO2) to the quantity of O2 bound. This curve reaches a plateau, indicating that hemoglobin can hold only so much O2 before it becomes fully saturated (Fig. 1-5). At PO2 = 60 mm Hg, hemoglobin is approximately 90% saturated, so only relatively small amounts of additional O2 are transported at a PO2 above this level.
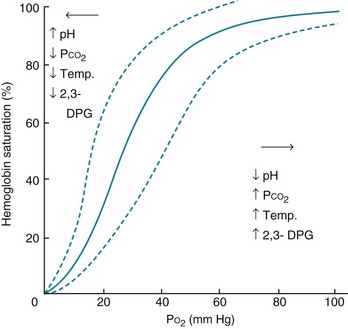
This curve can shift to the right or left, depending on a variety of conditions. Thus, the relationships between arterial PO2 and saturation are not fixed. For instance, a decrease in pH or an increase in PCO2 (largely by a pH effect), temperature, or 2,3-diphosphoglycerate (2,3-DPG) levels shifts the oxyhemoglobin dissociation curve to the right, making it easier to unload (or harder to bind) O2 for any given PO2 (see Fig. 1-5). The opposite changes in pH, PCO2, temperature, or 2,3-DPG shift the curve to the left and make it harder to unload (or easier to bind) O2 for any given PO2. These properties help ensure that oxygen is released preferentially to tissues that are more metabolically active because intense anaerobic metabolism results in decreased pH and elevations in 2,3-DPG, whereas increased heat and CO2 are generated by intense aerobic metabolism.
Perhaps the easiest way to understand O2 transport is to follow O2 and hemoglobin as they course through the circulation in a normal person. When blood leaves the pulmonary capillaries, it has already been oxygenated by equilibration with alveolar gas, and the PO2 should be identical to that in the alveoli. Because of O2 uptake and CO2 excretion at the level of the alveolar-capillary interface, alveolar PO2 is less than the 150 mm Hg that was calculated for inspired gas within the airways (see discussion on Hypoxemia and Equation 1-7). Alveolar PO2 in a normal individual (breathing air at sea level) is approximately 100 mm Hg. However, the PO2 measured in arterial blood is actually slightly lower than this value for alveolar PO2, partly because of the presence of small amounts of “shunted” blood that do not participate in gas exchange at the alveolar level, such as (1) desaturated blood from the bronchial circulation draining into pulmonary veins and (2) venous blood from the coronary circulation draining into the left ventricle via thebesian veins.


The total O2 content is the sum of the hemoglobin-bound O2 plus the dissolved O2, or 19.5 + 0.3 = 19.8 mL O2/100 mL blood.
 ) is the product of cardiac output and the difference noted previously in arterial-venous O2 content. Because (1) normal resting cardiac output for a young individual is approximately 5 to 6 L/min and (2) 46 mL O2 is extracted per liter of blood flow (note difference in units), the resting O2 consumption is approximately 250 mL/min.
Carbon Dioxide Transport

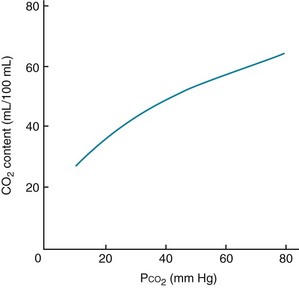
In the same way the oxyhemoglobin dissociation curve depicts the relationship between the PO2 and O2 content of blood, a curve can be constructed relating the total CO2 content to the PCO2 of blood. However, within the range of gas tensions encountered under physiologic circumstances, the PCO2–CO2 content relationship is almost linear compared with the curvilinear relationship of PO2 and O2 content (Fig. 1-6).
Ventilation-Perfusion Relationships
 ) to perfusion (
 ) is higher in apical regions of the lung than in basal regions. As a result, gas exchange throughout the lung is not uniform but varies depending on the
  ratio of each region.
 ) than for ventilation (
 ), so the
  ratio is lower in the dependent regions of the lung.
To understand the effects on gas exchange of altering the  ratio, first consider the individual alveolus and then the more complex model with multiple alveoli and variable
  ratios. In a single alveolus, a continuous spectrum exists for the possible relationships between
  and
and  (Fig. 1-7). At one extreme, where
  is maintained and
  approaches 0, the
  ratio approaches ∞. When there is actually no perfusion (
 = 0), ventilation is wasted insofar as gas exchange is concerned, and the alveolus is part of the dead space. At the other extreme,
  approaches 0 and
  is preserved, and the
  ratio approaches 0. When there is no ventilation (
 = 0), a “shunt” exists, oxygenation does not occur during transit through the pulmonary circulation, and the hemoglobin still is desaturated when it leaves the pulmonary capillary.
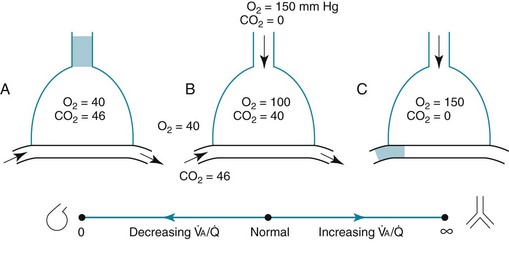
 = Ventilation-perfusion ratio.
  = ∞ (dead space) to
  = 0 (shunt).
 = ∞), P
 ratio approached but did not reach ∞—the blood also would have a P
 = 0), blood leaving the capillary has gas tensions identical to those in mixed venous blood. Normally, mixed venous blood has a P
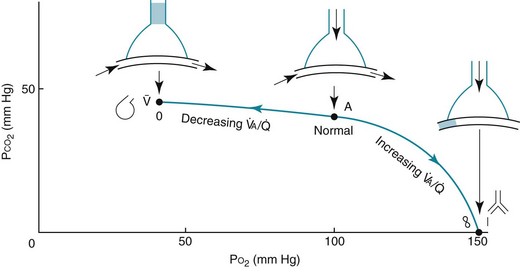
In reality, alveolar-capillary units fall anywhere along this continuum of  ratios. The higher the
  ratio in an alveolar-capillary unit, the closer the unit comes to behaving like an area of dead space and the more PO2 approaches 150 mm Hg and PCO2 approaches 0 mm Hg. The lower the
  ratio, the closer the unit comes to behaving like a shunt, and the more the PO2 and PCO2 of blood leaving the capillary approach the gas tensions in mixed venous blood (40 and 46 mm Hg, respectively). This continuum is depicted in Figure 1-8, in which moving to the left signifies decreasing the
  ratio, and moving to the right means increasing the
  ratio. The ideal circumstance lies between these extremes, in which PO2 = 100 mm Hg and PCO2 = 40 mm Hg.
 = 0 (shunt). At extreme right side of line,
  = ∞ (dead space). P
When multiple alveolar-capillary units are considered, the net PO2 and PCO2 of the resulting pulmonary venous blood returning to the left atrium depend on the total O2 or CO2 content and the total volume of blood collected from each of the contributing units. Considering PCO2 first, areas with relatively high  ratios contribute blood with a lower PCO2 than do areas with low
  ratios. Recall that the relationship between CO2 content and PCO2 is nearly linear over the physiologic range (see Fig. 1-6.) Therefore, if blood having a higher PCO2 and CO2 content mixes with an equal volume of blood having a lower PCO2 and CO2 content, an intermediate PCO2 and CO2 content (approximately halfway between) results.
 ratio and a high P
 ratio and low P
In marked contrast, a high PO2 in blood coming from a region with a high  ratio cannot compensate for blood with a low PO2 from a region with a low
  ratio. The difference stems from the shape of the oxyhemoglobin dissociation curve, which is curvilinear (rather than linear) and becomes nearly flat at the top (see Fig. 1-5). After hemoglobin is nearly saturated with O2 (on the relatively flat part of the oxyhemoglobin dissociation curve), increasing PO2 only contributes to the very small amount of oxygen dissolved in blood and does not significantly boost the O2 content. In other words, since most of the oxygen content in blood is due to O2 bound to hemoglobin, once the hemoglobin is fully saturated, blood with a higher than normal PO2 does not have a correspondingly higher O2 content and cannot compensate for blood with a low PO2 and low O2 content.
 ratio affect gas tensions in blood coming from specific regions, as well as gas tensions in the resulting arterial blood. At the apices, where the
  ratio is approximately 3.3, P
 ratio is approximately 0.63, P
 ratio, blood coming from this area has a low O2 content and saturation, which cannot be compensated for by blood from relatively preserved regions of lung.
  mismatch that is severe, particularly with areas of a high
  ratio, can effectively produce dead space and therefore decrease the alveolar ventilation to other areas of the lung carrying a disproportionate share of the perfusion. Because CO2 excretion depends on alveolar ventilation, P
Abnormalities in Gas Exchange
The net effect of disturbances in the normal pattern of gas exchange can be assessed by measurement of the gas tensions (PO2 and PCO2) in arterial blood. The information that can be obtained from arterial blood gas measurement is discussed further in Chapter 3, but the mechanisms of hypoxemia (decreased arterial PO2) and hypercapnia (increased PCO2) are considered here because they relate to the physiologic principles just discussed.
Hypoxemia
Blood that has traversed pulmonary capillaries leaves with a PO2 that should be in equilibrium with and almost identical to the PO2 in companion alveoli. Although it is difficult to measure the O2 tension in alveolar gas, it can be conveniently calculated by a formula known as the alveolar gas equation. A simplified version of this formula is relatively easy to use and can be extremely useful in the clinical setting, particularly when trying to deduce why a patient is hypoxemic. The alveolar O2 tension (PAO2)* can be calculated by Equation 1-8:

where FIO2 = fractional content of inspired O2 (FIO2 of air = 0.21), PB = barometric pressure (approximately 760 mm Hg at sea level), PH2O = vapor pressure of water in the alveoli (at full saturation at 37°C, PH2O = 47 mm Hg), PACO2 = alveolar CO2 tension (which can be assumed to be identical to arterial CO2 tension, PaCO2), and R = respiratory quotient (CO2 production divided by O2 consumption, usually approximately 0.8). In practice, for the patient breathing room air (FIO2 = 0.21), the equation often is simplified. When numbers are substituted for FIO2, PB, and PH2O and when PaCO2 is used instead of PACO2, the resulting equation (at sea level) is Equation 1-9:

1. Intracardiac lesions with a right-to-left shunt at the atrial or ventricular level (e.g., an atrial or ventricular septal defect). Note that although a left-to-right shunt can produce severe long-term cardiac consequences, it does not affect either AaDO2 or arterial PO2 because its net effect is to recycle already oxygenated blood through the pulmonary vasculature, not to dilute oxygenated blood with desaturated blood.
2. Structural abnormalities of the pulmonary vasculature that result in direct communication between pulmonary arterial and venous systems (e.g., pulmonary arteriovenous malformations).
3. Pulmonary diseases that result in filling of the alveolar spaces with fluid (e.g., pulmonary edema) or complete alveolar collapse. Either process can result in complete loss of ventilation to the affected alveoli, although some perfusion through the associated capillaries may continue.
Another cause of elevated AaDO2 is ventilation-perfusion mismatch. Even when total ventilation and total perfusion to both lungs are normal, if some areas receive less ventilation and more perfusion (low  ratio) while others receive more ventilation and less perfusion (high
  ratio), AaDO2 increases and hypoxemia results. As just mentioned, the reason for this phenomenon is that areas having a low
  ratio provide relatively desaturated blood with a low O2 content. Blood coming from regions with a high
  ratio cannot compensate for this problem because the hemoglobin is already fully saturated and cannot increase its O2 content further by increased ventilation (Fig. 1-9).
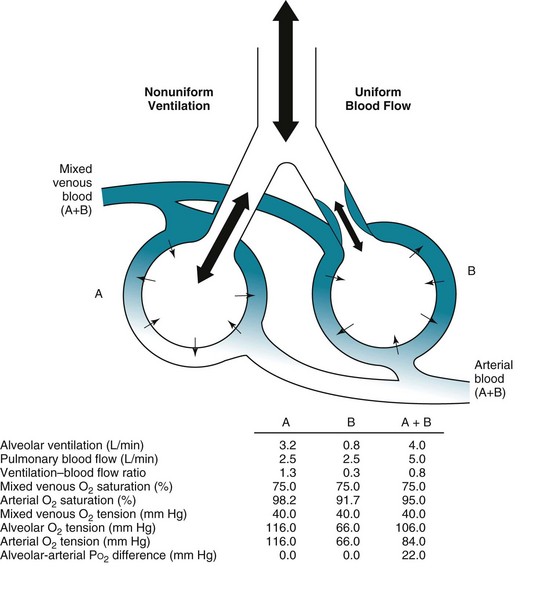
 mismatch in two-alveolus model. In this instance, perfusion is equally distributed between the two alveoli. Calculations demonstrate how
  mismatch lowers arterial P
 = 0) and
  mismatch (with areas of
  that are low but not 0) can be distinguished by having the patient inhale 100% O2. In the former case, increasing inspired P
 ratio, and arterial P
 mismatch or shunting also contributes to hypoxemia.
 mismatch
 mismatch but not with true shunting. In contrast, hypoventilation (identified by high Pa
 mismatch exists, any increase in P
Cotes, JE, Chinn, DJ, Miller, MR. Lung function: physiology, measurement and application in medicine, ed 6. Malden, MA: Blackwell; 2006.
Hsia, CC. Respiratory function of hemoglobin. N Engl J Med. 1998;338:239–247.
Lumb, A, Nunn, JF. Nunn’s applied respiratory physiology, ed 6. Oxford: Butterworth Heinemann; 2005.
Schwartzstein, RM, Parker, MJ. Respiratory physiology: a clinical approach. Philadelphia: Lippincott Williams & Wilkins; 2006.
Wagner, PD, Powell, FL, West, JB. Ventilation, blood flow, and gas exchange. In: Mason RJ, Murray JF, Broaddus VC, et al, eds. Textbook of respiratory medicine. ed 5. Philadelphia: WB Saunders; 2010:53–88.
Weibel, ER. The pathway for oxygen: structure and function in the mammalian respiratory system. Cambridge: Harvard University Press; 1984.
Weinberger, SE, Schwartzstein, RM, Weiss, JW. Hypercapnia. N Engl J Med. 1989;321:1223–1231.
West, JB. Respiratory physiology—the essentials, ed 9. Philadelphia: Lippincott Williams & Wilkins; 2012.
West, JB. Respiratory pathophysiology—the essentials, ed 8. Philadelphia: Lippincott Williams & Wilkins; 2013.
*By convention, a dot over a letter adds a time dimension. Hence,  stands for volume of expired gas per minute—that is, minute ventilation. Similar abbreviations used in this chapter are
  (volume of CO2 produced per minute) and
  (blood flow per minute).
*The units torr and mm Hg can be used interchangeably: 1 torr = 1 mm Hg.