[level-membership-for-cardiovascular-category]
Chapter 21 Approach to Wide QRS Complex Tachycardias
Clinical Considerations
Causes of Wide Complex Tachycardias
A narrow QRS complex requires rapid, highly synchronous electrical activation of the right ventricular (RV) and left ventricular (LV) myocardium, which can only be achieved through the specialized, rapidly conducting His-Purkinje system (HPS). A wide QRS complex implies less synchronous ventricular activation of longer duration, which can be due to intraventricular conduction disturbances (IVCDs), or ventricular activation not mediated by the His bundle (HB) but by a bypass tract (BT; preexcitation) or from a site within a ventricle (ventricular arrhythmias). IVCDs may be fixed and present at all heart rates, or they may be intermittent and related to either tachycardia or bradycardia. IVCDs can be caused by structural abnormalities in the HPS or ventricular myocardium or by functional refractoriness in a portion of the conduction system (i.e., aberrant ventricular conduction).1
Wide QRS complex tachycardia (WCT) is a rhythm with a rate of more than 100 beats/min and a QRS duration of more than 120 milliseconds. Several arrhythmias can manifest as WCTs (Table 21-1); the most common is ventricular tachycardia (VT), which accounts for 80% of all cases of WCT. Supraventricular tachycardia (SVT) with aberrancy accounts for 15% to 20% of WCTs. SVTs with bystander preexcitation and antidromic atrioventricular reentrant tachycardia (AVRT) account for 1% to 6% of WCTs.
| Cause | Description, Examples |
|---|---|
| VT | Macroreentrant VT Focal VT |
| SVT with aberrancy | Functional BBB Preexistent BBB |
| Preexcited SVT | Antidromic AVRT AT or AVNRT with bystander BT |
| Antiarrhythmic drugs | Class IA and IC agents, amiodarone |
| Electrolyte abnormalities | Hyperkalemia |
| Ventricular pacing |
AT = atrial tachycardia; AVNRT = atrioventricular nodal reentrant tachycardia; AVRT = atrioventricular reentrant tachycardia; BBB = bundle branch block; BT = bypass tract; SVT = supraventricular tachycardia; VT = ventricular tachycardia.
In the stable patient who will undergo a more detailed assessment, the goal of evaluation should include determination of the cause of the WCT (particularly distinguishing between VT and SVT). Accurate diagnosis of the WCT requires information obtained from the history, physical examination, response to certain maneuvers, and careful inspection of the electrocardiogram (ECG), including rhythm strips and 12-lead tracings. Comparison of the ECG during the tachycardia with that recorded during sinus rhythm, if available, can also provide useful information.2
Clinical History
Symptoms
Some patients with tachycardia can have few or no symptoms (e.g., palpitations, lightheadedness, diaphoresis), whereas others can have severe manifestations, including chest pain, dyspnea, syncope, seizures, and cardiac arrest. The severity of symptoms during a WCT is not useful in determining the tachycardia mechanism because symptoms are primarily related to the fast heart rate, associated heart disease, and the presence and extent of LV dysfunction, rather than to the mechanism of the tachycardia. It is important to recognize that VT does not necessarily result in hemodynamic compromise or collapse. Misdiagnosis of VT as SVT on the basis of hemodynamic stability is a common error that can lead to inappropriate and potentially dangerous therapy.2
Presence of Underlying Heart Disease
The presence of structural heart disease, especially coronary heart disease and a previous MI, strongly suggests VT as the cause of WCT. In one report, over 98% of patients with a previous MI had VT as the cause of WCT, whereas only 7% of those with SVT had had an MI. It should be realized, however, that VT can occur in patients with no apparent heart disease, and SVT can occur in those with structural heart disease.2
Medications
Many different medications have proarrhythmic effects. The most common drug-induced tachyarrhythmia is torsades de pointes. Frequently implicated agents include antiarrhythmic drugs such as sotalol and quinidine, and certain antimicrobial drugs such as erythromycin. Diuretics are a common cause of hypokalemia and hypomagnesemia, which can predispose to ventricular tachyarrhythmias, particularly torsades de pointes in patients taking antiarrhythmic drugs. Furthermore, class I antiarrhythmic drugs, especially class IC agents, slow conduction and have a property of use dependency, a progressive decrease in impulse conduction velocity at faster heart rates. As a result, these drugs can cause rate-related aberration and a wide QRS complex during any tachyarrhythmia. Digoxin can cause almost any cardiac arrhythmia, especially with increasing plasma digoxin concentrations above 2.0 ng/mL (2.6 mmol/L). Digoxin-induced arrhythmias are more frequent at any given plasma concentration if hypokalemia is also present. The most common digoxin-induced arrhythmias include monomorphic VT (often with a relatively narrow QRS complex), bidirectional VT (a regular alternation of two wide QRS morphologies, each with a different axis), and nonparoxysmal junctional tachycardia.2
Physical Examination
An important objective of the physical examination in the stable patient is to attempt to document the presence of atrioventricular (AV) dissociation. AV dissociation is present, although not always evident, in approximately 20% to 50% of patients with VT, but it is very rarely seen in SVT. Thus, the presence of AV dissociation strongly suggests VT, although its absence is less helpful. AV dissociation, if present, is typically diagnosed on ECG; however, it can produce a number of characteristic findings on physical examination. Intermittent cannon A waves may be observed on examination of the jugular pulsation in the neck, and they reflect simultaneous atrial and ventricular contraction; contraction of the right atrium (RA) against a closed tricuspid valve produces a transient increase in RA and jugular venous pressure. Cannon A waves must be distinguished from the continuous and regular prominent A waves seen during some SVTs. Such prominent waves result from simultaneous atrial and ventricular contraction occurring with every beat. Additionally, highly inconsistent fluctuations in the blood pressure can occur because of the variability in the degree of left atrial (LA) contribution to LV filling, stroke volume, and cardiac output. Moreover, variability in the occurrence and intensity of heart sounds (especially S1) can also be observed and is heard more frequently when the rate of the tachycardia is slower.2
Laboratory Tests
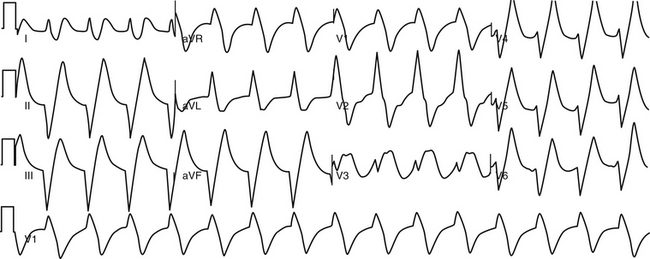
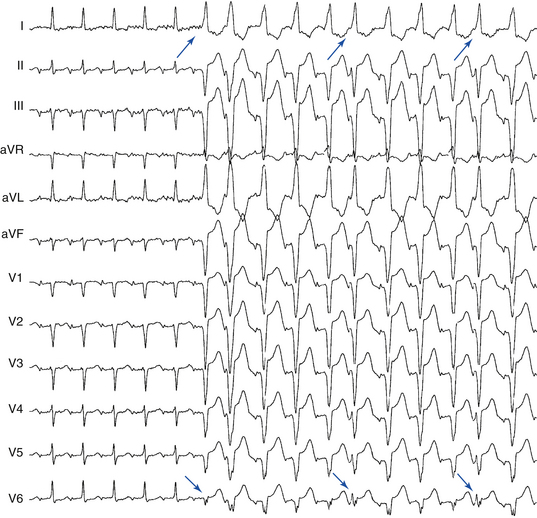
The plasma potassium and magnesium concentrations should be measured as part of the laboratory evaluation. Hypokalemia and hypomagnesemia can predispose to the development of ventricular tachyarrhythmias. Hyperkalemia can cause a wide QRS complex rhythm, usually with a slow rate, with loss of a detectable P wave (the so-called sinoventricular rhythm; Fig. 21-1) or abnormalities of AVN conduction. In patients taking digoxin, quinidine, or procainamide, plasma concentrations of these drugs should be measured to assist in evaluating possible drug toxicity.
Pharmacological Intervention
Unless the cause for the WCT is definitely established, however, verapamil, diltiazem, and probably adenosine should not be administered, because they have been reported to cause severe hemodynamic deterioration in patients with VT and can even provoke ventricular fibrillation (VF) and cardiac arrest. Direct current (DC) cardioversion in unstable patients and intravenous procainamide or amiodarone in hemodynamically stable patients are the appropriate management approach.2
Electrocardiographic Features
Ventricular Tachycardia Versus Aberrantly Conducted Supraventricular Tachycardia
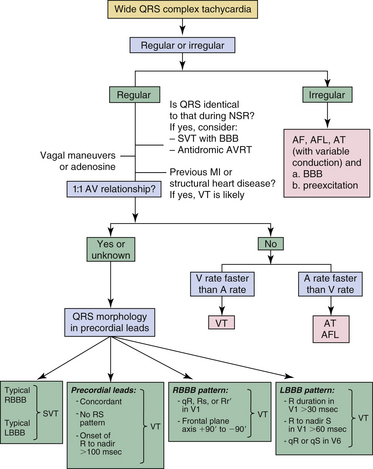
In general, most WCTs can be classified as having one of two patterns: a right bundle branch block (RBBB)–like pattern (QRS polarity is predominantly positive in leads V1 and V2) or a left bundle branch block (LBBB)–like pattern (QRS polarity is predominantly negative in leads V1 and V2). The determination that the WCT has an RBBB-like pattern or an LBBB-like pattern does not, by itself, assist in making a diagnosis; however, this assessment should be made initially because it is useful in evaluating several other features on the ECG, including the QRS axis, the QRS duration, and the QRS morphology (Table 21-2).
TABLE 21-2 Electrocardiographic Criteria Favoring Ventricular Tachycardia
| AV Relationship |
AV = atrioventricular; BBB = bundle branch block; LBBB = left bundle branch block; NSR = normal sinus rhythm; RBBB = right bundle branch block; WCT = wide complex tachycardia.
QRS Duration
A QRS duration more than 160 milliseconds is not helpful in identifying VT in several settings, including preexisting bundle branch block (BBB), although it is uncommon for the QRS to be wider than 160 milliseconds in this situation, preexcited SVT, and the presence of drugs capable of slowing intraventricular conduction (e.g., class IA and IC drugs). Of note, a QRS complex that is narrower during WCT than during normal sinus rhythm (NSR) suggests VT. However, this is rare, occurring in less than 1% of VTs.2
A recent report found that the QRS onset-to-peak time (also termed “R wave peak time” or “intrinsicoid deflection”) in lead II (measured from the beginning of the QRS to the first change of the polarity, independent of whether the QRS deflection is positive or negative) was significantly wider in VT compared with SVT with aberrancy, and a cutoff value of 50 milliseconds or greater identified VT with high sensitivity, specificity, and positive predictive values (93%, 99%, and 98%, respectively). However, this criterion has not been tested prospectively or validated in patients with preexisting conduction system disease, antiarrhythmic drug therapy, electrolyte imbalance, prior MI, and preexcited tachycardias. Additionally, certain types of VTs such as fascicular VT, bundle branch reentrant (BBR) VT, and septal myocardial VT, can have a shorter QRS onset-to-peak time because of their origin within or in close proximity to the His-Purkinje network.1,3
QRS Axis
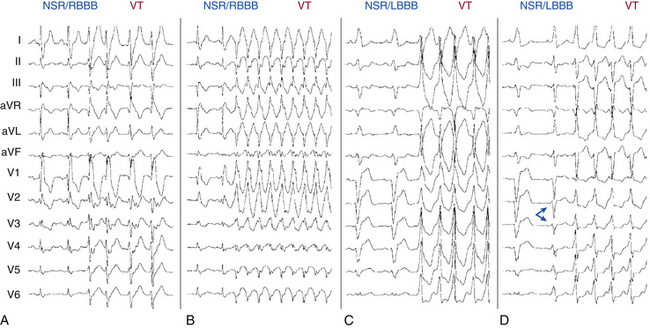
Generally, the more leftward the axis, the greater the likelihood of VT. A significant axis shift (>40 degrees) between the baseline NSR and WCT is suggestive of VT (Fig. 21-2A). A right superior (“northwest”) axis (axis from –90 degrees to ±180 degrees) is rare in SVT and strongly suggests VT (see Fig. 21-2B).2
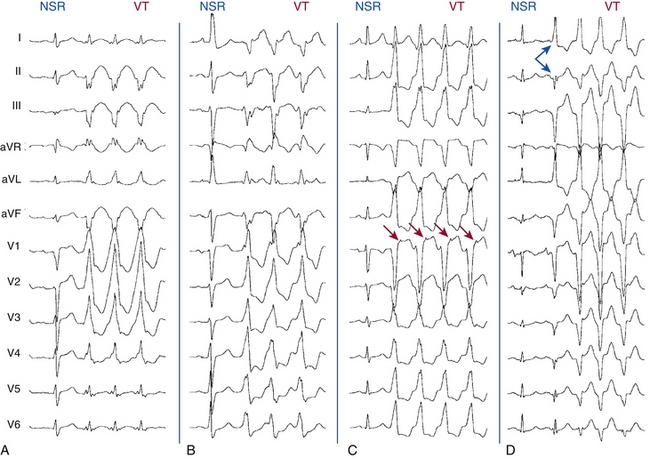
In a patient with an RBBB-like WCT, a QRS axis to the left of –30 degrees suggests VT (see Fig. 21-2A) and, in a patient with an LBBB-like WCT, a QRS axis to the right of +90 degrees suggests VT. Additionally, RBBB with a normal axis is uncommon in VT (<3%) and is suggestive of SVT.
Precordial QRS Concordance
Concordance is present when the QRS complexes in the six precordial leads (V1 through V6) are either all positive in polarity (tall R waves) or all negative in polarity (deep QS complexes). Negative concordance is strongly suggestive of VT (see Fig. 21-2D). Rarely, SVT with LBBB aberrancy will demonstrate negative concordance, but there is almost always some evidence of an R wave in the lateral precordial leads. Positive concordance is most often caused by VT (see Fig. 21-2A); however, this pattern may also be caused by preexcited SVT using a left posterior BT. Although the presence of precordial QRS concordance strongly suggests VT (>90% specificity), its absence is not helpful diagnostically (approximately 20% sensitivity).
Atrioventricular Dissociation
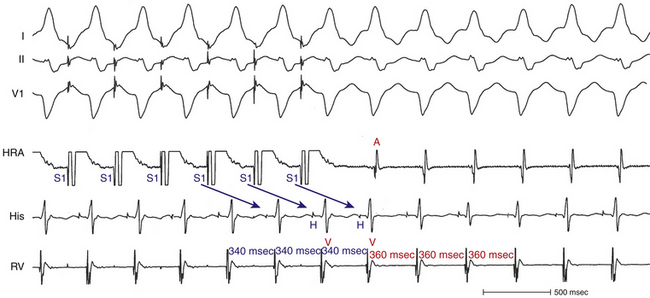
AV dissociation is the hallmark of VT (specificity is almost 100%). However, although the presence of AV dissociation establishes VT as the cause, its absence is not as helpful (sensitivity is 20% to 50%). AV dissociation can be present but not obvious on the surface ECG because of a rapid ventricular rate. Additionally, AV dissociation is absent in a large subset of VTs; in fact, approximately 30% of VTs have 1:1 retrograde ventriculoatrial (VA) conduction (see Fig. 21-2D) and an additional 15% to 20% have second-degree (2:1 or Wenckebach) VA block (Fig. 21-3).2
Dissociated P Waves
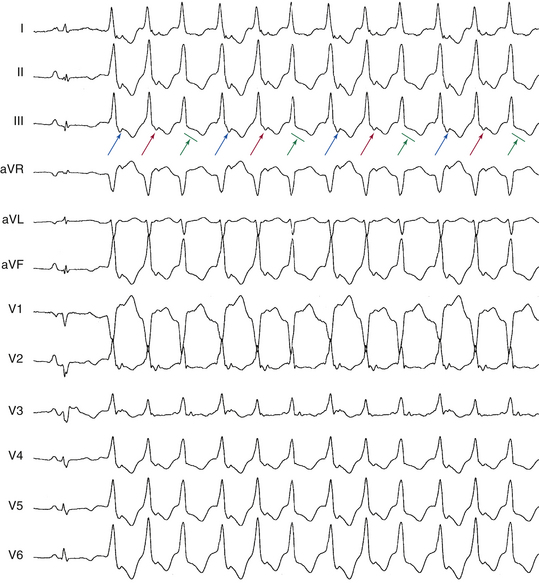
When the P waves can be clearly seen and the atrial rate is unrelated to and slower than the ventricular rate, AV dissociation consistent with VT is present (Fig. 21-4). An atrial rate faster than the ventricular rate is more often seen with SVT having AV conduction block. However, during a WCT, the P waves are often difficult to identify; they can be superimposed on the ST segment or T wave (resulting in altered morphology). Sometimes, the T waves and initial or terminal QRS portions can resemble atrial activity. Furthermore, artifacts can be mistaken for P waves. If the P waves are not obvious or suggested on the ECG, several alternative leads or modalities can help in their identification, including a modified chest lead placement (Lewis leads), an esophageal lead (using an electrode wire or nasogastric tube), a right atrial recording (obtained by an electrode catheter in the RA), carotid sinus pressure (to slow VA conduction and therefore change the atrial rate in the case of VT), or invasive electrophysiological (EP) testing.
Fusion Beats
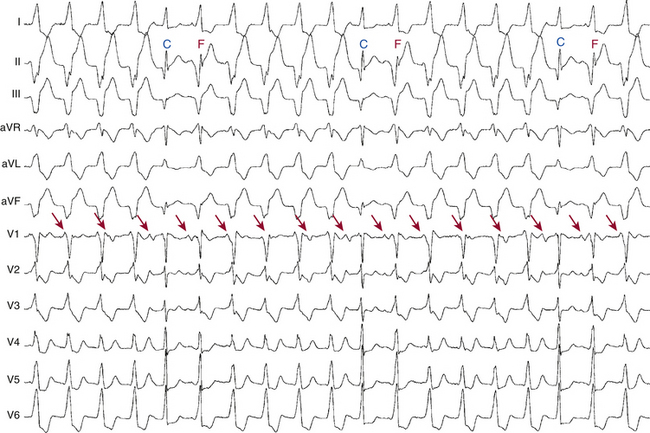
Ventricular fusion occurs when a ventricular ectopic beat and a supraventricular beat (conducted via the AVN and HPS) simultaneously activate the ventricular myocardium. The resulting QRS complex has a morphology intermediate between the appearance of a sinus QRS complex and that of a purely ventricular complex. Intermittent fusion beats during a WCT are diagnostic of AV dissociation and therefore of VT (see Fig. 21-4). It is also possible for premature ventricular complexes (PVCs) during SVT with aberration to produce fusion beats, which would erroneously be interpreted as evidence of AV dissociation and VT.
Dressler Beats
A Dressler beat (capture beat) is a normal QRS complex identical to the sinus QRS complex, occurring during the VT at a rate faster than the VT. The term capture beat indicates that the normal conduction system has momentarily captured control of ventricular activation from the VT focus (see Fig. 21-4). Fusion and capture beats are more commonly seen when the tachycardia rate is slower. These beats do not alter the rate of the VT, although a change in the preceding and subsequent RR intervals may be observed.
QRS Morphology
As noted, WCTs can be classified as having an RBBB-like pattern or an LBBB-like pattern. Certain features of the QRS complex have been described that favor VT in RBBB-like or LBBB-like WCTs (Fig. 21-5).2
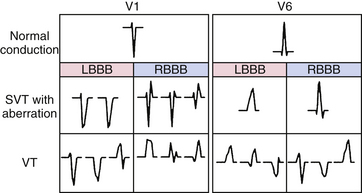
In the patient with a WCT and positive QRS polarity in lead V1 (RBBB pattern), a monophasic R, biphasic qR complex, or broad R (>40 milliseconds) in lead V1 favors VT (Fig. 21-6), whereas a triphasic RSR′, rSr′, rR′, or rSR′ complex in lead V1 favors SVT (where the capital letter indicates large-wave amplitude, duration, or both; and the lowercase letter indicates small-wave amplitude, duration, or both; see Fig. 21-5). Additionally, a double-peaked R wave in lead V1 favors VT if the left peak is taller than the right peak (the so-called rabbit ear sign; likelihood ratio > 50:1). A taller right rabbit ear does not help in distinguishing SVT from VT. On the other hand, an rS complex in lead V6 is a strong predictor of VT (likelihood ratio > 50:1), whereas an Rs complex in lead V6 favors SVT (see Fig. 21-6).
In the patient with a WCT and a negative QRS polarity in lead V1 (LBBB pattern), a broad initial R wave of 40 milliseconds or more in lead V1 or V2 favors VT, whereas the absence of an initial R wave (or a small initial R wave of < 40 milliseconds) in lead V1 or V2 favors SVT (see Fig. 21-6). Additionally, an R wave in lead V1 during a WCT taller than that during NSR favors VT. Furthermore, a slow descent to the nadir of the S wave, notching in the downstroke of the S wave, or an RS interval (from the onset of the QRS complex to the nadir of the S wave) of more than 70 milliseconds in lead V1 or V2 favors VT. In contrast, a swift, smooth downstroke of the S wave in lead V1 or V2 with an RS interval of less than 70 milliseconds favors SVT. In an analysis of several studies, the presence of any of these three criteria in lead V1 (broad R wave, slurred or notched downstroke of the S wave, and delayed nadir of S wave) was a strong predictor of VT (likelihood ratio > 50:1). The QRS morphology in lead V6 is also of value; the presence of any Q or QS wave in lead V6 favors VT (likelihood ratio > 50:1; see Fig. 21-2D), whereas the absence of a Q wave in lead V6 favors SVT.
When an old 12-lead surface ECG is available, comparison of the QRS morphology during NSR and WCT is helpful. Contralateral BBB in WCT and NSR strongly favors VT (see Fig. 21-6C and D). It is important to note that identical QRS morphology during NSR and WCT, although strongly suggestive of SVT, can also occur in bundle branch reentrant (BBR) and interfascicular reentrant VTs.
Variation in QRS and ST-T Morphology
Subtle, non–rate-related fluctuations or variations in the QRS and ST-T wave configuration suggest VT and reflect variations in the VT reentrant circuit within the myocardium. In contrast, because most SVTs follow fixed conduction pathways, they are generally characterized by complete uniformity of QRS and ST-T shape, unless the tachycardia rate changes.
Algorithms for the ECG Diagnosis of Wide Complex Tachycardia
The various criteria for the diagnosis of WCT listed are difficult to apply in isolation, because most patients will have some, but not all, of the features described. Several algorithms have been proposed to guide integrating ECG findings into a diagnostic strategy. Figure 21-7 illustrates an example of one approach. The effect of history of prior MI, preexcited tachycardias, antiarrhythmic medication usage, precordial lead placement, heart transplantation status, and the presence of congenital heart disease on QRS morphology criteria should be taken into account while applying these elements. Preexcited tachycardias may not be differentiated consistently with the proposed criteria, especially those using epicardial left-sided paraseptal or left-sided inferoposterior BTs.
Algorithm 1
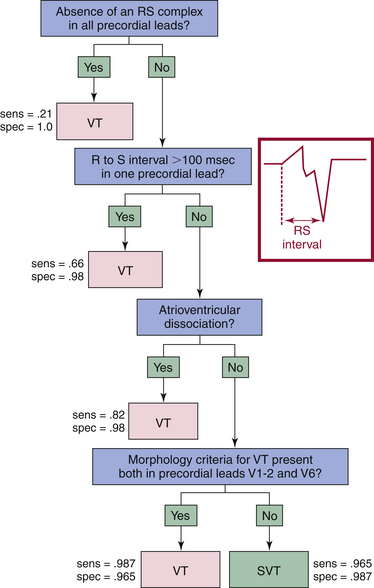
The most commonly used algorithm is the so-called Brugada algorithm or Brugada criteria. The Brugada algorithm consists of four steps (Fig. 21-8). First, all precordial leads are inspected to detect the presence or absence of an RS complex (with R and S waves of any amplitude). If an RS complex cannot be identified in any precordial lead, the diagnosis of VT can be made with 100% specificity. Second, if an RS complex is clearly identified in one or more precordial leads, the interval between the onset of the R wave and the nadir of the S wave (the RS interval) is measured. The longest RS interval is considered if RS complexes are present in multiple precordial leads. If the longest RS interval is more than 100 milliseconds, the diagnosis of VT can be made with a specificity of 98% (see Fig. 21-8). Third, if the longest RS interval is less than 100 milliseconds, either VT or SVT still is possible and the presence or absence of AV dissociation must therefore be determined. Evidence of AV dissociation is 100% specific for the diagnosis of VT, but this finding has a low sensitivity. Fourth, if the RS interval is less than 100 milliseconds and AV dissociation cannot clearly be demonstrated, the QRS morphology criteria for V1-positive and V1-negative WCTs are considered. The QRS morphology criteria consistent with VT must be present in lead V1 or V2 and in lead V6 to diagnose VT. A supraventricular origin of the tachycardia is assumed if either the V1 and V2 or V6 criteria are not consistent with VT.
Algorithm 2
A newer algorithm for differential diagnosis of WCT was analyzed in 453 monomorphic WCTs recorded from 287 patients, based on the following: (1) the presence of AV dissociation; (2) the presence of an initial R wave in lead aVR; (3) QRS morphology; and (4) estimation of the initial (Vi) and terminal (Vt) ventricular activation velocity ratio (Vi/Vt), determined by measuring the voltage change on the ECG tracing during the initial 40 milliseconds (Vi) and the terminal 40 milliseconds (Vt) of the same biphasic or multiphasic QRS complex (Fig. 21-9).4,5
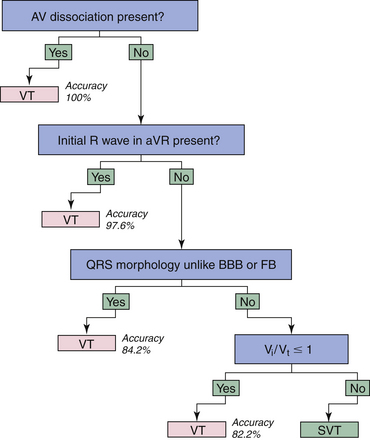
Antiarrhythmic drugs that impair conduction in the HPS, ventricular myocardium, or both (e.g., class I drugs and amiodarone) would be expected to decrease the Vi and Vt approximately to the same degree; therefore, the Vi/Vt ratio should not change significantly. Although the Vi/Vt ratio reflects the electrophysiology of many VTs, there are a number of exceptions to these criteria. First, disorders involving the myocardium locally can alter the Vi or Vt. For example, a decreased Vi with unchanged Vt can be present in the case of an SVT occurring in the presence of an anteroseptal MI, leading to the misdiagnosis of VT. Similarly, a scar situated at a late activated ventricular site can result in a decreased Vt in the presence of VT, leading to the misdiagnosis of SVT. Second, in the case of a fascicular VT, the Vi is not slower than the Vt. Third, if the exit site of the VT reentry circuit is very close to the HPS, it might result in a relatively narrow QRS complex and the slowing of the Vi can last for such a short time that it cannot be detected by the surface ECG.
Algorithm 3
The positive aVR criterion in algorithm 2 suggesting VT was further tested in 483 WCTs in 313 patients, and another algorithm based solely on QRS morphology in lead aVR was developed for distinguishing VT from SVT (Fig. 21-10).6 The new aVR algorithm is based solely on the principle of differences in the direction and velocity of the initial and terminal ventricular activation during WCT caused by VT and SVT. During SVT with BBB, both the initial rapid septal activation, which can be either left to right or right to left, and the later main ventricular activation wavefront proceed in a direction away from lead aVR, yielding a negative QRS complex in lead aVR. An exception to this generalization occurs in the presence of an inferior MI; an initial r wave (Rs complex) may be seen in lead aVR during NSR or SVT because of the loss of initial inferiorly directed forces. An rS complex also may be present as a normal variant in lead aVR, but with an R/S ratio less than 1. With these considerations, an initial dominant R wave should not be present in SVT with BBB, and its presence suggests VT, typically arising from the inferior or apical region of the ventricles.
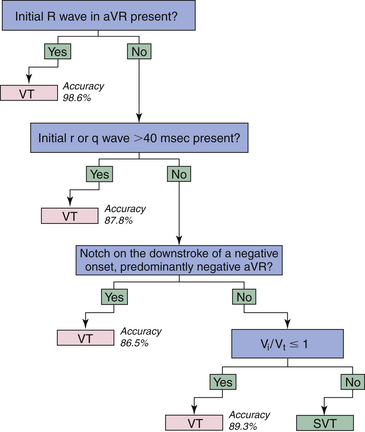
Furthermore, VTs originating from sites other than the inferior or apical wall of the ventricles, but not showing an initial R wave in aVR, should yield a slow, initially upward vector component of variable size pointing toward lead aVR (absent in SVT), even if the main vector in these VTs points downward, yielding a totally or predominantly negative QRS in lead aVR. Thus, in VT without an initial R wave in lead aVR, the initial part of the QRS in lead aVR should be less steep because of the slower initial ventricular activation having an initially upward vector component, which may be manifested as an initial r or q wave with a width more than 40 milliseconds, a notch on the downstroke of the QRS, or a slower ventricular activation during the initial 40 milliseconds than during the terminal 40 milliseconds of the QRS (Vi/Vt ≤ 1) in lead aVR. In contrast, in SVT with BBB, the initial part of the QRS in lead aVR is steeper (fast) because of the invariably rapid septal activation going away from lead aVR, resulting in a narrow (≤40 milliseconds) initial r or q wave and Vi/Vt more than 1.6
The overall accuracy of the aVR algorithm was 91.5%, which is similar to algorithm 2 and superior to the Brugada algorithm (90.3% and 84.8%, respectively). The inability of the aVR algorithm to differentiate preexcited tachycardias from VTs, with the possible exception of the presence of an initial R wave in lead aVR, is a limitation of the algorithm.6
Ventricular Tachycardia Versus Preexcited Supraventricular Tachycardia
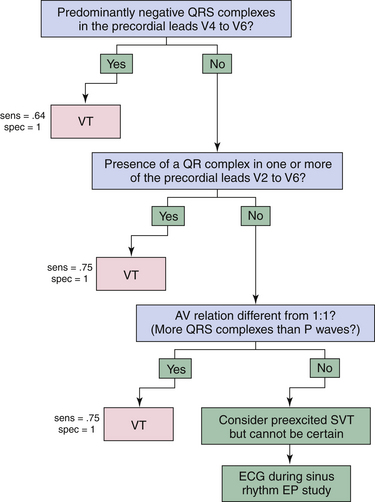
Differentiation between VT and preexcited SVT is particularly difficult, because ventricular activation begins outside the normal intraventricular conduction system in both tachycardias (see Fig. 12-6). As a result, algorithms for WCT, like QRS morphology criteria, tend to misclassify SVTs with preexcitation as VT. However, preexcitation is an uncommon cause of WCT, particularly if other factors, such as age and past medical history, suggest another diagnosis. For cases in which preexcitation is thought to be likely, such as a young patient without structural heart disease, or a patient with a known BT, a separate algorithm has been developed by Brugada and colleagues (Fig. 21-11). This algorithm consists of three steps. First, the predominant polarity of the QRS complex in leads V4 through V6 is defined as positive or negative. If predominantly negative, the diagnosis of VT can be made with 100% specificity. Second, if the polarity of the QRS complex is predominantly positive in V4 through V6, the ECG should be examined for the presence of a qR complex in one or more of precordial leads V2 through V6. If a qR complex can be identified, VT can be diagnosed with a specificity of 100%. Third, if a qR wave in leads V2 through V6 is absent, the AV relationship is then evaluated. If a 1:1 AV relationship is not present and there are more QRS complexes present than P waves, VT can be diagnosed with a specificity of 100%.
Electrophysiological Testing
Induction of Tachycardia
The mode of induction cannot distinguish between SVT and VT. Both atrial and ventricular stimulation may induce SVT or VT. VTs that can be induced with atrial pacing include verapamil-sensitive VT, adenosine-sensitive VT, and BBR VT.7
Tachycardia Features
His Bundle–Ventricular Interval
When the His bundle–ventricular (HV) interval is positive (i.e., the His potential precedes the QRS onset), an HV interval during the WCT shorter than that during NSR (HVWCT < HVNSR) indicates VT or preexcited SVT. In contrast, an HVWCT equal to or longer than HVNSR indicates SVT with aberrancy, BBR VT, or (rarely) other VTs (see Figs. 18-24 and 26-3).7,8
When the HV interval is negative (i.e., the His potential follows the QRS onset), BBR VT and SVT with aberrancy are excluded. However, myocardial VTs and preexcited SVT generally have negative HV intervals (see Figs. 18-3 and 22-10).
Oscillation in the Tachycardia Cycle Length
Variations in the tachycardia CL (the V-V intervals) that are dictated and preceded by similar variations in the A-A or H-H intervals are suggestive of SVT with aberrancy or BBR VT (Fig. 21-12). In contrast, variations in the V-V intervals that predict the subsequent H-H interval changes are consistent with myocardial VT or preexcited SVT.
His Bundle–Right Bundle Branch Potential Sequence
When both the HB and right bundle branch (RB) potentials are recorded, an HB-RB-V activation sequence occurs in SVT with aberrancy and BBR VT with an LBBB pattern. In either case, the HB-RB interval during WCT is equal to or longer than that in NSR. On the other hand, an RB-HB-V activation sequence occurs in antidromic AVRT using an atriofascicular or right-sided BT, the uncommon type of BBR VT with RBBB pattern, or myocardial VT originating in the RV. An RB-V-HB activation sequence occurs in antidromic AVRT using atriofascicular BT, and a V-RB-HB or a V-HB-RB activation sequence can occur in VT.7
Atrioventricular Relationship
A 1:1 AV relationship can occur in VT and SVT. When the atrial rate is faster than the ventricular rate, VT is unlikely, except in the rare case of coexistent atrial and ventricular tachycardias (Fig. 21-13). In contrast, when the ventricular rate is faster than the atrial rate, VT is more likely, except for the rare case of junctional tachycardia or AVNRT with VA block in an upper common pathway.
Diagnostic Maneuvers during Tachycardia
Atrial Extrastimulation
An atrial extrastimulus (AES), regardless of its timing, that advances the next ventricular activation with similar QRS morphology to that of the WCT excludes VT (see Fig. 18-28). Also, an AES (regardless of its timing) that delays the next ventricular activation excludes VT (see Fig. 19-4).
With a late-coupled AES delivered when the AV junctional portion of the atrium is refractory, if the AES advances the next ventricular activation, it proves the presence of an anterogradely conducting AV BT and excludes any arrhythmia mechanism that involves anterograde conduction over the AVN in the absence of a bystander BT. Moreover, if the AES advances the next ventricular activation with similar QRS morphology as that of the WCT, it proves that the BT is mediating ventricular activation during the WCT (as an integral part of the SVT circuit or as a bystander) and that the WCT is a preexcited SVT, and VT is excluded. Additionally, if the AES advances the timing of both the next ventricular activation and the subsequent atrial activation, it proves that the SVT is an antidromic AVRT using an atrioventricular or atriofascicular BT anterogradely, and excludes preexcited AVNRT and VT (see Fig. 18-28). Also, if the AES delays the next ventricular activation, it proves that the SVT is an antidromic AVRT using an atrioventricular or atriofascicular BT anterogradely, and excludes preexcited AVNRT and VT (see Fig. 19-4).7,9,10
Atrial Pacing
The ability to entrain the WCT with atrial pacing can occur in VT and SVT. However, the ability to entrain the WCT with similar QRS morphology to that of the WCT (i.e., entrainment with concealed QRS fusion) excludes myocardial VT, but can occur in BBR VT and is typical for SVT. Additionally, atrial entrainment of WCT with manifest QRS fusion can occur in VT in the presence of a bystander BT, or in AVRT with multiple BTs, but not in antidromic AVRT without another BT, nor in SVT with aberrancy.9
The ability to dissociate the atrium with rapid atrial pacing without influencing the tachycardia CL (V-V interval) or QRS morphology suggests VT and excludes preexcited SVTs, AT with aberrancy, and orthodromic AVRT with aberrancy. However, it does not exclude the rare case of AVNRT with aberrancy associated with anterograde block in an upper common pathway during rapid atrial pacing.
The response to atrial overdrive pacing during WCTs with a 1:1 AV relationship can help distinguish VT from SVT. The concept is analogous to examination of the response to ventricular overdrive pacing during narrow complex tachycardia. During VT, atrial overdrive pacing at a CL 20 to 60 milliseconds shorter than the tachycardia CL with 1:1 AV conduction results in anterograde capture with changing or narrowing of the tachycardia QRS morphology. When the tachycardia resumes after cessation of pacing, the earliest event (after the last reset ventricular complex) occurs in the ventricle because the atrium is being passively driven by the ventricle during the tachycardia. This results in a “V-V-A response.” On the contrary, during antidromic AVRT or aberrantly conducted SVT, anterograde conduction occurs over a BT or AVN; and on cessation of atrial pacing, the last reset ventricular activation conducts to the atrium over the retrograde limb of the circuit, resulting in a “V-A response” and continuation of the tachycardia. This pacing maneuver is not useful when 1:1 AV conduction during atrial pacing is absent. Thus, when determining the response after atrial pacing during WCT, the presence of 1:1 VA conduction must be confirmed. Isorhythmic AV dissociation can mimic 1:1 AV conduction, especially when the pacing train is not long enough or the pacing CL is too slow. It is also important to ensure that atrial pacing does not terminate the tachycardia.9,10
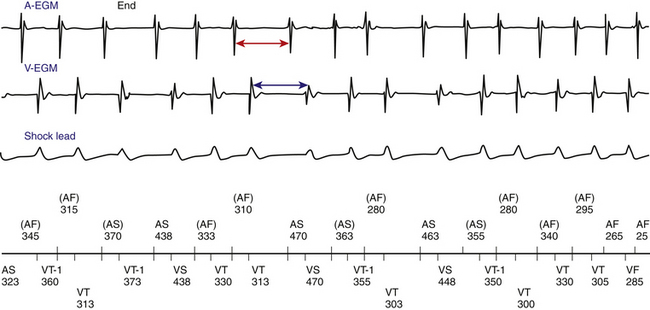
A “pseudo–V-V-A response” can occur during SVTs associated with a long AV interval during atrial pacing (Fig. 21-14). Because anterograde conduction during atrial pacing occurs through the slow AVN pathway, the AV interval can be longer than the pacing CL (A-A interval), so that the last paced P wave is followed first by the QRS complex resulting from slow AV conduction of the preceding paced atrial beat, and then by the QRS complex resulting from the last paced P wave. Careful examination of the last QRS complex that resulted from AV conduction during atrial pacing helps avoid this potential pitfall; the last reset QRS complex characteristically occurs at an R-R interval equal to the atrial pacing CL, whereas the first tachycardia QRS complex usually occurs at a different return CL. Furthermore, a “pseudo–A-V response” can theoretically occur in the setting BBR VT or in those with intra- or interfascicular reentrant VT, whereby the return atrial impulse may precede the first non-reset QRS complex.9,10
Ventricular Extrastimulation
A VES that resets (advances or delays) the next QRS without affecting the A-A interval is consistent with VT and practically excludes SVT. Furthermore, a VES that terminates the WCT without conduction to the atrium excludes AT and AVRT, is consistent with VT, but can also occur in AVNRT. In addition, a VES delivered when the HB is refractory and that terminates the WCT without atrial activation excludes SVT and is consistent with VT, although it can occur in orthodromic AVRT with aberrant conduction or in antidromic AVRT using a second BT as the retrograde limb of the circuit.7
Ventricular Pacing
When overdrive ventricular pacing during the WCT fails to accelerate the atrial CL to the pacing CL (i.e., the ventricles are dissociated from the tachycardia), VT and AVRT are excluded, AT is the most likely diagnosis, but AVNRT is still possible (Fig. 21-15). Additionally, entrainment with manifest QRS fusion can occur in VT or AVRT but excludes AT and AVNRT, whereas entrainment with concealed fusion excludes SVT with aberrancy. Additionally, entrainment from the RV apex followed by a post-pacing interval (PPI) that is equal (within 30 milliseconds) to the tachycardia CL excludes AVNRT, AT, and myocardial VT, but can occur with BBR VT and AVRT using a right-sided BT.
1. Surawicz B., Childers R., Deal B.J., et al. AHA/ACCF/HRS recommendations for the standardization and interpretation of the electrocardiogram. III. Intraventricular conduction disturbances: a scientific statement from the American Heart Association Electrocardiography and Arrhythmias Committee, Council on Clinical Cardiology; the American College of Cardiology Foundation; and the Heart Rhythm Society. Endorsed by the International Society for Computerized Electrocardiology. J Am Coll Cardiol. 2009;53:976-981.
2. Miller J.M., Das M.K. Differential diagnosis of wide QRS complex tachycardia. In: Zipes D.P., Jalife J., editors. Cardiac electrophysiology: from cell to bedside. ed 5. Philadelphia: WB Saunders; 2009:823-830.
3. Pava L.F., Perafan P., Badiel M., et al. R-wave peak time at DII: a new criterion for differentiating between wide complex QRS tachycardias. Heart Rhythm. 2010;7:922-926.
4. Vereckei A., Duray G., Szénási G., et al. Application of a new algorithm in the differential diagnosis of wide QRS complex tachycardia. Eur Heart J. 2007;28:589-600.
5. Dendi R., Josephson M.E. A new algorithm in the differential diagnosis of wide complex tachycardia. Eur Heart J. 2007;28:525-526.
6. Vereckei A., Duray G., Szénási G., et al. New algorithm using only lead aVR for differential diagnosis of wide QRS complex tachycardia. Heart Rhythm. 2008;5:89-98.
7. Josephson M.E. Recurrent ventricular tachycardia. In: Josephson M.E., editor. Clinical cardiac electrophysiology. ed 4. Philadelphia: Lippincott Williams & Wilkins; 2008:446-642.
8. Daoud E.G. Bundle branch reentry. In: Zipes D.P., Jalife J., editors. Cardiac electrophysiology: from cell to bedside. ed 4. Philadelphia: WB Saunders; 2004:683-686.
9. Abdelwahab A., Gardner M.J., Basta M.N., et al. A technique for the rapid diagnosis of wide complex tachycardia with 1:1 AV relationship in the electrophysiology laboratory. Pacing Clin Electrophysiol. 2009;32:475-483.
10. Badhwar N., Scheinman M.M. Electrophysiological diagnosis of wide complex tachycardia. Pacing Clin Electrophysiol. 2009;32:473-474.
[/level-membership-for-cardiovascular-category][not-level-membership-for-cardiovascular-category]
Chapter 21 Approach to Wide QRS Complex Tachycardias
Clinical Considerations
Causes of Wide Complex Tachycardias
A narrow QRS complex requires rapid, highly synchronous electrical activation of the right ventricular (RV) and left ventricular (LV) myocardium, which can only be achieved through the specialized, rapidly conducting His-Purkinje system (HPS). A wide QRS complex implies less synchronous ventricular activation of longer duration, which can be due to intraventricular conduction disturbances (IVCDs), or ventricular activation not mediated by the His bundle (HB) but by a bypass tract (BT; preexcitation) or from a site within a ventricle (ventricular arrhythmias). IVCDs may be fixed and present at all heart rates, or they may be intermittent and related to either tachycardia or bradycardia. IVCDs can be caused by structural abnormalities in the HPS or ventricular myocardium or by functional refractoriness in a portion of the conduction system (i.e., aberrant ventricular conduction).1
Wide QRS complex tachycardia (WCT) is a rhythm with a rate of more than 100 beats/min and a QRS duration of more than 120 milliseconds. Several arrhythmias can manifest as WCTs (Table 21-1); the most common is ventricular tachycardia (VT), which accounts for 80% of all cases of WCT. Supraventricular tachycardia (SVT) with aberrancy accounts for 15% to 20% of WCTs. SVTs with bystander preexcitation and antidromic atrioventricular reentrant tachycardia (AVRT) account for 1% to 6% of WCTs.
| Cause | Description, Examples |
|---|---|
| VT | Macroreentrant VT Focal VT |
| SVT with aberrancy | Functional BBB Preexistent BBB |
| Preexcited SVT | Antidromic AVRT AT or AVNRT with bystander BT |
| Antiarrhythmic drugs | Class IA and IC agents, amiodarone |
| Electrolyte abnormalities | Hyperkalemia |
| Ventricular pacing |
AT = atrial tachycardia; AVNRT = atrioventricular nodal reentrant tachycardia; AVRT = atrioventricular reentrant tachycardia; BBB = bundle branch block; BT = bypass tract; SVT = supraventricular tachycardia; VT = ventricular tachycardia.
In the stable patient who will undergo a more detailed assessment, the goal of evaluation should include determination of the cause of the WCT (particularly distinguishing between VT and SVT). Accurate diagnosis of the WCT requires information obtained from the history, physical examination, response to certain maneuvers, and careful inspection of the electrocardiogram (ECG), including rhythm strips and 12-lead tracings. Comparison of the ECG during the tachycardia with that recorded during sinus rhythm, if available, can also provide useful information.2
Clinical History
Symptoms
Some patients with tachycardia can have few or no symptoms (e.g., palpitations, lightheadedness, diaphoresis), whereas others can have severe manifestations, including chest pain, dyspnea, syncope, seizures, and cardiac arrest. The severity of symptoms during a WCT is not useful in determining the tachycardia mechanism because symptoms are primarily related to the fast heart rate, associated heart disease, and the presence and extent of LV dysfunction, rather than to the mechanism of the tachycardia. It is important to recognize that VT does not necessarily result in hemodynamic compromise or collapse. Misdiagnosis of VT as SVT on the basis of hemodynamic stability is a common error that can lead to inappropriate and potentially dangerous therapy.2
Presence of Underlying Heart Disease
The presence of structural heart disease, especially coronary heart disease and a previous MI, strongly suggests VT as the cause of WCT. In one report, over 98% of patients with a previous MI had VT as the cause of WCT, whereas only 7% of those with SVT had had an MI. It should be realized, however, that VT can occur in patients with no apparent heart disease, and SVT can occur in those with structural heart disease.2
Medications
Many different medications have proarrhythmic effects. The most common drug-induced tachyarrhythmia is torsades de pointes. Frequently implicated agents include antiarrhythmic drugs such as sotalol and quinidine, and certain antimicrobial drugs such as erythromycin. Diuretics are a common cause of hypokalemia and hypomagnesemia, which can predispose to ventricular tachyarrhythmias, particularly torsades de pointes in patients taking antiarrhythmic drugs. Furthermore, class I antiarrhythmic drugs, especially class IC agents, slow conduction and have a property of use dependency, a progressive decrease in impulse conduction velocity at faster heart rates. As a result, these drugs can cause rate-related aberration and a wide QRS complex during any tachyarrhythmia. Digoxin can cause almost any cardiac arrhythmia, especially with increasing plasma digoxin concentrations above 2.0 ng/mL (2.6 mmol/L). Digoxin-induced arrhythmias are more frequent at any given plasma concentration if hypokalemia is also present. The most common digoxin-induced arrhythmias include monomorphic VT (often with a relatively narrow QRS complex), bidirectional VT (a regular alternation of two wide QRS morphologies, each with a different axis), and nonparoxysmal junctional tachycardia.2
Physical Examination
An important objective of the physical examination in the stable patient is to attempt to document the presence of atrioventricular (AV) dissociation. AV dissociation is present, although not always evident, in approximately 20% to 50% of patients with VT, but it is very rarely seen in SVT. Thus, the presence of AV dissociation strongly suggests VT, although its absence is less helpful. AV dissociation, if present, is typically diagnosed on ECG; however, it can produce a number of characteristic findings on physical examination. Intermittent cannon A waves may be observed on examination of the jugular pulsation in the neck, and they reflect simultaneous atrial and ventricular contraction; contraction of the right atrium (RA) against a closed tricuspid valve produces a transient increase in RA and jugular venous pressure. Cannon A waves must be distinguished from the continuous and regular prominent A waves seen during some SVTs. Such prominent waves result from simultaneous atrial and ventricular contraction occurring with every beat. Additionally, highly inconsistent fluctuations in the blood pressure can occur because of the variability in the degree of left atrial (LA) contribution to LV filling, stroke volume, and cardiac output. Moreover, variability in the occurrence and intensity of heart sounds (especially S1) can also be observed and is heard more frequently when the rate of the tachycardia is slower.2
Laboratory Tests
The plasma potassium and magnesium concentrations should be measured as part of the laboratory evaluation. Hypokalemia and hypomagnesemia can predispose to the development of ventricular tachyarrhythmias. Hyperkalemia can cause a wide QRS complex rhythm, usually with a slow rate, with loss of a detectable P wave (the so-called sinoventricular rhythm; Fig. 21-1) or abnormalities of AVN conduction. In patients taking digoxin, quinidine, or procainamide, plasma concentrations of these drugs should be measured to assist in evaluating possible drug toxicity.
Pharmacological Intervention
Unless the cause for the WCT is definitely established, however, verapamil, diltiazem, and probably adenosine should not be administered, because they have been reported to cause severe hemodynamic deterioration in patients with VT and can even provoke ventricular fibrillation (VF) and cardiac arrest. Direct current (DC) cardioversion in unstable patients and intravenous procainamide or amiodarone in hemodynamically stable patients are the appropriate management approach.2
Electrocardiographic Features
Ventricular Tachycardia Versus Aberrantly Conducted Supraventricular Tachycardia
In general, most WCTs can be classified as having one of two patterns: a right bundle branch block (RBBB)–like pattern (QRS polarity is predominantly positive in leads V1 and V2) or a left bundle branch block (LBBB)–like pattern (QRS polarity is predominantly negative in leads V1 and V2). The determination that the WCT has an RBBB-like pattern or an LBBB-like pattern does not, by itself, assist in making a diagnosis; however, this assessment should be made initially because it is useful in evaluating several other features on the ECG, including the QRS axis, the QRS duration, and the QRS morphology (Table 21-2).
TABLE 21-2 Electrocardiographic Criteria Favoring Ventricular Tachycardia
| AV Relationship |
AV = atrioventricular; BBB = bundle branch block; LBBB = left bundle branch block; NSR = normal sinus rhythm; RBBB = right bundle branch block; WCT = wide complex tachycardia.
QRS Duration
A QRS duration more than 160 milliseconds is not helpful in identifying VT in several settings, including preexisting bundle branch block (BBB), although it is uncommon for the QRS to be wider than 160 milliseconds in this situation, preexcited SVT, and the presence of drugs capable of slowing intraventricular conduction (e.g., class IA and IC drugs). Of note, a QRS complex that is narrower during WCT than during normal sinus rhythm (NSR) suggests VT. However, this is rare, occurring in less than 1% of VTs.2
A recent report found that the QRS onset-to-peak time (also termed “R wave peak time” or “intrinsicoid deflection”) in lead II (measured from the beginning of the QRS to the first change of the polarity, independent of whether the QRS deflection is positive or negative) was significantly wider in VT compared with SVT with aberrancy, and a cutoff value of 50 milliseconds or greater identified VT with high sensitivity, specificity, and positive predictive values (93%, 99%, and 98%, respectively). However, this criterion has not been tested prospectively or validated in patients with preexisting conduction system disease, antiarrhythmic drug therapy, electrolyte imbalance, prior MI, and preexcited tachycardias. Additionally, certain types of VTs such as fascicular VT, bundle branch reentrant (BBR) VT, and septal myocardial VT, can have a shorter QRS onset-to-peak time because of their origin within or in close proximity to the His-Purkinje network.1,3
QRS Axis
Generally, the more leftward the axis, the greater the likelihood of VT. A significant axis shift (>40 degrees) between the baseline NSR and WCT is suggestive of VT (Fig. 21-2A). A right superior (“northwest”) axis (axis from –90 degrees to ±180 degrees) is rare in SVT and strongly suggests VT (see Fig. 21-2B).2
