Analysis and Monitoring of Gas Exchange
After reading this chapter you will be able to:
 Describe the difference between monitoring and analysis.
 Describe the two types of electrochemical oxygen analyzers.
 Describe calibration and problem-solving techniques for oxygen analyzers.
 State how to obtain, process, and analyze arterial and capillary blood gas samples.
 List the quality control procedures applied to blood gas analysis.
 List the potential advantages of point-of-care testing.
 Describe how to obtain and interpret transcutaneous oxygen and carbon dioxide monitoring.
 Describe the basic principles used by an oximeter to monitor oxygen saturation.
 State when and how to perform pulse oximetry.
 Identify true statements related to interpretation of pulse oximetry results.
 Describe how to perform capnometry and interpret capnograms.
Invasive Versus Noninvasive Procedures
Invasive procedures require insertion of a sensor or collection device into the body, whereas noninvasive monitoring is a means of gathering data externally.1 Because laboratory analysis of gas exchange requires blood samples, it is usually considered invasive. Monitoring can be either invasive or noninvasive. Generally, invasive procedures tend to provide more accurate data than noninvasive methods, but they carry greater risk.
Measuring Fractional Inspired Oxygen
Instrumentation
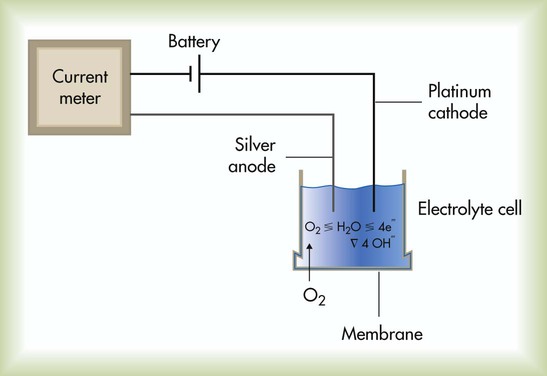
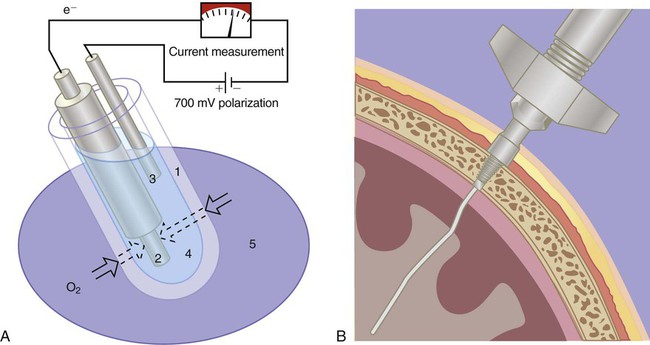
Although many methods exist for measuring O2 concentrations, most bedside systems apply electrochemical principles. There are two common types of electrochemical O2 analyzers: (1) the polarographic (Clark) electrode and (2) the galvanic fuel cell. Under ideal conditions of temperature, pressure, and relative humidity, both types are accurate to within ± 2% of the actual concentration.1
The Clark electrode is similar to electrodes used in blood gas analyzers and transcutaneous monitors (see later section on Transcutaneous Blood Gas Monitoring). This system typically consists of a platinum cathode and a silver–silver chloride anode (Figure 18-1). O2 molecules diffuse through the sensor membrane into the electrolyte, where a polarizing voltage causes electron flow between the anode and cathode. While silver is oxidized at the anode, the flow of electrons reduces O2 (and water) to hydroxyl ions (OH−) at the cathode. The more O2 molecules that are reduced, the greater is the electron flow across the poles (current). The resulting change in current is proportional to the PO2, with its value displayed on a galvanometer, calibrated in percent O2. Response times for Clark electrode O2 analyzers range from 10 to 30 seconds.
Sampling and Analyzing Blood Gases
Sampling
Clinicians have been using blood samples to assess gas exchange parameters for more than 50 years.2 The definition of respiratory failure still is based largely on blood gas measurements. Depending on the need, blood gas samples can be obtained by percutaneous puncture of a peripheral artery, from an indwelling catheter (arterial, central venous, or PA), or by capillary sampling.
Arterial Puncture and Interpretation
Arterial puncture involves drawing blood from a peripheral artery (radial, brachial, femoral, or dorsalis pedis) through a single percutaneous needle puncture (Figure 18-2). The radial artery is the preferred site for arterial blood sampling for the following reasons:
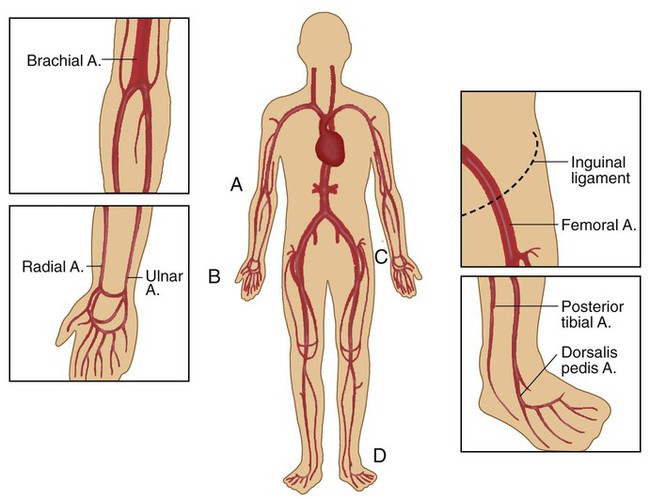
• It is near the surface and relatively easy to palpate and stabilize.
• Effective collateral circulation normally exists in the ulnar artery.
To guide practitioners in providing quality care, the American Association for Respiratory Care (AARC) has published Clinical Practice Guideline: Sampling for Arterial Blood Gas Analysis.3 Complementary recommendations have been published by the National Committee for Clinical Laboratory Standards.4 Modified excerpts from the AARC guideline appear in Clinical Practice Guideline 18-1.
Equipment
Box 18-1 lists the equipment needed to perform an arterial puncture. Commercial vendors provide kits containing most of the equipment listed. If provided, the needle capping device serves two purposes. First, it isolates the sample from air exposure (to ensure accurate results). Second, it helps prevent inadvertent needlestick injuries. There are many different capping device designs; devices that allow single-handed recapping are preferred. If a capping safety device is not provided, the clinician should use the single-handed “scoop” method to cap the needle before removing it and plugging the syringe.
Procedure
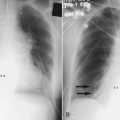
Box 18-2 outlines the basic procedure for radial artery puncture of adults. Before radial artery puncture is performed, a modified Allen test (Figure 18-3) is recommended. The test is normal (indicating adequate collateral circulation) if the palm, fingers, and thumb flush pink within 5 to 10 seconds after pressure on the ulnar artery is released. A normal test result indicates the presence of collateral circulation but may not predict the development of complications after radial artery puncture or cannulation.
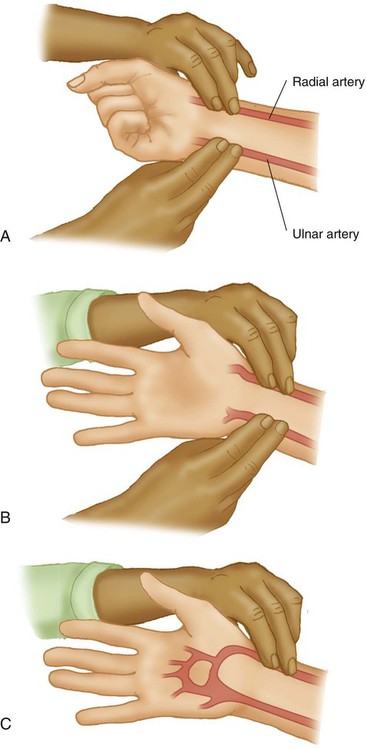
The modified Allen test has been a widely used clinical method to assess adequacy of ulnar artery collateral blood flow despite the lack of evidence that it can predict ischemic complications in the setting of complete radial artery occlusion.5 The criteria for an abnormal test result are not agreed on, which renders the significance of an abnormal test unclear. The test result may be inaccurate in predicting postcannulation hand ischemia, has poor interrater reliability, and is known to yield a high incidence of false normal and abnormal results. The modified Allen test cannot be performed on most critically ill patients who are either uncooperative or unconscious. In addition, prior radial artery cannulation, severe circulatory insufficiency, wrist or hand burns, or jaundice makes interpreting the results difficult. Performance of a modified Allen test before radial artery puncture or cannulation should not be considered a “standard of care,” but the need for its use and appropriate application should be well recognized.6
In patients who have undergone previous radial artery cannulation, the modified Allen test can provide documentation of possible arterial thrombosis and should be used to direct catheter placement. In that circumstance, it is imprudent to ignore totally the utility of the modified Allen test, especially if another arterial site is available for cannulation.7
• Never recap a used needle without a safety device; never handle a used needle using both hands; never point a used needle toward any part of the body.
• Never bend, break, or remove used needles from syringes by hand.
• Always dispose of used syringes, needles, and other sharp items in appropriate puncture-resistant sharps containers.
Indications for Blood Gas Sampling
Knowing when to obtain a blood gas sample is just as important as knowing how to perform the procedure. See Clinical Practice Guideline 18-1 for the general indications for ABG sampling. Box 18-3 lists common clinical situations associated with the need for ABG analysis.
Problem Solving and Troubleshooting
Preanalytic Error
Preanalytic errors are problems occurring before sample analysis that can alter the accuracy of the blood gas results. Table 18-1 summarizes the most common errors associated with arterial blood sampling, including recommendations on how to recognize and avoid these problems.8,9 Clinicians can avoid most preanalytic errors by ensuring that the sample is obtained anaerobically, is properly anticoagulated (with immediate expulsion of air bubbles), and is analyzed within 10 to 30 minutes.
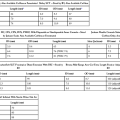
TABLE 18-1
Preanalytic Errors Associated With Arterial Blood
| Error | Effect on Parameters | How to Recognize | How to Avoid |
| Air in sample | ↓ PCO2 | Visible bubbles or froth | Discard frothy samples |
| ↑ pH | Low PCO2 inconsistent with patient status | Fully expel bubbles | |
| ↑ low PO2 | Mix only after air is expelled | ||
| ↓ high PO2 | Cap syringe quickly | ||
| Venous admixture | ↑ PCO2 | Failure of syringe to fill by pulsations | Avoid brachial and femoral sites |
| ↓ pH | Patient has no symptoms of hypoxemia | Do not aspirate sample | |
| Can greatly lower PO2 | Use short-bevel needles | ||
| Avoid artery “overshoot” | |||
| Cross-check with SpO2 | |||
| Excess anticoagulant (dilution) | ↓ PCO2 ↑ pH ↑ low PO2 ↓ high PO2 |
Visible heparin remains in syringe before sampling | Use premade lyophilized (dry) heparin blood gas kits Fill dead space only Collect >2 ml (adults) and >0.6 ml (infants) |
| Metabolic effects | ↑ PCO2 ↓ pH ↓ PO2 |
Excessive time lag since sample collection Values inconsistent with patient status |
Analyze within 15 min Place sample in ice slush |
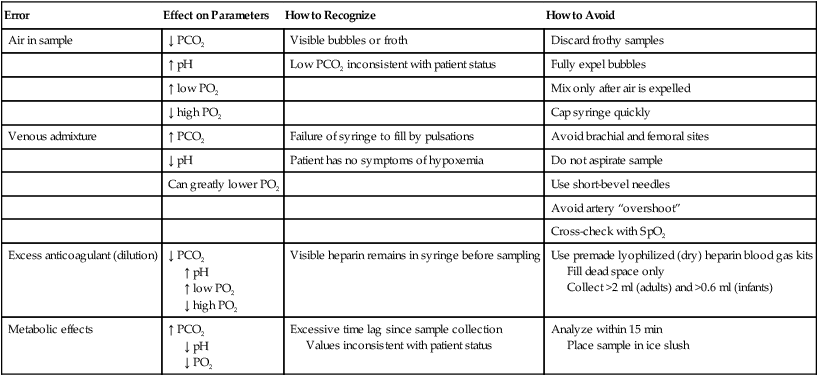
The traditional method used to avoid preanalytic errors caused by blood cell metabolism is to chill the sample quickly by placing it in an ice slush. Chilling is needed if the sample is not to be analyzed within 10 to 30 minutes.3 Chilled samples should be discarded if they are not analyzed within 60 minutes. PaO2 of samples drawn from subjects with elevated white blood cell counts may decrease rapidly, and immediate chilling is recommended. Chilled samples can result in potassium transport between blood cells and plasma and can result in erroneous elevation in potassium measured from a blood gas sample. Use of a glass syringe or a plastic syringe with low diffusibility minimizes the risk of room air gases contaminating the sample. Pneumatic tube transport of samples containing small air bubbles can have a noticeable effect on increasing PaO2.9
Interpretation of Arterial Blood Gases
 Rule of Thumb
SaO2 represents the degree to which the hemoglobin (Hb) is saturated with O2 (see Chapter 11). Normally, the Hb saturation with O2 is 95% to 100% with healthy lungs. When the lungs cannot transfer O2 into the blood at normal levels, the SaO2 decreases in most cases in proportion to the degree of lung disease present. Blood gas analyzers report a calculated SaO2. Measurement of SaO2 by hemoximetry and Hb content is required for accurate determination of CaO2.
The acid-base status of the patient is determined by evaluating the pH, PaCO2, and plasma HCO3−. The steps for interpreting the acid-base status of the ABG results are described in Chapter 13.
Indwelling Catheters (Arterial and Central Venous Pressure and Pulmonary Artery Lines)
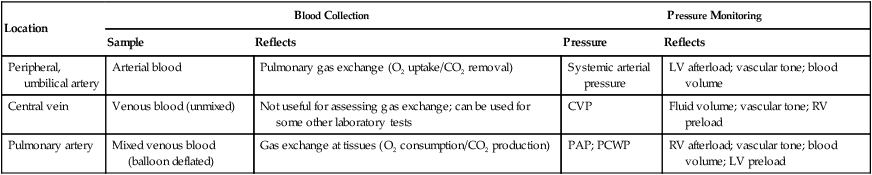
The most common routes for indwelling vascular lines are a peripheral artery (usually radial, brachial, or less commonly dorsalis pedis and axillary) or femoral artery, a central vein (usually the vena cava), and the PA. In neonates, the umbilical artery is cannulated for arterial blood sampling. Table 18-2 summarizes the usefulness of these various sites in providing relevant clinical information. Chapter 46 provides details on the use of these systems for hemodynamic pressure and flow monitoring.
TABLE 18-2
Common Sites for Indwelling Vascular Catheters and the Information They Provide
| Location | Blood Collection | Pressure Monitoring | ||
| Sample | Reflects | Pressure | Reflects | |
| Peripheral, umbilical artery | Arterial blood | Pulmonary gas exchange (O2 uptake/CO2 removal) | Systemic arterial pressure | LV afterload; vascular tone; blood volume |
| Central vein | Venous blood (unmixed) | Not useful for assessing gas exchange; can be used for some other laboratory tests | CVP | Fluid volume; vascular tone; RV preload |
| Pulmonary artery | Mixed venous blood (balloon deflated) | Gas exchange at tissues (O2 consumption/CO2 production) | PAP; PCWP | RV afterload; vascular tone; blood volume; LV preload |
Equipment
Figure 18-4 shows the basic setup used for an indwelling vascular line, in this case, a brachial artery catheter. The catheter connects to a disposable continuous-flush device (Delta-flow; Utah Medical Products, Midvale, UT). This device keeps the line open by providing a continuous low rate of flow (2 to 4 ml/hr) of intravenous saline solution through the system.
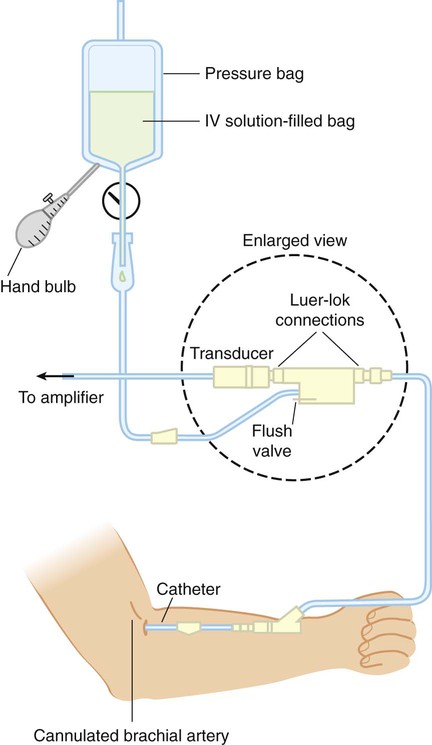
Heparinized saline flush solution has been commonly used with indwelling vascular catheters. However, it has been shown that heparin does not significantly improve arterial catheter function, extend the duration of use, or decrease the number of manipulations required. Additionally, results of coagulation studies can be affected by heparinized flush solution, and unnecessary exposure to heparin may increase the risk of heparin-induced thrombocytopenia.10 Because arterial pressures are much higher than venous pressures, the intravenous bag supplying these systems must be pressurized, usually by using a hand bulb pump. A strain-gauge pressure transducer connected to the flush device provides an electrical signal to an amplifier or monitor, which displays the corresponding pressure waveform.
Procedure
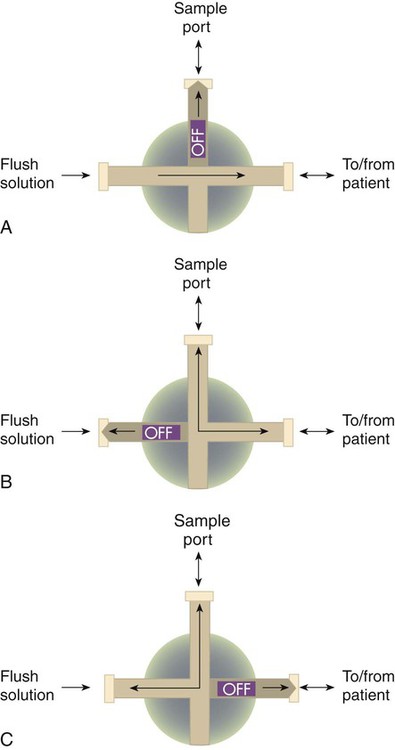
Access for sampling blood from most intravascular lines is provided by a three-way stopcock (Figure 18-5). Equipment and supplies are the same as specified for arterial puncture, with the addition of a second “waste” syringe. Box 18-4 outlines the proper procedure for taking an arterial blood sample from a three-way stopcock system.
Problem Solving and Troubleshooting
With the exception of venous admixture, the preanalytic errors that occur when sampling blood from a vascular line are the same as the errors that occur with intermittent puncture, as are the ways to avoid them. For clinicians, the challenge with vascular lines is to maintain their function properly and troubleshoot the many potential problems that can occur. Because these are key components of bedside monitoring skills, they are discussed in the section on hemodynamics in Chapter 46.
Capillary Blood Gases
Capillary blood gas sampling is used as an alternative to direct arterial access in infants and small children. Properly obtained capillary blood from a well-perfused patient can accurately reflect and provide clinically useful estimates of arterial pH and PCO2 levels.6 However, capillary PO2 is of no value in estimating arterial oxygenation, and O2 saturation by pulse oximetry must also be evaluated when a capillary blood gas sample is obtained. Respiratory therapists (RTs) must exercise extreme caution when using capillary blood gases to guide clinical decisions. Direct arterial access is still the preferred approach for assessing gas exchange in infants and small children with severe acute respiratory failure.
Capillary blood values are meaningful only if the sample site is properly warmed. Warming the skin (to approximately 42° C) causes dilation of the underlying blood vessels, which increases capillary flow well above tissue needs. Blood gas values resemble the values in the arterial circulation; this is why a sample obtained from a warmed capillary site is often referred to as arterialized blood. It has been shown that capillary blood samples from the earlobe reflect arterial PCO2 and PO2 better than samples drawn from a finger stick.11 The posterior medial or lateral curvature of the heel is the recommended site for capillary puncture specimens in infants less than 1 month old to avoid nerve and bone damage.
To guide practitioners in providing quality care, the AARC has published Clinical Practice Guideline: Capillary Blood Gas Sampling for Neonatal and Pediatric Patients.12 Modified excerpts from the AARC guideline appear in Clinical Practice Guideline 18-2.
Problem Solving and Troubleshooting
Sampling of capillary blood is useful for patient management only if the procedure is performed according to an established quality assurance program. The most common technical errors in capillary sampling are inadequate warming of the capillary bed and squeezing of the puncture site. Squeezing the puncture site may result in venous and lymphatic contamination of the sample.13
Analyzing
Blood gas analysis and hemoximetry are moderately complex laboratory procedures. Clinicians performing these tests must have documented training and must demonstrate proficiency in performing the procedures, preventive maintenance, troubleshooting, and instrument calibration. In addition, clinicians must be skilled in validating test results using rigorous quality control methods.14
To guide practitioners in providing quality care, the AARC has published Clinical Practice Guideline: Blood Gas Analysis and Hemoximetry.15 Related recommendations have been published by the National Committee for Clinical Laboratory Standards.9 Modified excerpts from the AARC guideline appear in Clinical Practice Guideline 18-3.
Instrumentation
• Operator interface (e.g., operating controls, light-emitting diode [LED] or cathode ray tube [CRT] displays, touch screen keypads, software)
• Measuring chamber incorporating the typical three-electrode system
• Reagent containers (buffers used for calibration, rinse solutions)
• Results display, storage, and transmittal system (e.g., screen, printer, disk storage device, network interface)
Measurement of the three primary parameters—pH, PCO2, and PO2—is accomplished using three separate electrodes. To measure PO2, blood gas analyzers use the Clark polarographic electrode (see Figure 18-1).
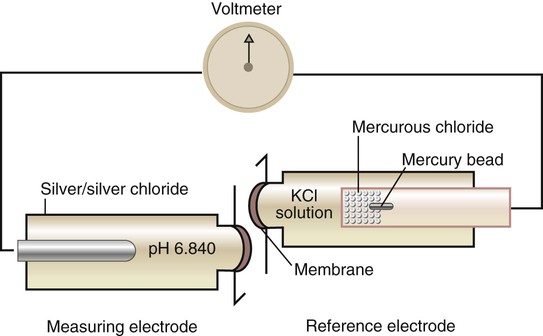
The pH electrode consists of two electrodes or half-cells (Figure 18-6). The measuring half-cell contains a silver–silver chloride rod surrounded by a solution of constant pH and enclosed by a pH-sensitive glass membrane. As the sample passes this membrane, the difference in H+ concentration on either side of the glass changes the potential of the measuring electrode. The reference half-cell (here mercury–mercurous chloride) produces a constant potential, regardless of sample pH. The difference in potential between the two electrodes is proportional to the H+ concentration of the sample, which is displayed on a voltmeter calibrated in pH units.
< ?xml:namespace prefix = "mml" />

In addition to electrochemical electrodes, a sensor technology based on optical fluorescence and the process of photoluminescence is available to measure pH, PCO2, and PO2. Optical fluorescence sensors use fluorescent dyes that are illuminated with light of a specific wavelength. The illuminating light is transmitted, reflected, absorbed, and reemitted to varying degrees depending on the concentration of O2, CO2, and hydrogen ions. These photochemical alterations in light illumination are used to calculate pH, PCO2, and PO2 values. Compared with electrochemical sensors, optical sensors do not require electrical connections, making them less affected by electrical interference and drift. The sensor reactions are reversible so that the analyte is not consumed. These features make them easier to miniaturize for intravascular measurement of blood gases.16,17
Procedure
To provide accurate and clinically useful data, blood gas analysis must be performed as follows:
• On a sample free of preanalytic errors
• With a properly functioning analyzer (validated by quality control procedures)
• Using a procedure that follows the manufacturer’s recommendations
Box 18-6 outlines the steps commonly used in most established procedures for laboratory blood gas analysis. One should always refer to the manufacturer’s literature for the particular steps to use with a specific analyzer.
Quality Assurance
The Clinical Laboratory Standards Institute (CLSI), formerly the National Committee for Clinical Laboratory Standards (NCCLS), establishes guidelines and standards for blood gas analysis and quality assurance. Government regulatory agencies collaborate to update the Clinical Laboratory Improvement Amendments (CLIA) that establish proficiency testing requirements.18 Although an in-depth review of laboratory quality control is beyond the scope of this text, all RTs must understand the key elements.19
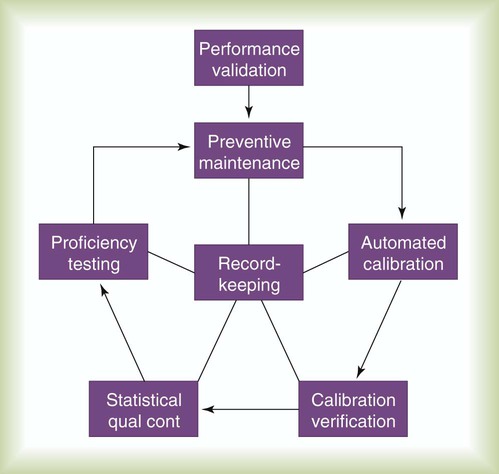
Figure 18-7 depicts the key components of laboratory quality control. A brief description of each element follows.
Automated Calibration
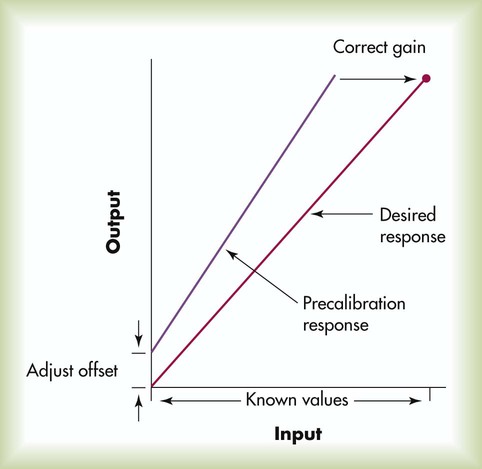
Calibration is performed to ensure that the output of the analyzer is both accurate and linear across the range of measured values. Parameters must be measured with known input values representing at least two points, usually a low and a high value. Figure 18-8 shows a typical two-point calibration procedure. In this example, the instrument’s initial precalibration response indicates that the output readings are consistently higher than the actual input, with this positive bias worsening at higher levels. Calibration is performed first by adjusting the offset (or balance) of the instrument so that the low output equals the low input (in this case zero). Next, the gain (or slope) of the device is adjusted to ensure that the high output equals the high input. When both offset and gain are adjusted against known inputs, the instrument is properly calibrated and can undergo calibration verification with control samples.
 Problem
Internal Statistical Quality Control
Internal quality control takes calibration verification a step further by applying statistical and rule-based procedures (Westgard rules)20,21 to help detect, respond to, and correct instrument error. In one common approach, the results of control media analyses are plotted on a graph and compared with statistically derived limits, usually ±2 standard deviation (SD) ranges (Figure 18-9). Control results that fall outside these limits indicate analytic error.
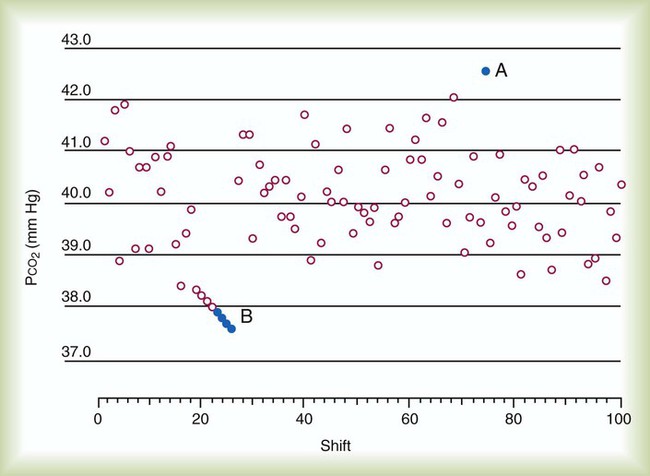
There are two categories of analytic error: (1) random error and (2) systematic error. Random error is observed when sporadic, out-of-range data points occur (see Figure 18-9, point A). Random errors are errors of precision or, more precisely, imprecision. Conversely, either a trending or an abrupt shift in data points outside the statistical limits (see Figure 18-9, point B) is sometimes observed. This phenomenon is called systematic error or sometimes bias. Bias plus imprecision equals total instrument error, or inaccuracy. Table 18-3 outlines the major factors causing these two types of error and suggests some common corrective actions.
TABLE 18-3
| Error Type | Common Contributing Factors | Common Corrective Actions |
| Imprecision (random) errors | Statistical probability | Rerun control |
| Sample contamination | Repeat analysis on different instrument | |
| Sample mishandling | ||
| Bias (systematic) errors | Contaminated buffers | Perform function check of suspected problem area |
| Incorrect gas concentrations | Repair or replace failed components | |
| Incorrect procedures | ||
| Component failure |
External Quality Control (Proficiency Testing)
The federal government mandated a rigorous program of external quality control for analytic laboratories. CLIA were established in 1988. To meet these standards, analytic laboratories must undergo regular proficiency testing designed to evaluate their operating procedures and the competence of their personnel.22 Proficiency testing requires analysis and reporting on externally provided control media with unknown values, usually three times per year, with five samples per test. There are many CLIA-approved proficiency testing providers.23 A commonly used provider is the College of American Pathologists (CAP) proficiency testing survey. Proficiency testing survey analyses must be performed along with the regular workload by the personnel routinely responsible for testing, following the laboratory’s standard testing practices.
Point-of-Care Testing
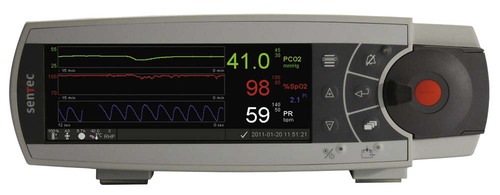
Point-of-care testing takes blood gas analysis from the specialized laboratory to the patient’s bedside.24 Point-of-care testing reduces turnaround time, which should improve care and reduce costs. Theoretically, cost savings can be accrued by eliminating delays in therapy, decreasing patient length of stay in the hospital and emergency department.25 Additional cost savings may occur if point-of-care testing decreases the need for specialized laboratory personnel. Point-of-care testing is used increasingly in the hospital and physician office settings.26
Instrumentation
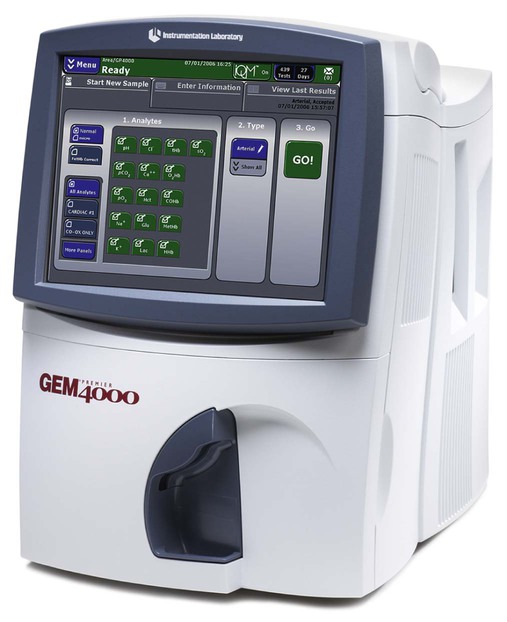
Figure 18-10 shows a typical point-of-care blood gas analyzer (GEM 4000; Instrumentation Laboratory, Bedford, MA). In addition to blood gas analysis, such devices can be used to measure several chemistry and hematology parameters, including serum electrolytes, blood glucose levels, blood urea nitrogen, hematocrit, hemoximetry, lactate, bilirubin, and prothrombin and partial thromboplastin times.
Clinical Performance
More recent method comparisons indicate that portable point-of-care blood gas analyzers can achieve accuracy and precision levels comparable with laboratory-based analyzers.14,27 Such findings have resulted in the widespread use of these systems.
Clinical laboratories have begun implementing expanded point-of-care testing solutions to improve operational costs, streamline workflow in the clinical laboratory and critical care setting, and provide blood analysis results more quickly.28,29 Guidelines for providers who are considering adoption of this new technology have been published in the clinical laboratory literature.30
Blood Gas Monitoring
Transcutaneous Blood Gas Monitoring
Numerous factors influence the agreement between arterial blood and transcutaneous gas measurements, with O2 levels being affected most. The two most important factors are age and perfusion status. Table 18-4 summarizes these relationships using the ratio of PtcO2 to PaO2. A ratio of 1 : 1 indicates “perfect” agreement between PtcO2 and PaO2. As can be seen, this level of agreement occurs only in neonates.
TABLE 18-4
Ratios Correlating PtcO2 With PaO2
| Age Group | PtcO2/PaO2 Ratio | Perfusion Status | PtcO2/PaO2 |
| Premature infants | 1.14 : 1 | Stable | 0.79 : 1 |
| Neonates | 1.00 : 1 | Moderate shock | 0.48 : 1 |
| Children | 0.84 : 1 | Severe shock | 0.12 : 1 |
| Adults | 0.79 : 1 | ||
| Older adults | 0.68 : 1 |
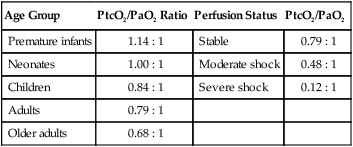
From Tobin MJ: Respiratory monitoring. JAMA 264:244–251, 1990.
Based on these factors, PtcCO2 monitoring is a reasonable choice when there is a need for continuous, noninvasive analysis of trends in ventilation and PaCO2. In hemodynamically stable infants and children, PaO2 can be “correlated” against PtcO2, decreasing the need for repeated arterial samples. Because pulse oximetry cannot provide accurate estimates of excessive blood O2, the transcutaneous monitor may be useful for monitoring hyperoxia in neonates. However, prevention of hyperoxia in premature neonates is more often achieved by maintaining pulse oximetry saturation between 85% and 93%.31
Transcutaneous blood gas monitoring of PtcCO2 can also be useful in adult patients during deep sedation and mechanical ventilation in the emergency department and intensive care unit and during surgery.32–37 PtcCO2 is a more accurate reflection PaCO2 than both PetCO2 and nasal etCO2 in intubated and spontaneously breathing adult patients. The use of PtcCO2 in conjunction with pulse oximetry reduces the need for repeated arterial blood gas sampling.38
To guide practitioners in providing quality care, the AARC has published Clinical Practice Guideline: Transcutaneous Blood Gas Monitoring for Neonatal and Pediatric Patients.39 Modified excerpts from the AARC guideline appear in Clinical Practice Guidelines 18-4.
Instrumentation
Figure 18-11 shows a simplified diagram of a transcutaneous blood gas monitor sensor. Included are a heating element and two electrodes, one for O2 and one for CO2. These electrodes are similar in design to the electrodes found in bench-top analyzers. However, instead of measuring gas tensions in a blood sample, transcutaneous electrodes measure PO2 and PCO2 in an electrolyte gel between the sensor and the skin. When properly set up, the response time for these electrodes is 20 to 30 seconds, a bit slower than the response time for pulse oximetry.
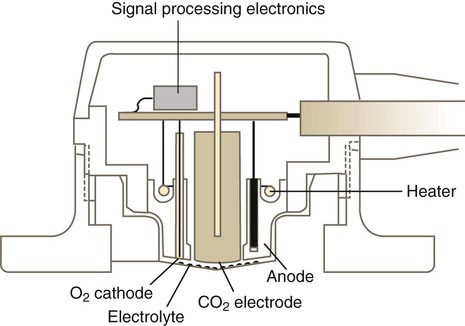
Figure 18-12 shows a transcutaneous monitor with digital signal processing. A Severinghaus-type PtcCO2 electrode and two-wavelength reflectance SpO2 are combined into a single sensor. The sensor can be applied to the skin surface in neonates and infants or to the earlobe of pediatric and adult patients for combined noninvasive monitoring of ventilation and oxygenation.
Procedure
Box 18-7 outlines the basic procedure for setting up a transcutaneous blood gas monitor. The most common sites for electrode placement in infants and children are the abdomen, chest, and lower back. Once the electrodes are properly set up, the clinician should compare the monitor readings with the readings obtained with a concurrent ABG. Consistency between values validates monitor performance under the existing conditions. This validation should be repeated anytime the patient’s status undergoes a major change. During validation studies of patients with anatomic shunts, the electrode site and arterial sampling site should be on the same “side” of the shunt.
 Problem
Problem Solving and Troubleshooting
Transcutaneous blood gas monitoring is a complex and labor-intensive activity that requires ongoing training and careful quality control. Table 18-5 lists the major factors that can affect the accuracy or limit the performance of a transcutaneous monitor. In terms of technical limitations, the lengthy stabilization time needed by transcutaneous monitors precludes their use during short procedures or in emergencies. In such cases, the pulse oximeter is a better choice.
TABLE 18-5
Factors Affecting Transcutaneous Blood Gas Monitors
| Technical Factors | Clinical Factors |
| Labor-intensive, high-skill procedure | Poor perfusion |
| Lengthy stabilization time | Hyperoxemia |
| Improper calibration can be difficult to detect | Improper sensor application or placement |
| Heating required to obtain valid PO2 results | Use of vasoactive drugs |
| Proper sensor-electrolyte contact is essential | Variation in skin characteristics |


Conversely, excessive pressure on the sensor compresses the underlying capillaries and produces a falsely low PtcO2. Even with proper application and placement, PtcO2 measures can vary by 10% at different sites, with values from the extremities generally being lower than values obtained from the chest or abdomen.39
Intraarterial (In Vivo) Blood Gas Monitoring
Over the past 20 years, the desire for continuous in vivo blood gas analysis has led to remarkable strides in technology. However, the clinical requirements for such systems (Box 18-8) are extremely demanding and have yet to be fully met. Potential benefits of continuous blood gas analysis include real-time monitoring and a reduction in therapeutic decision-making time, less blood loss and the need for transfusion (especially in pediatric patients), lower infection risk to the patient and blood exposure to the health care provider, improved accuracy by reducing preanalytic errors, and elimination of specimen transport.
Instrumentation
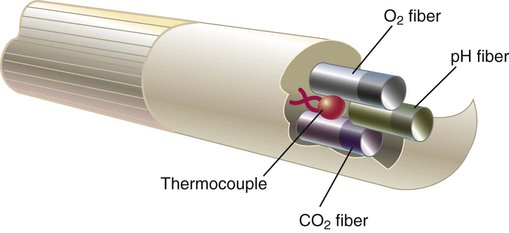
Rather than using electrochemical electrodes, miniaturized optical fluorescence sensors, called optodes, measure blood gas parameters by photochemical reactions and changes in the intensity of light transmission through optical fibers. Figure 18-13 shows how optodes are combined (with a thermocouple) at the tip of a flexible fiberoptic catheter that is inserted into a peripheral artery. Several optode-based systems have been developed and validated for commercial use for continuous intraarterial blood gas assessment and monitoring of PaO2 during cardiopulmonary bypass.40,41
Clinical Performance and Usefulness
Despite technical improvements, the actual performance of in vivo blood gas monitors falls short of the clinical requirements previously specified. Compared with standard blood gas analysis, accuracy is improved.42,43 However, concerns about bias in PO2 measurement,44 sensor accuracy over extended periods in divergent patient groups,45 the need for femoral artery insertion because of blood pressure waveform dampening in the radial artery,46 high acquisition cost of the monitor and sensor catheters, dedication of a monitor to a single patient,47 and lack of evidence showing an impact on patient care have prevented widespread adoption and use of this technology.
Extraarterial (Ex Vivo) Blood Gas Monitoring
Instrumentation and Procedure
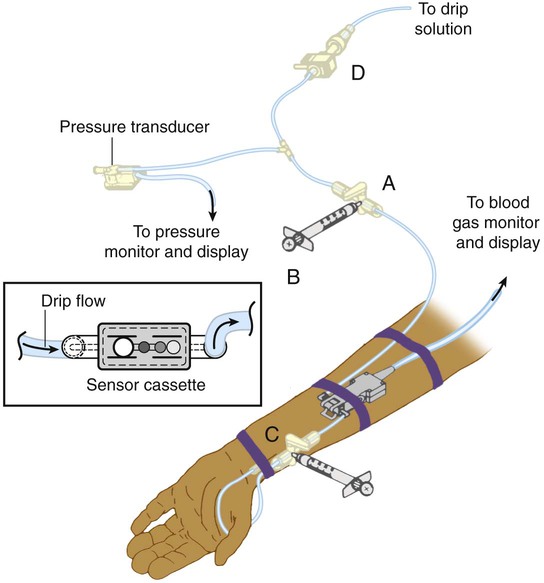
Both optode-based and electrochemical-based systems have been developed. Figure 18-14 depicts an optode-based, ex vivo blood gas monitoring system. The optodes are located in a sensor cassette inserted in-line with the arterial catheter near the patient’s wrist. To measure pH, PCO2, and PO2, the system is closed to the intravenous fluid source at the stopcock (Figure 18-14, A). Subatmospheric pressure is created in the syringe attached to the stopcock (see Figure 18-14, A), which functions as an aspirating reservoir (Figure 18-14, B); this causes arterial blood to flow into the sensor cassette for analysis. During analysis, the stopcock (see Figure 18-14, A) is returned to its original position (off to the aspirating syringe). The connection through the line to the pressure transducer is restored, and blood pressure monitoring is able to continue. Blood gas parameter results are displayed in approximately 1 to 2 minutes. When analysis is complete, the blood sample is returned to the patient by emptying the aspirating reservoir (see Figure 18-14, B) and flushing the system through the flow valve (Figure 18-14, D).
Clinical Performance and Usefulness
In clinical trials, ex vivo on-demand systems performed as well as laboratory blood gas analyzers in adults, neonates, and infants.48–50 Measurements could be obtained every 3 to 5 minutes from a peripheral or umbilical artery, and the intermittent errors commonly associated with in vivo systems were not observed. A commercially available system for blood gas monitoring in neonates and infants also incorporates electrolyte, hematocrit, and Hb measurements.50
Tissue Oxygen
Tissue O2 (PtO2) can be measured by probes inserted directly into organs, tissue, and body fluids. Ease of probe placement and the sensitivity of PtO2 as an indicator of tissue perfusion make tissue O2 monitoring attractive for clinical research applications. Clinical indications for measuring PtO2 include monitoring brain tissue O2 as an early sign of ischemia, assessing brain blood flow autoregulation, and monitoring the adequacy of brain perfusion in patients with traumatic brain injury.51 In patients with traumatic brain injury, brain PtO2 values when intracranial pressure and cerebral perfusion are normal are between 25 mm Hg and 30 mm Hg. The critical threshold for ischemic brain damage and poor outcome is suspected to be around a brain PtO2 of 10 to 15 mm Hg.51
Instrumentation
Both electrochemical and optical fluorescence tissue O2 probes have been developed for clinical use and research applications. Figure 18-15 shows a Clarke-type polarographic sensor and its insertion into brain tissue through an intracranial bolt. Optode probes capable of monitoring tissue pH, CO2, and O2 have also been developed.52
Oximetry
The particular pattern of light absorption exhibited by a substance at different wavelengths is called its absorption spectrum. As shown in Figure 18-16, each form of Hb (e.g., Hb, HbO2, HbCO, metHb) has its own unique pattern. By comparison of the amount of light transmitted through (or reflected from) a blood sample at two or more specific wavelengths, the relative concentrations of two or more forms of Hb can be measured. For example, oxygenated Hb absorbs less red light (600 to 750 nm) and more infrared light (850 to 1000 nm) than deoxygenated or reduced Hb does. Comparing a blood sample’s light absorption with red and infrared light yields the %HbO2 and %Hb. For measurement of the concentration of additional forms of Hb, additional (more than two) wavelengths of light need to be used.

Hemoximetry
Hemoximetry is an analytic method of oximetry and is covered in the AARC Clinical Practice Guideline: Blood Gas Analysis and Hemoximetry15 (see Clinical Practice Guideline 18-3). Related recommendations have been published by CLSI).9
Instrumentation
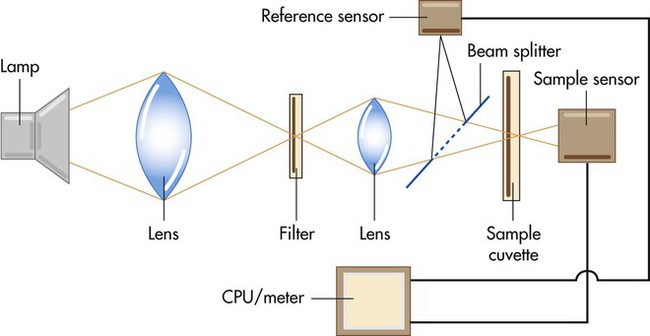
Figure 18-17 is a simplified diagram showing the key components of a laboratory hemoximeter. Light generated by a thallium cathode lamp passes through a series of lenses and filters, yielding the specific wavelengths needed for analysis. A beam splitter divides the light into two portions, directing one through a reference solution and the other through a sample chamber, or cuvette. Photodetection sensors measure the amount of light transmitted through these two sources. By comparing the difference in light transmission through the reference and sample solutions, a microprocessor computes the relative amount of Hb present, with its output sent to the calibrated device meter or display. Because a laboratory hemoximeter uses four or more different wavelengths of light, it can simultaneously compute the relative concentrations of multiple forms of Hb, such as Hb, HbO2, HbCO, and metHb.
Procedure and Quality Assurance
Quality assurance procedures for hemoximetry are essentially the same as the procedures used for blood gas analysis, differing only with regard to the control materials used. In addition, careful cleaning and maintenance of the cuvette chamber is essential because clouding of its walls decreases absorbance and can cause falsely elevated values.53
Problem Solving and Troubleshooting
A major assumption underlying hemoximetry is that the measured changes in light absorbance result only from variations in the relative concentrations of various hemoglobins. In practice, this assumption does not always hold true. Table 18-6 outlines some of the potential problems and resulting errors that can occur with hemoximetry.
TABLE 18-6
Problems Causing Measurement Errors With Hemoximeters
| Problem | Potential Error |
| Incomplete hemolysis | Falsely low total Hb, HbO2 |
| Sickle cell anemia (caused by incomplete hemolysis) | Falsely low HbO2 |
| Presence of vascular dyes (e.g., methylene blue) | Falsely low total Hb, HbO2 |
| High lipid levels (e.g., from parenteral nutrition) | Falsely low total Hb, HbO2 |
| Presence of high levels of fetal hemoglobin | Falsely high HbCO |
| Elevated bilirubin levels (>20 mg/dl) | Falsely high total Hb, HbO2, metHb |
| Dirty cuvette chamber | Falsely high total Hb, HbO2 |
Pulse Oximetry
No other device in recent medical history has been so widely and quickly adopted into clinical practice. With this widespread use have come equally widespread misconceptions regarding the appropriate applications and limitations of this technology.54 In addition, the true benefit of pulse oximetry related to patient outcomes is unknown.55
To guide practitioners in providing quality care, the AARC has published Clinical Practice Guideline: Pulse Oximetry.56 Modified excerpts from the AARC guideline appear in Clinical Practice Guideline 18-5.
Instrumentation
The pulse oximeter combines the principle of spectrophotometry, as used by hemoximeters, with photoplethysmography. Photoplethysmography uses light to detect the tiny volume changes that occur in living tissue during pulsatile blood flow. However, compared with a hemoximeter, the pulse oximeter usually uses only two wavelengths of light, one red (approximately 660 nm) and one infrared (approximately 940 nm) (see Figure 18-16). In addition, rather than measuring light transmission through a blood sample in a glass cuvette, the pulse oximeter measures transmission through living tissue, such as a finger or earlobe, or reflectance through the skin surface.
Figure 18-18, A provides a schematic block diagram of a pulse oximeter, consisting of a transmission sensor, processor, and display unit. The sensor has two sides. From one side, separate red and infrared LEDs alternately transmit light through the tissue. The transmitted light intensity is measured by a photodetector on the other side. The resulting output signal is filtered and amplified by instrument electronics, with processing and display functions controlled by a microprocessor.
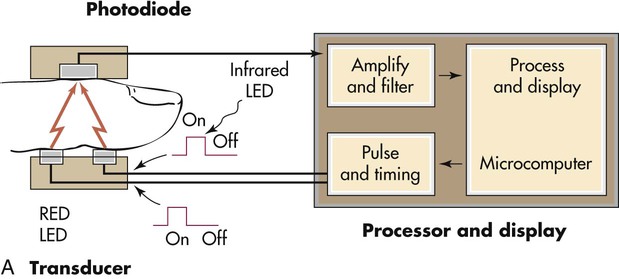
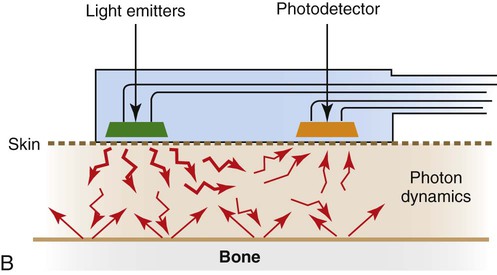
Figure 18-18, B shows a schematic of a reflectance pulse oximeter sensor. This type of sensor has only one side, which contains both the LED light sources and the photodetector. The principle of operation is identical to a transmission sensor except that the sensor is placed on the skin surface, usually the forehead, and reflected light from the tissue back to the sensor is used to calculate SpO2.
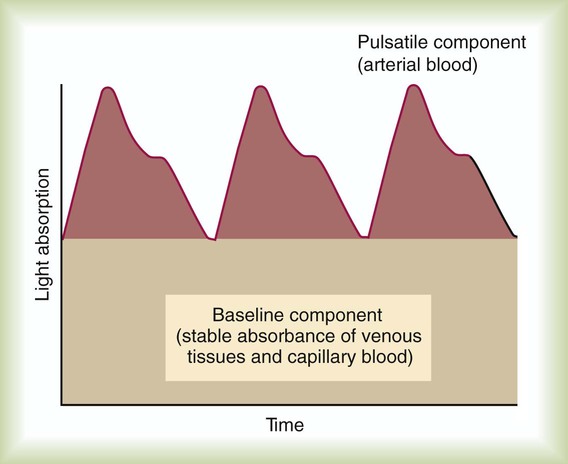
Figure 18-19 shows a typical output signal generated by the photodetector (the pulsatile component can be observed on instruments that have a plethysmographic display). A baseline component represents the stable absorbance of the tissue bed, which mainly is the result of venous and capillary blood. At the top is the pulsatile component, caused by intermittent arterial flow through the tissues. By comparing light absorbance during the pulsatile phase with the baseline value at each wavelength, a pulse-added measure is obtained that is independent of incident light. Arterial oxyhemoglobin saturation is computed as the ratio of the pulse-added absorbances at the two different wavelengths.
In terms of accuracy, the pulse oximetry readings of sick patients usually fall within ±3% to 5% of the readings obtained with invasive hemoximetry.56,57 Generally, the lower the actual SaO2, the less accurate and reliable is the SpO2 measurement. Most clinicians consider pulse oximeter readings unreliable at saturations less than 80%. Instrument response times vary by manufacturer, sensor location, and the patient’s hemodynamic status from 10 seconds to 1 minute or longer.
Procedure
The actual procedure used to measure SpO2 varies according to the device used, sensor site selected, and whether a spot check or continuous monitoring is required. Box 18-9 lists key points to be considered when performing pulse oximetry.
• Date, time of measurement, and reading
• Patient’s position, activity level, and location during monitoring
• FiO2 or O2 flow and O2 delivery device
• Probe type and placement site
• Model of device (if more than one device is available for use)
• Results of simultaneously obtained ABGs and hemoximetry (if available)
• Stability of readings (length of observation time and range of fluctuation)
• Patient’s clinical appearance, including assessment of perfusion at the measuring site (e.g., cyanosis, skin temperature)
• Agreement between oximeter and actual patient heart rate, as determined by palpation or electrocardiogram
 Rule of Thumb
 Problem
Problem Solving and Troubleshooting
Problems with pulse oximetry fall into the following two categories: (1) problems inherent in the technology itself and (2) problems associated with clinical interpretation and use of data. Dozens of technical factors may affect the readings, limit the precision, or alter the performance of pulse oximeters. Table 18-7 summarizes the most important of these factors and the types of errors they cause.
TABLE 18-7
Factors Affecting Accuracy or Precision of Pulse Oximeters
| Factor | Potential Error |
| Presence of HbCO | Falsely high %HbO2 |
| Presence of high levels of metHb | Falsely low %HbO2 if SaO2 >85% |
| Falsely high %HbO2 if SaO2 <85% | |
| Presence of fetal hemoglobin | No effect |
| Anemia (very low hematocrit, <10%) | Falsely low CaO2 and high % HbO2 |
| Vascular dyes (e.g., methylene blue) | Falsely low %HbO2 |
| Elevated bilirubin levels | No effect |
| Dark skin pigmentation | Falsely high %HbO2 (3%-5%) |
| Nail polish (especially black) | Falsely high %HbO2 |
| Ambient light | Varies (e.g., falsely high %HbO2 in sunlight); also may cause falsely high pulse reading |
| Poor perfusion (vasoconstriction) | Inadequate signal; unpredictable results |
| Motion artifact | Unpredictable, spurious readings |
| Electrocautery | Falsely low HbO2 |
| Magnetic resonance imaging | Falsely low HbO2 |
Early studies of the effect of nail polish found significant differences in lowering SpO2 readings. More recent studies have found no effect or small differences that are not considered to be clinically relevant; this may be due to improvements in LED light sources.58 It has been suggested that the effect of nail polish could be minimized either by using a different site or by rotating the sensor so that the light path does not cross the fingernails.
At the high end, oximetry data can be even less meaningful. Because of the characteristics of the oxyhemoglobin dissociation curve (see Chapter 11), a patient with an SpO2 reading of 100% could represent a PaO2 level anywhere between 100 mm Hg and 600 mm Hg. The lesson here is not to use the pulse oximeter for monitoring hyperoxia (as may be important for neonates).
SpO2 can read falsely high when carbon monoxide poisoning or methemoglobinemia is present. This false reading is due to the fact that the two-wavelength pulse oximeter measures only saturation of the Hb and not specifically saturation with O2. HbCO and metHb cannot be distinguished from HbO2 with a pulse oximeter. A falsely high SpO2 reading occurs when significant HbCO is present. When metHb is elevated, the SpO2 reading is higher than the actual measured SaO2. As metHb level increases, SpO2 decreases and plateaus at approximately 85% when the metHb level reaches 30%.59
To address these limitations, pulse oximeters using seven or more wavelengths of light have been developed. Use of multiwavelength pulse oximeters capable of measuring Hb, HbO2, HbCO, and metHb has been referred to as pulse cooximetry. The accuracy of measurements does not equal the accuracy of conventional hemoximetry, but pulse cooximetry may be useful for trend monitoring in some clinical situations.60
Venous Oximetry
Continuous central venous (vena cava) and mixed venous (pulmonary artery) O2 saturation monitoring (S O2) is performed to assess the balance between O2 delivery and use as an indirect index of global tissue oxygenation and perfusion. Decreased S
 O2 has been found to be indicative of cardiac failure in patients with myocardial infarction and to predict poor prognosis in patients after cardiovascular surgery, in patients with severe cardiopulmonary disease, and in patients with septic or cardiogenic shock.61 Regional and organ-specific S
 O2 monitoring has been performed via catheters placed in the coronary sinus, hepatic vein, and cranial jugular venous bulb for cerebral perfusion monitoring. Normal values for S
 O2 range from 60% to 80%.
Instrumentation
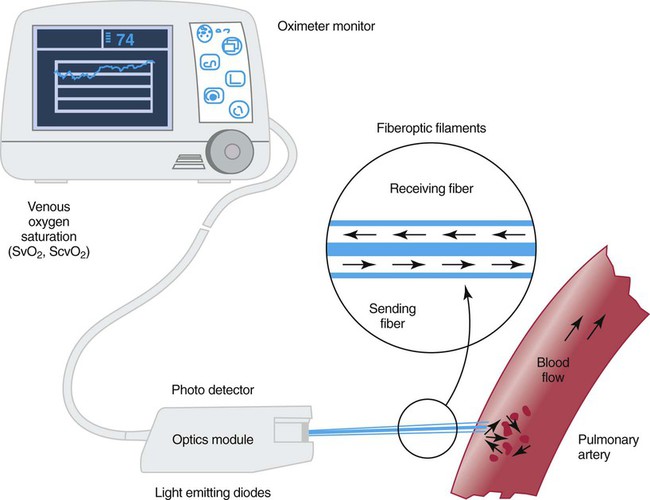
Figure 18-20 shows a diagram of an S O2 monitoring system. Venous oximetry is measured through a fiberoptic catheter by reflectance spectrophotometry. Two or three wavelengths of light are emitted from LEDs through fiberoptic filaments into the venous blood. Some of this light is reflected back and received through another fiberoptic channel, which is read by a photodetector. The amount of light that is absorbed by the venous blood and reflected back is determined by the amount of O2 that is saturated or bound to Hb. This information is processed by the monitor, updated, and displayed as S
 O2.
O2.
Clinical Usefulness
Continuous S O2 can be monitored through an S
 O2-equipped pulmonary artery catheter or venous catheter. Mixed venous oximetry from the pulmonary artery is an indication of global O2 delivery and use. Central venous oximetry is nearly interchangeable with mixed venous oximetry. Both correlate with mixed venous saturation measured by hemoximetry with an accuracy within ±3% to 5%. Accuracy of venous oximetry monitoring depends on the frequency of calibration with measured S
 O2 and Hb, the position of the catheter free floating in the vein, the absence of wall artifact, damage to the fiberoptic filaments, and clot formation at the catheter tip.62,63
Tissue Oximetry
O2 saturation at the tissue level (StO2) assesses the adequacy of circulation and O2 delivery. Early detection of low StO2 can be used as method of early detection of tissue hypoperfusion in patients with traumatic injuries.64,65 Cerebral StO2 monitoring can also be used to monitor brain oxygenation and detect cerebral ischemia during neurosurgical or cardiovascular procedures.66–68
Capnometry and Capnography
Although capnography can be applied to any patient, its primary clinical use is for monitoring during either general anesthesia (where it is a standard of care) or mechanical ventilation. The remainder of this section assumes application during mechanical ventilation. To guide practitioners in providing quality care, the AARC has published Clinical Practice Guideline: Capnography/Capnometry During Mechanical Ventilation.69 Modified excerpts from the AARC guideline appear in Clinical Practice Guidelines 18-6.
18-6 Capnography and Capnometry During Mechanical Ventilation
AARC Clinical Practice Guideline (Excerpts)*
Based on available evidence, capnography may be indicated for the following:
• Evaluation of exhaled CO2, especially end-tidal CO2 levels (PetCO2)
• Monitoring severity of pulmonary disease and evaluating the patient’s response to therapy, especially that intended to do the following:

• Determining that tracheal, rather than esophageal, intubation has taken place
• Continued monitoring of the integrity of the ventilatory circuit, including the artificial airway
• Evaluation of the efficiency of mechanical ventilatory support (by [PaCO2 − PetCO2])
• Monitoring adequacy of pulmonary, systemic, and coronary blood flow
• Monitoring inspired CO2 when CO2 gas is being therapeutically administered
• Graphic evaluation of ventilator-patient interface
• Measurement of the volume of CO2 elimination to assess metabolic rate or alveolar ventilation
Precautions and Possible Complications
• Misunderstanding of the data provided may lead to inappropriate treatment of the patient.
• With mainstream analyzers, too large a sampling window can excessively increase the mechanical dead space circuit.
• The sampling window or the sampling lines can place additional weight on the circuit and increase traction on the patient’s artificial airway.
During capnography, the following should be considered and monitored:
• Ventilatory variables: Tidal volume, respiratory rate, positive end expiratory pressure, inspiratory/expiratory time ratio, peak airway pressure, and concentrations of respiratory gas mixture
• Hemodynamic variables: Systemic and pulmonary blood pressures, cardiac output, shunt, and ventilation/perfusion imbalances
*For the complete guideline, see American Association for Respiratory Care: Clinical practice guideline: capnography/capnometry during mechanical ventilation. Respir Care 48:534, 2003.
Instrumentation
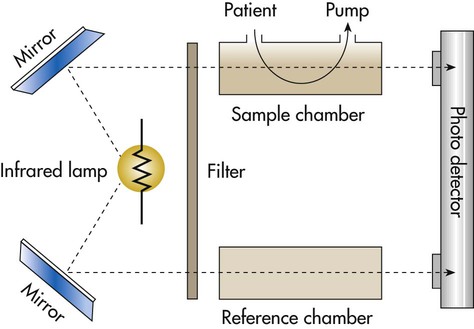
Figure 18-21 provides a simple schematic of a double-beam infrared capnometer. A filtered infrared light source passes through a sample chamber. (Because glass absorbs infrared radiation, the chamber “windows” usually are constructed of sodium chloride or sodium bromide.) After the infrared light passes through the sample chamber, a lens focuses the remaining, unabsorbed radiation onto an electrical photodetector. Because CO2 absorbs infrared radiation, the greater the concentration of CO2 in the sample, the less infrared light arrives at the detector. Variations in the concentration of CO2 alter the electrical output signal of the detector. This signal is used either to display the CO2 concentration with LEDs (capnometer) or to generate a real-time graphic display (capnogram).70
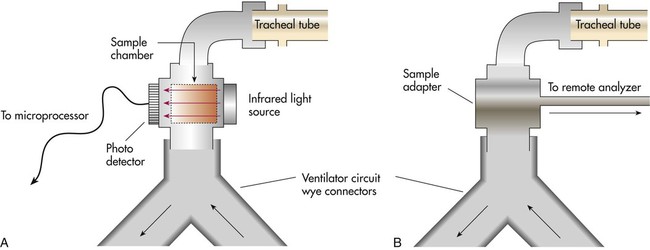
Capnometers use two different methods to sample the respiratory gases: mainstream sampling and sidestream sampling (Figure 18-22). The mainstream analyzer places an in-line analysis chamber between the patient’s airway and the ventilator circuit. The sidestream analyzer uses a sampling tube to pump a small volume of gas continually from the ventilator circuit into the analysis chamber within the device. Table 18-8 lists the advantages and disadvantages of these two approaches. Differences notwithstanding, clinicians should use the method best suited to the patient’s needs and the device with which they are most experienced and familiar.
TABLE 18-8
Advantages and Disadvantages of Mainstream and Sidestream Capnometers
| Mainstream | Sidestream | |
| Advantages | Sensor at patient airway | No bulky sensors or heaters at airway |
| Fast response (crisp waveform) | Ability to measure N2O | |
| Short lag time (real-time readings) | Disposable sample line | |
| No sample flow to reduce tidal volume | Ability to use with nonintubated patients | |
| Disadvantages | Secretions and humidity can block sensor window | Secretions block sample tubing |
| Sensor requires heating to prevent condensation | Trap required to remove water from sample | |
| Requires frequent calibration | Frequent calibration required | |
| Bulky sensor at patient airway | Slow response to CO2 changes | |
| Does not measure N2O | Lag time between CO2 change and measurement | |
| Difficult to use with nonintubated patients | Sample flow may decrease tidal volume | |
| Reusable adapters require cleaning and sterilization |
From Kacmarek RM, Hess D, Stoller J, editors: Monitoring in respiratory care, St Louis, 1993, Mosby.
Interpretation
 ) imbalance caused by either pulmonary disease or cardiovascular disorders. Capnometry also has been used to estimate physiologic dead space, to detect esophageal intubation, to assess blood flow during cardiac arrest, and to determine positive end expiratory pressure levels. To interpret abnormal events, clinicians first must understand the normal capnogram.
Normal Capnogram
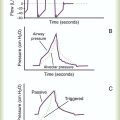
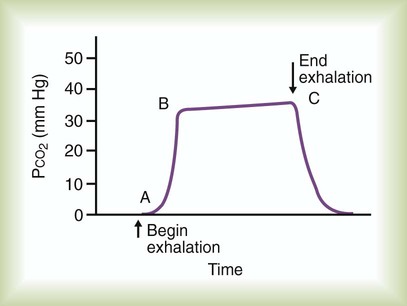
Figure 18-23 shows a typical normal single-breath capnogram. Initially, the expired PCO2 is 0 mm Hg, indicating exhalation of pure dead space gas (A, phase I). Soon after, alveolar gas begins mixing with dead space gas, causing a rapid increase in expired PCO2 (A to B, phase II). Later in expiration, the CO2 concentration begins leveling off. This plateau indicates exhalation of gas coming mainly from ventilated alveoli (B to C, phase III). Gas sampled at the end of exhalation is called end-tidal gas, with its partial pressure of CO2 abbreviated as PetCO2. In healthy individuals, PetCO2 averages 3 to 5 mm Hg less than PaCO2, or 35 to 43 mm Hg (approximately 5% to 6% CO2). The sharp downstroke and return to baseline that normally occurs after the end-tidal point indicates inhalation of fresh gas with zero CO2.
 Problem
Abnormal Capnogram
The first step in assessing the capnogram is to determine the actual PetCO2 and whether it has changed over time. Table 18-9 differentiates between the causes of high and low PetCO2 readings by the suddenness of the change. A PetCO2 of zero usually indicates a system leak, esophageal intubation, or cardiac arrest.
TABLE 18-9
Conditions Associated With Changes in PetCO2
| Change | High PetCO2 | Low PetCO2 |
| Sudden | Sudden increase in cardiac output | Sudden hyperventilation |
| Sudden release of a tourniquet | Sudden decrease in cardiac output | |
| Injection of sodium bicarbonate | Massive pulmonary embolism | |
| Air embolism | ||
| Disconnection of ventilator | ||
| Obstruction of endotracheal tube | ||
| Leakage in the circuit | ||
| Gradual | Hypoventilation | Hyperventilation |
| Increase in CO2 production | Decrease in oxygen consumption | |
| Decreased pulmonary perfusion |
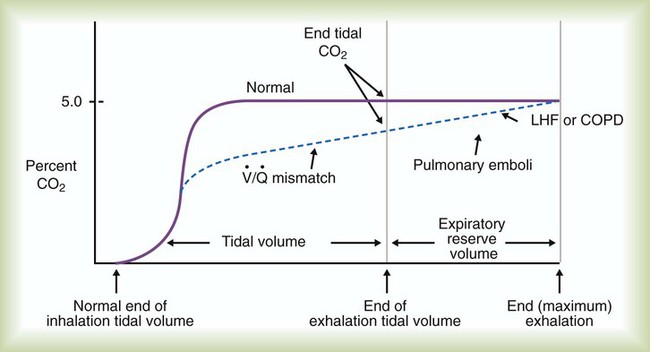
After the capnogram has been assessed for changes in PetCO2, the waveform and its pattern should be analyzed. A normal capnogram starts with a sharp upstroke, followed by a plateau and then a rapid downstroke. As indicated in Figure 18-24, changes in this normal contour may indicate a ventilation/perfusion abnormality. Such patterns, although not diagnostic, can indicate the severity of the  disturbance and can warn of developing problems, such as acute pulmonary emboli.
Waveform changes also may occur with equipment malfunction. Because the normal inspired CO2 level is zero, the capnogram baseline also should be at zero. An elevated baseline (>0 mm Hg) indicates rebreathing. However, an expired CO2 level of zero might indicate patient disconnect. (For more information on the use of capnography during mechanical ventilation, see Chapter 46.)
Problem Solving and Troubleshooting
Monitoring a patient with a capnograph that is properly calibrated and operating according to the manufacturer’s specifications presents few major problems. The most significant error is assuming that the end-expired CO2 levels can substitute for actual PaCO2 measurements. The most common problem is contamination or obstruction of the sampling system or monitor by secretions or condensate.27 Proper use of water traps and regular changing of sample tubing or chambers can help prevent this problem. Other potential problems include the following:
• False reading caused by the presence of gases with infrared absorption spectra similar to CO2 (e.g., nitrous oxide)
• Inaccurate readings with high frequencies of breathing (this is more of a problem with sidestream systems)
• Misinterpreting low or absent cardiac output as a disconnect or possible esophageal intubation (all three can result in a PetCO2 of zero)
Summary Checklist
• To measure the inspired O2 concentration, a properly calibrated electrochemical O2 analyzer should be used.
• The most common causes of O2 analyzer malfunction are low batteries, sensor depletion, and electronic failure.
• As the “gold standard” of gas exchange analysis, ABG results help the clinician assess ventilation, acid-base balance, oxygenation, and the O2-carrying capacity of blood.
• The radial artery is the preferred site for adult arterial blood sampling. Before radial puncture, a modified Allen test to confirm collateral circulation is performed.
• For critically ill patients, the clinician waits 20 to 30 minutes after a change in treatment before sampling arterial blood.
• Most preanalytic blood gas errors can be avoided by ensuring that the sample was obtained anaerobically, is properly anticoagulated, and is analyzed within 15 minutes.
• Indwelling peripheral artery, central venous, and pulmonary artery catheters give ready access for blood sampling and allow continuous pressure monitoring but with increased risk of infection and thrombosis.
• Capillary blood pH and PCO2 are sometimes used to assess acid-base status in infants and children. Capillary PO2 is of little value in estimating arterial oxygenation.
• To perform blood gas analysis and hemoximetry, the clinician must be proficient in performing procedures, preventive maintenance, troubleshooting, instrument calibration, and quality control.
• A blood gas analyzer measures pH, PCO2, and PO2 using three separate electrodes.
• To obtain accurate blood gas results, the clinician ensures that the sample is free of preanalytic error and follows the manufacturer’s recommended analysis protocol.
• Blood gas analysis quality control involves a cycle of performance validation for new instruments, preventive maintenance and function checks, automated calibration, calibration verification with control media, internal statistical quality control, external proficiency testing, and thorough recordkeeping of all processes.
• Portable point-of-care blood gas analyzers can achieve accuracy and precision levels comparable with laboratory-based analyzers.
• A blood gas monitor provides bedside measurements either continuously or at appropriate intervals, without permanently removing blood from the patient; this may be accomplished transcutaneously or with either in vivo or ex vivo blood analysis.
• Transcutaneous blood gas monitoring provides continuous noninvasive analysis of gas exchange, but it is useful only for hemodynamically stable infants or children.
• Current in vivo blood gas monitors are not yet reliable enough to replace traditional blood gas analysis, but they may provide information at a level of accuracy and reliability sufficient for trend analysis.
• Oximetry is the measurement of blood Hb saturations using spectrophotometry. Hemoximetry is a laboratory procedure that requires an arterial blood sample. Pulse oximetry combines spectrophotometry with photoplethysmography to obtain a noninvasive measure of blood Hb saturations.
• At best, pulse oximetry readings fall within ±3% to 5% of readings obtained by hemoximetry.
• Dozens of technical factors affect the readings, limit the precision, or alter the performance of pulse oximeters. To interpret test results properly, clinicians must have in-depth knowledge of these factors.
• Capnometry is the measurement of CO2 in respiratory gases. A capnometer is the device that measures the CO2. Capnography is the graphic display of CO2 levels as they change during breathing.
• A capnogram may be used to assess trends in alveolar ventilation, to identify  imbalance caused by cardiopulmonary disorders, to estimate physiologic dead space, to detect esophageal intubation, and to determine the amount of blood flow during cardiac arrest.