[level-membership-for-opthalmology-category]
Chapter 65 Age-Related Macular Degeneration
Non-neovascular Early AMD, Intermediate AMD, and Geographic Atrophy
Introduction
Age-related macular degeneration (AMD) has been the leading cause of legal blindness in patients aged 65 or over,1 and it has been the most common overall cause of blindness in the western world. Using data from the 2000 census, it has been estimated that in the USA more than 8 million people have specific AMD features that put them at risk for progression to advanced AMD and vision loss.2,3 Over a 5-year period about 1.3 million of these individuals are predicted to develop the advanced forms of AMD, namely neovascular AMD or foveal geographic atrophy (GA).2 In addition, hundreds of thousands of people aged 75 and over are anticipated to join the pool of people at increased risk of developing advanced AMD over subsequent 5-year periods.4 The prevalence of AMD continues to rise as a result of the increasing percentage of elderly persons and the improved management of other eye diseases.3 Prevalence of AMD has also increased steadily in the UK, accounting for approximately 50% of registered blindness in England and Wales that cannot be explained by the increasing age of the population alone.5 In addition, macular degeneration is the commonest reason that patients with lesser handicaps attend low-vision clinics.
Within the past 5 years new and improved treatments for the neovascular form of advanced AMD have been adopted throughout the developed world. Therefore, in the years ahead the overall burden of vision loss associated with AMD is anticipated to decline substantially.6 The same progress has not been made for treatment of advanced non-neovascular AMD (GA); as such, the importance of atrophic AMD as a leading cause of vision impairment is expected to increase.
The advanced forms of AMD are those that are frequently associated with visual acuity loss and they are divided into non-neovascular atrophic (dry) type and neovascular (wet) type. In atrophic AMD, gradual disappearance of the retinal pigment epithelium (RPE) results in one or more patches of atrophy that slowly enlarge and coalesce. Affected areas have no visual function, since loss of the RPE is associated with fallout of photoreceptors. Gass7 applied the term “geographic atrophy of the retinal pigment epithelium” to this presentation, which is the natural end-result of AMD in the absence of clinical evidence of choroidal neovascularization (CNV). This chapter is devoted to the clinical and pathologic features that may lead to this development, as well as their management.
Senile macular degeneration was first reported as a clinical entity in 1885 by Otto Haab,8 who described a variety of pigmentary and atrophic changes in the macular region, causing progressive impairment of central vision in patients over the age of 50. Subsequent observers referred to the different fundus manifestations of the disease as separate entities, resulting in a variety of descriptive eponyms. A review of dominantly inherited drusen9 found, however, that only Doyne’s honeycomb familial choroiditis and malattia levantinese were disorders that could be distinguished from each other by clinical criteria, and these entities are considered to be a separate category. A major step toward a better understanding of the disease was taken when Gass10 clarified that drusen, senile macular degeneration, and senile disciform macular degeneration represented a single disease.
In the 1990s it had been proposed that the features should be termed either early or late age-related maculopathy (ARM),11,12 to suggest that early ARM was not necessarily a pathologic state, with the term age-related macular degeneration (AMD) being reserved for late ARM and encompassing geographic atrophy and neovascular AMD. Since many epidemiologic studies are based on the International Epidemiological Age-related Maculopathy Study Group11 description, it is described here. However, more recent descriptions of AMD from the Age-Related Eye Disease Study Group13 have provided longitudinal information to understand features associated with an increased risk of developing advanced forms of AMD and are used in the description of the clinical management of AMD that follows.
In the International Epidemiological Age-related Maculopathy Study Group11 definitions used in many epidemiologic studies, early ARM was defined as a degenerative disorder in individuals ≥50 years of age, characterized by the presence of any of the following lesions:
• Soft drusen (intermediate >63 µm, ≤125 µm; large >125 µm) drusen. When occurring alone, soft, indistinct drusen are considered more likely to indicate AMD than soft, distinct drusen,4,14,15 and drusen over 125 µm have greater importance than smaller drusen.16,17
• Areas of hyperpigmentation associated with drusen but excluding pigment surrounding hard drusen.
• Areas of depigmentation or hypopigmentation associated with drusen. These areas, which commonly occur as drusen fade, are most often more sharply demarcated than drusen, but do not permit exposure of the underlying choroidal vessels.
• Visual acuity is not used to define ARM or AMD because advanced changes may be present without anatomically affecting the fovea.
This definition of early ARM excluded small, hard drusen alone, pigment changes alone, and even pigment changes surrounding small, hard drusen for two reasons: (1) hard drusen become an almost constant finding in the fifth decade; and (2) a number of diverse processes can cause pigment abnormalities that may not be possible to distinguish from early ARM, so the inclusion of soft drusen makes the definition more specific to ARM and AMD.14 However, eyes with numerous small, hard drusen or eyes with pigment abnormalities in the absence of obvious drusen can also progress to soft drusen.
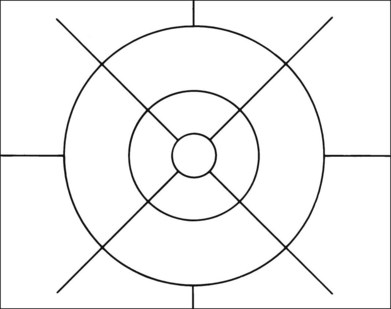
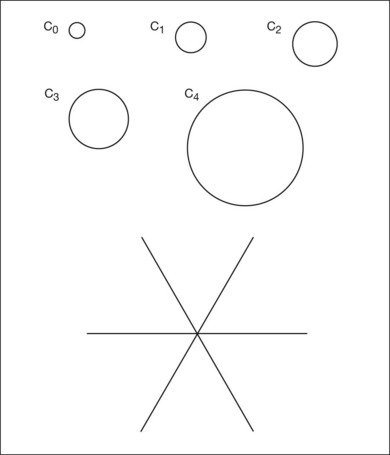
Grading systems have been devised to permit comparison of severity over time in the size, number, and extent of drusen.11,18–20 Drusen extent is measured by mentally sweeping all drusen present in the area of interest into a condensed zone and estimating the area of that zone. Grids and standard circles prepared on transparent sheets are overlaid to one film image of a pair of stereoscopic color fundus transparencies to assist in the grading process. Alternatively, a digital version of the same grids and circles is superimposed on a digital fundus image. Because of the 3× magnification of the 30-degree fundus camera, 4.7 mm on the grid corresponds to approximately 1500 µm, the diameter of the optic disc in the average fundus. Figure 65.1 illustrates the standard grid used when applying the Wisconsin Age-Related Maculopathy Grading System.20 This same grid is used in most fundus grading systems of AMD from color photographs. The diameters of the circles within the standard grid are respectively 1000 µm, 3000 µm, and 6000 µm. The central and middle circles combined define the inner macula, which is two disc diameters across. The outer circle defines the macula itself. Figure 65.2 illustrates smaller standard circles, which are used to grade the size and area of specified lesions.11
These grading systems are applied to color images and are intended primarily for epidemiologic studies and clinical trials. However, fluorescein angiography often provides additional insight into the natural history of the disease, as do pathologic studies,21–25 which have demonstrated aging and degeneration to be a continuum based on diffuse morphologic changes at the level of the RPE under the macula, as distinct from focal abnormalities such as drusen. These diffuse changes comprise two types of sub-RPE or basal deposits separated by the RPE basement membrane. On the internal aspect lies a layer of abnormal basement membrane material, referred to as the basal laminar deposit (BLD); on the external aspect of the basement membrane is a layer of membranous debris, referred to as the basal linear deposit.22 This latter deposit may build up into a type of soft drusen specific for AMD. However, although significant diffuse changes correlate with a decline in visual acuity,23 they are difficult to see in the fundus, making a histologic definition of AMD based on basal laminar and basal linear deposits unworkable in a clinical setting.
Aging
The aging eye – clinical findings
The normal aged fundus usually demonstrates loss of the foveal and foveolar reflexes. This may be due to fallout of cells from the inner retinal layers, shallowing of the walls of the foveal pit, and enlargement of the capillary-free zone.26 A few small, hard drusen are almost always present.12,14,16,18
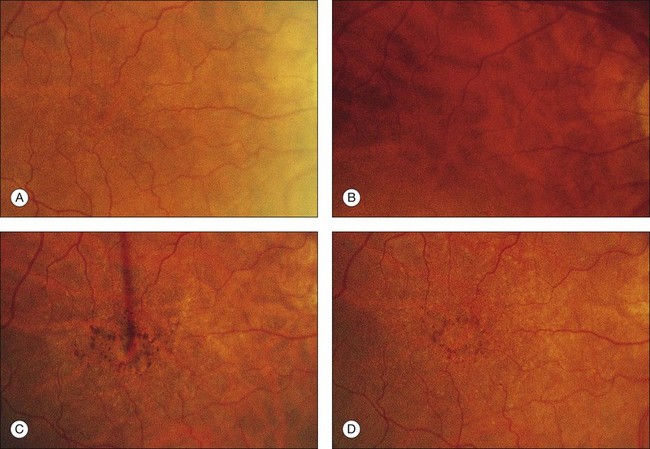
Irregularity of retinal pigmentation gives rise to a fine granularity, and the fundus commonly demonstrates a tigroid background. This senile tigroid fundus (see Fig. 65.3A) is increasingly apparent with advancing age but remains compatible with normal vision. It is unrelated to skin pigmentation and differs from the tigroid fundus in youth in that the choroidal vessels become visible under the macula. There is commonly also a peripapillary halo of atrophy in which the exposed vessels may be sheathed and the intervascular spaces appear pale. Studies using blue-field stimulation27 and scanning laser Doppler flowmetry28 have shown a decrease in blood flow in the retinal macular capillaries of older individuals, and a lower number of perifoveal arterioles and venules have also been reported.29 These findings are consistent with enlargement of the capillary-free zone26 and loss of ganglion cells.30
Many aspects of visual function, not just visual acuity, show a decline with age, including dark adaptation, stereopsis, contrast sensitivity, sensitivity to glare, and visual field tests.31,32 Color perception and foveal cone pigment densities show a decline.33 The limits of normal aging are therefore difficult to define in terms of visual performance.
The aging eye – morphologic changes
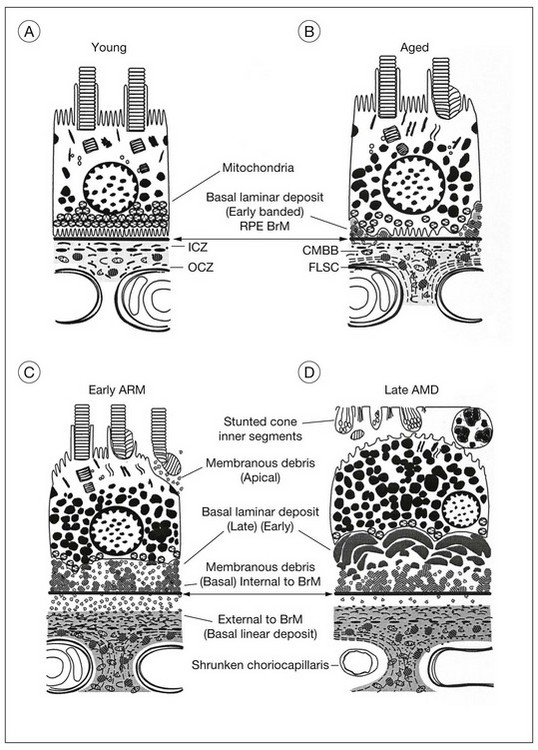
The evolution of the aging process is easier to appreciate by studying morphologic changes. The RPE, Bruch’s membrane, and choriocapillaris must function efficiently to serve as the nutritional complex for the photoreceptors. In a normal eye (Fig. 65.4A), the complement of photoreceptors is normal, the RPE forms a regular layer, Bruch’s membrane is not unduly thickened, and the choroid consists of the usual three layers of vessels. Each of these tissues has at one time been regarded as primarily at fault in macular degeneration. Therefore it is first necessary to consider the changes developing in these structures during life (Fig. 65.4B).
Photoreceptors
The cone density at the foveal center does not appear to alter significantly during the first eight decades.30,34,35 A significant loss beyond the ninth decade has been reported, but it is not invariable.36
In the rods the outer segments become convoluted, possibly as an expression of impaired phagocytosis.37 This may lead to the accumulation of outer-segment material at the apical surface of the RPE.36 Fallout of rods can also be demonstrated, with the fastest rate occurring between the second and fourth decades. Cells in the ganglion cell layer show a similar rate of decrease, so the rod and ganglion cell layer densities maintain a constant ratio.30 Rod photoreceptors and cells in the ganglion cell layer therefore appear to be more vulnerable than cones to loss during aging. In fact, this may be the initial subclinical stage of AMD because the spatial population of parafoveal rods decreases by 30% during adulthood, and AMD often commences in a similar parafoveal distribution.34,38
Retinal pigment epithelium
Each pigment epithelial cell must continue to engulf spent photoreceptor discs on a diurnal basis for life, the rods being digested by day and the cones by night,39 and any undigested residual bodies remain as lipofuscin.40 The RPE must also remove material from other retinal pigment cells or photoreceptors that may be eliminated, a burden that increases sharply once degeneration of these tissues commences. Finally, because the RPE is a nondividing tissue, autophagy alone could lead to the accumulation of lipofuscin in the same way that it builds up in the neurons of the central nervous system, which have no photoreceptors to phagocytose. The RPE is therefore particularly vulnerable to cell encumbrance.
Damage to molecules may occur in the photoreceptor outer segments as a result of free radical chain reactions initiated by radiation or oxygen metabolism. After phagocytosis, the lysosomal enzymes may fail to “recognize” these abnormal molecules, with a consequent failure of molecular degradation41 and accumulation of lipofuscin. Free radicals also damage the cells’ own molecules, and there is evidence that enzymatic inactivation occurs, particularly cathepsin D, which is the main lysosomal protease responsible for rod outer-segment digestion.42 There is also an increase of complex granules of melanolysosomes and melanolipofuscin, which are thought to be melanin granules undergoing repair or degradation.
The accumulation of lipofuscin in the RPE, which can be demonstrated as early as the second decade of life,43 reduces the cytoplasmic space. As the cell volume available to the organelles diminishes, the capacity to deal with photoreceptors is reduced. The issue of whether lipofuscin accumulation has significant deleterious effects on the RPE, and consequently on overall retinal function, continues to be of great interest.44,45 Since lipofuscin is the predominant fluorophore responsible for fundus autofluorescence, the in vivo imaging and mapping of retinal autofluorescence using the confocal scanning laser ophthalmoscope46 or fundus spectrophotometer47 may prove helpful in estimating the risk for progression to AMD.
A certain loss of RPE cells occurs with age, particularly in the periphery. For the fovea this decrease in cell density has been estimated to be about 0.3% per year.48 The ratio of photoreceptors to RPE cells remains the same,30,36 the average cone-to-RPE ratio at the center of fovea being approximately 24 : 1. Photoreceptors and RPE cells therefore show a parallel loss during aging. However, the most notable changes in the RPE develop at the base of the cells, where there is loss of basal infoldings and deposition of patches of abnormal basement membrane material (Fig. 65.4B). (This BLD is described under “Onset and progress of age-related macular degeneration”, below.)
Bruch’s membrane
Although anatomists regard Bruch’s membrane as a five-layered structure, pathologic processes are more readily understood if one uses the definition proposed by Gass49 that excludes the basement membranes of the RPE and choriocapillaris. Bruch’s membrane can then be thought of as a sheet-like condensation of the innermost portion of the choroidal stroma that consists of an inner and outer collagenous zone separated by the elastic layer. In this way the location of drusen, RPE detachments, and sub-RPE neovascular membranes can be described more accurately than by using the all-embracing term “within Bruch’s membrane.” Also, thickening of Bruch’s membrane then refers to the collagenous layers alone, which focuses on a possible etiologic role for Bruch’s membrane in AMD, rather than on the actual manifestations of the disease mentioned above.
A linear relationship exists between the thickness of Bruch’s membrane and age, the membrane increasing in thickness from 2 µm in the first decade of life to 4.7 µm by the 10th decade.50 The debris that accumulates within the collagenous and elastic layers, which coincides with the buildup of lipofuscin in the RPE and is similarly first detected early in life on electron microscopy, takes three main forms:
1. A general increase in collagen. The 64 nm banded fibers found in increasing numbers in the collagenous layers with age are believed to be fibrillar type I collagen.51 Clumps of fibrous long-spacing collagen with band periodicity of about 120 nm are found primarily in the outer collagenous layer or embedded in the basement membrane of the choriocapillaris.52,53 Fibrous long-spacing collagen is thought to be a combination of collagen and proteoglycans or glycoprotein and may be formed by depolymerization of native collagen fibrils.52 Other components that have been identified include collagen types III, IV, and V, fibronectin, chondroitin sulfate, dermatan sulfate, and proteoglycans.51,54 A significant linear decline in solubility of Bruch’s membrane collagen occurs with age and may be due to increase in crosslinking.51
2. Rounded, coated membrane-bound bodies (Fig. 65.4B, Fig. 65.5). Since these are found as early as the second decade,55 it has been suggested that this material may result from the shedding of unwanted basal cytoplasm through the basement membrane of the RPE.56 The actual separation of the bodies from the cells appears to have been demonstrated,57 but it is such a rare finding that their derivation remains uncertain. These membrane-bound bodies then rupture, spilling their content of coated vesicles and granular material into Bruch’s membrane and, together with fragments of the coated membrane wall, the resulting debris accounts for most of the thickening of Bruch’s membrane with age.58 However, most of the debris is found in the outer collagenous zone and even on the outer side of the choroidal capillaries, suggesting that it may also be derived from the choroid.53
3. Mineralized deposits, which primarily affect the elastic lamina. The degeneration of elastin may be initiated by actinic damage.24 The corresponding histologic findings in Bruch’s membrane, which become evident in the fifth decade, comprise thickening, hyalinization, and patchy basophilia.23,25 This diffuse deposition in the collagenous zones also extends down the intercapillary pillars and can be correlated with an increase in the lipid content of Bruch’s membrane after the fourth decade.59–61 The lipids consist largely of phospholipids, triglycerides, fatty acids, and free cholesterol. There is little cholesterol ester, which would have been expected to predominate if the lipids had been derived from the bloodstream, suggesting that the source of the material is the RPE.59 However, the specific inclusions seen with electron microscopy cannot be correlated with any particular type of lipid.62
Peroxidized lipids have been identified in Bruch’s membrane, the total amount increasing exponentially with age. The peroxidized lipids identified were derived from long-chain polyunsaturated fatty acids, particularly docosahexanoic acid and linolenic acid, which are polyunsaturated fatty acids found in photoreceptor outer segments. Lipid peroxides have been shown to induce neovascularization by inducing expression of a cascade of angiogenic cytokines.63
Changes in hydraulic conductivity
Hydraulic conductivity is the measurement of the bulk flow of fluid through a test membrane in response to applied pressure. Bruch’s membrane would be expected to show increasing resistance to flow with age because it exhibits a linear increase in thickness50 and a significant accumulation of lipid after the fourth decade.61,62,64 However, studies undertaken on Bruch’s membrane have shown that the decrease in hydraulic conductivity is exponential, being greatest in the first four decades of life.65,66 It is unclear why this occurs before age 40. It has therefore been suggested that remodeling of collagen occurs as a result of increased cross-linkage, and this may cause an increase in rigidity of the membrane and reduced pore size, with entrapment of passing protein molecules.67 After age 40 the increasing lipid content would be expected to have an increasing effect on hydraulic conductivity, while in the 60s a further reduction would result from the diffuse deposits that appear beneath the RPE.
The excimer laser has been used to remove progressively ultrathin shavings of Bruch’s membrane to determine in which layer the major barrier to the flow of water lies. This demonstrated that the greatest resistance throughout life resides within the inner collagenous zone.66 Serial ultrathin sections cut parallel to the plane of Bruch’s membrane to estimate the porosity at sequential levels confirmed that the inner collagenous zone presented the lowest porosity. Calculations based on the pore radii and length further confirmed that the inner collagenous zone also had the lowest flow rate. However, ultrastructural studies would appear to indicate that it is mainly the outer collagenous zone that increases in thickness with age, with the inner collagenous zone remaining constant.58 Clearly, further studies are required, as only a limited number of younger eyes have been examined.
Choroid
A decrease in choroidal blood flow with age can be demonstrated by laser Doppler flowmetry and is mainly due to a decrease in choroidal blood volume rather than in velocity of flow.68 This is consistent with histologic changes in aged eyes. Comparing normal maculas in the first and 10th decades, the density of the choroidal capillaries (combined length of capillary lumina per unit length) decreased in a linear fashion by 45%, and the anteroposterior diameter by 34%.50
The middle layer of medium-sized vessels decreases with age, resulting in a progressive decrease in thickness of the choroid from 200 µm at birth to 80 µm by the age of 90 years.50 The resulting thinning of the choroid throws the remaining larger vessels into greater prominence, accounting for the senile tigroid fundus. This clinical appearance has generally been attributed to unmasking of the choroidal vessels by attenuation and loss of pigment from the retinal pigment cells. However, senile choroidal atrophy appears to contribute more significantly to the increased visibility of the vessels.
Onset and progress of age-related macular degeneration
Clinical features in the absence of drusen
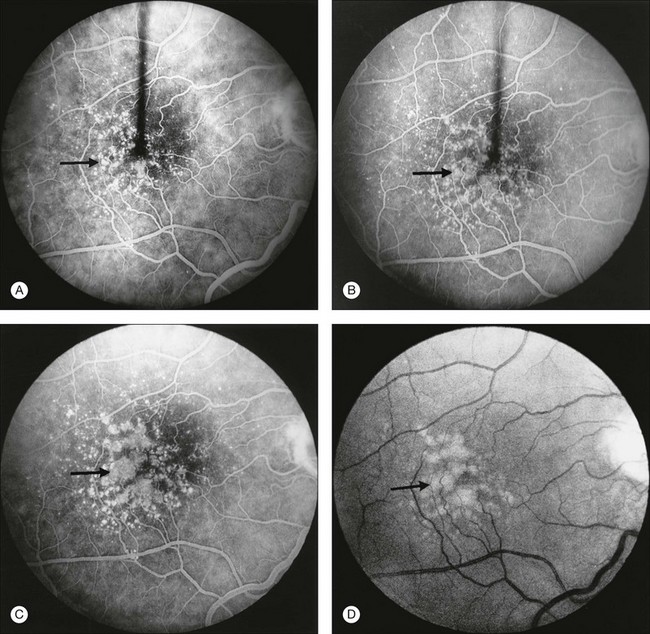
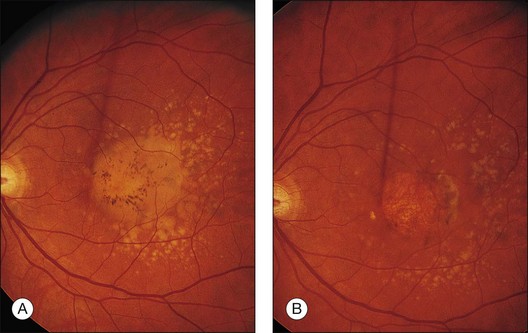
The patient illustrated in Figs 65.3 and 65.6 shows this evolution to geographic atrophy over a 17-year time span. The first change detected was the presence of scattered, small drusen-like dots, 25–50 µm in size (Fig. 65.3B). A ring of small pigment clumps then developed around the fovea (Fig. 65.3C, D), but vision remained 20/20, demonstrating the difficulty of determining when, on the basis of visual acuity alone, pigment changes become pathologic. This is due to the fact that the foveal center is often spared for many years. Hyperpigmentation is accompanied by hypopigmentation, with geographic atrophy (Fig. 65.6) then spreading into the area of attenuated RPE (incipient atrophy).
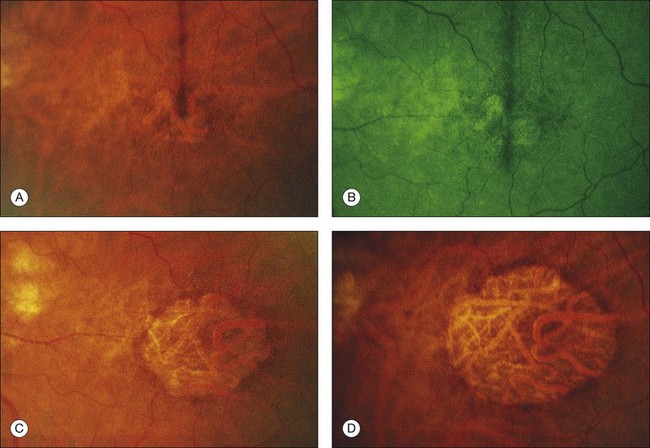
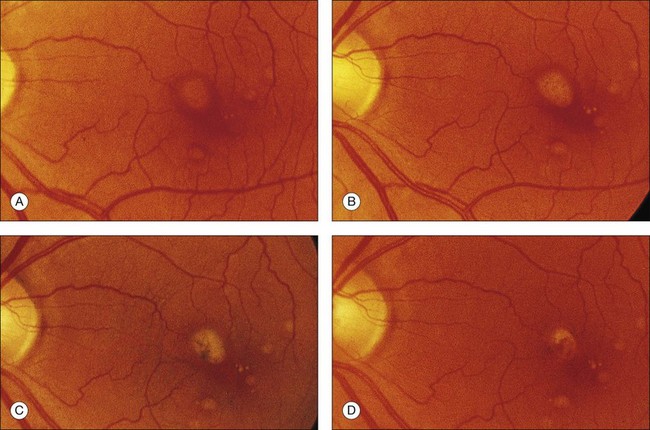
Fig. 65.6 Same patient as in Fig. 65.3. (A and B, red-free) At age 81, patient fixing between two small areas of atrophy that have developed. Pigment clumping and drusen-like dots are spreading outward. This surrounding incipient atrophy corresponds to the area of geographic atrophy that developed subsequently (D); vision is still 20/30. (C) At age 82, atrophy involves fixation, and dots have faded. Vision has dropped to 20/200. (D) At age 84, area of atrophy has almost doubled; vision is 20/400. Choroidal atrophy causes exposed vessels to appear white. Patient died at age 85. Pathology of this eye is shown in Fig. 65.8.
(Reproduced with permission from Sarks JP, Sarks SH, Killingsworth M. Evolution of geographic atrophy of the retinal pigment epithelium. Eye 1988;2:552–77.)
Morphologic changes
The morphologic alterations (see Fig. 65.4C) considered thus far in the photoreceptors, RPE, Bruch’s membrane, and choroid are progressive throughout life. However, by the seventh decade other changes have appeared at the base of the RPE that have no counterpart in earlier life. These comprise the deposition of basement membrane-like material and shedding of membranous debris. Although these changes first develop in a patchy distribution while the fundus and vision are still normal, their diffuse occurrence is the principal feature of AMD.23,69,70
Basal laminar deposit – early form
The BLD lies beneath the RPE, between the plasma membrane and the basement membrane, in contrast to typical drusen, which lie external to the basement membrane. It can be demonstrated consistently by the seventh decade,23 but has been found even in the fifth decade.25 It first appears in a patchy distribution over thickened or basophilic segments of Bruch’s membrane, over intercapillary pillars, or over small drusen, suggesting a potential response to altered filtration at these sites. It can be quantified histologically25 as class 1 (small, solitary patches), class 2 (a thin continuous layer), and class 3 (a thick layer, at least half the height of the RPE).
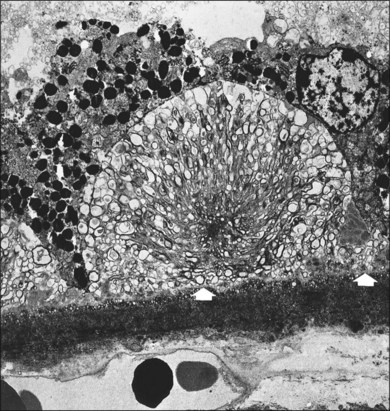
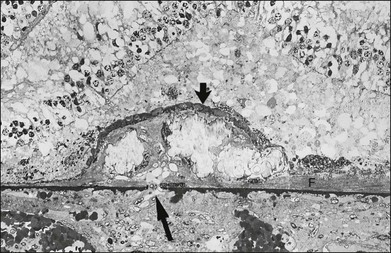
Histologically the deposit exists in two different forms, early and late, according to the stage of degeneration. The early BLD is a pale-staining eosinophilic material that stains blue with picro-Mallory and shows faint anteroposterior striations (Fig. 65.7). On electron microscopy the BLD consists of three phenotypes: fibrillar, amorphous, and polymerized. The fibrillar phenotype appears to be the earliest manifestation and may only be detected by electron microscopy as irregular nodules lying on the original basement membrane. The polymerized form resembles the fibrous long-spacing collagen seen in Bruch’s membrane and is also found in the cornea, trabecular meshwork, and other tissues in the body.53 It projects internally from the original RPE basement membrane71 (Fig. 65.8) and accounts for the striations, or bush-like appearance, seen histologically.
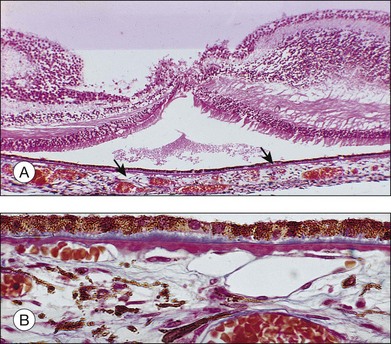
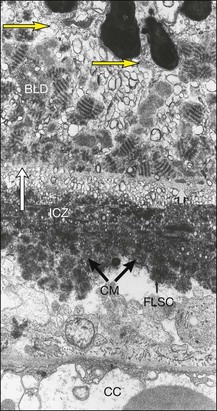
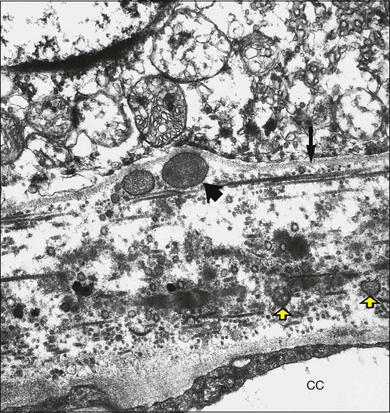
Fig. 65.8 Electron micrograph illustrating changes developing between retinal pigment epithelium and choriocapillaris (CC) in age-related maculopathy corresponding to Fig. 65.4C. Horizontal yellow arrows indicate the basal plasma membrane of the RPE. Early-type basal laminar deposit (BLD) projects inward from the RPE basement membrane (white arrows) and comprises mainly banded material resembling fibrous long-spacing collagen. Coiled membranes with a bilayered structure of lipids lie among the clumps of BLD and appear to pass through the basement membrane to lie between it and the inner collagenous zone (ICZ), as well as filtering into the membrane itself. Identifiable structures within Bruch’s membrane include fragments of coated membrane (CM) and fibrous long-spacing collagen (FLSC) (×11 780).
(Reproduced with permission from Killingsworth MC, Sarks JP, Sarks SH. Macrophages related to Bruch’s membrane in age-related macular degeneration. Eye 1990;4:613–21.)
The similarity of the BLD to basement membrane and its proximity to rough endoplasmic reticulum at the base of the cells suggest it is a secretory product of the RPE.71,72 It reacts with antibodies against type IV collagen, heparan sulfate proteoglycans, and laminin,54,55,72,73 but the BLD is biochemically distinct from the RPE basement membrane, and a faulty, degradative process rather than enhanced synthesis may account for its accumulation in aged maculas.54,55
Membranous debris
Coiled membrane fragments continuous with the plasma membrane of the RPE appear together with the BLD, but they are not found unless BLD is also present24 (Fig. 65.8). This material has the bilayered structure of phospholipids and is not to be confused with the coated membrane-bound bodies described earlier in Bruch’s membrane. Whereas by light microscopy the BLD was regarded as the hallmark of macular degeneration, by electron microscopy it is this membranous debris that correlates more closely with the degree of degeneration. These membranes are found in three locations, as described in the following paragraphs.
Internal to the retinal pigment epithelium basement membrane
The coils appear to be extruded from the base of the cells, which have lost their infoldings, although they may alternatively result from a free-energy process in which lipid molecules are deposited by the RPE into Bruch’s membrane and coalesce. The membranes form layers and then basal mounds internal to the RPE basement membrane (Fig. 65.4C, Fig. 65.9), which may account for the drusen-like dots noted clinically (Fig. 65.3B). The membranes are not demonstrated in conventional histologic sections, since the mounds manifest only as small, unstained spaces within the BLD (Fig. 65.10). As the mounds enlarge and fuse, the RPE shows more derangement and cell dropout.
External to the RPE basement membrane (basal linear deposit 22)*
Membranes appear to pass through the basement membrane to form a layer between the basement membrane and the inner collagenous layer of Bruch’s membrane (Fig. 65.8). In this location the debris may build up into the soft drusen specific for AMD73 (see Fig. 65.26). The debris also appears to disturb the normal attachment of the RPE to Bruch’s membrane, creating a cleavage plane, and it is in this plane that RPE detachments due to blood and serous fluid lie and into which early choroidal new vessels grow.74 The membranes even appear to percolate into the collagenous zones of Bruch’s membrane.
At the apex of the retinal pigment epithelium
Morphologically similar membranous debris is also found over the apex of the RPE, lying in the subretinal space and presumably representing outer-segment material that has not been phagocytosed (Fig. 65.11).
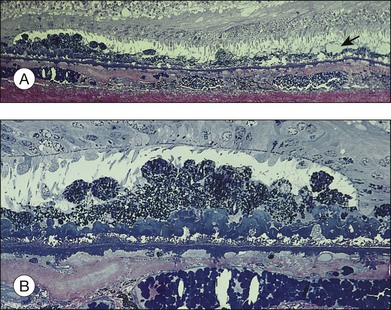
Fig. 65.11 Same eye as in Figs 65.5 and 65.6. Section passes through the temporal margin of the area of geographic atrophy. (A) Photoreceptors become fewer and outer segments wider and stunted as they approach the edge. Vacuolated appearance under the RPE is due to disappearance of membranous debris. Collections of membranous debris can be seen on the internal (apical) surface of RPE (arrow), possibly due to failure of phagocytosis (×150). (B) Hyperpigmented edge noted clinically corresponds to a double layer of RPE, the inner layer representing necrotic hyperpigmented cells in the process of being eliminated. Late amorphous form of BLD lies internal to striated form and has a multilaminar appearance, suggesting formation in successive waves according to the level of RPE (see Fig. 65.4D). Photoreceptors disappear, and external limiting membrane terminates on BLD (methylene blue and basic fuscin; ×500).
(Reproduced with permission from Sarks JP, Sarks SH, Killingsworth M. Evolution of geographic atrophy of the retinal pigment epithelium. Eye 1988;2:552–77.)
Basal laminar deposit – late form (diffuse thickening of the internal aspect of Bruch’s membrane)
With progressive degeneration of the RPE, another form of basal laminar material appears. On light microscopy it forms a thick, hyalinized layer that stains red with picro-Mallory, similar to hyalinized Bruch’s membrane, and that is more periodic acid–Schiff-positive than the earlier, banded form. Being a later development, it forms a distinct layer on the internal surface of the earlier form (Fig. 65.4D) and may approximate the thickness of the normal RPE, occasionally displaying nodular elevations on its internal surface75 (Fig. 65.12).
On electron microscopy, the later form of the BLD has a flocculent appearance and consists mainly of amorphous material. It may be uplifted with the attenuated RPE over the membranous mounds and appears to be formed in waves according to the level of the base of the cell at the time (Fig. 65.11). It indicates the altered metabolism of a severely stressed RPE and occurs typically over regressing drusen (see Fig. 65.30).
Retinal pigment epithelium and photoreceptors
Lipofuscin and complex melanolipofuscin granules continue to accumulate in the retinal pigment cells, which enlarge and lose their regular shape. The external or basal surface of the cell shows loss of the basal infoldings (with a consequent reduction in surface area) and becomes increasingly separated from its basement membrane by thickening of the BLD and more membranous debris. Occasional cells undergo lipoidal degeneration.76 Finally the hyperpigmented cells resulting from this phagocytic overload round off, so only a few stubby apical microvilli remain, and they lose their ability to phagocytose. Lipofuscin is packed into large degenerate retinal pigment cells or membrane-bound bodies and shed (Fig. 65.4D).
The corresponding pigment abnormalities in the fundus may be classified11 as increased pigmentation (or hyperpigmentation) and depigmentation (or hypopigmentation). Focal hyperpigmentation correlates histologically with localized areas of RPE cell hypertrophy, which may be accompanied by clumps of hyperpigmented cells in the sub-RPE space, in the subretinal space (see Fig. 65.10), and even migrating to the outer nuclear layer. With the advent of spectral domain (SD) ocular coherence tomography (OCT)77 and ultrahigh resolution (UHR) OCT,78,79 deposits have been demonstrated, in vivo, with moderate to intense hyperreflectivity in these various planes and correspond to hyperpigmentation on clinical examination or on fundus photographs. It is common for eyes with drusen to have these intraretinal deposits directly above the drusen, and although the outer nuclear layer is more common, some migration has even occurred into more anterior retinal layers.79 Focal hypopigmentation correlates with attenuated, depigmented RPE cells surrounding the hyperpigmented cells.75 A careful review of SD OCT images in areas of hypopigmentation show attenuated signal from the RPE layer.
The sequence of events leading to pigment disturbance and, ultimately, atrophy seems to be the same irrespective of the cause. When a retinal pigment cell dies, the products are phagocytosed by its neighbors. These cells in turn become filled with lipofuscin and round off, losing their ability to phagocytose. As the cells are discarded, the nearby cells migrate and increase in surface area in an attempt to maintain the integrity of the blood–retinal barrier. This results in thinned, hypopigmented cells adjacent to focal hyperpigmentation. Finally, these cells can no longer stretch to fill the gap and atrophy results. Hyperpigmentation therefore precedes hypopigmentation, and this in turn is the prelude to the development of patches of atrophy.80
Progressive derangement of the RPE is accompanied by dropout of photoreceptors, with a reduction in the number of nuclei in the outer nuclear layer. The inner segments tend to become shorter and more bulbous. The outer segments may terminate in collections of membranes over the apical surface of the RPE (Fig. 65.11).
Bruch’s membrane and choroid
Macrophages, giant cells, fibroblasts, and occasional lymphocytes are found in relation to the outer surface of Bruch’s membrane in the space formerly occupied by the choroidal capillaries.81 Segments of the membrane begin to thin, and cell processes are occasionally observed splitting off and even enveloping small fragments of the membrane.71 The choroidal capillaries in the vicinity may show signs of activation, and new vessels still confined entirely to the choroid have been identified.82 This chronic, low-grade inflammatory reaction, which possibly develops in response to the membranous debris liberated by degenerating RPE, is often found in the choroid near breaks in Bruch’s membrane,83 and it appears to be a link in the chain of events leading to CNV. As such mechanisms that decrease inflammation are actively being investigated as a means of altering both the atrophic and neovascular pathways of advanced AMD.
Drusen
Clinical grading
Drusen size
Clinically, drusen size can be compared to the width of a major vein at the disc edge (approximately 125 µm). Small drusen are those less than 0.5 vein width (<63 µm), and since size and morphology are generally correlated, these are considered to be hard.12,18 Drusen ≥125 µm (Fig. 65.2, circle C1) are large, and these are typically considered to be soft based on the appearance of their perimeter. Drusen between ≥63 µm and <125 µm may be termed medium or intermediate in size and are more frequently classified as soft drusen as well.
Extent of fundus involvement
This may be assessed by noting drusen number, the area of fundus involved,20,84 and the density of drusen (discrete, touching, or confluent). The area occupied by drusen yields important prognostic significance as it is a cornerstone in the Age-Related Eye Disease Study (AREDS) severity scale. Drusen area is identified by mentally condensing all drusen located in the zone of interest into a single area and estimating the size of that area by comparison to standard grid areas measured in disc area (DA) equivalents.84 Automated detection of total drusen area on digital fundus images remains under development and may eventually replace, partially or in full, grading by trained readers.
Drusen distribution
Detailed natural history studies have focused on the drusen characteristics for drusen that are located within 1 or 2 disc diameters of the foveal center (see Fig. 65.1).12,84–88 Different patterns of drusen distribution have been reported,15 and it is the superior and temporal quadrants that have been associated with greatest area of drusen involvement and highest prevalence of soft, indistinct drusen or reticular drusen.
Drusen symmetry
Comparisons of the distribution, number, and type of drusen between the two eyes of an individual tend to show a remarkable symmetry, which often leads to similar outcomes in both eyes.15,17,25,89 The drusen type which are most commonly present in both eyes of an individual are reticular drusen and soft, indistinct drusen.17
Clinical grading of AMD severity
Despite their apparently significant role in the evolution of AMD, diffuse deposits detected on histopathology are difficult to study clinically. However, prognostic significance is ascribed to the clinical presence of drusen, the white-to-yellow clinically apparent deposits described above that lie deep to the retina, representing accumulation of the materials described in the preceding sections of this chapter. While it was previously recognized that patients with at least medium-size, soft, or confluent drusen are predisposed to develop advanced stages of AMD,19,87 more recent natural history data from the AREDS has suggested a somewhat more detailed description of non-neovascular AMD to characterize prognosis. In addition, this terminology is also relevant to the management of non-neovascular AMD.13 In this classification features are evaluated within 3000 µm of the center of the macula (Fig. 65.1) and eyes can be classified into one of four groups:
Group 1: An eye is graded as no AMD if there are no drusen or only a few (~5–15) small drusen in the absence of any other stage of AMD.
Group 2: An eye is considered to have early stage AMD if there are extensive (>15) small drusen, or a few (approximately <20) medium-size indistinct drusen (soft borders) or pigment abnormalities (increased pigmentation or depigmentation but not geographic atrophy) and no other stage of AMD.
Group 3: The intermediate stage of AMD refers to the presence of at least one large druse, but can also be applied to the eye with numerous medium-size drusen (approximately 20 or more when the drusen boundaries are amorphous and approximately 65 or more when the drusen boundaries are distinct, sharp or hard) or to the presence of geographic atrophy that does not extend under the center of the macula (noncentral GA).
Group 4: The advanced stage of AMD is reserved for the presence of geographic atrophy extending under the center of the macula or presence of neovascular AMD.
In addition to providing this simplified classification of AMD (no AMD, early AMD, intermediate AMD, and advanced AMD), the AREDS investigators also devised a simplified clinical scale defining risk categories for development of advanced AMD.88 A scoring system tabulates a person score by assigning 1 risk factor to each eye of an individual for the presence of at least 1 large druse and 1 risk factor for the presence of any pigment abnormality. Drusen are to be scored only within 2 disc diameters of the foveal center, and pigment abnormalities consist of either increased pigment thought to be attributed to AMD, RPE depigmentation, or areas of noncentral geographic atrophy. Risk factors are summed across both eyes, resulting in a 5-step scale (0–4) on which the 5-year risk of developing advanced AMD in at least one eye can be approximated. Risk of progression escalates as follows: total score 0, 0.5% risk; 1 factor, 3%; 2 factors, 12%; 3 factors, 25%, and 4 factors, 50%. Modifications of the scale award persons without any large drusen 1 risk factor if medium-size drusen are present in both eyes and individuals with advanced AMD in their first eye receive a score of 2 for that eye when tabulating the person score to estimate the risk for their fellow eye.
Grading in scientific studies
While the grading of drusen described above is relevant to management and relatively easy to apply in clinical practice, a means of more specific grading of drusen for scientific studies is desirable, ideally without requiring fluorescein angiography. The system proposed by the International Epidemiology Study Group,11 which is based on stereoscopic color fundus photographs, grades for the predominant drusen type, the most severe drusen type, drusen numbers, largest drusen size, area involved by drusen, drusen confluence, and drusen disappearance (see Fig 65.1, 65.2).
A more recent detailed fundus photographic severity scale to be used in research settings has been presented by the AREDS investigators.84 Baseline photographs and annual photographs beginning at year 2 of follow-up from AREDS participants were graded for drusen characteristics (size, type, area), pigmentary abnormalities (increased pigment, depigmentation, geographic atrophy) and presence of abnormalities consistent with neovascular AMD. Relationships between various baseline characteristics and development of advanced AMD at the 5-year exam were explored to develop a 9-step severity scale that sorts the 5-year risk of advanced AMD from less than 1% in step 1 to about 50% in step 9. About half the eyes that had at least a 3-step progression between baseline and the 5 year exam showed stepwise progression through intervening severity levels at intervening visits. The second Age-Related Eye Disease Study (AREDS2), which is presently underway, aims to validate this scale in a separate cohort of patients at high risk for AMD progression. If validated, progression along this scale may be considered as a surrogate outcome for progression to advanced AMD in future studies.
Imaging of drusen
Fluorescence of drusen
Drusen have a variety of constituents that range from being hydrophobic to those that are hydrophilic. Fluorescein is a hydrophilic dye, which diffuses into hydrophilic areas. As such, some drusen routinely bind the dye and hyperfluoresce in late stage angiography. About 50% of drusen present within an eye will stain with fluorescein.90 Although drusen that stain with fluorescein appear across the spectrum of drusen sizes, drusen that stain are, on average, larger than drusen that do not stain. When considering fluorescein-stained drusen, drusen area appears similar to that which is appreciated on color photographs.
During indocyanine green angiography, hard drusen become hyperfluorescent 2–3 minutes after dye administration, and this persists through the middle and late phases. Soft drusen are either hypofluorescent (darker than the background fluorescence) throughout the angiogram with a thin hyperfluorescent rim or remain isofluorescent (indistinguishable from background fluorescence).91,92
Autofluorescence
On autofluorescence imaging, large drusen may or may not be apparent depending upon the alterations in the RPE overlying the druse.64 There may be a pattern of decreased autofluorescence in the center of the druse often surrounded by a ring of subtle increased autofluorescence.93 However, areas of emerging RPE atrophy in eyes with drusen may be more apparent on autofluorescence as compared to clinical examination, as regions in which autofluorescence is completely absent.64
Ocular coherence tomography (OCT)
Cross-sectional imaging of drusen in eyes with non-neovascular AMD is possible in vivo with OCT, particularly in the era of high speed and high resolution SD-OCT instrumentation. A wide variety of drusen patterns have been identified which may reflect the diversity in chemical and histologic features of drusen. The most common pattern consists of a convex, homogeneous, medium internal reflective deposit without overlying hyperreflective foci.94 Half of the soft indistinct drusen found on color photographs manifested this pattern; however, the other half had significant variability in their OCT patterns. Calcified drusen differed in that the deposit was predominantly hyporeflective, nonhomogeneous with or without a core and more apt to have overlying foci of hyperreflectivity. The hyperreflective foci are suspected to represent retinal pigment migration. At this time it is unknown how drusen subtypes identified on OCT relate to ultrastructural drusen characteristics or to clinical prognosis. Further study is underway in an ancillary study within the second age-related eye disease study that may elucidate the prognostic rule of OCT of drusen.
Automated evaluation of drusen location, total macular area, and total volume involved is under development with segmentation software for use on various OCT instruments and maybe a useful tool to monitor disease progression in the future.95,96 Studies have also demonstrated focal thinning of the photoreceptor layer immediately overlying drusen, loss of photoreceptor outer segments, and normal inner retinal thickness.77 These qualitative and quantitative changes may ultimately predict vision dysfunction.
Pathologic considerations
Typical age-related drusen are deposits of extracellular material, which typically lie between the basement membrane of the RPE cells and the inner collagenous zone of Bruch’s membrane (Fig. 65.13). In contrast, diffuse thickening of the inner aspect of Bruch’s membrane and cuticular drusen,22,53 also called basal laminar drusen,97 describe material internal to the basement membrane and appear to be similar to the late, amorphous form of BLD (Fig. 65.12). Basal laminar drusen are attributed to internal nodularity of the RPE basement membrane and can produce a starry-sky appearance on fluorescein angiography, which can be impossible to distinguish clinically from myriads of small, hard drusen (Fig. 65.14). However, the condition can usually be recognized when a myriad of small drusen have a somewhat translucent appearance with retroillumination in an individual in their 40s or 50s, sometimes with a vitelliform detachment of yellowish material. (The latter will progressively accumulate fluorescein but should not be confused with progressive fluorescein leakage from CNV.) Another type of small, yellow lesion resembling drusen, but which is nonfluorescent, has been found to be due to lipoidal degeneration of individual retinal pigment cells.76 The discussion which follows is confined to typical drusen external to the basement membrane.
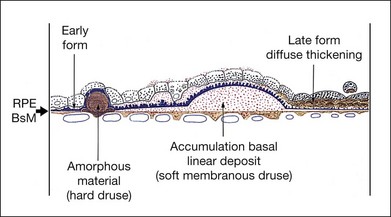
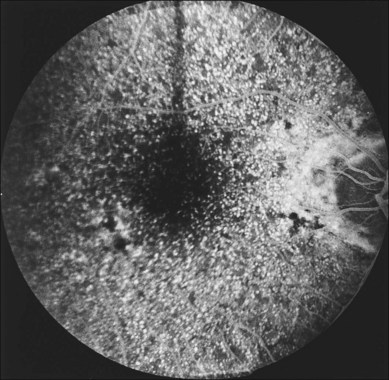
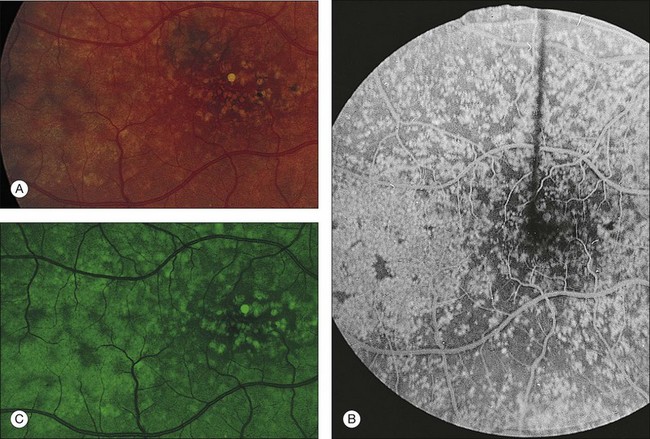
Fig. 65.14 Scattered, small, hard drusen in generalized distribution. Fluorescein angiogram of the right eye of a 59-year-old man. The whole posterior pole is studded with drusen, mostly of the discrete, small, hard variety, in the region of 25–75 µm. A few larger drusen, up to 150 µm across, have resulted from the fusion of several smaller drusen, and small reticular pigment figures are developing in relation to these larger drusen. Vision was still 20/20. The drusen were not obvious on ophthalmoscopy because most were only 30 µm tall. The patient died 6 months later. The pathology is shown in Fig. 65.16.
(Reproduced with permission from Sarks JP, Sarks SH, Killingsworth MC. Evolution of soft drusen in age-related macular degeneration. Eye 1994;8:269–83.)
The clinical classification of drusen mentioned above is based on ophthalmoscopic appearance, but fluorescein angiography and histopathologic examination add further information and suggest two main paths of development. Small, hard drusen with a hyalinized structure are the predominant type in younger persons, and some larger soft drusen show evidence of their derivation from clusters of these small drusen.73 A clinicopathologic correlation study of 353 normal and aged eyes without AMD showed that, in the absence of the diffuse deposits, all the drusen were of the hyalinized variety.98 Other drusen, however, develop de novo in the seventh decade, when the diffuse layer of membranous debris (basal linear deposit) appears, and these latter are specific for AMD. To these may be added a third presumed mechanism, the addition of proteinaceous fluid in those drusen ≥250 µm that resemble serous PEDs. Other authors have identified five distinct morphologic classes of drusen at the ultrastructural level. No attempt was made to correlate these classes of drusen to clinical phenotypes described in the literature. However, class 1 corresponds to hard drusen and class 2 to soft drusen with the same composition as the basal linear deposit.99 Therefore, until the complete life cycle of drusen can be recognized clinically, a classification of drusen must remain part clinical and part morphologic.
Clinicopathologic classification
Small, hard (hyalinized, nodular75) drusen
Clinical features
Small, hard drusen are not visible in the fundus until they measure 30–50 µm, the width of two to three retinal pigment cells. They are difficult to see in lightly pigmented fundi but use of red-free light may facilitate identification. They may be visible with fluorescein angiography, even when as small as 25 µm, fluorescing brightly in the mid-venous phase and fading soon after the background choroidal fluorescence (Fig. 65.14).
Small, hard drusen may first be noted within 1 disc diameter of the fovea15 but when numerous they are most common on the temporal side of the fovea. They tend to occur in clusters, and histopathologic specimens show that where hard drusen can be demonstrated clinically, there are often numerous intervening drusen too small to be seen (see Fig. 65.15). Another common pattern consists of a wide band outside the vascular arcades and passing on the nasal side of the disc, with sparing of the inner macula. Toward the equator they assume a linear arrangement in relation to a polygonal pattern of hyperpigmented lines, giving rise to the picture of reticular (honeycomb) degeneration of the pigment epithelium.
Formation
Small, hard drusen histologically are globular deposits of hyalinized material with staining properties similar to hyalinized Bruch’s membrane and have an amorphous appearance on electron microscopy. They have been identified in the macula in 83% of postmortem eyes.100
Certain preceding changes in Bruch’s membrane may determine their formation.98 In eyes with only a few drusen, small hyalinized plaques of densification in Bruch’s membrane are observed, sometimes with extensions into the outer collagenous zone and even on to its choroidal surface. Another early change, seen only by electron microscopy, appears as coated membrane-bound bodies, both ruptured and intact (see Fig. 65.5), similar to those found within the outer collagenous zone. However, here they appear “trapped” between the elevated RPE basement membrane and the inner collagenous zone. It has been proposed that they develop by the shedding of unwanted basal cytoplasm through the basement membrane of the RPE56 by a process likened to apoptosis (from the Greek: “a falling off, as the petals of a flower”), but the process of evagination and pinching-off of cytoplasm from the base of the RPE is so difficult to find that it has not been established to be a mechanism by which drusen form, and the term entrapment sites98 seems preferable to shedding sites. These entrapment sites are found at all ages and have also been detected in primate eyes, probably indicating a normal aging phenomenon.
In eyes with many small, hard drusen the preceding thickenings in Bruch’s membrane are more extensive, appearing as a row of microdrusen, or rounded elevations 2 µm in diameter, and composed of very dense amorphous material73 (Fig. 65.16). Hyalinized drusen form over these changes and as they grow they become hemispherical or almost globular. When small, hard drusen grow larger than about 63 µm, the amorphous contents become less compact and paler-staining, a process that begins in the lower part of the druse. Single hard drusen rarely exceed 125 µm, and further enlargement is the result of the fusion of several drusen. As the RPE over the drusen degenerates, the contents become increasingly dispersed (Fig. 65.16) or, especially in older patients, coarsely granular (Fig. 65.5). When the drusen finally fade, the basement membrane of the overlying RPE becomes infolded and collapses on to Bruch’s membrane, usually leaving a small patch of clinical hypopigmentation.
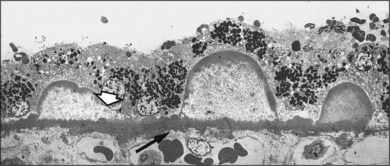
Fig. 65.16 Electron micrograph of small, hard drusen present in the eye shown in Fig. 65.14. Druse at far right demonstrates greater electron density around the margin than in the center. Larger druse in middle shows dispersion of contents except for a peripheral shell of amorphous material, with the outline of the druse remaining sharp. Druse at left is similar but has lost rim of amorphous material on one side (arrowhead), and this edge is spreading out on Bruch’s membrane. Note that the inner surface of Bruch’s membrane is raised into a row of small, rounded, electron-dense elevations, or microdrusen (arrow), which also lie beneath the larger drusen. Similar extensions occur on the choroidal side of the membrane (near arrow). Despite the presence of numerous drusen, there was no basal laminar deposit or membranous debris in this eye (the patient was only 62 years of age) (×7315).
(Reproduced with permission from Sarks JP, Sarks SH, Killingsworth MC. Evolution of soft drusen in age-related macular degeneration. Eye 1994;8:269–83.)
Significance
Population-based studies12,14,16,18,101 all reported that one or more drusen were found commonly – in 95.5% of the population aged over 43 years12 to 98.8% of those over 49 years14 – with small, hard drusen less than 63 µm being the most frequent type in all age groups. Pathologic studies22 support the conclusion that the presence of a few small, hard drusen is not a risk factor for AMD. However, several studies4,101 have found that if a threshold number of small, hard drusen is exceeded, the eye is more likely to develop larger drusen. Longitudinal clinical studies of at least 5 years’ duration suggest advanced AMD rarely develops in eyes with only small, hard drusen at baseline, regardless of the total area involved.4,13
Soft (pseudosoft) cluster-derived drusen
Initially the small, hard drusen in a cluster may remain discrete, or even may be touching, but individual drusen can still be distinguished on ophthalmoscopy. As the drusen become so closely packed together, the cluster appears as a single larger deposit that clinically appears soft, but the small drusen can usually still be made out in red-free light or on fluorescein angiography (Fig. 65.17). These fused drusen are up to 250 µm, depending on the number of drusen in the cluster. If sufficiently elevated, they may tent up the retina and cause a reddish halo around the base, which is a favorable sign because it reflects the hard, abruptly elevated margins and the integrity of the surrounding retina (Fig. 65.18). On fluorescein angiography they remain brightly fluorescent, although staining is not uniform. These clusters of fused, small, hard drusen occur in middle age, and the prognosis is generally good, with the drusen slowly regressing over many years and leaving a focal patch of atrophy (Fig. 65.18). It is of interest that this cycle may be completed in younger persons before the BLD and membranous debris characteristic of AMD have developed. Hard drusen therefore appear to occur independently of the intermediate or advanced stage of AMD.
True soft drusen
Granular soft drusen (synonyms: serogranular drusen, semisolid drusen,102 localized detachment of the basal linear deposit22)
Clinically, most of these drusen are about 250 µm and have a yellow, solid appearance, their confluence resulting in crescentic or sinuous shapes (Fig. 65.19). Histologically, they have a coarsely granular structure, consisting of membrane-bound globules of amorphous material, small membrane fragments, and other cellular debris. The presence of microdrusen and the proximity of some of these drusen to hyalinized drusen (Fig. 65.15) suggest that the granular contents represent, in part, cluster-derived drusen in which the original hard drusen have broken down (Fig. 65.20). A thin layer of this granular material would appear to resemble the soft drusen described by Green and Enger22 (see Fig. 65.8), as localized detachment of the RPE and basal linear deposit, in an eye with diffuse basal linear deposit.
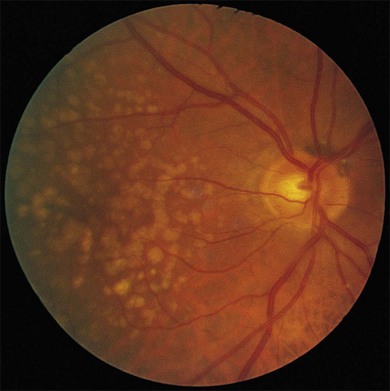
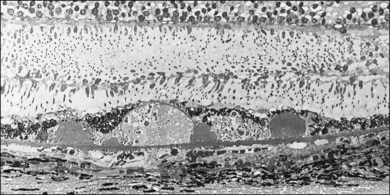
Fig. 65.19 Soft drusen of granular structure. Numerous soft, yellow drusen of solid appearance in the right eye of a 72-year-old man. Confluence of soft drusen results in a sinuous pattern. Patient died 3 years later, and corresponding histopathology (see Fig. 65.20) demonstrated a granular structure derived from broken down small, hard drusen.
(Reproduced with permission from Sarks SH. Drusen and their relationship to senile macular degeneration. Aust J Ophthalmol 1980;8:117–30.)
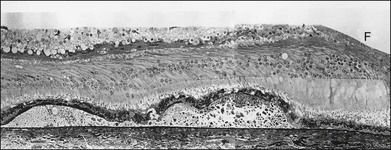
Fig. 65.20 Semithin section through edge of fovea (F) of eye shown in Fig. 65.19 demonstrates confluence of three soft drusen. Drusen have a granular structure, comprising variably sized globules of amorphous material, some membrane-bound. This material appeared to be derived from the breakdown of small hard drusen, several of which were still present around the edge of these drusen. Note that, as the contents break down, drusen tend to lose sharp margins and nodular surface elevations present in fused clusters (see Figs 65.12 and 65.13). The fellow eye demonstrated similar drusen, but many were regressing (methylene blue and basic fuchsin; ×115).
(Reproduced with permission from Sarks JP, Sarks SH, Killingsworth MC. Evolution of soft drusen in age-related macular degeneration. Eye 1994;8:269–83.)
Not all these drusen can be seen to be derived from the breakdown of hard drusen, but when this does occur the drusen in the center of the cluster seem to be affected first (Fig. 65.15), and small, hard drusen may remain identifiable around the perimeter of the cluster. The detection of this heterogeneous composition, either on fluorescein angiography or in histologic sections, led to the designation semisolid.102 Calcified particles may also be found and, as these deposits are commonly observed around an area of atrophy, they appear to be in the early stages of regression.
Soft, fluid (serous) drusen and drusenoid pigment epithelial detachments
Soft, confluent drusen larger than 500 µm, and even some over 250 µm, may have an accumulation of serous fluid if the lipoidal debris in Bruch’s membrane has created a hydrophobic barrier103 and interferes with the retinal pigment epithelial pump. This may be important in causing hard drusen to become soft and in fostering the enlargement and confluence of drusen.49 As a result some larger drusen appear to have a fluid consistency, even appearing blister-like and being translucent on retroillumination.
Further confluence leads to larger soft drusen that resemble serous PEDs (Fig. 65.21), often retaining a scalloped outline representing the original drusen. This subset of serous PEDs was characterized as the “drusen form”104 when they were noted to have different ophthalmoscopic and angiographic features, as well as better short-term vision prognosis. The term drusen or drusenoid75 RPE detachments may arbitrarily be applied to drusen over 500 µm but often are used to describe those with an even larger diameter. Generally they remain less than one disc diameter in size. This evolution occurs at times on a background of small, hard drusen; Fig. 65.21 shows how the small drusen become incorporated into the larger fluid deposits. In the outer macula the brightly fluorescent small drusen remain discrete. In the inner macula they form clusters in which the individual drusen become progressively more difficult to distinguish. These now fill more slowly on the fluorescein angiogram but often show a few brightly fluorescent highlights around the edge of the deposits. Those drusen clusters closest to the fovea can become completely homogeneous during fluorescein angiography. Hyperpigmentation gradually develops over the surface, often in the form of a radiating pigment figure. With fluorescein angiography the drusenoid PEDs are shallowly elevated and manifest faint late fluorescence similar to the filling of the surrounding fluid drusen. The overlying hyperpigmentation creates hypofluorescent figures on the anterior surface of the PED.
Drusenoid PEDs are compatible with good visual acuity at presentation (20/40 or better), although they may be responsible for metamorphopsia. However, as overlying hyperpigmentation and hypopigmentation develop, the contents appear whiter and more inspissated, and visual acuity may begin to decline. Once heavy clumping has appeared, the drusenoid PED generally begins to collapse within a couple of years, and atrophy may rapidly evolve with greater consequences on visual acuity (Fig. 65.22).80,104–106
Within the AREDS, 288 eyes with drusenoid PEDS (in the absence of advanced AMD) were followed for a median of 8 years, among which 42% developed advanced AMD within 5 years.107 About half of these events were central geographic atrophy and the other half neovascular AMD. Rates of progression to advanced AMD and rates of vision loss were higher in this group of participants than those with large drusen and pigmentary alterations. Those that did not develop advanced AMD still tended to show evidence of progression with development of calcification, pigmentary changes (typically hypopigmentation), and non-central GA. Five years after presentation of the drusenoid PED, visual acuity declined in those with incident-advanced AMD by a mean of 26 letters (~ 5 lines) and even by 8 letters among those without progression to advanced AMD.
Disappearance of drusen following prophylactic laser photocoagulation
Although longitudinal studies have shown that drusen may spontaneously develop and resolve, another indication of the fluid nature of drusenoid PEDs is the rapidity with which they resolve after photocoagulation. Drusenoid PEDs occur most commonly within the fovea and sometimes these flatten following gentle photocoagulation to their margin. Laser burns have been shown to cause a focal reduction in age-related lipid deposits in Bruch’s membrane, which may alter the egress of fluid. Alternatively, a cellular mechanism may also be invoked, since laser induces inflammation with occasional cellular intrusions into the membrane.108
Based on these findings, as well as case series providing evidence of drusen resorption following photocoagulation, a number of trials evaluated photocoagulation in eyes with drusen to decrease progression to advanced AMD and vision loss. The most definitive assessment, the Complications of Age-Related Macular Degeneration Prevention Trial (CAPT), did not find that low-intensity laser treatment prevented vision loss among individuals with bilateral evidence of large drusen and vision of at least 20/40. A total of 1052 participants had 1 eye randomly assigned to grid photocoagulation as close as 1000 µm and as far as 2500 µm from the foveal center while the other eye was assigned to observation. About 20% of eyes in the treated and the observed group lost at least 3 lines of acuity by the 5-year follow-up examination.108 The cumulative 5-year incidence of choroidal neovascularization was about 13% in each group; whereas each group had similar rates of geographic atrophy at roughly 7.5%.
Soft (membranous) drusen (localized accumulation of the basal linear deposit22)
Soft membranous drusen often appear paler and shallower than the yellow granular drusen (Fig. 65.23). They are usually smaller than 250 µm, most commonly 63–175 µm. These drusen are common in intermediate or advanced AMD. Since they represent focal accentuations of a continuous layer of debris, their margins are usually indistinct and they readily become confluent. Histologically these drusen are pale-staining and faintly periodic acid–Schiff-positive, with a finely granular or ground-glass appearance; they may even appear optically empty. However, on electron microscopy they contain tightly packed membrane coils (Figs 65.24, 65.25). A small amount of amorphous material may be present within the coils, so their contents have also been described as vesicular and granular electron-dense, lipid-rich material.22,75 This membranous debris is morphologically similar to that which forms basal mounds internal to the RPE basement membrane, and continuity between the mounds and drusen through the basement membrane can at times be observed (Fig. 65.25). Similar material has also been found in autosomal dominant drusen.52
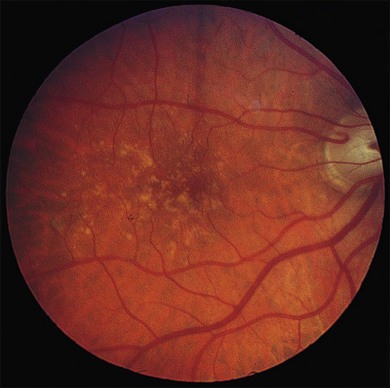
Fig. 65.23 Soft, indistinct drusen composed of membranous debris. The right eye of a 71-year-old man shows small, hard drusen and medium-sized soft drusen of smudgy appearance. This eye developed a hemorrhagic disciform lesion shortly before the patient died at age 75. The left eye had similar drusen and also proved to contain an early active neovascular membrane. The morphology of the drusen in the left eye is illustrated in Figs. 65.24–65.26.
(Reproduced with permission from Sarks JP, Sarks SH, Killingsworth MC. Evolution of soft drusen in age-related macular degeneration. Eye 1994;8:269–83.)
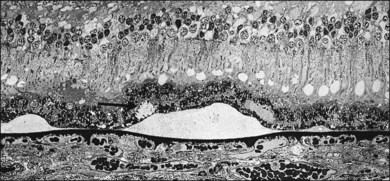
Fig. 65.24 Semithin section showing medium-sized soft drusen from the left eye of the patient illustrated in Fig. 65.23. Since these deposits are focal accentuations of a continuous layer of debris, their margins are ill defined and they readily become confluent. It is into this plane that choroidal new vessels grow; a neovascular membrane was present nearby. Drusen appear empty or very finely granular at this magnification. The arrow points to a small basal mound of similar appearance, lying above the druse. Higher magnification is shown in Fig. 65.25 (methylene blue and basic fuchsin; ×240).
(Reproduced with permission from Sarks JP, Sarks SH, Killingsworth MC. Evolution of soft drusen in age-related macular degeneration. Eye 1994;8:269–83.)
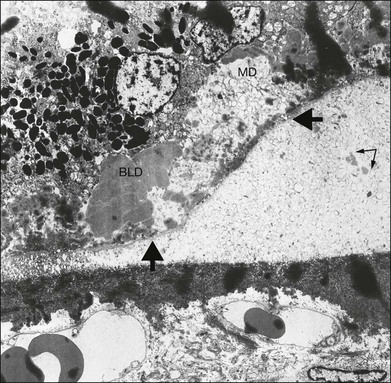
Fig. 65.25 Electron micrograph corresponding to the area indicated in Fig. 65.24 shows formation of a soft druse made up of coiled lipid membranes lying external to the basement membrane of the retinal pigment epithelium (arrows). The membranes appear first at the base of the RPE, where they may form basal mounds (MD). At the site of the right-hand arrow, some membranes can be seen within the basement membrane of the RPE and appear to be entering the soft druse from the basal mound. Some of the coils appear empty, and others contain amorphous material (double arrow). These drusen are specific for age-related macular degeneration, since they are only found after membranous debris develops. BLD, Basal laminar deposit (×2210).
(Reproduced with permission from Sarks JP, Sarks SH, Killingsworth MC. Evolution of soft drusen in age-related macular degeneration. Eye 1994;8:269–83.)
Membranous drusen have a high risk of CNV and are often found in advance of choroidal neovascular membranes in pathologic specimens, unlike granular drusen, which more often occur around areas of atrophy. They are significant because they are not simply a focal pathology but are part of a diffuse layer of debris external to the basement membrane that opens a cleavage plane for the spread of new vessels. The BLD over these drusen is usually the early type because membranous material declines as late BLD appears. Although these soft drusen develop de novo, small, hard drusen are commonly also present and then become incorporated into the membranous drusen; their amorphous contents break down (Fig. 65.26).
Fig. 65.26 Electron micrograph of the same eye in Figs 65.23–65.25 shows a cluster of subclinical, small, hard drusen apparently becoming eroded by membranous debris and breaking down into small membrane-bound particles (central arrow). At right (shorter arrow), druse consists of more characteristic membranous debris. This scenario suggests that small, hard drusen become incorporated into soft drusen once membranous debris develops. Early-type basal laminar deposit (BLD) lies over drusen. Note that the BLD and retinal pigment epithelium remain anchored at the site of hard drusen but are separated from Bruch’s membrane on either side by soft drusen. This may permit a retinal stimulus to evoke the maximum cellular response in the choroid directly beneath these drusen. Small arrow at left points to macrophage-type cell adjacent to outer surface of Bruch’s membrane, where retina remains attached (×1260).
(Courtesy of M.C. Killingsworth.)
This debris coincides with a macrophage response in the choroid, and segments of thinning of Bruch’s membrane may be found, with signs of activation in the adjacent choroidal capillaries.82 This occurs preferentially beneath hard drusen, possibly because the RPE remains anchored to these for a time, while becoming increasingly separated from Bruch’s membrane elsewhere by the membranous debris. An ischemic stimulus induced in the outer retina by this separation may cause the RPE to release diffusible angiogenic factors that would reach the choroid in greatest concentration where the RPE remains attached to Bruch’s membrane (Fig. 65.26).
Reticular pseudodrusen,109 reticular drusen,14,20 subretinal drusenoid deposits110,111
These drusen are characterized by a yellowish interlacing network about 250 µm in diameter20 that resembles soft confluent drusen. These first appear in the superior outer macula (Fig. 65.27) and the network may slowly extend into other quadrants and also peripherally. The transition with normal retina often appears to be marked by a scalloped line breaking up into islands. The pattern does not fluoresce on fluorescein angiography, being best observed in red-free light (blue channel color light) or the near infrared light of the scanning laser ophthalmoscope. Despite the clinical resemblance to soft confluent drusen, SD-OCT correlation shows deposits of material above (rather than below) the RPE in the subretinal space.110 The material can be configured as relatively flat aggregates to conical mounds that extend to the region between the inner and outer photoreceptor segments, and appears to be far more extensive when visualized with OCT as compared to color photographs.111 Histologically, the composition of these subretinal deposits has been similar to that of soft drusen with membranous debris, cholesterol, cholesterol esters, and complement.112 Although eyes with soft drusen may also contain reticular drusen, each “drusen” type may exert an independent risk for late AMD progression, with the magnitude of risk being far greater for soft drusen than reticular drusen.111,113
Regressing (fading) drusen (localized detachment of the basal laminar deposit within an area of retinal pigment epithelium and photoreceptor atrophy22)
All drusen types may in time disappear,4,16,101 but this does not necessarily signify a return to a more normal state, since areas of drusen may be replaced by more severe manifestations of AMD. A proportion of eyes show changes in the appearance of the macula that might be considered “improved” but whether this is associated with a decreased risk of the advanced stage of AMD remains to be seen. It is doubtful that the RPE remains unaffected, and fluorescein angiography may show increased transmission of fluorescence where drusen have faded.
Drusen begin to regress when the overlying RPE fails, often assuming a whiter and harder appearance (see Fig. 65.18). It has been suggested that the drusen have reverted to a previous type,4 but hardening of the drusen in this situation is caused by inspissation of the contents and is associated with more advanced degeneration of the RPE, with hyperpigmentation and hypopigmentation often developing over the surface of the druse. Later the margins become irregular and foci of calcification may appear, especially after the age of 60 years. Ultimately the drusen fade, leaving multifocal patches of RPE atrophy that reflect their original distribution and often spare fixation (Fig. 65.28). Glistening calcium deposits may remain in these atrophic areas for many years.
Histopathologically, both RPE and photoreceptors overlying regressing drusen disappear, leaving a thick layer of late-type amorphous BLD over the apex (Fig. 65.29). Regressing drusen therefore not only have a reduced input of membranous debris due to loss of overlying RPE, but also show evidence of its removal by macrophages. Material not removed becomes invaded by glial cells or collagen fibers or undergoes dystrophic calcification. Regression of soft drusen therefore closes the cleavage plane created by membranous debris and, if CNV occurs, it remains localized (Fig. 65.2).
Outcome of drusen
The cumulative incidence of advanced AMD in individuals with bilateral drusen has been reported in several prospective studies. Among 126 patients attending an ophthalmology clinic in England the 3-year cumulative incidence of neovascular AMD was 14%; whereas the incidence of GA was 5%.106 Two significant risk factors for progression to these new lesions were the presence of confluent drusen or focal hyperpigmentation within 1600 µm of the center of the fovea. In the Beaver Dam study 197 persons had signs of “early ARM” in both eyes at baseline, among which 7% progressed to neovascular AMD and 5% to GA within 5 years.4
In patients who have developed CNV in the first eye, in the fellow eye at risk the presence of five or more drusen, or one or more large drusen, were two factors associated independently with an increased risk of developing CNV in the second eye within 5 years.86 Another prospective study followed103 patients with unilateral neovascular AMD and drusen only in the fellow eye for up to 9 years. Yearly incidence rates for the development of CNV or geographic atrophy in the fellow were between 5% and 14%. The risk of CNV peaked at 4 years and decreased thereafter. Longer follow-up was associated with a slightly increased incidence of geographic atrophy. The risk of CNV in patients with AMD was heralded by an increase in the number, size, and confluence of drusen (in decreasing order of significance). This risk eventually declines and is followed by later increased risk of geographic atrophy.114
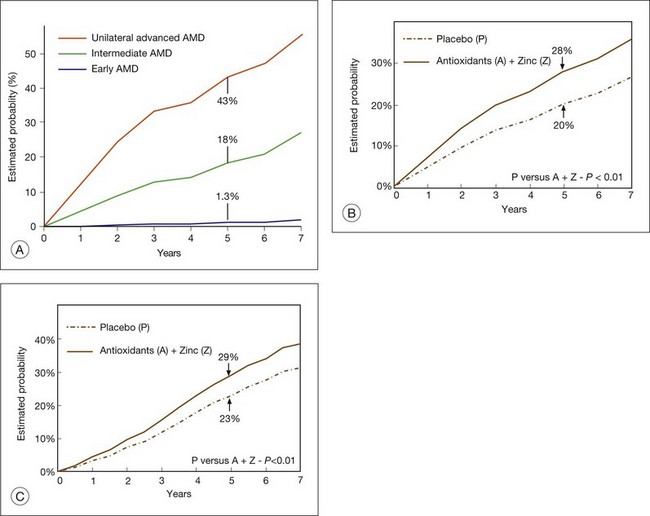
Most recently, the AREDS Group2,13 reported that the risk of progressing to the advanced stage of AMD within 5 years was extremely low for individuals with early AMD (about 1%), approximately 6% for individuals with intermediate AMD in only 1 eye, approximately 25% for individuals with intermediate AMD in both eyes, and approximately 43% for the second eye of individuals who already have advanced AMD in their first eye (Fig. 65.30A). Patients with early or intermediate AMD, or those who already have lost vision in their first eye from advanced AMD often want an assessment of their risk of progression at the time of their clinical examination. As discussed earlier, the AREDS group developed a simple grading scale that lends itself to quantifying patient risk, even in a busy clinical practice. Each eye of a person is scored individually, assigning one point for each risk factor present (large drusen, pigmentary abnormalities). A cumulative person score ranging from 0 to 4 is calculated. If an eye has either form of advanced AMD then that eye receives a score of 2 and the person score would range from 2 to 4. Individuals who do not have large drusen in either eye but manifest bilateral medium drusen receive 1 point and earn additional points if pigmentary abnormalities are present. Each total score has been associated with an escalating estimated 5-year risk that ranges from 0.5% to 50% that at least 1 eye will progress to advanced AMD.88
Histochemistry
Drusen contain neutral fats and phospholipids,115 as well as glycoconjugates containing specific carbohydrate residues. The latter were found in all classes of drusen, suggesting that both hard and soft drusen may have a similar origin.116 Many hard and soft drusen contain specific cores with a carbohydrate-rich composition confined to distinct domains. These cores are positioned centrally within the drusen and are typically juxtapositioned to Bruch’s membrane. Some researchers have suggested that they may represent an early nucleation site around which other drusen-associated molecules including lipid are subsequently deposited.83,117
Other distinct components common to all phenotypes of hard and soft drusen include apolipoprotein E, immunoglobulins, factor X, amyloid P component, complement C5 and C5b-9 terminal complexes, fibrinogen, and thrombospondin.116 Vitronectin is a major constituent of both hard and soft drusen, and vitronectin mRNA is expressed locally in the RPE, suggesting that vitronectin may participate in the pathogenesis of AMD.118 A number of these drusen-associated constituents are participants in humoral and cellular immunity, including a number of acute-phase reactants, plasma proteins that rapidly elevate in response to inflammatory stimuli.
The membranous debris appears to bleb from the surface of the RPE and pass through the RPE basement membrane to form soft drusen specific for intermediate or advanced AMD. Ultrastructurally, this material resembles the extracellular lipid found in developing atheromatous plaque.69,70 The debris probably arises indirectly at least from peroxidized lipid63 derived from the photoreceptor outer segments, since membranous debris disappears with loss of photoreceptors.
Incipient atrophy (nongeographic atrophy18)
Incipient atrophy is a stage that may immediately precede geographic atrophy. Although not as sharply demarcated as actual geographic atrophy, areas of RPE thinning or depigmentation (incipient atrophy) can nevertheless be recognized. The affected retina appears pinker than the normal fundus background, and any drusen present appear whiter and harder before fading. Fluorescein angiography demonstrates diffuse hyperfluorescence, not as bright as an area of geographic atrophy (see Fig. 65.31), and it is commonly associated with a reticular pattern of hyperpigmentation (Fig. 65.32) inducing hypofluorescence on angiography. The areas of associated hyperpigmentation may be more easily delineated on autofluorescence as areas lacking fundus autofluorescence (FAF) due to absorption of the exciting light by melanin granules. Alternatively, the associated hyperpigmentation may appear as an increase in FAF if melanolipofuscin has accumulated in the pigmented sites.119 The areas of hypopigmentation generally are associated with decreased FAF, suggesting the absence of RPE cells or degenerated RPE cells with reduced lipofuscin content.
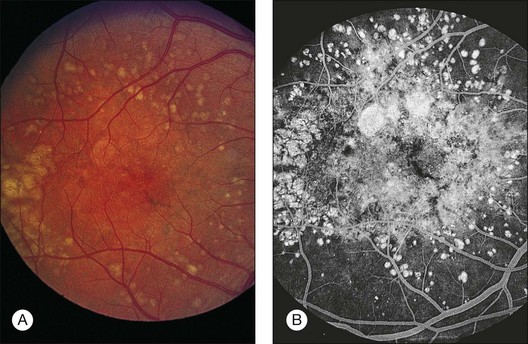
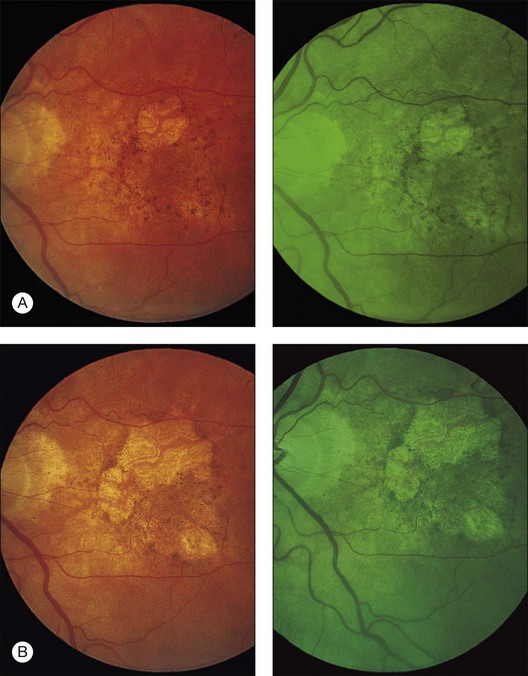
Pathology
It has been shown that the character of the material liberated by the RPE reflects the stage of degeneration. The debris made up of coiled membranes (basal linear deposit) appears when the cells are also elaborating the early form of BLD. As degeneration develops, there is initially a marked increase in the quantity of both these diffuse deposits. However, with more advanced fallout of photoreceptors, the amount of membranous debris produced declines, and both the basal mounds internal to the basement membrane and the soft drusen fade, and the BLD is now the late amorphous type. Multinucleated giant cells and mononuclear inflammatory cells are observed lying on Bruch’s membrane at the margin of areas of geographic atrophy and may play a role in clearing the debris from necrotic cells at this site.119 Therefore, as the late type of BLD increases, the quantity of membranous debris is reduced, which is particularly noticeable at the edge of an area of atrophy (see Fig. 65.11).
Choroidal perfusion in age-related macular degeneration
The retina has the highest oxygen uptake in the body, most of which is provided by the choroid, but as AMD advances, the cross-sectional area of the choriocapillary bed progressively decreases. Histologic measurements made in eyes with (1) continuous BLD, (2) geographic atrophy, and (3) disciform scarring showed that the choriocapillary density, defined as the combined length of patent capillary lumina parallel to Bruch’s membrane, was respectively 63%, 54%, and 43% of normal. The corresponding figures for the choriocapillary diameter measured perpendicular to Bruch’s membrane were 81%, 73%, and 75% of normal.50 Laboratory studies have suggested that decreased foveolar choroidal blood flow is associated with AMD, in particular increased drusen extent, and that abnormal choroidal circulatory measurements may predict risk of progression of the disease.120 Not surprisingly, therefore, one hypothesis of the pathogenesis of AMD relates to ischemia. The macula is the watershed zone where branches of the short posterior ciliary arteries meet, and an area where multiple watershed zones meet is an area of poor vascularity and therefore most vulnerable to ischemic disorders. Moreover, the distribution of diffuse deposits beneath the RPE is often closely related to regions of choroidal capillary dropout.121
Relationship to age-related macular degeneration
Choroidal perfusion abnormalities have been found in patients with the intermediate and advanced forms of AMD and interpreted as a clinical sign for diffuse aging changes in Bruch’s membrane,122 especially in eyes with soft drusen.123 A prolonged choroidal filling time, as evidenced by patchy and slow filling of the choroid in the early phase of fluorescein angiography, was found in 40% of eyes with AMD, and this was corroborated by indocyanine green angiography, by means of which a distinct area of reduced fluorescence of the choriocapillaris was noted in the middle phase in 44% of eyes.124 A prolonged choroidal filling phase may therefore be a marker for loss of the choriocapillaris and the presence of diffuse deposits.
It was first reasoned,125 and then confirmed,126 that the RPE modulates the choroidal vasculature by secreting a diffusible growth factor. Since intermediate AMD is associated with a continuous layer of debris internal to Bruch’s membrane that may present a barrier to metabolic exchange between the RPE and the choriocapillaris, and since the RPE cells are degenerate, less growth factor would be expected to reach the choriocapillaris. This may be the reason why the choriocapillaris is initially slow to fill, then loses its endothelial fenestrations and ultimately atrophies. Hence the narrowing of the choriocapillaris, rather than causing the disease, may represent a disuse atrophy secondary to degeneration of the RPE. The alternative view, that impaired choroidal perfusion is responsible for dysfunction of the RPE, is supported by the use of color Doppler imaging, which demonstrated increased pulsatility and decreased velocity in the short posterior ciliary arteries. This suggested greater scleral rigidity in AMD, which increases the resistance of the choroid to the flow of blood.127
Functional effects
In patients with AMD and delayed choroidal perfusion on fluorescein angiography, discrete areas of scotopic threshold elevation can be recorded that correspond to regions of choroidal perfusion abnormality.128 It is interesting that these patients reported easy fatigability when doing close work,128 the need for increased light intensity to read, fading of vision and slow recovery of vision after exposure to bright light,128,129 and a central scotoma noticeable in the dark.129 Delayed choroidal perfusion has also been linked to a prolonged foveal cone electroretinogram implicit time.130 Since the diffuse deposits, especially the late amorphous BLD, are associated with some loss of RPE and photoreceptors, these deposits may account for the functional disturbances, as well as the perfusion abnormality.129
Prognostic value
Eyes with prolonged choroidal filling have been found to be at greater risk of visual loss, compared with eyes with normal choroidal filling. Whereas the proportion of eyes that develop CNV is the same in the two groups, the difference is caused by a higher incidence of geographic atrophy in the eyes with prolonged choroidal filling.131 In eyes with drusen, a reduced retinal sensitivity may similarly predict the development of advanced AMD, especially drusenoid PEDs,132 which may be followed by geographic atrophy.
A prolonged choroidal filling phase was also found to be associated with more evidence of atrophy of the RPE in the fellow eye124 and, together with reduced foveal sensitivity, may therefore be a predictor that geographic atrophy will develop. Areas of incipient atrophy around a region of geographic atrophy, a region where the late form of the BLD is maximally developed with an associated fallout of RPE and photoreceptors, would also be expected to have reduced retinal sensitivity under dark-adapted conditions, so in addition it may be possible to predict the rate and spread of geographic atrophy.133
Geographic atrophy
Geographic atrophy is the end-result of the non-neovascular form of AMD and is currently defined11 as any sharply delineated round or oval area of hypopigmentation or depigmentation or apparent absence of the RPE, in which choroidal vessels are more visible than in surrounding areas and which must be at least 175 µm in diameter (see Fig. 65.2, circle C2). Other wider dimensions have been proposed, although most studies specify dimensions between 175 µm and 350 µm as an area to reliably be considered geographic atrophy. It should be noted that for epidemiologic purposes an eye that shows any evidence of CNV in the setting of atrophy is classified as neovascular AMD, even if atrophy predominates. This stems from the difficulty inherent in determining the pathologic sequence that led to the development of the atrophic areas.
Evolution
Drusen-unrelated atrophy
This is an extension of AMD as considered thus far. Stippling of the RPE and small drusen often coexist, but atrophy does not begin in relation to individual drusen. Instead, the atrophy often begins around the perimeter of the fovea in a band of microreticular hyperpigmentation80,134 (Fig. 65.32), although this is not always the case (see Figs 65.3 and 65.6).
Spread continues into retina affected by incipient atrophy and is more rapid when the ring of pigment clumps is pronounced. It tends to expand in a horseshoe-like fashion around the central fovea or develops simultaneously in several areas around the foveal perimeter.80,134–137 The nasal or temporal side of the ring is usually the last part to close, completing the bull’s-eye that may spare fixation for several years.
The reason atrophy tends to skirt fixation may be determined by the manner in which lipofuscin accumulates at the posterior pole. This parallels the distribution of rods in the human retina and reflects the greater vulnerability to fallout of rods than cones.34 In the central rod-free area the lipofuscin content in the pigment epithelium is lower;138 a sharp increase occurs on the foveal slope.35 This sparing of the central fovea may also be attributable to the distribution of macular pigment. In humans this consists of two major carotenoids, lutein and zeaxanthin, which are thought to function as antioxidants and as blue-light filters, to potentially protect the macula from phototoxic damage.138,139
Drusen-related atrophy
Most cases of geographic atrophy occur in eyes with prominent drusen and develop as the drusen regress.7,74 Degeneration of the RPE is usually more advanced immediately anterior to drusen, and the pattern of atrophy therefore initially reflects the distribution of the drusen. In younger patients such foci of atrophy remain discrete for many years (see Fig. 65.18), but when AMD affects the intervening RPE, the patches enlarge and coalesce in an irregular manner (Fig. 65.28).
Within the AREDS, 95 eyes monitored prospectively developed areas of GA at least 4 years into the trial. In each eye, drusen were found at the site of later development of GA; in fact, drusen >125 µm preceded GA in 96% of these eyes, confluent drusen in 94%, hyperpigmentation in 96%, drusen >250 µm in 83%, hypopigmentation in 82%, and refractile deposits presumed to be calcification in 23%.140 The time from lesion appearance to onset of GA varied by lesion type, ranging from 6 years for confluent drusen to 2.5 years for hypopigmentation or refractile deposits. Progression from drusen to hyperpigmentation to regression of drusen to hypopigmentation was the most common sequence of these manifestations.
This pattern of evolution similarly tends to be more advanced around the perimeter of the fovea and spreads into the center. At the time of presentation single or multifocal lobules of atrophy may be present, and foveal involvement can be a presenting feature. In some cases the only evidence that atrophy evolved in a multifocal distribution in relation to drusen may be some scattered calcified deposits and a few small outlying islands of atrophy. In those younger patients with widespread drusen, there is an initial diffuse pigmentary disturbance (nongeographic atrophy), within which focal patches of geographic atrophy then develop (see Fig. 65.31).
Following pigment epithelial detachments
Geographic atrophy may follow collapse of an RPE detachment (see Fig. 65.22), especially those drusenoid RPE detachments formed by the confluence of large soft confluent drusen.104,107 Vision may be only mildly compromised for as long as the RPE detachment is intact. Ultimately the RPE that lies on the anterior border of the drusenoid detachment may fail, leading to loss of vision and/or a scotoma, flattening of the detachment, and a rapidly developing area of atrophy. If an RPE detachment is complicated by a rip, the resulting retraction of the pigment epithelium leaves a sharply demarcated area of denuded RPE in which there is increased visualization of the choroidal vessels. Such an area may mimic an area of geographic atrophy. However, if the RPE is recent, two features are present to help differentiate the area as a rip: marked subretinal and intraretinal fluid overlying the area, and intense early fluorescence on a fluorescein angiogram.
Pathology
The changes causing an area of atrophy to expand are best studied at the junctional zone (see Fig. 65.11), where in vivo studies have demonstrated increased lipofuscin-induced autofluorescence.64 Here the lipofuscin content of the RPE is maximal, presumably the result of both autophagy and outer-segment phagocytosis, and engulfment of discarded RPE and their photoreceptor cells. The few surviving photoreceptors comprise grossly abnormal cones with widened inner segments and absent outer segments, with no evidence of phagocytosis. The photoreceptors and the RPE then disappear together.
Choroidal atrophy
The appearance is instead an expression of choroidal atrophy;22 loss of the choriocapillaris and the middle layer of vessels throws the remaining larger vessels into greater prominence. The white sheathing is due to the disproportionate thickening of the vessel walls by becoming flattened in the thinned choroid, but in many cases it also reflects a reduced blood column.
Since choroidal atrophy is a normal aging change, the white sheathing of the exposed choroidal arteries develops much more rapidly in patients over 80 years of age. In many patients with senile tigroid fundi and good vision, even the unexposed choroidal vessels assume this whiter appearance (see Fig. 65.3).
Imaging geographic atrophy
Fundus autofluorescence
The actual GA lesion appears as a sharply defined and homogeneous area of hypoautofluorescence on fundus autofluorescence (FAF) imaging due to the loss of RPE and therefore lipofuscin accumulation. The high contrast difference between areas absent of FAF and those that retain FAF has led to FAF images being used to monitor presence, configuration, and size of GA lesions within longitudinal clinical studies. What is more variable within an eye, or between eyes, is the FAF pattern in the “junctional” area of the atrophic and nonatrophic tissue. In the junctional area various patterns of high-intensity FAF have been noted such as banded, focal, patchy, and diffuse. In the diffuse patterns the increase in FAF may be present at the margin of the GA and elsewhere in the posterior pole. Existing atrophy enlarges, or new atrophy occurs exactly where there previously has been increased FAF; therefore presence and pattern of increased FAF in these eyes may have prognostic significance for GA progression.119 A high degree of symmetry has been noted for the pattern of increased FAF in patients with bilateral GA, in contrast to the marked interindividual variations in these patterns. This suggests a genetic determinant that may be affecting this behavior. Evidence is emerging that the specific pattern of increased FAF in the junctional zone is associated with the growth rate of GA, such that some clinical trials are presently requiring these “high-risk” patterns of banded or diffuse FAF be present at entry.119
Optical coherence tomography
Using SD-OCT line scans, areas of GA show absence of several structures including the external limiting membrane (ELM), inner/outer-segment (IS–OS) junctions, and the RPE and Bruch’s membrane complex (Fig. 65.33).141 As a result of these alterations there is choroidal signal enhancement or choroidal hyperreflectivity. This group of OCT alterations corresponds to the same area with severe reduction of FAF signal on FAF images. Junctional regions between GA and the surrounding macular show abrupt breaks in the IS/OS junction and RPE/Bruch’s membrane complex and curved endings of the ELM as it merges with the atrophic region. Areas of increased FAF in eyes with GA have been shown to correspond to outer plexiform layer clumps,
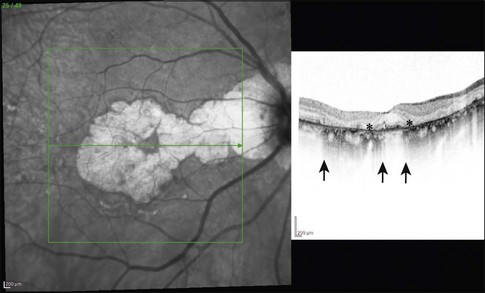
Enlargement of GA has also been monitored with serial SD-OCT imaging with the following observations: progressive loss of the outer hyperreflective SD-OCT bands (those which are described above in a cross-sectional examination), thinning of the outer nuclear layer, and approach of the outer plexiform layer toward Bruch’s membrane. Sequential measurements of retinal thickness at the borders of GA manifest a median loss of 14 µm per year, whereas lateral spread can also be quantitated on these scans, with a median growth of 107 µm per year.141
Clinical significance of geographic atrophy
The 15-year cumulative incidence of GA among individuals age 43–86 with early signs of AMD at the baseline examination in the Beaver Dam Eye Study is 14%. However, concentrating on the oldest sector of our population, those 85 and older, the cumulative incidence of GA is four times greater than that of neovascular AMD.142 As individuals live longer, the number of people affected by the advanced form of non-neovascular AMD will continue to climb.
Two case studies10,143 found that geographic atrophy accounts for only 12–21% of eyes with severe visual loss due to AMD. However, visual acuity does not always reflect the level of vision impairment associated with GA, since a large area of atrophy may spare fixation but still cause the patient difficulty with reading a line of print. The reading rate is slowed not only by the paracentral scotomas, but also because eyes with geographic atrophy demonstrate abnormal foveal dark-adapted sensitivity, reduced visual acuity in dim illumination, and reduced contrast sensitivity.135 Magnifying aids rarely help these reading difficulties because the image will be enlarged on to nonfunctioning retina.
In one study central fixation was not completely lost until atrophy occupied more than 80% of the fovea, and this occurred about 5 years earlier in drusen-related atrophy as compared with drusen-unrelated atrophy.80 Even when fixation is affected, vision may vary depending on the patient’s ability to find a surviving island of retina within the atrophic area, or the least affected portion of retina outside the area.144 There seems to be a preference to fix with the scotoma to the right,137 favoring the ability to see the beginning of a line rather than the end. Visual retraining may enable a patient to use the closest viable area of retina.
Prognosis
Once geographic atrophy has developed, its growth can be monitored by color fundus photographs or FAF images. Annual linear growth rate can be estimated at about 2 mm2 per year based on 181 eyes followed for a median period of 6 years within AREDS.145 Factors reported to influence the rate and direction of further spread are the number, distribution, and regression of drusen, the baseline size of the atrophic lesion, the extent of incipient atrophy, and the growth of GA in the contralateral eye. For eyes presenting with noncentral GA, the median time between presentation and foveal involvement is 2.5 years.145
Prognostication therefore requires each case to be assessed individually, but in one study the average interval from onset of geographic atrophy to legal blindness was about 9 years.136 In another study an interval of just over 5 years elapsed from the time atrophy first encroached into the fovea until vision fell to 20/200; fixation was lost earlier in the drusen-related group.80 In a third study the average rate of expansion in one direction was 139 µm per year and 8% of affected eyes had significant visual loss (from 20/50 or better to 20/100 or worse) per year.134 In another series in which visual acuity was 20/50 or better at baseline, 50% of eyes lost three or more lines of acuity, and 25% lost six or more lines of acuity at 2-year follow-up.135 Within the AREDS cohort over 400 eyes progressed to foveal GA. Mean acuity prior to foveal involvement was 20/50, with a drop of 4 letters when the fovea became involved, culminating in a mean decrease of 22 letters 5 years following foveal involvement.145 Areas of atrophy continue to enlarge over time, even if large at baseline and even after the fovea becomes involved. The combination of reduced visual acuity with enlargement of atrophy, occurring bilaterally in most patients, can lead to significant impairment of visual function.144
Geographic atrophy and choroidal neovascularization
Geographic atrophy tends to be a bilateral disease. In one series of over 200 patients with geographic atrophy, the fellow eye was affected in over 50% of cases, and there was a tendency to symmetry between the two eyes, the area of atrophy being only about 20% smaller in the fellow eye.80
Histologic studies have shown that eyes with geographic atrophy may also contain small areas of CNV and that CNV is more frequently bilateral than clinical impressions suggest.22,23 In about 25% of persons with unilateral GA, the fellow eye has evidence of neovascular disease or a disciform process, and these are the patients who are most at risk of developing CNV in the second eye despite the presence of geographic atrophy in this eye. Clinical evidence of CNV may be subtle in these eyes with small areas of elevated RPE accompanied by subretinal blood and fluid. Fluorescein angiography is difficult to interpret in these eyes due to the extensive pigmentary abnormalities causing hyper- and hypofluorescent regions. The CNV may have a classic or occult pattern. In a study of 152 patients with geographic atrophy and no CNV in at least one eye in which patients were followed annually, among patients with CNV in the fellow eye, 18% developed CNV in the study eye that initially manifested GA by 2 years and 34% by 4 years. In contrast, for patients with bilateral geographic atrophy at baseline, the risk for developing CNV was relatively low: 2% by 2 years and 11% by 4 years.144 As geographic atrophy enlarges in the first eye, the risk of subsequently developing clinically obvious CNV decreases in both eyes.80,135,146
Intermediate stage of age-related macular degeneration and cataract
In this aged population, the question of cataract extraction commonly arises, requiring an estimation of the postoperative visual acuity and of how long it may be expected to last. A preoperative fluorescein angiogram and OCT can potentially identify areas of visually significant atrophy or raise suspicion regarding simultaneous presence of neovascular AMD, either one of which may affect postoperative vision function and management. Even when atrophy is suspected on examination, angiography, or OCT indistinct landmarks and poor image quality can make it difficult to tell where the center of the fovea lies80 and whether various layers of the neurosensory retina are intact.
Despite the presence of AMD, most individuals can derive vision benefits following cataract surgery when lens opacity is presumed to contribute to visual impairment. During the AREDS, 1939 eyes underwent cataract surgery. Although eyes without AMD had the largest magnitude of visual acuity improvement (about 8 letters), those with mild AMD had a mean improvement of 6 letters, moderate AMD eyes gained 4 letters, and even those with advanced AMD gained 2 letters when assessed at their first annual study visit that followed cataract surgery.147 These improvements (which were significantly different than preoperative levels in each group) were maintained for at least one year following the surgery. The magnitude of vision improvement following cataract surgery in eyes with neovascular AMD may be even greater than that reported by AREDS, particularly in the present era of anti-VEGF management of neovascular AMD. An analysis of individuals who underwent cataract surgery while participating in the two pivotal phase III trials of ranibizumab for assorted neovascular lesion compositions, showed that the average visual acuity improvement in eyes assigned to the ranibizumab treatment arms was approximately a 10-letter increase from an average level of about 20/125 immediately preceding surgery to 20/80 3 months after surgery.148
The other common concern is whether the insult of cataract surgery accelerates progression of pre-existing AMD. A combined analysis of two population-based surveys (the Beaver Dam and Blue Mountains Eye studies) suggested that cataract surgery increased the risk of incident neovascular AMD by a factor of 5 within 5 years of surgery.149 Although this may have reflected easier visualization of the fundus after surgery and identification of pre-existing neovascular AMD, damage due to photic injury or inflammation at the time of surgery is hypothesized to “trigger” AMD progression. More recent information from AREDS used a variety of analytical methods to explore development of neovascular AMD or central GA following cataract surgery and no clear deleterious effect of any concerning magnitude was identified.150
Age-related macular degeneration and age
Reference has already been made to the physiologic visual decline with age. If AMD is present in addition, subjective tests, such as the time for visual recovery after exposure to a glare source,32 become increasingly abnormal. The incidence and progression of AMD are closely related to age. Over a 5-year period,4 compared to persons 43–54 years, persons 75 years of age and over were more than 10 times as likely to develop earlier stages of AMD and more than 40 times as likely to develop drusen 250 µm in diameter. The 5-year incidence of soft indistinct drusen, increased retinal pigment, and depigmentation was strongly associated with age, the most marked increase being found in people aged 75 and over.4,101 This accelerated deterioration in older persons coincides with the accumulation of the diffuse deposits and makes prognostication in younger persons difficult.
Management of non-neovascular AMD
The management of non-neovascular AMD begins with the recognition that most people with intermediate AMD, while at risk of progressing to advanced AMD, have no symptoms. Since it is estimated that approximately 8 million of the 60 million people aged 55 or older residing in the United States have the intermediate stage of AMD,3,13 usually without symptoms, annual ophthalmologic examination of all people in this age group should include an evaluation of the retina to determine the presence and stage of AMD. If subretinal or intraretinal fluid, hemorrhage, lipid, or elevation of the RPE is noted then neovascular AMD maybe present and fluorescein angiography and OCT is indicated to determine the management, as outlined in Chapter 66 Neovascular (exudative or “wet”) age-related macular degeneration.
If neovascular AMD is not suspected, then the stage of AMD in each eye should be determined. If there is no AMD or only early AMD as the most advanced feature of AMD in both eyes, then no intervention is indicated at that time. Specifically, AREDS could find no evidence that using a dietary supplement of antioxidants and minerals, reduced the risk of progression to advanced AMD or even to intermediate AMD among individuals with early AMD. These individuals may be appropriately counseled that they are at very low risk of visually significant disease within the next 5 years. However, those with early AMD may be invited to undergo annual reassessments to check for progression to intermediate AMD as about one-third of AREDS participants with early AMD progressed to intermediate AMD during the first 5 years of follow-up.13
If intermediate AMD is noted in at least one eye, then the individual should consider using a dietary supplement such as that used in AREDS, provided the individual’s physicians know of no contraindication to using this formulation of antioxidants (daily dose of 500 mg vitamin C, 400 international units of vitamin E, and 15 mg beta carotene) and zinc (daily dose of 80 mg zinc oxide with 2 mg cupric oxide added to reduce the risk of a copper-deficiency anemia). Individuals with at least unilateral intermediate AMD or unilateral advanced AMD who were assigned to this formulation within AREDS had a decreased risk of progression to advanced AMD (Fig. 65.30B) and a decreased risk of vision loss (Fig. 65.30C) through at least 10 years. Although there is minimal risk associated with the use of these supplements (Tables 65.1 and 65.2), a thorough discussion of the modest treatment benefit and the minimal risks should be held. Cigarette smokers should be advised that higher doses of beta-carotene in other randomized trials resulted in a definite, although small, increased risk of developing lung cancer with concomitant adverse effects on mortality.151,152 The discussion should also include the present fact that other formulations, such as those containing lutein or omega-3 long-chain polyunsaturated fatty acids, have not been proven effective in randomized clinical trials and the risks associated with other formulations are presently unknown. Individuals should be reminded that micronutrients, such as beta-carotene, were not suspected to be harmful and concern only arose about its use after careful investigations were performed. The AREDS2 study, is expected to report results in 2013 that should clarify the role of oral supplementation with lutein, zeaxanthin, and omega-3 fatty acids among individuals with bilateral intermediate AMD or those with unilateral advanced AMD with large drusen in the healthier contralateral eye.
| Condition | No antioxidants (%) | Antioxidants (%) |
|---|---|---|
| Hospitalization for mild/moderate symptoms | 10.1 | 7.4 |
| Hospitalization for infections | 0.8 | 1.6 |
| Circulatory | 0.8 | 0.3 |
| Skin, subcutaneous tissue | 1.0 | 2.2 |
| Change in skin color | 6.0 | 8.3 |
| Chest pain | 23.1 | 20.2 |
Table 65.2 Safety – zinc oxide
| Condition | No zinc (%) | Zinc (%) |
|---|---|---|
| Hospitalization for mild/moderate symptoms | 7.8 | 9.7 |
| Hospitalization for genitourinary | 4.9 | 7.5 |
| Hospitalization for genitourinary problems in men | 4.4 | 8.6 |
| Circulatory | 0.3 | 0.9 |
| Anemia | 10.2 | 13.2 |
| Difficulty swallowing pills | 15.3 | 17.8 |
If a person has unilateral advanced AMD (either central GA or neovascular AMD/disciform scar), the fellow eye is at high risk of progression to advanced AMD, especially if large drusen and pigment abnormalities are present in this eye. Irrespective of the specific non-neovascular AMD manifestations in this healthier eye, a dietary supplement such as that used in AREDS should be considered, as explained above, to decrease anatomic progression and functional impairment. If advanced AMD is noted in one eye, and the fellow eye also has advanced AMD, the physician may consider an AREDS type supplement if visual acuity is relatively good (20/100 or better) in at least one eye in the presence of CNV. This consideration is based on AREDS data which showed a decreased risk of at least 3 additional lines of visual acuity in the eye with neovascular AMD among the advanced AMD participants with unilateral CNV at baseline. However, this observation only applied to eyes with CNV and acuity of at least 20/100 at baseline (Table 65.3).
Table 65.3 Effect of treatment on risk of moderate vision loss from baseline in eyes with neovascular age-related macular degeneration at baseline
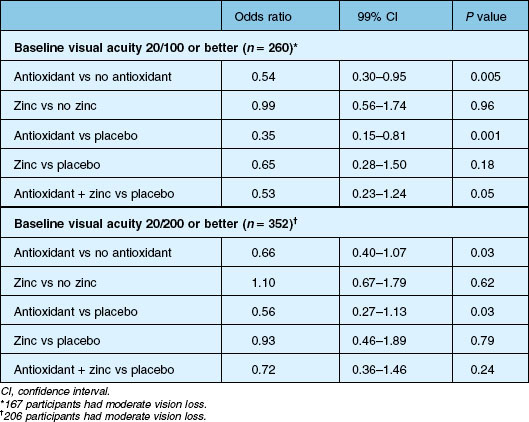
There are a small number of clinical trials underway testing other therapies for non-neovascular AMD. Additional information is included in Chapter 67 (Pharmacotherapy of age-related macular degeneration).
Although an Amsler grid has not been shown to be very sensitive at detecting neovascular AMD,153–156 many physicians recommend its use to individuals at risk of AMD progression. More recently, a perimetry device, the Preferential Hyperacuity Perimeter (PreView PHP, Carl Zeiss Meditec, Dublin, CA) was shown to have twice the sensitivity of an Amsler grid test in individuals with neovascular AMD.156 Additional studies have demonstrated that the device could differentiate eyes with recent-onset neovascular AMD from those with intermediate AMD with both a high sensitivity (82%) and high specificity (88%). These findings make it likely that individuals identified as having progressed to neovascular AMD by PHP testing will indeed have progressed.157 Based on this information, a similar device (ForeseePHP 2.05 Notal Vision, Ltd, Tel Aviv, Israel), was evaluated within a nested case–control study as part of the Carotenoids and co-antioxidants in patients with Age-Related Maculopathy (CARMA) clinical trial. Eyes that progressed to CNV before the device was incorporated into the clinic exam had larger magnitude losses in visual acuity and larger lesion size at time of CNV detection than eyes that progressed to CNV during use of the PHP during the office exam.158 The same technology has now been developed into a home monitoring device (ForeseeHome, Notal Vision, Ltd, Tel Aviv, Israel) and a large-scale randomized clinical trial is underway comparing use of this ForseeHome comprehensive solution to our standard care practices for patient symptom monitoring. The primary objective of this endeavor is to learn whether patients can successfully use this device and experience early detection of disease progression as indicated by less vision loss at time of CNV diagnosis and smaller lesion size at presentation relative to standard care methods of patient monitoring. Even with the potential for devices such as this to improve our ability to detect disease progression early on, it is unlikely that all cases that progress will be detected by this method; therefore, periodic examinations for asymptomatic progression and reassessment of a patient’s functional needs is still indicated.
1 Ferris FL, III. Senile macular degeneration: review of epidemiologic features. Am J Epidemiol. 1983;118:132–151.
2 The Age-Related Eye Disease Study Research Group. Potential public health impact of AREDS results: AREDS report no. 11. Arch Ophthalmol. 2003;121:1621–1624.
3 The Eye Diseases Prevalence Research Group. Prevalence of age-related macular degeneration in the United States. Arch Ophthalmol. 2004;122:567–572.
4 Klein R, Klein BEK, Jensen SC, et al. The five-year incidence and progression of age-related maculopathy. Ophthalmology. 1997;104:7–21.
5 Evans J, Wormold R. Is the incidence of registrable age-related macular degeneration increasing? Br J Ophthalmol. 1996;80:9–14.
6 Campbell JP, Bressler SB, Bressler NB. Impact of availability of anti-VEGF therapy on vision impairment and blindness due to neovascular AMD. Arch Ophthalmol. 2012;130:794–795.
7 Gass JDM. Drusen and disciform macular detachment and degeneration. Arch Ophthalmol. 1973;90:206–217.
8 Haab O. Erkrankungen der Macula Lutea. Centralblat Augenheilkd. 1885;9:384–391. (Cited by Duke-Elder S. System of ophthalmology, vol. 9. London: Kimpton; 1966.)
9 Piguet B, Haimovici R, Bird AC. Dominantly inherited drusen represent more than one disorder: a historical review. Eye. 1995;9:34–41.
10 Gass JDM. Pathogenesis of disciform detachment of the neuroepithelium (parts I and III). Am J Ophthalmol. 1967;63:573–711.
11 Bird AC, Bressler NB, Bressler SB, et al. An international classification and grading system for age-related maculopathy and age-related macular degeneration. Surv Ophthalmol. 1995;39:367–374.
12 Klein R, Klein BEK, Linton KLP. Prevalence of age-related maculopathy: the Beaver Dam Eye Study. Ophthalmology. 1992;99:933–943.
13 The Age-Related Eye Disease Study Research Group. A randomized, placebo-controlled, clinical trial of high-dose supplementation with vitamins C and E, beta carotene, and zinc for age-related macular degeneration and vision loss: AREDS report no. 8. Arch Ophthalmol. 2001;119:1417–1436.
14 Mitchell P, Smith W, Attebo K, et al. Prevalence of age-related maculopathy in Australia. Ophthalmology. 1995;102:1450–1460.
15 Wang Q, Chappell RJ, Klein R, et al. Patterns of age-related maculopathy in the macular area, the Beaver Dam Eye Study. Invest Ophthalmol Vis Sci. 1996;37:2234–2242.
16 Vingerling JR, Dielemans I, Hofman A, et al. The prevalence of age-related maculopathy in the Rotterdam study. Ophthalmology. 1995;102:205–210.
17 Wang JJ, Mitchell P, Smith W, et al. Bilateral involvement by age-related maculopathy lesions in a population, the Blue Mountains Eye Study. Br J Ophthalmol. 1998;82:743–747.
18 Bressler NM, Bressler SB, West SK, et al. The grading and prevalence of macular degeneration in Chesapeake Bay watermen. Arch Ophthalmol. 1989;107:847–852.
19 Gregor Z, Bird AC, Chisholm IH. Senile disciform macular degeneration in the second eye. Br J Ophthalmol. 1977;61:141–147.
20 Klein R, Davis MD, Magli YL, et al. The Wisconsin age-related maculopathy grading system. Ophthalmology. 1991;98:1128–1134.
21 Green WR, McDonnell PJ, Yeo JH. Pathologic features of senile macular degeneration. Ophthalmology. 1985;92:615–627.
22 Green WR, Enger C. Age-related macular degeneration histopathologic studies: the 1992 Lorenz E. Zimmerman lecture. Ophthalmology. 1993;100:1519–1535.
23 Sarks SH. Aging and degeneration in the macular region: a clinico-pathological study. Br J Ophthalmol. 1976;60:324–341.
24 Spraul CW, Grossniklaus HE. Characteristics of drusen and Bruch’s membrane in postmortem eyes with age-related macular degeneration. Arch Ophthalmol. 1997;115:267–273.
25 van der Schaft TL, Mooy CM, de Bruijn WC, et al. Histologic features of the early stages of age-related macular degeneration. A statistical analysis. Ophthalmology. 1992;99:278–286.
26 Laatikainen L, Karinkari J. Capillary-free area of the fovea with advancing age. Invest Ophthalmol Vis Sci. 1977;161:1154–1157.
27 Grunwald JE, Piltz J, Patel N, et al. Effect of aging on retinal macular microcirculation: a blue-field simulation study. Invest Ophthalmol Vis Sci. 1994;34:3609–3613.
28 Groh MJM, Michelson G, Langhans MJ, et al. Influence of age on retinal and optic nerve head blood circulation. Ophthalmology. 1996;103:529–534.
29 Ibrahim YWM, Bots ML, Mulder PGH, et al. Number of perifoveal vessels in aging, hypertension, and atherosclerosis: the Rotterdam Study. Invest Ophthalmol Vis Sci. 1998;39:1049–1053.
30 Gao H, Hollyfield JG. Aging of the human retina: differential loss of neurons and retinal pigment epithelial cells. Invest Ophthalmol Vis Sci. 1992;33:1–17.
31 Rubin GS, West SK, Munoz B, et al. A comprehensive assessment of visual impairment in a population of older Americans, the SEE study. Invest Ophthalmol Vis Sci. 1977;38:557–568.
32 Sandberg MA, Gaudio AR. Slow photostress recovery and disease severity in age-related macular degeneration. Retina. 1995;15:407–412.
33 Liem AT, Keunen JE, van Norren D. Clinical applications of fundus reflection densitometry. Surv Ophthalmol. 1996;41:37–50.
34 Curcio CA, Millican CL, Allen KA, et al. Aging of the human photoreceptor mosaic: evidence for selective vulnerability of rods in central retina. Invest Ophthalmol Vis Sci. 1993;34:3278–3296.
35 Dorey CK, Wu G, Ebenstein D, et al. Cell loss in the aging retina: relationship to lipofuscin accumulation and macular degeneration. Invest Ophthalmol Vis Sci. 1989;30:1691–1699.
36 Feeney-Burns L, Burns RP, Gao C. Age-related macular changes in humans over 90 years old. Am J Ophthalmol. 1990;109:265–278.
37 Marshall J, Grindle J, Ansell PL, et al. Convolution in human rods: an ageing process. Br J Ophthalmol. 1979;63:181–187.
38 Curcio CA, Medeiros NE, Millican CL. Photoreceptor loss in age-related macular degeneration. Invest Ophthalmol Vis Sci. 1996;37:1236–1249.
39 Young RW. The Bowman Lecture, 1982. Biological renewal: applications to the eye. Trans Ophthalmol Soc UK. 1982;102:42–75.
40 Feeney-Burns L, Berman ER, Rothman H. Lipofuscin of human retinal pigment epithelium. Am J Ophthalmol. 1980;90:783–791.
41 Young RW. Pathophysiology of age-related macular degeneration. Surv Ophthalmol. 1987;31:291–306.
42 Rakoczy PE, Baines M, Kennedy C, et al. Correlation between autofluorescent debris accumulation and the presence of partially processed forms of cathepsin D in cultured retinal pigment epithelial cells challenged with rod outer segments. Exp Eye Res. 1996;63:159–167.
43 Feeney-Burns L, Hilderbrand ES, Eldridge S. Aging human RPE: morphometric analysis of macular, equatorial, and peripheral cells. Invest Ophthalmol Vis Sci. 1984;25:195–200.
44 Beatty S, Boulton M, Henson D, et al. Macular pigment and age-related macular degeneration. Br J Ophthalmol. 1999;83:867–877.
45 Kennedy CJ, Rakoczy PE, Constable IJ. Lipofuscin of the retinal pigment epithelium: a review. Eye. 1995;9:763–771.
46 von Ruckmann A, Fitzke FW, Bird AC. In vivo fundus autofluorescence in macular dystrophies. Arch Ophthalmol. 1997;115:609–615.
47 Delori FC, Dorey CK, Staurenghi G, et al. In vivo fluorescence of the ocular fundus exhibits retinal pigment epithelium lipofuscin characteristics. Invest Ophthalmol Vis Sci. 1995;36:718–729.
48 Panda-Jonas S, Jonas JB, Jakobczyk-Zmija M. Retinal pigment epithelial cell count, distribution, and correlations in normal human eyes. Am J Ophthalmol. 1996;121:181–189.
49 Gass JDM. Stereoscopic atlas of macular diseases: diagnosis and treatment, 4th ed. St Louis: Mosby; 1997.
50 Ramrattan RS, van der Schaft TL, Mooy CM, et al. Morphometric analysis of Bruch’s membrane, the choriocapillaris, and the choroid in aging. Invest Ophthalmol Vis Sci. 1994;35:2857–2864.
51 Karwatowski WSS, Jeffries TE, Duance VC, et al. Preparation of Bruch’s membrane and analysis of the age-related changes in the structural collagens. Br J Ophthalmol. 1995;79:944–952.
52 Holz FG, Owens SL, Marks J, et al. Ultrastructural findings in autosomal dominant drusen. Arch Ophthalmol. 1997;115:788–792.
53 van der Schaft TL, de Bruijn WC, Mooy CM, et al. Is basal laminar deposit unique for age-related macular degeneration? Arch Ophthalmol. 1991;109:420–425.
54 Marshall GE, Konstas AGP, Reid GG, et al. Type IV collagen and laminin in Bruch’s membrane and basal linear deposit in the human macula. Br J Ophthalmol. 1992;76:607–614.
55 Feeney-Burns L, Ellersieck MR. Age-related changes in the ultrastructure of Bruch’s membrane. Am J Ophthalmol. 1985;100:686–697.
56 Burns RP, Feeney-Burns L. Clinico-morphologic correlations of drusen of Bruch’s membrane. Trans Am Ophthalmol Soc. 1980;78:206–225.
57 Ishibashi T, Sorgente N, Patterson R, et al. Aging changes in Bruch’s membrane of monkeys: an electron microscopic study. Ophthalmologica. 1986;192:179–190.
58 Killingsworth MC. Age-related components of Bruch’s membrane in the human eye. Graefes Arch Clin Exp Ophthalmol. 1987;225:406–412.
59 Holz FG, Sheraidah G, Pauleikhoff D, et al. Analysis of lipid deposits extracted from human macular and peripheral Bruch’s membrane. Arch Ophthalmol. 1994;112:402–406.
60 Klein R, Klein BEK, Jensen SC, et al. The relationship of ocular factors to the incidence and progression of age-related maculopathy. Arch Ophthalmol. 1998;116:506–513.
61 Sheraidah G, Steinmetz R, Maguire J, et al. Correlation between lipids extracted from Bruch’s membrane and age. Ophthalmology. 1993;100:47–52.
62 Pauleikhoff D, Harper CA, Marshall J, et al. Aging changes in Bruch’s membrane: a histochemical and morphologic study. Ophthalmology. 1990;97:171–178.
63 Spaide RF, Ho-Spaide WC, Browne R, et al. Characterization of peroxidized lipids in Bruch’s membrane. Retina. 1999;19:141–147.
64 Holz FG, Bellmann C, Margaritidis M, et al. Patterns of increased in vivo fundus autofluorescence in the junctional zone of geographic atrophy associated with age-related macular degeneration. Graefes Arch Clin Exp Ophthalmol. 1999;237:145–152.
65 Moore DJ, Hussain AA, Marshall J. Age-related variation in the hydraulic conductivity of Bruch’s membrane. Invest Ophthalmol Vis Sci. 1995;36:1290–1297.
66 Starita C, Hussain AA, Patmore A, et al. Localization of the site of major resistance to fluid transport in Bruch’s membrane. Invest Ophthalmol Vis Sci. 1997;38:762–767.
67 Marshall J, Hussain AA, Starita C, et al. The retinal pigment epithelium: function and disease. New York: Oxford University Press, 1998.
68 Grunwald JE, Hariprasad SM, Dupont J. Effect of aging on foveolar choroidal circulation. Arch Ophthalmol. 1998;116:150–154.
69 Curcio CA, Millican CL. Basal linear deposit and large drusen are specific for early age-related maculopathy. Arch Ophthalmol. 1999;117:329–339.
70 Zarbin MA. Age-related macular degeneration: review of pathogenesis. Eur J Ophthalmol. 1998;8:199–206.
71 Löffler KU, Lee WR. Basal linear deposit in the human macula. Graefes Arch Clin Exp Ophthalmol. 1986;224:493–501.
72 van der Schaft TL, Mooy CM, de Bruijn WC, et al. Immunohistochemical light and electron microscopy of basal laminar deposit. Graefes Arch Clin Exp Ophthalmol. 1994;232:40–46.
73 Sarks JP, Sarks SH, Killingsworth MC. Evolution of soft drusen in age-related macular degeneration. Eye. 1994;8:269–283.
74 Green WR, Key SN, III. Senile macular degeneration: a histopathologic study. Trans Am Ophthalmol Soc. 1977;75:180–254.
75 Bressler NM, Silva JC, Bressler SB, et al. Clinicopathologic correlation of drusen and retinal pigment epithelial abnormalities in age-related macular degeneration. Retina. 1994;14:130–142.
76 El Baba F, Green WR, Fleischmann J, et al. Clinicopathologic correlation of lipidization and detachment of the retinal pigment epithelium. Am J Ophthalmol. 1986;101:576–583.
77 Shuman SG, Koreishi AF, Farsui S, et al. Photoreceptor layer thinning over drusen in eyes with age-related macular degeneration imaged in vivo with sepctral-domain optical coherence tomography. Ophthalmology. 2009;116:488–496.
78 Pieroni CG, Witkin AJ, Ko TH, et al. Ultrahigh resolution optical coherence tomography in non-exudative age related macular degeneration. Br J Ophthalmolo. 2006;90:191–197.
79 Ho J, Witkin AJ, Liu J, et al. Documentation of intraretinal retinal pigment epithelium migration via high-speed ultrahigh-resolution optical coherence tomography. Ophthalmology. 2011;118:687–693.
80 Sarks JP, Sarks SH, Killingsworth M. Evolution of geographic atrophy of the retinal pigment epithelium. Eye. 1988;2:552–577.
81 Penfold PL, Killingsworth MC, Sarks SH. Senile macular degeneration: the involvement of immunocompetent cells. Graefes Arch Clin Exp Ophthalmol. 1985;223:69–76.
82 Sarks JP, Sarks SH, Killingsworth MC. Morphology of early choroidal neovascularisation in age-related macular degeneration. Eye. 1997;11:515–522.
83 Killingsworth MC, Sarks JP, Sarks SH. Macrophages related to Bruch’s membrane in age-related macular degeneration. Eye. 1990;4:613–621.
84 The Age-Related Eye Disease Study Research Group. The Age-Related Eye Disease Study severity scale for age-related macular degeneration: AREDS report no. 17. Arch Ophthalmol.. 2005;123:1484–1498.
85 Eye Disease Case-Control Study Group. Risk factors for neovascular age-related macular degeneration. Arch Ophthalmol. 1992;110:1701–1708.
86 Macular Photocoagulation Study Group. Risk factors for choroidal neovascularization in the second eye of patients with juxtafoveal or subfoveal choroidal neovascularization secondary to age-related macular degeneration. Arch Ophthalmol. 1997;115:741–747.
87 Bressler NM, Bressler SB, Seddon JM, et al. Drusen characteristics in patients with exudative versus nonexudative age-related macular degeneration. Retina. 1988;8:108–114.
88 The Age-Related Eye Disease Study Research Group. A simplified severity scale for age-related macular degeneration: AREDS no. 18. Arch Ophthalmol. 2005;123:1570–1574.
89 Barondes M, Pauleikhoff D, Chisholm IC, et al. Bilaterality of drusen. Br J Ophthalmol. 1990;74:180–182.
90 Friedman D, Parker JS, Kimble JA, et al. Quantification of fluorescein-stained drusen associated with age-related macular degeneration. Retina. 2011;31(10):1–6.
91 Chang AA, Guyer DR, Orlock DR, et al. Age-dependent variations in the drusen fluorescence on indocyanine green angiography. Clin Experiment Ophthalmol. 2003;31(4):300–304.
92 Arnold JJ, Quaranta M, Soubrane G, et al. Indocyanine green angiography of drusen. Am J Ophthalmol. 1997;124:344–356.
93 Delori FC, Fleckner MR, Goger DG, et al. Autofluorescence distribution associated with drusen in age-related macular degeneration. Invest Ophthalmol Vis Sci. 2000;41(2):496–504.
94 Khanifar AA, Koreishi AF, Izatt JA, et al. Drusen ultrastructure imaging with spectral domain optical coherence tomography in age-related macular degeneration. Ophthalmology. 2008;115:1883–1890.
95 Schlanitz FG, Baumann B, Spaliek T, et al. Performance of automated drusen detection by polarization-sensitive optical coherence tomography. Invest Ophthalmol Vis Sci. 2011;51:4571–4579.
96 Jain N, Farsiu S, Khanifar AA, et al. Quantitative comparison of drusen segmented on SD-OCT versus drusen delineated on color fundus photographs. Invest Ophthalmol Vis Sci. 2010;51:4875–4883.
97 Gass JDM, Jallow S, Davis B. Adult vitelliform macular detachment occurring in patients with basal laminar drusen. Am J Ophthalmol. 1985;99:445–459.
98 Sarks SH, Arnold JJ, Killinsworth MC, et al. Early drusen formation in the normal and aging eye and their relationship to age-related maculopathy: a clinicopathological study. Br J Ophthalmol. 1999;83:358–368.
99 Hageman GS, Mullins RF. Molecular composition of drusen as related to substructural phenotype. Mol Vis. 1999;5:28–37.
100 Coffey AJH, Brownstein S. The prevalence of macular drusen in postmortem eyes. Am J Ophthalmol. 1986;102:164–171.
101 Bressler NM, Munoz B, Maguire MG, et al. Five-year incidence and disappearance of drusen and retinal pigment epithelial abnormalities, Chesapeake Bay watermen study. Arch Ophthalmol. 1995;113:301–308.
102 Sarks SH. Drusen and their relationship to senile macular degeneration. Aust J Ophthalmol. 1980;8:117–130.
103 Bird AC. Pathogenesis of retinal pigment epithelial detachment in the elderly: the relevance of Bruch’s membrane change: Doyne lecture. Eye. 1991;5:1–12.
104 Casswell AG, Kohen D, Bird AC. Retinal pigment epithelial detachments in the elderly: classification and outcome. Br J Ophthalmol. 1985;69:397–403.
105 Hartnett ME, Weiter JJ, Garsd A, et al. Classification of retinal pigment epithelial detachments associated with drusen. Graefes Arch Clin Exp Ophthalmol. 1992;230:11–19.
106 Holz FG, Wolfensberger TJ, Piguet B, et al. Bilateral macular drusen in age-related macular degeneration: prognosis and risk factors. Ophthalmology. 1994;101:1522–1528.
107 Cukras C, Agron E, Klein ML, et al. Natural history of drusenoid pigment epithelial detachment in age-related macular degeneration: Age-Related Eye Disease Study Report No. 28. for the Age-Related Eye Disease Study Research Group. Ophthalmology. 2010;117:489–499.
108 Complications of Age-Related Macular Degeneration Prevention Trial Research Group. Laser treatment in patients with bilateral large drusen. The Complications of Age-Related Macular Degeneration Prevention Trial. Ophthalmology. 2006;113:1974–1986.
109 Arnold JJ, Sarks SH, Killingsworth MC, et al. Reticular pseudodrusen: a risk factor in age-related maculopathy. Retina. 1995;15:183–191.
110 Zweifel SA, Spaide RF, Curio CA, et al. Reticular pseudodrusen are subretinal deposits. Ophthalmology. 2010;117:303–312.
111 Zweifel SA, Imamura Y, Spaide TC, et al. Prevalence and significance of subretinal drusenoid deposits (reticular psuedodrusen) in age-related macular degeneration. Ophthalmology. 2010;117:1775–1781.
112 Rudolf M, Malek G, Messinge JD, et al. Sub-retinal drusenoid deposits in human retina: organization and composition. Exp Eye Res. 2008;87:402–408.
113 Pumariega NM, Smith RT, Sohrab MA, et al. A prospective study of reticular macular disease. Ophthalmology. 2011;118(8):1619–1626.
114 Sarraf D, Gin T, Yu F, et al. Long-term drusen study. Retina. 1999;19:513–519.
115 Pauleikhoff D, Zuels S, Sheraidah GS, et al. Correlation between biochemical composition and fluorescein binding of deposits in Bruch’s membrane. Ophthalmology. 1992;99:1548–1553.
116 Mullins RF, Johnson LV, Anderson DH, et al. Characterization of drusen-associated glycoconjugates. Ophthalmology. 1998;104:288–298.
117 Mullins RF, Hageman GS. Human ocular drusen possess novel core domains with a distinct carbohydrate composition. J Histochem Cytochem. 1999;47:1533–1539.
118 Hageman GS, Mullins RF, Russell SR, et al. Vitronectin is a constituent of ocular drusen and the vitronectin gene is expressed in human retinal pigmented epithelial cells. FASEB J. 1999;13:477–484.
119 Schmitz-Valckenberg A, Fleckenstein M, Scholl H, et al. Fundus autofluorescence and progression of age-related macular degeneration. Surv Ophthalmol. 2009;54:96–117.
120 Berenberg TL, Metelitsina TI, Madow B, et al. The association between drusen extent and foveolar choroidal bloodflow in age-related macular degeneration. Retina. 2011;31(10):1–7.
121 McLeod DS, Lutty GA. High-resolution histologic analysis of the human choroidal vasculature. Invest Ophthalmol Vis Sci. 1994;35:3799–3811.
122 Pauleikhoff D, Chen JC, Chisholm IH, et al. Choroidal perfusion abnormality with age-related Bruch’s membrane change. Ophthalmology. 1990;109:211–217.
123 Staurenghi G, Bottoni F, Lonati C, et al. Drusen and choroidal filling defects: a cross-sectional survey. Ophthalmologica. 1992;205:178–186.
124 Pauleikhoff D, Spital M, Radermacher M, et al. Regression of the choriocapillaris in age-related macular degeneration. Invest Ophthalmol Vis Sci. 1997;38(Suppl.):967.
125 Henkind P, Gartner S. The relationship between retinal pigment epithelium and the choriocapillaris. Trans Ophthalmol Soc UK. 1983;103:444–447.
126 Glaser BM. Extracellular modulating factors and the control of intraocular neovascularization. Arch Ophthalmol. 1988;106:603–607.
127 Friedman E, Krupsky S, Lane AM, et al. Ocular blood flow velocity in age-related macular degeneration. Ophthalmology. 1995;102:640–646.
128 Chen JC, Fitzke FW, Pauleikhoff D, et al. Functional loss in age-related Bruch’s membrane change with choroidal perfusion defect. Invest Ophthalmol Vis Sci. 1992;33:334–340.
129 Steinmetz RL, Haimovici R, Jubb C, et al. Symptomatic abnormalities of dark adaptation in patients with age-related Bruch’s membrane change. Br J Ophthalmol. 1993;77:549–554.
130 Remulla JFC, Gaudio AR, Miller S, et al. Foveal electroretinograms and choroidal perfusion characteristics in fellow eyes of patients with unilateral neovascular age-related macular degeneration. Br J Ophthalmol. 1995;79:558–561.
131 Piguet B, Palmvang TB, Chisholm IH, et al. Evolution of age-related macular degeneration with choroidal perfusion abnormality. Am J Ophthalmol. 1992;113:657–663.
132 Sunness JS, Massof RW, Johnson MA, et al. Diminished foveal sensitivity may predict the development of advanced age-related macular degeneration. Ophthalmology. 1989;96:375–381.
133 Sunness JS, Johnson MA, Massof RW, et al. Retinal sensitivity over drusen and nondrusen areas: a study using fundus perimetry. Arch Ophthalmol. 1988;106:1081–1084.
134 Schatz H, McDonald HR. Atrophic macular degeneration: rate of spread of geographic atrophy and visual loss. Ophthalmology. 1989;96:1541–1551.
135 Sunness JS, Rubin GS, Applegate CA, et al. Visual function abnormalities and prognosis in eyes with age-related geographic atrophy of the macula and good visual acuity. Ophthalmology. 1997;104:1677–1691.
136 Maguire P, Vine AK. Geographic atrophy of the retinal pigment epithelium. Am J Ophthalmol. 1986;102:621–625.
137 Sunness JS, Applegate CA, Haselwood D, et al. Fixation patterns and reading rates in eyes with central scotomas from advanced atrophic age-related macular degeneration and Stargardt’s disease. Ophthalmology. 1996;103:1458–1466.
138 Weiter JJ, Delori F, Dorey CK. Central sparing in annular macular degeneration. Am J Ophthalmol. 1988;106:286–292.
139 Snodderly DM. Evidence for protection against age-related macular degeneration by carotenoids and antioxidant vitamins. Am J Clin Nutr. 1995;62(Suppl):1448–1461.
140 Klein MK, Ferris FL, Armstrong J, et al. AREDS Research Group. Retinal precursors and the development of geographic atrophy in age-related macular degeneration. Ophthalmology. 2008;115:1026–1031.
141 Fleckenstein M, Schmitz-Valckenberg S, Adrion C, et al. Tracking progression with spectral-domain optical coherence tomography in geographic atrophy caused by age-related macular degeneration. Invest Ophthalmol Vis Sci. 2010;51:3846–3852.
142 Klein R, Klein BE, Knudston MD, et al. Fifteen-year cumulative incidence of age-related macular degeneration: the Beaver Dam Eye Study. Ophthalmology. 2007;114:253–262.
143 Hyman LG, Lilienfeld AM, Ferris FL, III., et al. Senile macular degeneration: a case-control study. Am J Epidemiol. 1983;118:213–227.
144 Sunness JS, Gonzalez-Baron J, Applegate CA, et al. Enlargement of atrophy and visual acuity loss in the geographic atrophy form of age-related macular degeneration. Ophthalmology. 1999;106:1768–1779.
145 AREDS Research Group. Change in area of geographic atrophy in the Age-Related Eye Disease Study: AREDS report no. 26. Arch Ophthalmol. 2009;127(9):1168–1174.
146 Sunness JS, Gonzalez-Baron J, Bressler NM, et al. The development of choroidal neovascularization in eyes with geographic atrophy form of age-related macular degeneration. Ophthalmology. 1999;106:910–919.
147 Forooghian F, Agron E, Clemons TE, et al. for the AREDS Research Group. Visual acuity outcomes after cataract surgery in patients with age-related macular degeneration: Age-Related Eye Disease Study report no. 27. Ophthalmology. 2009;116:2093–2100.
148 Rosenfeld PJ, Shapiro H, Ehrlich JA, et al. on behalf of the MARINA and ANCHOR Study Groups. Cataract surgery in ranibizumab-treated patients with neovascular age-related macular degeneration from the phase 3 ANCHOR and MARINA Trials. Am J Ophthalmol. 2011;152:793–798.
149 Wang JJ, Klein R, Smith W, et al. Cataract surgery and the 5-year incidenceof late-stage age-related maculopathy. Pooled findings form the Beaver Dam and Blue Mountains Eye Studies. Ophthalmology. 2003;110:1960–1967.
150 Chew EY, Sperduto RD, Milton RC, et al. Risk of advanced age-related macular degeneration after cataract surgery in the Age-Related Eye Disease Study: AREDS report no. 25. Ophthalmology. 2009;116:297–303.
151 The Alpha-Tocopherol, Beta Carotene Cancer Prevention StudyGroup. The effect of vitamin E and beta carotene on the incidence of lung cancer and other cancers in male smokers. N Engl J Med. 1994;330:1029–1035.
152 Omenn GS, Goodman GE, Thornquist MD, et al. Risk factors for lung cancer and for intervention effects in CARET, the Beta-Carotene and Retinol Efficacy Trial. J Natl Cancer Inst. 1996;88(21):1550–1559.
153 Fine AM, Elman MJ, Ebert JE, et al. Earliest symptoms caused by neovascular membranes in the macula. Arch Ophthalmol. 1986;104:513–514.
154 Achard OA, Safran AB, Duret FC, et al. Role of the completion phenomenon in the evaluation of Amsler grid results. Am J Ophthalmol. 1995;120:322–329.
155 Schuchard RA. Validity and interpretation of Amsler grid report. Arch Ophthalmol. 1993;111:776–780.
156 Goldstein M, Loewenstein A, Barak A, et al. Results of a multicenter clinical trial to evaluate the preferential hyperacuity perimeter for detection of age-related macular degeneration. Retina. 2005;25:296–303.
157 Preferential Hyperacuity Perimetry (PHP) Research Group. Preferential Hyperacuity Perimeter (PreView PHPTM) for detecting choroidal neovascularization study. Ophthalmology. 2005;112:1758–1765.
158 Lai Y, Grattan J, Shi Y, et al. Functional and morphologic benefits in early detection of neovascular age-related macular degeneration using the preferential hyperacuity perimeter. Retina. 2011;31(8):1620–1626.
* A uniform terminology for the diffuse deposits is gaining acceptance. The original observations by light microscopy distinguished only one deposit. This was referred to as the basal linear deposit and it proved a useful histologic marker for the stage of the disease.23 Subsequent electron microscopic studies showed that this deposit lies internal to the RPE basement membrane, so the name was changed to basal laminar deposit, but another layer could also be demonstrated lying external to the basement membrane. Green and Enger22 suggested retaining the term basal laminar deposit for the material internal to the basement membrane, but resurrecting basal linear deposit for the diffuse layer of vesicular and granular material on the external aspect. Unfortunately the acronym BLD could then be applied to either deposit, so recently the term basement membrane deposit (BMD) has been proposed for the basal laminar deposit. Until the terminology and the abbreviations become standardized, this chapter will continue to apply the abbreviation BLD for the basal laminar deposit and use the terms membranous debris, or the unabbreviated basal linear deposit, when referring to the material external to the basement membrane. These definitions replace older terms such as diffuse thickening of the inner aspect of Bruch’s membrane and diffuse drusen.21,74,75
[/level-membership-for-opthalmology-category][not-level-membership-for-opthalmology-category]
Chapter 65 Age-Related Macular Degeneration
Non-neovascular Early AMD, Intermediate AMD, and Geographic Atrophy
Introduction
Age-related macular degeneration (AMD) has been the leading cause of legal blindness in patients aged 65 or over,1 and it has been the most common overall cause of blindness in the western world. Using data from the 2000 census, it has been estimated that in the USA more than 8 million people have specific AMD features that put them at risk for progression to advanced AMD and vision loss.2,3 Over a 5-year period about 1.3 million of these individuals are predicted to develop the advanced forms of AMD, namely neovascular AMD or foveal geographic atrophy (GA).2 In addition, hundreds of thousands of people aged 75 and over are anticipated to join the pool of people at increased risk of developing advanced AMD over subsequent 5-year periods.4 The prevalence of AMD continues to rise as a result of the increasing percentage of elderly persons and the improved management of other eye diseases.3 Prevalence of AMD has also increased steadily in the UK, accounting for approximately 50% of registered blindness in England and Wales that cannot be explained by the increasing age of the population alone.5 In addition, macular degeneration is the commonest reason that patients with lesser handicaps attend low-vision clinics.
Within the past 5 years new and improved treatments for the neovascular form of advanced AMD have been adopted throughout the developed world. Therefore, in the years ahead the overall burden of vision loss associated with AMD is anticipated to decline substantially.6 The same progress has not been made for treatment of advanced non-neovascular AMD (GA); as such, the importance of atrophic AMD as a leading cause of vision impairment is expected to increase.
The advanced forms of AMD are those that are frequently associated with visual acuity loss and they are divided into non-neovascular atrophic (dry) type and neovascular (wet) type. In atrophic AMD, gradual disappearance of the retinal pigment epithelium (RPE) results in one or more patches of atrophy that slowly enlarge and coalesce. Affected areas have no visual function, since loss of the RPE is associated with fallout of photoreceptors. Gass7 applied the term “geographic atrophy of the retinal pigment epithelium” to this presentation, which is the natural end-result of AMD in the absence of clinical evidence of choroidal neovascularization (CNV). This chapter is devoted to the clinical and pathologic features that may lead to this development, as well as their management.
Senile macular degeneration was first reported as a clinical entity in 1885 by Otto Haab,8 who described a variety of pigmentary and atrophic changes in the macular region, causing progressive impairment of central vision in patients over the age of 50. Subsequent observers referred to the different fundus manifestations of the disease as separate entities, resulting in a variety of descriptive eponyms. A review of dominantly inherited drusen9 found, however, that only Doyne’s honeycomb familial choroiditis and malattia levantinese were disorders that could be distinguished from each other by clinical criteria, and these entities are considered to be a separate category. A major step toward a better understanding of the disease was taken when Gass10 clarified that drusen, senile macular degeneration, and senile disciform macular degeneration represented a single disease.
In the 1990s it had been proposed that the features should be termed either early or late age-related maculopathy (ARM),11,12 to suggest that early ARM was not necessarily a pathologic state, with the term age-related macular degeneration (AMD) being reserved for late ARM and encompassing geographic atrophy and neovascular AMD. Since many epidemiologic studies are based on the International Epidemiological Age-related Maculopathy Study Group11 description, it is described here. However, more recent descriptions of AMD from the Age-Related Eye Disease Study Group13 have provided longitudinal information to understand features associated with an increased risk of developing advanced forms of AMD and are used in the description of the clinical management of AMD that follows.
In the International Epidemiological Age-related Maculopathy Study Group11 definitions used in many epidemiologic studies, early ARM was defined as a degenerative disorder in individuals ≥50 years of age, characterized by the presence of any of the following lesions:
• Soft drusen (intermediate >63 µm, ≤125 µm; large >125 µm) drusen. When occurring alone, soft, indistinct drusen are considered more likely to indicate AMD than soft, distinct drusen,4,14,15 and drusen over 125 µm have greater importance than smaller drusen.16,17
• Areas of hyperpigmentation associated with drusen but excluding pigment surrounding hard drusen.
• Areas of depigmentation or hypopigmentation associated with drusen. These areas, which commonly occur as drusen fade, are most often more sharply demarcated than drusen, but do not permit exposure of the underlying choroidal vessels.
• Visual acuity is not used to define ARM or AMD because advanced changes may be present without anatomically affecting the fovea.
This definition of early ARM excluded small, hard drusen alone, pigment changes alone, and even pigment changes surrounding small, hard drusen for two reasons: (1) hard drusen become an almost constant finding in the fifth decade; and (2) a number of diverse processes can cause pigment abnormalities that may not be possible to distinguish from early ARM, so the inclusion of soft drusen makes the definition more specific to ARM and AMD.14 However, eyes with numerous small, hard drusen or eyes with pigment abnormalities in the absence of obvious drusen can also progress to soft drusen.
Grading systems have been devised to permit comparison of severity over time in the size, number, and extent of drusen.11,18–20 Drusen extent is measured by mentally sweeping all drusen present in the area of interest into a condensed zone and estimating the area of that zone. Grids and standard circles prepared on transparent sheets are overlaid to one film image of a pair of stereoscopic color fundus transparencies to assist in the grading process. Alternatively, a digital version of the same grids and circles is superimposed on a digital fundus image. Because of the 3× magnification of the 30-degree fundus camera, 4.7 mm on the grid corresponds to approximately 1500 µm, the diameter of the optic disc in the average fundus. Figure 65.1 illustrates the standard grid used when applying the Wisconsin Age-Related Maculopathy Grading System.20 This same grid is used in most fundus grading systems of AMD from color photographs. The diameters of the circles within the standard grid are respectively 1000 µm, 3000 µm, and 6000 µm. The central and middle circles combined define the inner macula, which is two disc diameters across. The outer circle defines the macula itself. Figure 65.2 illustrates smaller standard circles, which are used to grade the size and area of specified lesions.11
These grading systems are applied to color images and are intended primarily for epidemiologic studies and clinical trials. However, fluorescein angiography often provides additional insight into the natural history of the disease, as do pathologic studies,21–25 which have demonstrated aging and degeneration to be a continuum based on diffuse morphologic changes at the level of the RPE under the macula, as distinct from focal abnormalities such as drusen. These diffuse changes comprise two types of sub-RPE or basal deposits separated by the RPE basement membrane. On the internal aspect lies a layer of abnormal basement membrane material, referred to as the basal laminar deposit (BLD); on the external aspect of the basement membrane is a layer of membranous debris, referred to as the basal linear deposit.22 This latter deposit may build up into a type of soft drusen specific for AMD. However, although significant diffuse changes correlate with a decline in visual acuity,23 they are difficult to see in the fundus, making a histologic definition of AMD based on basal laminar and basal linear deposits unworkable in a clinical setting.
Aging
The aging eye – clinical findings
The normal aged fundus usually demonstrates loss of the foveal and foveolar reflexes. This may be due to fallout of cells from the inner retinal layers, shallowing of the walls of the foveal pit, and enlargement of the capillary-free zone.26 A few small, hard drusen are almost always present.12,14,16,18
Irregularity of retinal pigmentation gives rise to a fine granularity, and the fundus commonly demonstrates a tigroid background. This senile tigroid fundus (see Fig. 65.3A) is increasingly apparent with advancing age but remains compatible with normal vision. It is unrelated to skin pigmentation and differs from the tigroid fundus in youth in that the choroidal vessels become visible under the macula. There is commonly also a peripapillary halo of atrophy in which the exposed vessels may be sheathed and the intervascular spaces appear pale. Studies using blue-field stimulation27 and scanning laser Doppler flowmetry28 have shown a decrease in blood flow in the retinal macular capillaries of older individuals, and a lower number of perifoveal arterioles and venules have also been reported.29 These findings are consistent with enlargement of the capillary-free zone26 and loss of ganglion cells.30
Many aspects of visual function, not just visual acuity, show a decline with age, including dark adaptation, stereopsis, contrast sensitivity, sensitivity to glare, and visual field tests.31,32 Color perception and foveal cone pigment densities show a decline.33 The limits of normal aging are therefore difficult to define in terms of visual performance.
The aging eye – morphologic changes
The evolution of the aging process is easier to appreciate by studying morphologic changes. The RPE, Bruch’s membrane, and choriocapillaris must function efficiently to serve as the nutritional complex for the photoreceptors. In a normal eye (Fig. 65.4A), the complement of photoreceptors is normal, the RPE forms a regular layer, Bruch’s membrane is not unduly thickened, and the choroid consists of the usual three layers of vessels. Each of these tissues has at one time been regarded as primarily at fault in macular degeneration. Therefore it is first necessary to consider the changes developing in these structures during life (Fig. 65.4B).
Photoreceptors
The cone density at the foveal center does not appear to alter significantly during the first eight decades.30,34,35 A significant loss beyond the ninth decade has been reported, but it is not invariable.36
In the rods the outer segments become convoluted, possibly as an expression of impaired phagocytosis.37 This may lead to the accumulation of outer-segment material at the apical surface of the RPE.36 Fallout of rods can also be demonstrated, with the fastest rate occurring between the second and fourth decades. Cells in the ganglion cell layer show a similar rate of decrease, so the rod and ganglion cell layer densities maintain a constant ratio.30 Rod photoreceptors and cells in the ganglion cell layer therefore appear to be more vulnerable than cones to loss during aging. In fact, this may be the initial subclinical stage of AMD because the spatial population of parafoveal rods decreases by 30% during adulthood, and AMD often commences in a similar parafoveal distribution.34,38
Retinal pigment epithelium
Each pigment epithelial cell must continue to engulf spent photoreceptor discs on a diurnal basis for life, the rods being digested by day and the cones by night,39 and any undigested residual bodies remain as lipofuscin.40 The RPE must also remove material from other retinal pigment cells or photoreceptors that may be eliminated, a burden that increases sharply once degeneration of these tissues commences. Finally, because the RPE is a nondividing tissue, autophagy alone could lead to the accumulation of lipofuscin in the same way that it builds up in the neurons of the central nervous system, which have no photoreceptors to phagocytose. The RPE is therefore particularly vulnerable to cell encumbrance.
Damage to molecules may occur in the photoreceptor outer segments as a result of free radical chain reactions initiated by radiation or oxygen metabolism. After phagocytosis, the lysosomal enzymes may fail to “recognize” these abnormal molecules, with a consequent failure of molecular degradation41 and accumulation of lipofuscin. Free radicals also damage the cells’ own molecules, and there is evidence that enzymatic inactivation occurs, particularly cathepsin D, which is the main lysosomal protease responsible for rod outer-segment digestion.42 There is also an increase of complex granules of melanolysosomes and melanolipofuscin, which are thought to be melanin granules undergoing repair or degradation.
The accumulation of lipofuscin in the RPE, which can be demonstrated as early as the second decade of life,43 reduces the cytoplasmic space. As the cell volume available to the organelles diminishes, the capacity to deal with photoreceptors is reduced. The issue of whether lipofuscin accumulation has significant deleterious effects on the RPE, and consequently on overall retinal function, continues to be of great interest.44,45 Since lipofuscin is the predominant fluorophore responsible for fundus autofluorescence, the in vivo imaging and mapping of retinal autofluorescence using the confocal scanning laser ophthalmoscope46 or fundus spectrophotometer47 may prove helpful in estimating the risk for progression to AMD.
A certain loss of RPE cells occurs with age, particularly in the periphery. For the fovea this decrease in cell density has been estimated to be about 0.3% per year.48 The ratio of photoreceptors to RPE cells remains the same,30,36 the average cone-to-RPE ratio at the center of fovea being approximately 24 : 1. Photoreceptors and RPE cells therefore show a parallel loss during aging. However, the most notable changes in the RPE develop at the base of the cells, where there is loss of basal infoldings and deposition of patches of abnormal basement membrane material (Fig. 65.4B). (This BLD is described under “Onset and progress of age-related macular degeneration”, below.)
Bruch’s membrane
Although anatomists regard Bruch’s membrane as a five-layered structure, pathologic processes are more readily understood if one uses the definition proposed by Gass49 that excludes the basement membranes of the RPE and choriocapillaris. Bruch’s membrane can then be thought of as a sheet-like condensation of the innermost portion of the choroidal stroma that consists of an inner and outer collagenous zone separated by the elastic layer. In this way the location of drusen, RPE detachments, and sub-RPE neovascular membranes can be described more accurately than by using the all-embracing term “within Bruch’s membrane.” Also, thickening of Bruch’s membrane then refers to the collagenous layers alone, which focuses on a possible etiologic role for Bruch’s membrane in AMD, rather than on the actual manifestations of the disease mentioned above.
A linear relationship exists between the thickness of Bruch’s membrane and age, the membrane increasing in thickness from 2 µm in the first decade of life to 4.7 µm by the 10th decade.50 The debris that accumulates within the collagenous and elastic layers, which coincides with the buildup of lipofuscin in the RPE and is similarly first detected early in life on electron microscopy, takes three main forms:
1. A general increase in collagen. The 64 nm banded fibers found in increasing numbers in the collagenous layers with age are believed to be fibrillar type I collagen.51 Clumps of fibrous long-spacing collagen with band periodicity of about 120 nm are found primarily in the outer collagenous layer or embedded in the basement membrane of the choriocapillaris.52,53 Fibrous long-spacing collagen is thought to be a combination of collagen and proteoglycans or glycoprotein and may be formed by depolymerization of native collagen fibrils.52 Other components that have been identified include collagen types III, IV, and V, fibronectin, chondroitin sulfate, dermatan sulfate, and proteoglycans.51,54 A significant linear decline in solubility of Bruch’s membrane collagen occurs with age and may be due to increase in crosslinking.51
2. Rounded, coated membrane-bound bodies (Fig. 65.4B, Fig. 65.5). Since these are found as early as the second decade,55 it has been suggested that this material may result from the shedding of unwanted basal cytoplasm through the basement membrane of the RPE.56 The actual separation of the bodies from the cells appears to have been demonstrated,57 but it is such a rare finding that their derivation remains uncertain. These membrane-bound bodies then rupture, spilling their content of coated vesicles and granular material into Bruch’s membrane and, together with fragments of the coated membrane wall, the resulting debris accounts for most of the thickening of Bruch’s membrane with age.58 However, most of the debris is found in the outer collagenous zone and even on the outer side of the choroidal capillaries, suggesting that it may also be derived from the choroid.53
3. Mineralized deposits, which primarily affect the elastic lamina. The degeneration of elastin may be initiated by actinic damage.24 The corresponding histologic findings in Bruch’s membrane, which become evident in the fifth decade, comprise thickening, hyalinization, and patchy basophilia.23,25 This diffuse deposition in the collagenous zones also extends down the intercapillary pillars and can be correlated with an increase in the lipid content of Bruch’s membrane after the fourth decade.59–61 The lipids consist largely of phospholipids, triglycerides, fatty acids, and free cholesterol. There is little cholesterol ester, which would have been expected to predominate if the lipids had been derived from the bloodstream, suggesting that the source of the material is the RPE.59 However, the specific inclusions seen with electron microscopy cannot be correlated with any particular type of lipid.62
Peroxidized lipids have been identified in Bruch’s membrane, the total amount increasing exponentially with age. The peroxidized lipids identified were derived from long-chain polyunsaturated fatty acids, particularly docosahexanoic acid and linolenic acid, which are polyunsaturated fatty acids found in photoreceptor outer segments. Lipid peroxides have been shown to induce neovascularization by inducing expression of a cascade of angiogenic cytokines.63
Changes in hydraulic conductivity
Hydraulic conductivity is the measurement of the bulk flow of fluid through a test membrane in response to applied pressure. Bruch’s membrane would be expected to show increasing resistance to flow with age because it exhibits a linear increase in thickness50 and a significant accumulation of lipid after the fourth decade.61,62,64 However, studies undertaken on Bruch’s membrane have shown that the decrease in hydraulic conductivity is exponential, being greatest in the first four decades of life.65,66 It is unclear why this occurs before age 40. It has therefore been suggested that remodeling of collagen occurs as a result of increased cross-linkage, and this may cause an increase in rigidity of the membrane and reduced pore size, with entrapment of passing protein molecules.67 After age 40 the increasing lipid content would be expected to have an increasing effect on hydraulic conductivity, while in the 60s a further reduction would result from the diffuse deposits that appear beneath the RPE.
The excimer laser has been used to remove progressively ultrathin shavings of Bruch’s membrane to determine in which layer the major barrier to the flow of water lies. This demonstrated that the greatest resistance throughout life resides within the inner collagenous zone.66 Serial ultrathin sections cut parallel to the plane of Bruch’s membrane to estimate the porosity at sequential levels confirmed that the inner collagenous zone presented the lowest porosity. Calculations based on the pore radii and length further confirmed that the inner collagenous zone also had the lowest flow rate. However, ultrastructural studies would appear to indicate that it is mainly the outer collagenous zone that increases in thickness with age, with the inner collagenous zone remaining constant.58 Clearly, further studies are required, as only a limited number of younger eyes have been examined.
Choroid
A decrease in choroidal blood flow with age can be demonstrated by laser Doppler flowmetry and is mainly due to a decrease in choroidal blood volume rather than in velocity of flow.68 This is consistent with histologic changes in aged eyes. Comparing normal maculas in the first and 10th decades, the density of the choroidal capillaries (combined length of capillary lumina per unit length) decreased in a linear fashion by 45%, and the anteroposterior diameter by 34%.50
The middle layer of medium-sized vessels decreases with age, resulting in a progressive decrease in thickness of the choroid from 200 µm at birth to 80 µm by the age of 90 years.50 The resulting thinning of the choroid throws the remaining larger vessels into greater prominence, accounting for the senile tigroid fundus. This clinical appearance has generally been attributed to unmasking of the choroidal vessels by attenuation and loss of pigment from the retinal pigment cells. However, senile choroidal atrophy appears to contribute more significantly to the increased visibility of the vessels.
Onset and progress of age-related macular degeneration
Clinical features in the absence of drusen
The patient illustrated in Figs 65.3 and 65.6 shows this evolution to geographic atrophy over a 17-year time span. The first change detected was the presence of scattered, small drusen-like dots, 25–50 µm in size (Fig. 65.3B). A ring of small pigment clumps then developed around the fovea (Fig. 65.3C, D), but vision remained 20/20, demonstrating the difficulty of determining when, on the basis of visual acuity alone, pigment changes become pathologic. This is due to the fact that the foveal center is often spared for many years. Hyperpigmentation is accompanied by hypopigmentation, with geographic atrophy (Fig. 65.6) then spreading into the area of attenuated RPE (incipient atrophy).
Fig. 65.6 Same patient as in Fig. 65.3. (A and B, red-free) At age 81, patient fixing between two small areas of atrophy that have developed. Pigment clumping and drusen-like dots are spreading outward. This surrounding incipient atrophy corresponds to the area of geographic atrophy that developed subsequently (D); vision is still 20/30. (C) At age 82, atrophy involves fixation, and dots have faded. Vision has dropped to 20/200. (D) At age 84, area of atrophy has almost doubled; vision is 20/400. Choroidal atrophy causes exposed vessels to appear white. Patient died at age 85. Pathology of this eye is shown in Fig. 65.8.
(Reproduced with permission from Sarks JP, Sarks SH, Killingsworth M. Evolution of geographic atrophy of the retinal pigment epithelium. Eye 1988;2:552–77.)
Morphologic changes
The morphologic alterations (see Fig. 65.4C) considered thus far in the photoreceptors, RPE, Bruch’s membrane, and choroid are progressive throughout life. However, by the seventh decade other changes have appeared at the base of the RPE that have no counterpart in earlier life. These comprise the deposition of basement membrane-like material and shedding of membranous debris. Although these changes first develop in a patchy distribution while the fundus and vision are still normal, their diffuse occurrence is the principal feature of AMD.23,69,70
Basal laminar deposit – early form
The BLD lies beneath the RPE, between the plasma membrane and the basement membrane, in contrast to typical drusen, which lie external to the basement membrane. It can be demonstrated consistently by the seventh decade,23 but has been found even in the fifth decade.25 It first appears in a patchy distribution over thickened or basophilic segments of Bruch’s membrane, over intercapillary pillars, or over small drusen, suggesting a potential response to altered filtration at these sites. It can be quantified histologically25 as class 1 (small, solitary patches), class 2 (a thin continuous layer), and class 3 (a thick layer, at least half the height of the RPE).
Histologically the deposit exists in two different forms, early and late, according to the stage of degeneration. The early BLD is a pale-staining eosinophilic material that stains blue with picro-Mallory and shows faint anteroposterior striations (Fig. 65.7). On electron microscopy the BLD consists of three phenotypes: fibrillar, amorphous, and polymerized. The fibrillar phenotype appears to be the earliest manifestation and may only be detected by electron microscopy as irregular nodules lying on the original basement membrane. The polymerized form resembles the fibrous long-spacing collagen seen in Bruch’s membrane and is also found in the cornea, trabecular meshwork, and other tissues in the body.53 It projects internally from the original RPE basement membrane71 (Fig. 65.8) and accounts for the striations, or bush-like appearance, seen histologically.
Fig. 65.8 Electron micrograph illustrating changes developing between retinal pigment epithelium and choriocapillaris (CC) in age-related maculopathy corresponding to Fig. 65.4C. Horizontal yellow arrows indicate the basal plasma membrane of the RPE. Early-type basal laminar deposit (BLD) projects inward from the RPE basement membrane (white arrows) and comprises mainly banded material resembling fibrous long-spacing collagen. Coiled membranes with a bilayered structure of lipids lie among the clumps of BLD and appear to pass through the basement membrane to lie between it and the inner collagenous zone (ICZ), as well as filtering into the membrane itself. Identifiable structures within Bruch’s membrane include fragments of coated membrane (CM) and fibrous long-spacing collagen (FLSC) (×11 780).
(Reproduced with permission from Killingsworth MC, Sarks JP, Sarks SH. Macrophages related to Bruch’s membrane in age-related macular degeneration. Eye 1990;4:613–21.)
The similarity of the BLD to basement membrane and its proximity to rough endoplasmic reticulum at the base of the cells suggest it is a secretory product of the RPE.71,72 It reacts with antibodies against type IV collagen, heparan sulfate proteoglycans, and laminin,54,55,72,73 but the BLD is biochemically distinct from the RPE basement membrane, and a faulty, degradative process rather than enhanced synthesis may account for its accumulation in aged maculas.54,55
Membranous debris
Coiled membrane fragments continuous with the plasma membrane of the RPE appear together with the BLD, but they are not found unless BLD is also present24 (Fig. 65.8). This material has the bilayered structure of phospholipids and is not to be confused with the coated membrane-bound bodies described earlier in Bruch’s membrane. Whereas by light microscopy the BLD was regarded as the hallmark of macular degeneration, by electron microscopy it is this membranous debris that correlates more closely with the degree of degeneration. These membranes are found in three locations, as described in the following paragraphs.
Internal to the retinal pigment epithelium basement membrane
The coils appear to be extruded from the base of the cells, which have lost their infoldings, although they may alternatively result from a free-energy process in which lipid molecules are deposited by the RPE into Bruch’s membrane and coalesce. The membranes form layers and then basal mounds internal to the RPE basement membrane (Fig. 65.4C, Fig. 65.9), which may account for the drusen-like dots noted clinically (Fig. 65.3B). The membranes are not demonstrated in conventional histologic sections, since the mounds manifest only as small, unstained spaces within the BLD (Fig. 65.10). As the mounds enlarge and fuse, the RPE shows more derangement and cell dropout.
External to the RPE basement membrane (basal linear deposit 22)*
Membranes appear to pass through the basement membrane to form a layer between the basement membrane and the inner collagenous layer of Bruch’s membrane (Fig. 65.8). In this location the debris may build up into the soft drusen specific for AMD73 (see Fig. 65.26). The debris also appears to disturb the normal attachment of the RPE to Bruch’s membrane, creating a cleavage plane, and it is in this plane that RPE detachments due to blood and serous fluid lie and into which early choroidal new vessels grow.74 The membranes even appear to percolate into the collagenous zones of Bruch’s membrane.
At the apex of the retinal pigment epithelium
Morphologically similar membranous debris is also found over the apex of the RPE, lying in the subretinal space and presumably representing outer-segment material that has not been phagocytosed (Fig. 65.11).
Fig. 65.11 Same eye as in Figs 65.5 and 65.6. Section passes through the temporal margin of the area of geographic atrophy. (A) Photoreceptors become fewer and outer segments wider and stunted as they approach the edge. Vacuolated appearance under the RPE is due to disappearance of membranous debris. Collections of membranous debris can be seen on the internal (apical) surface of RPE (arrow), possibly due to failure of phagocytosis (×150). (B) Hyperpigmented edge noted clinically corresponds to a double layer of RPE, the inner layer representing necrotic hyperpigmented cells in the process of being eliminated. Late amorphous form of BLD lies internal to striated form and has a multilaminar appearance, suggesting formation in successive waves according to the level of RPE (see Fig. 65.4D). Photoreceptors disappear, and external limiting membrane terminates on BLD (methylene blue and basic fuscin; ×500).
(Reproduced with permission from Sarks JP, Sarks SH, Killingsworth M. Evolution of geographic atrophy of the retinal pigment epithelium. Eye 1988;2:552–77.)
Basal laminar deposit – late form (diffuse thickening of the internal aspect of Bruch’s membrane)
With progressive degeneration of the RPE, another form of basal laminar material appears. On light microscopy it forms a thick, hyalinized layer that stains red with picro-Mallory, similar to hyalinized Bruch’s membrane, and that is more periodic acid–Schiff-positive than the earlier, banded form. Being a later development, it forms a distinct layer on the internal surface of the earlier form (Fig. 65.4D) and may approximate the thickness of the normal RPE, occasionally displaying nodular elevations on its internal surface75 (Fig. 65.12).
On electron microscopy, the later form of the BLD has a flocculent appearance and consists mainly of amorphous material. It may be uplifted with the attenuated RPE over the membranous mounds and appears to be formed in waves according to the level of the base of the cell at the time (Fig. 65.11). It indicates the altered metabolism of a severely stressed RPE and occurs typically over regressing drusen (see Fig. 65.30).
Retinal pigment epithelium and photoreceptors
Lipofuscin and complex melanolipofuscin granules continue to accumulate in the retinal pigment cells, which enlarge and lose their regular shape. The external or basal surface of the cell shows loss of the basal infoldings (with a consequent reduction in surface area) and becomes increasingly separated from its basement membrane by thickening of the BLD and more membranous debris. Occasional cells undergo lipoidal degeneration.76 Finally the hyperpigmented cells resulting from this phagocytic overload round off, so only a few stubby apical microvilli remain, and they lose their ability to phagocytose. Lipofuscin is packed into large degenerate retinal pigment cells or membrane-bound bodies and shed (Fig. 65.4D).
The corresponding pigment abnormalities in the fundus may be classified11 as increased pigmentation (or hyperpigmentation) and depigmentation (or hypopigmentation). Focal hyperpigmentation correlates histologically with localized areas of RPE cell hypertrophy, which may be accompanied by clumps of hyperpigmented cells in the sub-RPE space, in the subretinal space (see Fig. 65.10), and even migrating to the outer nuclear layer. With the advent of spectral domain (SD) ocular coherence tomography (OCT)77 and ultrahigh resolution (UHR) OCT,78,79 deposits have been demonstrated, in vivo, with moderate to intense hyperreflectivity in these various planes and correspond to hyperpigmentation on clinical examination or on fundus photographs. It is common for eyes with drusen to have these intraretinal deposits directly above the drusen, and although the outer nuclear layer is more common, some migration has even occurred into more anterior retinal layers.79 Focal hypopigmentation correlates with attenuated, depigmented RPE cells surrounding the hyperpigmented cells.75 A careful review of SD OCT images in areas of hypopigmentation show attenuated signal from the RPE layer.
The sequence of events leading to pigment disturbance and, ultimately, atrophy seems to be the same irrespective of the cause. When a retinal pigment cell dies, the products are phagocytosed by its neighbors. These cells in turn become filled with lipofuscin and round off, losing their ability to phagocytose. As the cells are discarded, the nearby cells migrate and increase in surface area in an attempt to maintain the integrity of the blood–retinal barrier. This results in thinned, hypopigmented cells adjacent to focal hyperpigmentation. Finally, these cells can no longer stretch to fill the gap and atrophy results. Hyperpigmentation therefore precedes hypopigmentation, and this in turn is the prelude to the development of patches of atrophy.80
Progressive derangement of the RPE is accompanied by dropout of photoreceptors, with a reduction in the number of nuclei in the outer nuclear layer. The inner segments tend to become shorter and more bulbous. The outer segments may terminate in collections of membranes over the apical surface of the RPE (Fig. 65.11).
Bruch’s membrane and choroid
Macrophages, giant cells, fibroblasts, and occasional lymphocytes are found in relation to the outer surface of Bruch’s membrane in the space formerly occupied by the choroidal capillaries.81 Segments of the membrane begin to thin, and cell processes are occasionally observed splitting off and even enveloping small fragments of the membrane.71 The choroidal capillaries in the vicinity may show signs of activation, and new vessels still confined entirely to the choroid have been identified.82 This chronic, low-grade inflammatory reaction, which possibly develops in response to the membranous debris liberated by degenerating RPE, is often found in the choroid near breaks in Bruch’s membrane,83 and it appears to be a link in the chain of events leading to CNV. As such mechanisms that decrease inflammation are actively being investigated as a means of altering both the atrophic and neovascular pathways of advanced AMD.
Drusen
Clinical grading
Drusen size
Clinically, drusen size can be compared to the width of a major vein at the disc edge (approximately 125 µm). Small drusen are those less than 0.5 vein width (<63 µm), and since size and morphology are generally correlated, these are considered to be hard.12,18 Drusen ≥125 µm (Fig. 65.2, circle C1) are large, and these are typically considered to be soft based on the appearance of their perimeter. Drusen between ≥63 µm and <125 µm may be termed medium or intermediate in size and are more frequently classified as soft drusen as well.
Extent of fundus involvement
This may be assessed by noting drusen number, the area of fundus involved,20,84 and the density of drusen (discrete, touching, or confluent). The area occupied by drusen yields important prognostic significance as it is a cornerstone in the Age-Related Eye Disease Study (AREDS) severity scale. Drusen area is identified by mentally condensing all drusen located in the zone of interest into a single area and estimating the size of that area by comparison to standard grid areas measured in disc area (DA) equivalents.84 Automated detection of total drusen area on digital fundus images remains under development and may eventually replace, partially or in full, grading by trained readers.
Drusen distribution
Detailed natural history studies have focused on the drusen characteristics for drusen that are located within 1 or 2 disc diameters of the foveal center (see Fig. 65.1).12,84–88 Different patterns of drusen distribution have been reported,15 and it is the superior and temporal quadrants that have been associated with greatest area of drusen involvement and highest prevalence of soft, indistinct drusen or reticular drusen.
Drusen symmetry
Comparisons of the distribution, number, and type of drusen between the two eyes of an individual tend to show a remarkable symmetry, which often leads to similar outcomes in both eyes.15,17,25,89 The drusen type which are most commonly present in both eyes of an individual are reticular drusen and soft, indistinct drusen.17
Clinical grading of AMD severity
Despite their apparently significant role in the evolution of AMD, diffuse deposits detected on histopathology are difficult to study clinically. However, prognostic significance is ascribed to the clinical presence of drusen, the white-to-yellow clinically apparent deposits described above that lie deep to the retina, representing accumulation of the materials described in the preceding sections of this chapter. While it was previously recognized that patients with at least medium-size, soft, or confluent drusen are predisposed to develop advanced stages of AMD,19,87 more recent natural history data from the AREDS has suggested a somewhat more detailed description of non-neovascular AMD to characterize prognosis. In addition, this terminology is also relevant to the management of non-neovascular AMD.13 In this classification features are evaluated within 3000 µm of the center of the macula (Fig. 65.1) and eyes can be classified into one of four groups:
Group 1: An eye is graded as no AMD if there are no drusen or only a few (~5–15) small drusen in the absence of any other stage of AMD.
Group 2: An eye is considered to have early stage AMD if there are extensive (>15) small drusen, or a few (approximately <20) medium-size indistinct drusen (soft borders) or pigment abnormalities (increased pigmentation or depigmentation but not geographic atrophy) and no other stage of AMD.
Group 3: The intermediate stage of AMD refers to the presence of at least one large druse, but can also be applied to the eye with numerous medium-size drusen (approximately 20 or more when the drusen boundaries are amorphous and approximately 65 or more when the drusen boundaries are distinct, sharp or hard) or to the presence of geographic atrophy that does not extend under the center of the macula (noncentral GA).
Group 4: The advanced stage of AMD is reserved for the presence of geographic atrophy extending under the center of the macula or presence of neovascular AMD.
In addition to providing this simplified classification of AMD (no AMD, early AMD, intermediate AMD, and advanced AMD), the AREDS investigators also devised a simplified clinical scale defining risk categories for development of advanced AMD.88 A scoring system tabulates a person score by assigning 1 risk factor to each eye of an individual for the presence of at least 1 large druse and 1 risk factor for the presence of any pigment abnormality. Drusen are to be scored only within 2 disc diameters of the foveal center, and pigment abnormalities consist of either increased pigment thought to be attributed to AMD, RPE depigmentation, or areas of noncentral geographic atrophy. Risk factors are summed across both eyes, resulting in a 5-step scale (0–4) on which the 5-year risk of developing advanced AMD in at least one eye can be approximated. Risk of progression escalates as follows: total score 0, 0.5% risk; 1 factor, 3%; 2 factors, 12%; 3 factors, 25%, and 4 factors, 50%. Modifications of the scale award persons without any large drusen 1 risk factor if medium-size drusen are present in both eyes and individuals with advanced AMD in their first eye receive a score of 2 for that eye when tabulating the person score to estimate the risk for their fellow eye.
Grading in scientific studies
While the grading of drusen described above is relevant to management and relatively easy to apply in clinical practice, a means of more specific grading of drusen for scientific studies is desirable, ideally without requiring fluorescein angiography. The system proposed by the International Epidemiology Study Group,11 which is based on stereoscopic color fundus photographs, grades for the predominant drusen type, the most severe drusen type, drusen numbers, largest drusen size, area involved by drusen, drusen confluence, and drusen disappearance (see Fig 65.1, 65.2).
A more recent detailed fundus photographic severity scale to be used in research settings has been presented by the AREDS investigators.84 Baseline photographs and annual photographs beginning at year 2 of follow-up from AREDS participants were graded for drusen characteristics (size, type, area), pigmentary abnormalities (increased pigment, depigmentation, geographic atrophy) and presence of abnormalities consistent with neovascular AMD. Relationships between various baseline characteristics and development of advanced AMD at the 5-year exam were explored to develop a 9-step severity scale that sorts the 5-year risk of advanced AMD from less than 1% in step 1 to about 50% in step 9. About half the eyes that had at least a 3-step progression between baseline and the 5 year exam showed stepwise progression through intervening severity levels at intervening visits. The second Age-Related Eye Disease Study (AREDS2), which is presently underway, aims to validate this scale in a separate cohort of patients at high risk for AMD progression. If validated, progression along this scale may be considered as a surrogate outcome for progression to advanced AMD in future studies.
Imaging of drusen
Fluorescence of drusen
Drusen have a variety of constituents that range from being hydrophobic to those that are hydrophilic. Fluorescein is a hydrophilic dye, which diffuses into hydrophilic areas. As such, some drusen routinely bind the dye and hyperfluoresce in late stage angiography. About 50% of drusen present within an eye will stain with fluorescein.90 Although drusen that stain with fluorescein appear across the spectrum of drusen sizes, drusen that stain are, on average, larger than drusen that do not stain. When considering fluorescein-stained drusen, drusen area appears similar to that which is appreciated on color photographs.
During indocyanine green angiography, hard drusen become hyperfluorescent 2–3 minutes after dye administration, and this persists through the middle and late phases. Soft drusen are either hypofluorescent (darker than the background fluorescence) throughout the angiogram with a thin hyperfluorescent rim or remain isofluorescent (indistinguishable from background fluorescence).91,92
Autofluorescence
On autofluorescence imaging, large drusen may or may not be apparent depending upon the alterations in the RPE overlying the druse.64 There may be a pattern of decreased autofluorescence in the center of the druse often surrounded by a ring of subtle increased autofluorescence.93
[/not-level-membership-for-opthalmology-category]
