Chapter 6 Advanced Mapping and Navigation Modalities
ENSITE NONCONTACT MAPPING SYSTEM,
CARTO ELECTROANATOMICAL MAPPING SYSTEM,
ENSITE NAVX NAVIGATION SYSTEM,
STEREOTAXIS MAGNETIC NAVIGATION SYSTEM,
SENSEI ROBOTIC NAVIGATION SYSTEM,
BODY SURFACE POTENTIAL MAPPING,
INTRACARDIAC ECHOCARDIOGRAPHY,
COMPUTED TOMOGRAPHY AND MAGNETIC RESONANCE IMAGING,
Basket Catheter Mapping
Fundamental Concepts
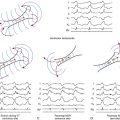
The basket catheter consists of an open-lumen catheter shaft with a collapsible, basket-shaped, distal end. Currently, baskets are composed of 64 platinum-iridium ring electrodes mounted on eight equidistant, flexible, self-expanding nitinol splines (metallic arms; see Fig. 4-4). Each spline contains eight 1.5-mm electrodes equally spaced at 4 or 5 mm apart, depending on the size of the basket catheter used. Each spline is identified by a letter (from A to H) and each electrode by a number (distal 1 to proximal 8). The basket catheter is constructed of a superelastic material to allow passive deployment of the array catheter and optimize endocardial contact. The size of the basket catheter used depends on the dimensions of the chamber to be mapped, and it requires antecedent evaluation (usually by echocardiogram) to ensure proper size selection.
The Astronomer is used for navigation with the ablation-mapping catheter inside the basket catheter. This system consists of a switching-locating device and a laptop computer with proprietary software. The device and the laptop communicate on a standard RS-232 interface. The device delivers AC current (32 kHz, 320 mA) between the ablation catheter tip electrode and a reference electrode (skin patch), and the resulting electrical potentials are sensed at each basket catheter electrode. On the basis of the sensed voltages at each of the basket catheter electrodes, the Astronomer device determines whether the roving electrode is in close proximity to a basket catheter electrode and lights the corresponding electrodes on a representation of the basket catheter displayed on the laptop.
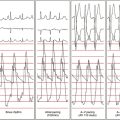
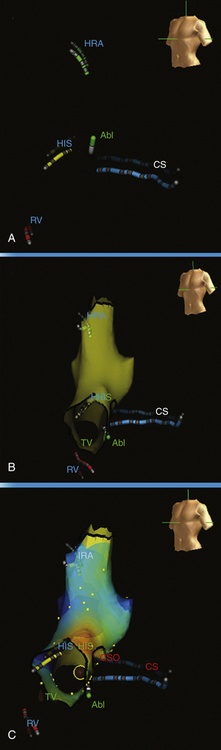
The mapping system consists of an acquisition module connected to a computer, which is capable of simultaneously processing bipolar electrograms from the basket catheter, 16 bipolar-unipolar electrogram signals, a 12-lead ECG, and a pressure signal. Color-coded activation maps are reconstructed on-line. The color-coded animation images simplify the analysis of multielectrode recordings and help establish the relation between activation patterns and anatomical structures (Fig. 6-1). The electrograms and activation maps are displayed on a computer monitor, and the acquired signals can be stored on optical disk for off-line analysis. Activation marks are generated automatically with a peak or slope (dV/dt) algorithm, and activation times are then edited manually as needed.
Mapping Procedure
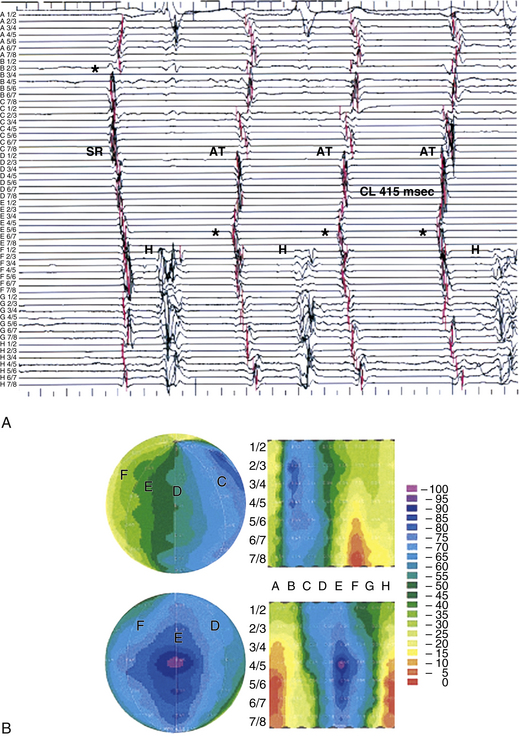
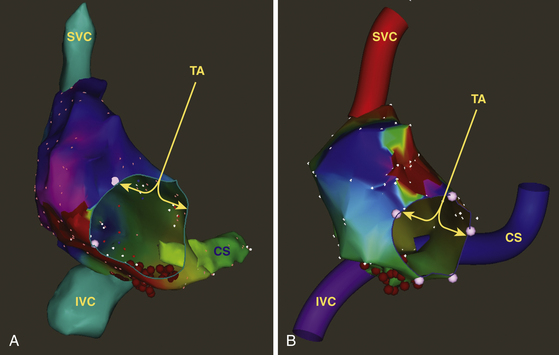
The size of the cardiac chamber of interest is initially evaluated, usually with echocardiography, to help select the appropriate size of the basket catheter. The collapsed basket catheter is advanced under fluoroscopic guidance through a long sheath into the chamber of interest; the catheter is then expanded (Fig. 6-2). Electrical-anatomical relations are determined by fluoroscopically identifiable markers (spline A has one marker and spline B has two markers located near the shaft of the basket catheter) and by the electrical signals recorded from certain electrodes (e.g., ventricular, atrial, or His bundle electrograms), which can help identify the location of those particular splines.
From the 64 electrodes, 64 unipolar signals and 32 to 56 bipolar signals can be recorded (by combining electrodes 1-2, 3-4, 5-6, 7-8, or 1-2, 2-3 until 7-8 electrodes are on each spline). Color-coded activation maps can be reconstructed (see Fig. 6-1). The concepts of activation mapping discussed earlier are then used to determine the site of origin of the tachycardia.
The Astronomer navigation system permits precise and reproducible guidance of the ablation catheter tip electrode to targets identified by the basket catheter. Without the use of this navigation system, it is often difficult to identify the alphabetical order of the splines by fluoroscopic guidance.
Limitations
High-Density Mapping Catheter
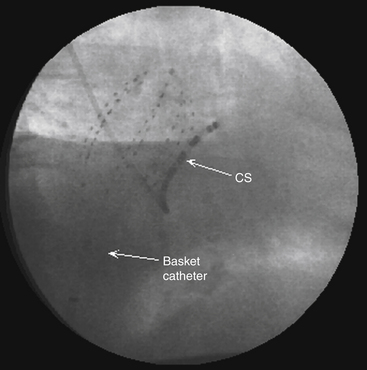
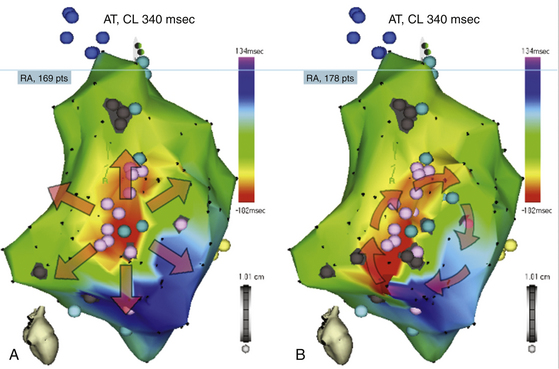
One study evaluated a mapping approach for AT that uses a novel high-density multielectrode mapping catheter (PentaRay, Biosense Webster, Inc., Diamond Bar, Calif.).1 This 7 Fr steerable catheter (180 degrees of unidirectional flexion) has 20 electrodes distributed over 5 soft, radiating spines (1-mm electrodes separated by 4-4-4 or 2-6-2 mm interelectrode spacing), thus allowing splaying of the catheter to cover a surface diameter of 3.5 cm. The spines have been given alphabetical nomenclature (A to E), and spines A and B are recognized by radiopaque markers (Fig. 6-3).1
Localization of the atrial focus can be performed during tachycardia or atrial ectopy.1 Guided by the ECG appearance, the catheter is sequentially applied to the endocardial surface in various atrial regions to allow rapid activation mapping. By identifying the earliest site of activation around the circumference of the high-density catheter, vector mapping is performed, moving the catheter and applying it to the endocardium in the direction of earliest activation (outer bipoles) to identify the tachycardia origin and bracket activation (i.e., demonstrating later activation in all surrounding regions).
The high-density mapping catheter can offer several potential advantages.1 In contrast to the basket catheter, which provides a global density of mapping but limited localized resolution, the high-density mapping catheter allows splaying of the spines against the endocardial surface to achieve high-density contact mapping and better localized resolution.1
EnSite Noncontact Mapping System
Fundamental Concepts
The noncontact mapping system (EnSite 3000, St. Jude Medical, Inc., St. Paul, Minn.) consists of a catheter-mounted multielectrode array (MEA), which serves as the probe, a custom-designed amplifier system, a computer workstation used to display 3-D maps of cardiac electrical activity, and a conventional ablation catheter.2,3
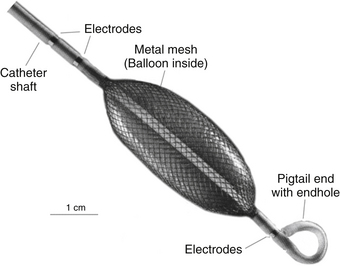
The MEA catheter consists of a 7.5-mL ellipsoid balloon mounted on a 9 Fr catheter around which is woven a braid of 64 insulated 0.003-mm-diameter wires (Fig. 6-4). Each wire has a 0.025-mm break in insulation that serves as a noncontact unipolar electrode.3 The system acquires more than 3000 noncontact unipolar electrograms from all points in the chamber simultaneously. The unipolar signals are recorded using a ring electrode located on the shaft of the array catheter as a reference. The raw far-field EP data acquired by the array catheter are fed into a multichannel recorder and amplifier system that also has 16 channels for conventional contact catheters, 12 channels for the surface ECG, and pressure channels. Using data from the 64-electrode array catheter suspended in the heart chamber, the computer uses sophisticated algorithms to compute an inverse solution to determine the activation sequence on the endocardial surface.
The EnSite 3000 mapping system is based on the premise that endocardial activation creates a chamber voltage field that obeys the Laplace’s equation. Therefore, when one 3-D surface of known geometry is placed within another of known geometry, if the electrical potential on one surface is known, the potential on the other can be calculated.3 Because the geometry of the balloon catheter is known, and the geometry of the cardiac chamber can be reconstructed during the procedure (see later), endocardial surface potential can then be determined once the potentials over the balloon catheter are recorded. Using this concept, the raw far-field EP data acquired by the array catheter, which are generally lower in amplitude and frequency than the source potential of the endocardium itself and therefore have limited usefulness, are mathematically enhanced and resolved. The solution to the inverse Laplace’s equation using the boundary element method predicts how a remotely detected signal by the MEA would have appeared at its source, the endocardial surface, so that electrograms are reconstructed at endocardial sites in the absence of physical electrode contact at those locations (virtual electrograms). Once the potential field has been established, more than 3000 activation points can be displayed as computed electrograms or as isopotential maps. The activation time at each endocardial site is determined by taking the time instant with maximum negative time derivative (−dV/dt) on the electrogram.
The system can locate any conventional mapping-ablation catheter in space with respect to the array catheter (and thus with respect to the cardiac chamber being mapped).3 A low-current (5.68 kHz) locator signal is passed between the contact catheter electrode being located and reference electrodes on the noncontact MEA. This creates a potential gradient across the array electrodes, which is then used to position the source. This locator system is also used to construct the 3-D computer model of the endocardium (virtual endocardium) that is required for the reconstruction of endocardial electrograms and isopotential maps. This model is acquired by moving a conventional contact catheter around the endocardial surface of the cardiac chamber; the system collects the location information, thus building up a series of coordinates for the endocardium and generating a patient-specific, anatomically contoured model of its geometry. During geometry creation, only the most distant points visited by the roving catheter are recorded to ignore those detected when the catheter is not in contact with the endocardial wall.
Using mathematical techniques to process potentials recorded from the array, the system is able to reconstruct more than 3000 unipolar electrograms simultaneously and superimpose them onto the virtual endocardium, thus producing isopotential maps with a color range representing voltage amplitudes. Additionally, the locator signal can be used to display and track the position of any catheter on the endocardial model (virtual endocardium) and allows marking of anatomical locations identified using fluoroscopy and electrographic characteristics. During catheter ablation procedures, the locator system is used in real time to navigate the ablation catheter to sites of interest identified from the isopotential color maps, catalog the position of RF energy applications on the virtual endocardium, and facilitate revisitation of sites of interest by the ablation catheter.2
In addition, the most recent version of the EnSite software provides the capability of point-to-point contact mapping, to allow the creation of activation and voltage maps by acquiring serial contact electrograms and displaying them on the virtual endocardium (see later). This is useful for adding detail, familiarity, and validation of the information obtained by the noncontact method.4
Mapping Procedure
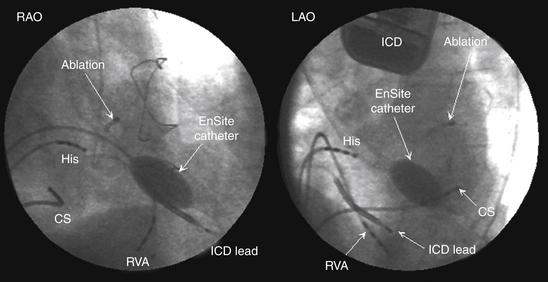
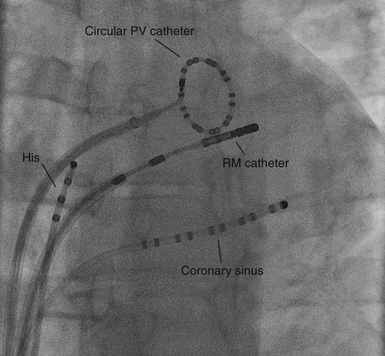
The EnSite 3000 system requires placing a 9 Fr MEA and a mapping-ablation catheter.3 To create a map, the balloon catheter is advanced over a 0.035-inch guidewire under fluoroscopic guidance into the cardiac chamber of interest. For RA arrhythmias, the guidewire is advanced into the SVC and the balloon is deployed in the upper third of the RA for tachycardia originating in the SVC, in the middle third for ectopic AT, and in the lower third for typical AFL. For LA arrhythmias, the guidewire is advanced into the left superior PV, and the balloon is deployed in the middle of the LA. For right ventricular (RV) arrhythmias, the guidewire is advanced into the pulmonary artery, and the balloon is deployed close to the RV outflow tract (RVOT) or in the middle of the RV. The balloon can be filled with contrast dye, thus permitting it to be visualized fluoroscopically (Fig. 6-5). The balloon is positioned in the center of the cardiac chamber of interest and does not come in contact with the walls of the chamber being mapped. In addition, the position of the array in the chamber must be secured to avoid significant movement that would invalidate the electrical and anatomical information. The array must be positioned as closely as possible (and in direct line of sight through the blood pool) to the endocardial surface being mapped, because the accuracy of the map is sensitive to the distance between the center of the balloon and the endocardium being mapped.2,4,5
A conventional (roving) deflectable mapping catheter is also positioned in the chamber being mapped and used to collect geometry information. The mapping catheter is initially moved to known anatomical locations, which are tagged. A detailed geometry of the chamber is then reconstructed by moving the mapping catheter and tracing the contour of the endocardium (using the locator technology). To create detailed geometry, attempts must be made to make contact with as much endocardium as possible. This requires maneuvering on all sides of the array, which can be challenging and can require decreasing the profile of the balloon by withdrawing a few milliliters of fluid. This results in the rapid formation of a relatively accurate 3-D geometric model of the cardiac chamber. Creation of chamber geometry can be performed during sinus rhythm or tachycardia.2,4
Once the chamber geometry has been delineated, tachycardia is induced and mapping is started. The data acquisition process is performed automatically by the system, and all data for the entire chamber are acquired simultaneously. Following this, the segment must be analyzed by the operator to find the early activation during the tachycardia (Fig. 6-6).
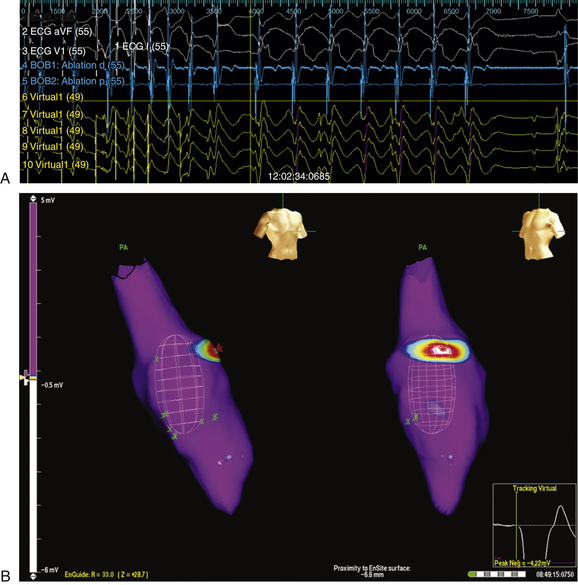
The noncontact mapping system is capable of simultaneously reconstructing more than 3360 unipolar electrograms over the virtual endocardium. From these electrograms, isopotential or isochronal maps can be reconstructed (see Fig. 6-6). Because of the high density of data, color-coded isopotential maps are used to depict graphically regions that are depolarized, and wavefront propagation is displayed as a user-controlled 3-D “movie” (Videos 8 and 9  ). The color range represents voltage or timing of onset. The highest chamber voltage is at the site of origin of the electrical impulse. Although the electrode closest to the origin of the impulse is influenced the most, all the electrodes on the array catheter are influenced, the degree of influence diminishing with the distance between the electrode and each endocardial point.
In addition, the system can simultaneously display as many as 32 electrograms as waveforms (see Fig. 6-6). Unipolar or bipolar electrograms (virtual electrograms) can be selected at any given interval of the tachycardia cycle by using the mouse from any part of the created geometry and displayed as waveforms as if from point, array, or plaque electrodes. The reconstructed electrograms are subject to the same electrical principles as contact catheter electrograms, because they contain far-field electrical information from the surrounding endocardium, as well as the underlying myocardium signal vector, and distance from measurement may affect the contribution to the electrogram. These selected unipolar waveforms are used to augment information obtained from the 3-D map by demonstrating the slope of depolarization, the presence of double potentials or fractionation, and differentiation of far-field signals from more relevant endocardial activation.4
In the unipolar electrogram, signals associated with high conduction velocity (e.g., the His-Purkinje system) possess a greater slope (–dV/dt), and thus are characterized by high-frequency spectral components (more than 32 Hz). Electrograms recorded in normally conducting atrial or ventricular myocardium possess spectral components in the midrange from 4 Hz to 16 Hz, whereas electrograms in regions of slow conduction are composed of lower frequency spectral components from 1 Hz to 4 Hz. Thus, the high-pass filter must be adjusted between 1 Hz and 32 Hz, helping to modulate the extent to which low-frequency signals are visible on the 3-D display. Identification of true local activation and its differentiation from the far-field signals are essential to successful utilization of noncontact mapping. The true local activation always shows advancement of isopotential lines, but far-field signals would show retraction of isopotential lines on the 3-D display when the whole electrograms are traced.5
Substrate mapping based on scar or diseased tissue has been introduced to the noncontact mapping technology. High-density voltage mapping of the atrial substrate is performed using the peak negative voltage of the reconstructed unipolar electrograms. Areas with slow conduction are identified along the reentrant circuit of the atypical AFL. An atrial substrate characterized by an abnormally low peak negative voltage can potentially predict areas with slow conduction during macroreentrant tachycardias, which would provide a substrate for reentry.6
Clinical Implications
The biggest advantage of noncontact endocardial mapping is its ability to recreate the endocardial activation sequence from simultaneously acquired multiple data points over a few (theoretically one) tachycardia beats, without requiring sequential point-to-point acquisitions, thus obviating the need for prolonged tachycardia episodes that the patient might tolerate poorly. This technique can be used to map nonsustained arrhythmias, premature atrial complexes (PACs), premature ventricular complexes (PVCs), and irregular rhythms such as AF or polymorphic VT, and rhythms that are not hemodynamically stable, such as very rapid VT (see Fig. 6-6). The system generates isopotential maps of the endocardial surface at successive cross sections of time, and when these are animated, the spread of the depolarization wave can be visualized. These maps are particularly useful for identifying rapid breakthrough points and slowly conducting macroreentrant pathways, such as the critical slow pathways in ischemic VT or reentrant AT in patients with surgically corrected congenital heart disease. In macroreentrant tachycardias such as typical AFL or VT, the reentry circuit can be fully identifiable, along with other aspects, such as the slowing, narrowing, and splitting of activation wavefronts in the isthmus. The system can also map multiple cardiac cycles in real time, a method that discloses changes in the activation sequence from one beat to the next. Because mapping data are acquired without direct contact of conventional electrode catheters with the endocardium, the use of noncontact mapping can help avoid the mechanical induction of ectopic activity that is frequently seen during conventional mapping. An additional advantage of this system is that any catheter from any manufacturer can be used in conjunction with this mapping platform. Other useful features include radiation-free catheter navigation, revisitation of points of interest, and cataloging ablation points on the 3-D model.2
In complex substrate-related arrhythmias, the use of activation mapping alone may not be sufficient for rhythm analysis or identifying ablation targets. Substrate mapping based on scar or diseased tissue is of value in these cases. Although substrate mapping used to be relatively limited with the noncontact mapping technology (very low-amplitude signals may not be detected, particularly if the distance between the center of the balloon catheter and endocardial surface exceeds 40 mm), dynamic substrate mapping, which has been introduced, allows the creation of voltage maps from a single cardiac cycle (in contrast to the contact mapping system, in which the mapping catheter is moved point to point over the endocardial surface). Dynamic substrate mapping also provides the capability of identifying low-voltage areas, as well as fixed and functional block, on the virtual endocardium through noncontact methods, provided that points more than 40 mm from the electrode array are excluded from analysis. Combining substrate mapping with the ability of the noncontact system to assess activation over a broad area from a single beat may facilitate ablation of hemodynamically unstable or nonsustained macroreentrant tachycardias.4,6,7
Limitations
Because the geometry of the cardiac chamber is contoured at the beginning of the study during sinus rhythm, changes of the chamber size and contraction pattern during tachycardia or administration of medications (e.g., isoproterenol) can adversely affect the accuracy of the location of the endocardial electrograms. Moreover, because isopotential maps are predominantly used, ventricular repolarization must be distinguished from atrial depolarization and diastolic activity. Early diastole can be challenging to map during VT.8
Sometimes it is difficult to manipulate the ablation catheter around the outside of the balloon, especially during mapping in the LA. Special attention and care also are necessary during placement of the large balloon electrode in a relatively small cardiac chamber. Another disadvantage is that the balloon catheter cannot be moved after completion of geometry creation because it will change the activation localization and result in distortion of isopotential maps.5
CARTO Electroanatomical Mapping System
Fundamental Concepts
CARTO is a nonfluoroscopic mapping system that uses a special catheter to generate 3-D electroanatomical maps of the heart chambers. This system uses magnetic technology to determine the location and orientation of the mapping-ablation catheter accurately while simultaneously recording local electrograms from the catheter tip. By sampling electrical and spatial information from different endocardial sites, the 3-D geometry of the mapped chamber is reconstructed in real time and analyzed to assess the mechanism of arrhythmia and the appropriate site for ablation.2
Electroanatomical mapping is based on the premise that a metal coil generates an electrical current when it is placed in a magnetic field. The magnitude of the current depends on the strength of the magnetic field and the orientation of the coil in it. The CARTO mapping system uses a triangulation algorithm similar to that used by a global positioning system (GPS). The magnetic field emitter, mounted under the operating table, consists of three coils that generate a low-intensity magnetic field, approximately 0.05 to 0.2 gauss, which is a very small fraction of the magnetic field intensity inside a magnetic resonance imaging (MRI) machine (Fig. 6-7).
The sensor embedded proximal to the tip of a specialized mapping catheter detects the intensity of the magnetic field generated by each coil and allows for determination of its distance from each coil. These distances determine the area of theoretical spheres around each coil, and the intersection of these three spheres determines the location of the tip of the catheter. The accuracy of determination of the location is highest in the center of the magnetic field; therefore, it is important to position the location pad under the patient’s chest. In addition to the x, y, and z coordinates of the catheter tip, the CARTO system can determine three orientation determinants—roll, yaw, and pitch—for the electrode at the catheter tip. The position and orientation of the catheter tip can be seen on the screen and monitored in real time as the catheter moves within the electroanatomical model of the chamber mapped. The catheter icon has four color bars (green, red, yellow, and blue), enabling the operator to view the catheter as it turns clockwise or counterclockwise. In addition, because the catheter always deflects in the same direction, each catheter will always deflect toward a single color. Hence, to deflect the catheter to a specific wall, the operator should first turn the catheter so that this color faces the desired wall.2
The unipolar and bipolar electrograms recorded by the mapping catheter at each endocardial site are archived within that positional context. Using this approach, local tissue activation at each successive recording site produces activation maps within the framework of the acquired surrogate geometry.
Electrical Reference
The electrical reference is the fiducial marker on which the entire mapping procedure is based. The timing of the fiducial point is used to determine the activation timing in the mapping catheter in relation to the acquired points and to ensure collection of data during the same part of the cardiac cycle. It is therefore vital to the performance of the system. All the local activation timing information recorded by the mapping catheter at different anatomical locations during mapping (displayed on the completed 3-D map) is relative to this fiducial point, with the acquisition gated so that each point is acquired during the same part of the cardiac electrical signal (Video 10  ). It is important that the rhythm being mapped is monomorphic and the fiducial point is reproducible at each sampled site. The fiducial point is defined by the user by assigning a reference channel and an annotation criterion. The system has a great deal of flexibility in terms of choosing the reference electrogram and gating locations. Any surface ECG lead or intracardiac electrogram in bipolar or unipolar mode can serve as a reference electrogram. For the purpose of stability when intracardiac electrograms are selected, coronary sinus (CS) electrograms are usually chosen for mapping supraventricular rhythms, and an RV electrode or a surface ECG lead is commonly chosen as the electrical reference during mapping ventricular rhythms. Care must be taken to ensure that automatic sensing of the reference is reproducible and is not subject to oversensing in the case of annular electrograms (e.g., oversensing of a ventricular electrogram on the CS reference electrode during mapping an atrial rhythm). Any component of the reference electrogram may be chosen for a timing reference, including maximum (peak positive) deflection, minimum (peak negative) deflection, maximum upslope (dV/dt), or maximum downslope.9,10
Window of Interest
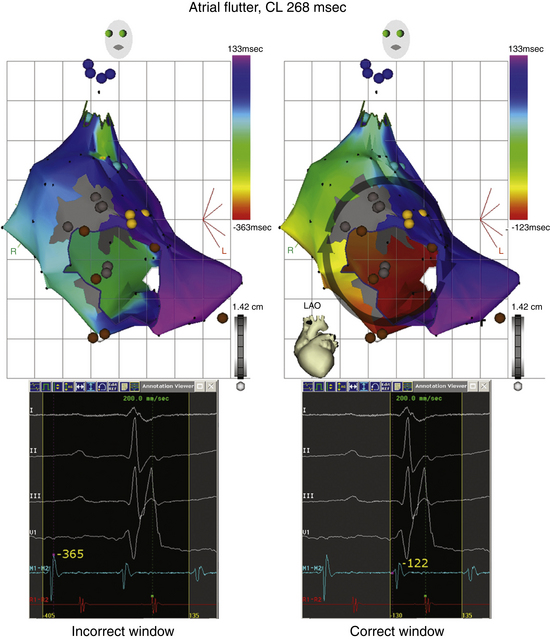
Defining an electrical window of interest is a crucial aspect in ensuring the accuracy of the initial map coordinates. The window of interest is defined as the time interval relative to the fiducial point during which the local activation time is determined (Fig. 6-8). Within this window, activation is considered early or late relative to the reference. The total length of the window of interest should not exceed the tachycardia cycle length (CL; usually 90% of the tachycardia CL; Videos 11 and 12  ). The boundaries are set relative to the reference electrogram. Thus, the window is defined by two intervals, one extending before the reference electrogram and the other after it. For macroreentrant circuits, the sensing window should approximate the tachycardia CL, and designating activation times in a circuit as early or late is arbitrary. In theory, a change in the window or reference would not change a macroreentrant circuit but only result in a phase shift of the map. If the activation window spans two adjacent beats of an arrhythmia, the resulting map can be ambiguous, lack coherency, and give rise to a spurious pattern of adjacent regions of early and late activation (see Fig. 6-8).9,10
Local Activation Time
Another important concept in CARTO mapping is determination of the local activation time. Once the reference electrogram, anatomical reference, and window of interest have been chosen, the mapping catheter is moved from point to point along the endocardial surface of the cardiac chamber being mapped (Fig. 6-9; see Video 10  ). These points can be acquired in a unipolar or bipolar configuration. These electrograms are analyzed using the principles of activation mapping discussed in Chapter 5. The local activation time at each sampled site is calculated as the time interval between the fiducial point on the reference electrogram and the corresponding local activation determined from the unipolar or bipolar local electrogram recorded from that site.2
CARTOMerge
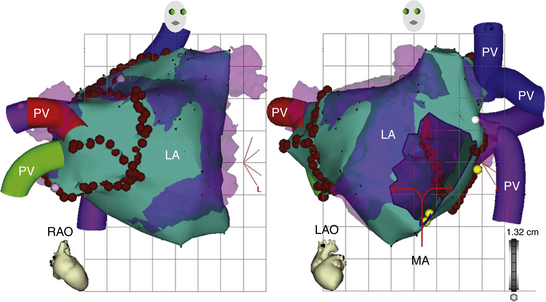
The CARTOMerge Module (Biosense Webster, Inc.) allows for images from a preacquired computed tomography (CT) angiogram or MRI scan to be integrated on the electroanatomical image of the cardiac chamber created with the CARTO system (Fig. 6-10).11 CARTOMerge helps to guide real-time catheter ablation by using the detailed cardiac chamber anatomy acquired from the CT/MRI (see later discussion). These images have also been used in AF catheter ablation procedures to identify correctly the anatomy and location of the PVs, as well as other structures such as the esophagus (Video 13)  .
.
CARTOSound
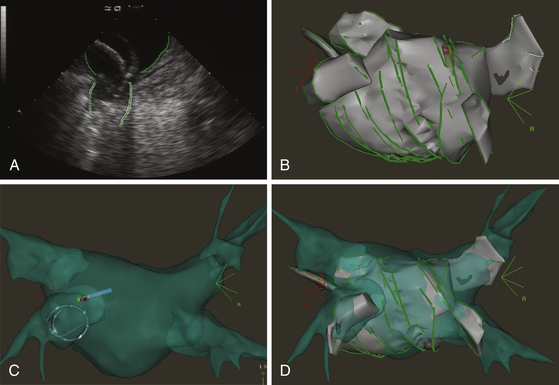
The CARTOSound Image Integration Module (Biosense Webster, Inc.) incorporates the electroanatomical map to a map derived from intracardiac echocardiography (ICE) and allows for 3-D reconstruction of the cardiac chambers using real-time ICE. Echocardiographic imaging is performed using a 10 Fr phased-array transducer catheter incorporating a navigation sensor (SoundStar, Biosense Webster, Inc.) that records individual 90-degree sector image planes of the cardiac chamber of interest, including their location and orientation, to the CARTO workspace. A 3-D volume-rendered image is created by obtaining ECG-gated ICE images of the endocardial surface of the cardiac chamber of interest (Fig. 6-11). Following optimizing each image by adjusting frequency (5 to 10 MHz) and contrast, the chamber endocardial surfaces are identified (based on differences in the echo intensity of blood and tissue), and their contours are traced automatically, and overwritten by hand as necessary, using the CARTOSound software. The software then resolves each contour into a series of discrete spatial points, with an interpoint spacing of up to 3 millimeters (closer spacing on curved contours or at angulations). The CARTO software interpolates these points to create models of the chamber endocardial surface in the CARTO workspace. CARTOSound allows for detailed real-time visualization of the cardiac chamber and of its adjacent structures and elimination of chamber deformity, which often happens with contact mapping (Video 14  ). The CARTOSound volume map of the cardiac chamber may be used as a stand-alone tool to guide navigation and ablation or as a facilitator of CT/MRI image integration (see later).12,13
CARTO 3
Mapping is performed in two steps. Initially, the magnetic mapping permits precise localization of the catheter with the sensor. This is associated with the current ratio of the electrode closest to the sensor. As the catheter with the sensor moves around a chamber, multiple locations are created and stored by the system. The system integrates the current-based points with their respective magnetic locations, resulting in a calibrated current-based field that permits accurate visualization of catheters and their locations. Each electrode emits a unique frequency that provides clear distinction of the electrodes, especially when they are close to each other. Fast Anatomical Mapping is a feature that permits rapid creation of anatomical maps by movement of a sensor-based catheter throughout the cardiac chamber. Unlike point-by-point electroanatomical mapping, volume data can be collected with Fast Anatomical Mapping (Fig. 6-12; Video 15  ). Catheters other than the ablation catheter, such as the multipolar Lasso, can further enhance the collection of points and increase the mapping speed. The CARTO 3 system provides highly accurate geometry of a cardiac chamber, which can be visualized in multiple views. Connection of Choice is enabled by a CARTO hardware configuration featuring a central connection point for all catheters and equipment while preserving the signal quality of intracardiac electrograms. Catheter connections have been redesigned for “plug-and-play” functionality and automatic catheter recognition.
Mapping Procedure
The mapping catheter is initially positioned (using fluoroscopy) at known anatomical points that serve as landmarks for the electroanatomical map. For example, to map the RA, points such as the superior vena cava (SVC), inferior vena cava (IVC), His bundle, tricuspid annulus, and CS ostium (CS os) are marked. The catheter is then advanced slowly around the chamber walls to sample multiple points along the endocardium, thus sequentially acquiring the location of its tip together with the local electrogram.2
Each selected point is tagged on the 3-D map. The local activation time at each site is determined from the intracardiac bipolar electrogram and is measured in relation to the fixed reference electrogram (see Video 10  ). Lines of block (manifest as double potentials) are tagged for easy identification because they can serve as boundaries for subsequent design of ablation strategies. Electrically silent areas (defined as having an endocardial potential amplitude less than 0.05 mV, which is the baseline noise in the CARTO system and the absence of capture at 20 mA) and surgically related scars are tagged as “scar” and therefore appear in gray on the 3-D maps and are not assigned an activation time (see Figs. 14-1 and 14-2). The map can also be used to catalog sites at which pacing maneuvers are performed during assessment of the tachycardia.
Sampling the location of the catheter together with the local electrogram is performed from a plurality of endocardial sites. The points sampled are connected by lines to form several adjoining triangles in a global model of the chamber. Next, gated electrograms are used to create an activation map, which is superimposed on the anatomical model. The acquired local activation times are then color-coded and superimposed on the anatomical map with red indicating early-activated sites, blue and purple late-activated areas, and yellow and green intermediate activation times (see Figs. 11-17, 11-19, and 12-10). Between these points, colors are interpolated, and the adjoining triangles are colored with these interpolated values. However, if the points are spaced widely apart, no interpolation is done. The degree to which the system interpolates activation times is programmable (as the triangle fill threshold) and can be modified if necessary. As each new site is acquired, the reconstruction is updated in real time to create a 3-D chamber geometry color progressively encoded with activation time.2
Sampling an adequate number of homogeneously distributed points is necessary. If a map is incomplete, bystander sites can be mistakenly identified as part of a reentrant circuit. Regions that are poorly sampled have activation interpolated between widely separated points. This can give the appearance of conduction, but critical features such as lines of block can be missed. In addition, low-resolution mapping can obscure other interesting phenomena, such as the second loop of a dual-loop tachycardia. Some arrhythmias, such as complex reentrant circuits, require more than 80 to 100 points to obtain adequate resolution. Other tachycardias can be mapped with fewer points, including focal tachycardias and some less complex reentrant arrhythmias, such as isthmus-dependent AFL.9,10
It is also important to identify areas of scar or central obstacles to conduction; failure to do so can confuse an electroanatomical map because interpolation of activation through areas of conduction block can give the appearance of wavefront propagation through, rather than around, those obstacles. This occurrence precludes identification of a critical isthmus in reentrant arrhythmias to target for ablation. A line of conduction block can be inferred if there are adjacent regions with wavefront propagation in opposite directions separated by a line of double potentials or dense isochrones.9
Activation Map
The activation maps display the local activation time color-coded overlaid on the reconstructed 3-D geometry (see Fig. 6-8; also see Figs. 11-17, 11-19, and 12-10). Activation mapping is performed to define the activation sequence. A reasonable number of points homogeneously distributed in the chamber of interest must be recorded. The selected points of local activation time are color-coded—red for the earliest electrical activation areas and orange, yellow, green, blue, and purple for progressively delayed activation areas (see Videos 10 and 11  ). The electroanatomical maps of focal tachycardias demonstrate radial spreading of activation, from the earliest local activation site (red) in all directions, and, in these cases, activation time is markedly shorter than tachycardia CL (see Figs. 11-17 and 11-19). On the other hand, a continuous progression of colors (from red to purple) around the mapped chamber, with close proximity of earliest and latest local activation, suggests the presence of a macroreentrant tachycardia (see Figs. 12-10, 14-1, and 14-2). It is important to recognize that if an insufficient number of points is obtained in this early meets late zone, it may be falsely concluded through the interpolation of activation times that the wavefront propagates in the wrong direction (Fig. 6-13).2,9,10
Isochronal Map
The system can generate isochrones of electrical activity as color-coded static maps. The isochronal map depicts all the points with an activation time within a specific range (e.g., 10 milliseconds) with the same color. Depending on conduction velocity, each color layer is of variable width; isochrones are narrow in areas of slow conduction and broad in areas of fast conduction. Displaying information as an isochronal map helps demonstrate the direction of wavefront propagation, which is perpendicular to the isochronal lines. Furthermore, isochronal crowding indicating a conduction velocity of 0.033 cm/msec (slower than 0.05 cm/msec) is considered a zone of slow conduction, whereas a collision of two wavefronts traveling in different directions separated temporally by 50 milliseconds is defined as a region of local block. Spontaneous zones of block or slow conduction (less than 0.033 cm/msec) may have a major role in the stabilization of certain arrhythmias.2
Propagation Map
The CARTO system also can generate color-coded animated dynamic maps of activation wavefront (propagation maps). This is a two-colored map, in which the whole chamber is blue and electrical activation waves are seen in red, spreading throughout the chamber as a continuous animated loop (see Figs. 11-19 and 12-10). Propagation of electrical activation is visualized superimposed on the 3-D anatomical reconstruction of the cardiac chamber in relation to the anatomical landmarks and barriers (see Videos 11 and 12  ). Analysis of the propagation map can allow estimation of the conduction velocity along the reentrant circuit and identification of areas of slow conduction.
Voltage Map
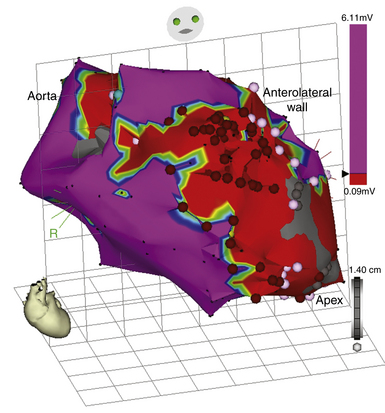
The voltage map displays the peak-to-peak amplitude of the electrogram sampled at each site. This value is color-coded and superimposed on the anatomical model, with red as the lowest amplitude and orange, yellow, green, blue, and purple indicating progressively higher amplitudes (Fig. 6-14). The gain on the 3-D color display allows the user to concentrate on a narrow or wide range of potentials. By diminishing the color scale, as may be required to see a fascicular potential or diastolic depolarization during reentry, larger amplitude signals are eliminated. To visualize the broad spectrum of potentials present during a tachycardia cycle, the scale would be opened up to include an array of colors representing a spectrum of voltages. Local electrogram voltage mapping during sinus, paced, or any other rhythm can help define anatomically correct regions of no voltage (presumed scars or electrical scars), low voltage, and normal voltage. The true range of normal is often difficult to define, however, especially with bipolar recordings, and different criteria have been used. Myocardial scars are seen as low voltage, and their delineation can help in understanding the location of the arrhythmia.
Entrainment Map
A graphical representation of entrainment mapping can be constructed by plotting values of the differences between the post-pacing intervals (PPIs) and the tachycardia CLs (PPI–tachycardia CL) on the electroanatomical mapping system to generate color-coded 3-D entrainment maps (Fig. 6-15). This approach can potentially help accurately determine and visualize the 3-D location of the entire reentrant circuit, even though the area of slow conduction of the tachycardia is not specified. Because neither of the electroanatomical mapping systems (CARTO, NavX) contains an algorithm for color-coding of entrainment information, the modus for activation mapping is altered manually. At each 3-D location of the catheter tip stored on the electroanatomical mapping system, entrainment stimulation is performed, and the difference between PPI and tachycardia CL (PPI–tachycardia CL) is calculated and plugged into the electroanatomical mapping system (as if it would be an “activation time”). For that, the local electrogram stored at the 3-D location is completely disregarded. The annotation marker is manually moved into a position where the numeric timing information equals the entrainment information (PPI–tachycardia CL). That timing information then is displayed in a color-coded fashion as if it were activation time, but instead it represents information on the length of the entrainment return cycle. With the color range, red represents points closest to the reentrant circuit (i.e., sites with smaller PPI–tachycardia CL differences, approaching 0, signifying their inclusion in the reentrant circuit) and purple represents points far away from the circuit (i.e., sites with the largest PPI–tachycardia CL differences).14,15
Color-coded 3-D entrainment mapping allows determination of the full active reentrant circuit (versus passively activated regions of the chamber) and the obstacle around which the tachycardia is circulating, and it provides very useful information on the location of potential ablation sites (see Fig. 6-15). However, not all these sites will terminate reentry (just as, although the circuit in orthodromic SVT includes the ventricle, ablation at one or two sites in that ventricle will not eliminate reentry); the final choice is determined by location of anatomical barriers and width of putative isthmuses, so that strategic ablation lines, mainly connecting to anatomical barriers, can be applied to transect the circuit and treat the arrhythmia.14,15
Clinical Implications
The CARTO system provides a highly accurate geometric rendering of a cardiac chamber with a straightforward geometric display having the capability to determine the 3-D location and orientation of the ablation catheter accurately. The position of the mapping tip at any point in time is readily apparent from a tip icon, provided that the tip is at or beyond the rendered chamber geometry. The catheter can anatomically and accurately revisit a critically important recording site (e.g., sites with double potentials or those with good pace maps) identified previously during the study, even if the tachycardia is no longer present or inducible and map-guided catheter navigation is no longer possible. This accurate repositioning provides significant advantages over conventional techniques and is of great value in ablation procedures. Ablation lesions can be tagged, thus facilitating creation of lines of block with considerable accuracy by serial RF lesion placement and allowing verification of the continuity of the ablation line (see Fig. 6-10). This is of particular value after incomplete ablations caused by catheter dislocation or early coagulum formation, especially if these ablations had caused interruption of the target tachycardia. Extra RF applications can be delivered closely around an apparently successful ablation site to ensure elimination of the arrhythmogenic area.2
Voltage maps can help define the arrhythmogenic substrate when the arrhythmia arises in the setting of cardiac structural abnormalities; this is of particular value during mapping of hemodynamically unstable or nonsustained arrhythmias. Additionally, fluoroscopy time can be reduced via electromagnetic catheter navigation, and the catheter can be accurately guided to positions removed from fluoroscopic markers. Although fluoroscopy is always needed for initial orientation, an experienced operator can usually generate an extensive endocardial activation map with substantially reduced radiation exposure for himself or herself and for the patient and laboratory staff.2
The CARTOMerge Module has proved very valuable in guiding real-time catheter ablation using the detailed cardiac chamber anatomy acquired from the CT/MRI (see later discussion).16
The CARTOSound Image Integration Module has been successfully utilized to facilitate AF catheter ablation by incorporating a real-time ICE volume map of the LA and PVs with the electroanatomical map, either as a stand-alone tool to guide navigation and ablation or as a facilitator of CT/MRI image integration. Additionally, studies have shown the feasibility of using CARTOSound to define scar boundaries in the left ventricle (LV, identified on ICE imaging by both by wall thickness and motion) to facilitate substrate mapping and ablation of ischemic VT.12,13
Limitations
If highly fractionated and wide potentials are present, it can be difficult to assign an activation time. In some macroreentrant circuits, much of the tachycardia CL is occupied by fractionated low-amplitude potentials. The subjective selection of an individual local potential within a multicomponent electrogram can drastically alter a propagation map. If these potentials are dismissed or assigned relatively late activation times, a macroreentrant tachycardia may mimic a focal arrhythmia, and it will appear as if substantially less than 90% of the tachycardia CL is mapped. Additionally, with current methods, only a single value of timing or voltage can be assigned to those low-amplitude fractionated electrograms, and this is suboptimal in representing their potential importance to the reentrant circuit. To address this issue, one study described a novel form of electroanatomical mapping called “ripple mapping,” whereby voltage, timing, and location are simultaneously displayed with continuous display of electrograms that were previously sampled and postprocessed. This novel technique for representation of endocardial activation can potentially help to simplify activation mapping by minimizing operator dependence, to eliminate interpolation of data between mapped points, and to eliminate assignment bias by developing software to register continuous or fractionated electrograms, thereby removing a single, isolated local value as representing an entire coordinate. The extent to which this technology will be incorporated into “real-time” application requires prospective evaluation.17
Another limitation of the CARTO system is the requirement of a special Biosense Webster catheter with a location sensor embedded proximal to its tip. No other catheter types may be used with this system. Furthermore, the magnetic signal necessary for the CARTO system can potentially create interference with other EP laboratory recording systems. Implantable cardioverter-defibrillators and pacemakers are safe with the system, but the magnetic field can prevent device communication with its programmer, and the magnetic field may need to be disabled temporarily to allow device programming.
EnSite NavX Navigation System
Fundamental Concepts
The EnSite NavX system (St. Jude Medical, Austin, Tex.) consists of a set of 3 pairs of skin patches, a system reference patch, 10 ECG electrodes, a display workstation, and a patient interface unit. The reference patch is placed on the patient’s abdomen and serves as the electrical reference for the system. The EnSite NavX combines catheter location and tracking features of the LocaLisa system (Medtronic, Minneapolis, Minn.) with the ability to create an anatomical model of the cardiac chamber using only a single conventional EP catheter and skin patches.8
This mapping modality is based on currents across the thorax, developed as originally applied in the LocaLisa system. In contrast to the NavX system, LocaLisa does not allow generation of 3-D geometry of the heart cavity because catheters and desired anatomical landmarks are displayed in a cartesian frame of reference.2 This technology has undergone substantial additional development in the NavX iteration.
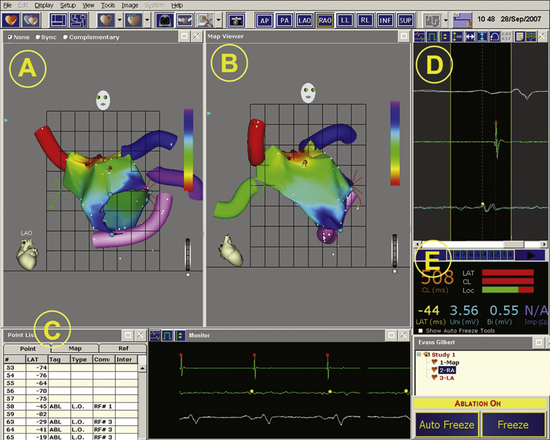
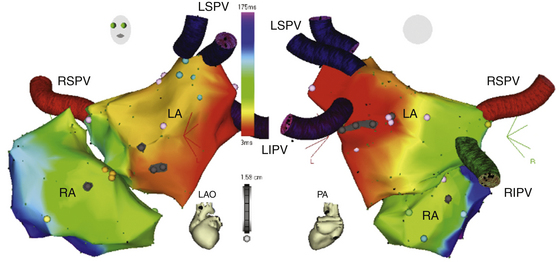
For 3-D navigation, 6 electrodes (skin patches) are placed on the skin of the patient to create electrical fields along 3 orthogonal axes (x, y, and z). The patches are placed on both sides of the patient (x-axis), the chest and back of the patient (y-axis), and the back of the neck and inner left thigh (z-axis). Analogous to the Frank lead system, the 3 orthogonal electrode pairs are used to send 3 independent, alternating, low-power currents of 350 mA at a frequency of 5.7 kHz through the patient’s chest in 3 orthogonal (x, y, and z) directions, with slightly different frequencies of approximately 30 kHz used for each direction, to form a 3-D transthoracic electrical field with the heart at the center. The absolute range of voltage along each axis varies from each other, depending on the volume and type of tissue subtended between each surface-electrode pair. The voltage gradient is divided by the known applied current to determine the impedance field that has equal unit magnitudes in all 3 axes. Each level of impedance along each axis corresponds to a specific anatomical location within the thorax. As standard catheter electrodes are maneuvered within the chambers, each catheter electrode senses the corresponding levels of impedance, derived from the measured voltage. The mixture of the 30-kHz signals, recorded from each catheter electrode, is digitally separated to measure the amplitude of each of the 3 frequency components. The 3 electrical field strengths are calculated automatically by use of the difference in amplitudes measured from neighboring electrode pairs with a known interelectrode distance for 3 or more different spatial orientations of that dipole. Timed with the current delivery, NavX calculates the x-y-z impedance coordinates at each catheter electrode by dividing each of the 3 amplitudes (V) by the corresponding electrical field strength (V/cm) and expresses them in millimeters to locate the catheters graphically in real time to enable nonfluoroscopic navigation. The NavX system allows real-time visualization of the position and motion of up to 64 electrodes on both ablation and standard catheters positioned elsewhere in the heart (Fig. 6-16).
The NavX system also allows for rapid creation of detailed models of cardiac anatomy (see Fig. 6-16). Sequential positioning of a catheter at multiple sites along the endocardial surface of a specific chamber establishes that chamber’s geometry. The system automatically acquires points from a nominated electrode at a rate of 96 points/sec. Chamber geometry is created by several thousand points. The algorithm defines the surface by using the most distant points in any given angle from the geometry center, which can be chosen by the operator or defined by the system. In addition, the operator is able to specify fixed points that represent contact points during geometry acquisition; the algorithm that calculates the surface cannot eliminate these points. In addition to mapping at specific points, there is additional interpolation, providing a smooth surface onto which activation voltages and times can be registered. To control for variations related to the cardiac cycle, acquisition can be gated to any electrogram.
Similar to the CARTO system, the voltage or the activation map can be superimposed on the 3-D geometry (see Fig. 6-16). Principles of activation and voltage mapping using the NavX system are similar to those discussed previously for the CARTO system.
Mapping Procedure
NavX-guided procedures are performed using the same catheter setup as conventional approaches. Any electrode can be used to gather data, create static isochronal and voltage maps, and perform ablation procedures. Standard EP catheters of choice are introduced into the heart; up to 12 catheters and 64 electrodes can be viewed simultaneously. The system can locate the position of the catheters from the moment that they are inserted in the vein. Therefore, all catheters can be navigated to the heart under guidance of the EnSite NavX system, and the use of fluoroscopy can be minimized for preliminary catheter positioning. However, interrupted fluoroscopy has to be used repeatedly when an obstacle to catheter advancement is encountered. Once in the heart, one intracardiac catheter is used as reference for geometry reconstruction. A shadow (to record original position) is placed over this catheter to recognize displacement during the procedure, in which case the catheter can be returned easily to its original location under the guidance of NavX. A shadow can also be displayed on each of the other catheters to record the catheter’s spatial position (see Fig. 6-16).
Subsequently, 3-D intracardiac geometry is obtained. Respiratory compensation is collected just before mapping to filter low-frequency cardiac shift associated with the breathing cycle. Characteristic anatomical landmarks in the chamber of interest are initially acquired and marked. The system is then allowed to create the geometry automatically. A virtual anatomical geometry is acquired by moving the catheter in all directions throughout the chamber of interest, keeping contact with the endocardial wall.18 If a CT reconstruction of the mapped cardiac chamber is available, the image can be visualized on a split screen and used to guide finer anatomical definition with the ablation catheter. On completion, maps can be edited to eliminate “false space” (i.e., geometry with sparse geometry points) and erroneous structure definition. Subsequently, a scaling algorithm (Field Scaling) is applied to the completed detailed geometry to compensate for variations in impedance between the heart chambers and venous structures (which can otherwise result in a distortion of the x-y-z coordinates when a “roving” catheter is maneuvered among the differing regions of impedance). Field scaling is based on the measured interelectrode spacing for all locations within the geometry. Adjustments to the local strength of the navigation fields are made so that the computed catheter electrode positions match the known interelectrode spacing of the catheters used to create the geometry.19
Additional tagging of sites of interest and ablation points can be done during the procedure. Point-to-point activation mapping is carried out to create static isochronal, voltage, and activation maps (Videos 16 and 17;  see Fig. 6-16). Standard catheters are used to sample voltage and activation timing at various locations during a sustained rhythm. The system collects and visually organizes activation timing and voltage data and permanently saves 10 beats with every collected point for later review. An unlimited number of maps can be created per procedure. The system works with most manufacturers’ ablation catheters, RF generators, or cryogenerators. Ablation lesions can be tagged, thus facilitating creation of lines of block with considerable accuracy by serial RF lesion placement and allowing verification of the continuity of the ablation line.18
Clinical Implications
NavX is a novel mapping and navigation system with the ability to visualize and navigate a complete set of intracardiac catheters in any cardiac chamber for diagnostic and therapeutic applications.8 It enables the electrophysiologist to display in real time up to 64 electrodes simultaneously on 12 catheters with almost every commercially available catheter, including pacemaker leads. Earlier versions of NavX permitted the creation of 3-D cardiac geometry by using all these catheters, without visualization of electrical activity. Thus, they are particularly suitable for ablation of arrhythmias with well-known substrates that can be treated by an anatomical approach, such as AFL and linear LA ablation for AF.18 A software upgrade allowing point-to-point activation mapping for the NavX system has also been introduced. This is a substantial improvement, permitting the same type of activation mapping and display as are possible with other systems, with the similar advantage of specified voltage mapping as well. This point-to-point mapping, however, is suited only for sustained arrhythmias or frequently recurrent PACs, PVCs, or nonsustained arrhythmias. Unlike with the CARTO system, however, activation times can be acquired simultaneously by the EnSite NavX system from multiple poles on all catheters utilized during the study (and not just the mapping-ablation catheter). This acquisition can be augmented by the addition of noncontact mapping to the procedure.8
The ablation procedure is also facilitated by NavX.8,18 As noted, the system works with most manufacturers’ ablation catheters, RF generators, or cryogenerators. The ablation lesions can be tagged, thus facilitating creation of lines of block with considerable accuracy by serial RF lesion placement and allowing verification of the continuity of the ablation line and anatomical visualization of the remaining gaps, where additional RF applications can be delivered. It also helps avoid repeated ablations at the same location. The catheter can anatomically and accurately revisit a critically important recording site identified previously during the study.
As in the CARTO system, the voltage or the activation map can be superimposed on the 3-D geometry. Complex fractionated electrograms can be targeted in persistent AF by using the software to depict the mean electrogram CL map. The NavX system also has the capability to import and integrate 3-D CT or MRI images to facilitate anatomically based ablation procedures. NavX Fusion provides a significant advancement in image integration with the EnSite NavX system and has the ability to mold the created geometry dynamically into the CT/MRI image (see later discussion).
Stereotaxis Magnetic Navigation System
Fundamental Concepts
Catheter navigation by magnetic force was initially introduced in the early 1990s for diagnostic studies in neonates. However, the development of conventional steerable electrodes with integrated pull wires to deflect the catheter tip was pursued, and this constitutes the current technique for catheter ablation. The conventional technique is limited by the fixed maximal catheter deflection and relies mostly on the skill of the operator to ensure stable catheter positioning. A novel magnetic navigation system (MNS; 0.15 T, Telstar, Stereotaxis, St. Louis, Mo.) was introduced to clinical practice. It was proven to be a safe and feasible tool for catheter ablation, although it did not allow remote catheter ablation. The second-generation MNS (Niobe, Stereotaxis) now allows, for the first time, complete, remote RF catheter ablation.20
The Niobe MNS consists of two permanent neodymium-iron-boron magnets; their positions, relative to each other, are computer controlled inside a fixed housing and positioned on either side of the single-plane fluoroscopy table.20 While positioned in the “navigate” position, the magnets create a 360-degree omnidirectional rotation of the device by a uniform magnetic field (0.08 tesla) within an approximately spherical navigation volume 20 cm in diameter (NaviSphere), sufficient to encompass the heart when the patient is properly positioned. The combination of rotation, translation, and tilt movements of the magnets adjusts the magnetic field to any desired orientation within the NaviSphere.20,21
The mapping and ablation catheters are extremely flexible distally, especially the distal shaft of the catheter, and have tiny magnets (single or multiple, in various configurations) inserted in their distal portion. The latest catheters have three tiny magnets distributed along the distal shaft and tip of the catheter to increase responsiveness of the catheter to the magnetic field generated (Fig. 6-17). The catheter magnets align themselves with the direction of the externally controlled magnetic field to enable the catheter tip to be steered effectively. By changing the orientation of the outer magnets relative to each other, the orientation of the magnetic field changes, thereby leading to deflection of the catheter.20
The system is integrated with a modified C-arm digital x-ray system, mainly a single-plane unit because of the limitations imposed by the magnets, although a biplane system can be installed for use when the magnets are stowed and not in use. Because of the magnets, the rotation of the imaging system is limited to approximately 30 degrees right anterior oblique (RAO) and left anterior oblique (LAO) in Niobe I and almost 45 degrees with Niobe II. In the Niobe I iteration, the magnets can be swung only in (active navigation) or stowed, whereas in the Niobe II the magnets have a different housing and can also be tilted to allow for more angulation of the single-plane C-arm imaging system.20
Directional catheter navigation is accomplished by drawing a desired magnetic field vector on orthogonal fluoroscopic views with a digitization tablet (Fig. 6-18). A control computer then calculates the appropriate currents to each of the superconducting electromagnets. The resultant composite magnetic field interacts with a permanent magnet in the tip of the magnetic ablation catheter and deflects the catheter to align parallel to the magnetic field. Magnetic field orientations corresponding to specific map points can be stored on the MNS and reapplied to return repeatedly and accurately to previously visited locations on the map. Navigation to a particular target often requires two or three manipulations of the magnetic field to refine the catheter position. Each magnetic field manipulation requires less than 20 seconds to activate. By changing the orientation of the outer magnets, the orientation of the magnetic field changes, thereby leading to the deflection of the catheter in parallel.20
Mapping Procedure
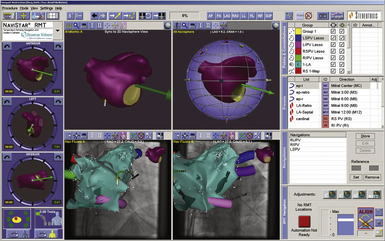
All the components of the MNS, as well as the x-ray, ablator, and stimulator, can be operated from the control room. Therefore, after initial placement of sheaths and catheters, the entire ablation procedure can be performed remotely from the control room. The Navigant system is the computerized graphical user interface system. It includes the software used for image integration and for control of the magnetic fields that orient the catheter within the heart and allow the operator to direct the movement of the tip of the catheter to access the region of interest (see Fig. 6-18).20
After synchronizing with respiratory and cardiac cycles, such as inspiration and the end-diastolic period, a pair of best-matched RAO-LAO images is transferred and kept in the Navigant screen as background references for orientation and navigation (see Fig. 6-18). Thus, the real-time catheter location information can be displayed on the Navigant reference x-ray images, thus enabling continuous real-time monitoring of the catheter tip position, even without acquiring a fresh x-ray image.20
The operator can access an area of interest by using vector-based or target-based navigation. In vector-based navigation, the operator tells the system, by drawing a vector in virtual 3-D space on the computer, what orientation of the magnetic field is required. In target-based navigation, a target is placed on a specified point using the stored orthogonal fluoroscopic views; the user marks the support or base of the catheter (the distal portion of the sheath) on the pair of x-ray images. This provides Navigant with the data needed to compute field orientations corresponding to particular targets. Each time a vector is selected or a target is marked, the computer sends information to the magnets, which changes their relative orientation, and with it the orientation of the uniform magnetic field in the chest, so that catheter orientation is then changed within a few seconds (see Fig. 6-18). A target can also be defined by selecting a preset magnetic field vector based on a selected study protocol from the list on the Navigant. The software contains several preset vectors selected by the manufacturer, after careful appraisal of multiple CT images and reconstructions, for positioning the catheter at various anatomical landmarks. When a preset vector is applied, it can steer the catheter near the approximate region indicated. In addition, the software can be used to map various chambers of the heart automatically.20
Clinical Implications
Precise target localization and catheter stability are prerequisites for successful RF applications and to minimize risks of potential complications. Stiff, manually deflectable catheters, with a unidirectional or bidirectional deflection radius, which deflect in a single plane, have several inherent limitations because stable electrode-tissue contact can be difficult to achieve, particularly in regions of complex cardiac anatomy. In contrast, the promise of the current MNS lies in the precision of catheter movement and the ability to steer the flexible distal portion of the catheter in any direction in 3-D space.20
The MNS is increasingly used for ablation of AVNRT, atrioventricular bypass tracts (BTs), AFL, idiopathic outflow tract VT, scar-related VT, and especially AF. Intracardiac electrograms and stimulation thresholds are not significantly different from those recorded with a standard, manually deflected ablation catheter, and the safety of standard EP procedures has not been compromised by use of the MNS.21–26
A unique feature of the current MNS is that the magnetic vector coordinates used to navigate the magnetic catheter to a particular site can be stored and reused later in the study to return to a site of interest. The integration of a stable magnetic catheter with the CARTO electroanatomical mapping system is useful to reconstruct an accurate electroanatomical map by acquiring many more points than are possible manually for successful ablation, even of challenging areas.20
For certain procedures, notably AF ablation, MNS can decrease fluoroscopy time significantly. Although the use of MNS may increase total procedure duration, procedure times decrease with increasing operator experience.23–26
Limitations
The angulation of the fluoroscopic system is limited to 30 to 45 degrees for both LAO and RAO projections when the magnets are in the “navigate” position. Although this may not be important in simple ablations, addressing more complex substrates can be more challenging.20
The use of the MNS for ablation of AF, atypical AFL, and typical AFL was associated with long procedure times as compared with conventional catheter navigation. The preparation of the devices (registration and positioning of the magnets for MNS; flushing sheaths and gain transseptal access for MNS) is still time-consuming. Furthermore, the use of the MNS for catheter ablation of typical AFL resulted in a lower overall success rate (achievement of cavotricuspid isthmus block and freedom from AFL recurrence during follow-up). A lower success rate of PV electrical isolation was also observed when a standard 4-mm-tip ablation catheter was used. Some reports also expressed concern about a higher incidence of char formation during MNS-guided ablation of AF and AFL.21,24,25 Irrigated magnetic catheters have become available and may reduce the risk of char formation, and they may also increase lesion efficacy during MNS-guided ablation.22
Sensei Robotic Navigation System
Fundamental Concepts
The Sensei robotic navigation system (Hansen Medical, Mountain View, Calif.) is an electromechanical system that realizes catheter navigation by two concentric steerable sheaths (Artisan, Hansen Medical) incorporating an ablation catheter. The outer sheath (14 Fr) and the inner sheath (10.5 Fr) are both manipulated via a pull-wire mechanism by a sheath-carrying robotic arm that is fixed at the foot of the patient’s table. The robot arm obeys the commands of the central workstation (master console) positioned in the control room. Catheter navigation is realized using a 3-D joystick (Instinctive Motion Control, Hansen Medical) and allows a broad range of motion in virtually any direction. At the master console, fluoroscopic images, ICE images, and other 3-D representations (electroanatomical maps) are displayed, providing immediate feedback to the operator. Seamless instinctive integration and interpreted motion logic allow the physician to direct catheter movement in 3-D regardless of image orientation or perspective. To provide a representation of tactile feedback, the system continuously monitors the contact force that is exerted by the catheter tip by using a specially designed algorithm (IntelliSense, Hansen Medical). If the contact force exceeds a preset limit, an optical alarm is displayed, and catheter advancement is rendered virtually impossible. In general, all catheters and all electroanatomical mapping systems may be used. Apart from the different navigational approach, the technical aspects of the ablation are identical to the manual ones.21,27–29
Mapping Procedure
Both the inner and the outer sheaths should be flushed with heparinized normal saline before insertion and continuously throughout the procedure to prevent clot formation and air embolism. The steerable guide sheath is manually inserted via a 14 Fr sheath in the right femoral vein and advanced manually into the inferior RA under fluoroscopy guidance. To minimize the risk of vascular complications, it is advisable to obtain venous access under ultrasound guidance, initially insert an 8 Fr sheath and upsize to 11 Fr and then 14 Fr, and then insert a long, 30-cm 14 Fr sheath that usually ends at the level of the liver. Through this, the steerable sheath is inserted with the ablation catheter leading by at least 10 cm into the RA. At this level, the ablation catheter is withdrawn into the steerable sheath with only the distal electrodes protruding. Failure to leave the ablation catheter out beyond the end of the Artisan sheath and to observe the catheter system advance up to the RA increases the risk of vascular injury.29
Then, the position of the sheath is registered into the robotic catheter remote control system. The registration process involves the use of two orthogonal fluoroscopic views of the heart (anteroposterior and lateral) to allow saving the position of the guide sheath in 3-D space. Following registration, the remote control system is used to steer the tip of the ablation catheter to various targets in all four cardiac chambers.
The amount of energy applied during remote navigation cases is generally lower than that of manual cases, likely because of enhanced catheter contact and stability throughout the cardiac cycle afforded by the robotic sheath. As a result, the rate of steam pop and potential thermal complications may be higher if compensatory energy-lowering strategies are not implemented.29
Clinical Implications
The main advantages of remote navigation are the opportunity to reduce the operator’s radiation exposure because of the remote location of the workstation from the fluoroscopy unit. Furthermore, because of better catheter stability and easier navigation with the robotic system, total fluoroscopy time and patient and staff radiation exposure can potentially be reduced; however, this remains to be determined.21,29,30
Several studies have shown that robotic navigation and ablation of AF are as safe and effective as manual ablation. Furthermore, the use of the robotic catheter remote control system for transseptal puncture and endocardial navigation is safe and feasible. However, its usefulness in decreasing procedure time and improving procedural efficacy and safety compared with current approaches requires further evaluation in randomized clinical trials. In addition, a comparison between this technology and remote magnetic navigation may be warranted. It is conceivable that, in the future, a completely automated remotely performed procedure could set new and more homogeneous treatment standards for this complex procedure.21,28
In contrast to the magnetic guidance system (Niobe, Stereotaxis), which requires specific compatible magnetic-guided catheters, the Sensei robotic navigation system is an open platform system whereby almost any mapping or ablation catheter of appropriate size can be introduced into the remotely steerable catheter or sheath. Additionally, the MNS requires continuous alteration and adjustment of the magnetic field and then advancement of the catheter in that direction. With the use of the Sensei robotic navigation system, a continuous uninterrupted motion of the ablation catheter can be achieved with the use of the instinctive motion controller.21,29,30 Finally, the Senseirobotic system is, at least in principle, portable and could be transported from one laboratory to another in the facility, whereas the remote MNS requires large magnets permanently installed in one location.
Limitations
The steerable robotic sheath is inherently stiff to make it pushable and mechanically steerable, and it has to be advanced through a 14 Fr vascular sheath. The size of the introducer sheath itself increases the likelihood of complications, and advancing the steerable sheath into the vein may cause dissection. The amount of force required to advance the Artisan through the hemostatic valve of the sheath at the groin is significant. Therefore, insertion of the 14 Fr sheath and the Artisan catheter does require special care to avoid retroperitoneal vascular complications.27,29
Infrequent cases of cardiac perforations and PV stenosis were reported in several studies using the Sensei robotic navigation system for catheter ablation of AF. Some of those events were thought to be consequent to the use of high power output during RF ablation. Therefore, it is important to recognize that with better catheter contact and stability offered by the robotic sheath, the effectiveness of ablation is increased, and less power is probably needed to achieve adequate attenuation of electrograms. Further studies will be required to evaluate adequate and optimal tissue contact during navigation mapping and ablation, as well as the optimal ablation energy parameters while using a robotic system at different pressure levels, and compare those with the parameters used with conventional manually operated catheters.27
Certain ablation catheters with flat wire deflection mechanisms, such as the current version of the Cool Path ablation catheter manufactured by St. Jude Medical, are not compatible with the Sensei robotic navigation system, thereby rendering the system truly a semi-open rather than a fully open platform. The flat wire mechanism allows the catheter to only bend along a two-dimensional (2-D) plane described by the flat surface of the wire without causing tension. When the robotic sheath moves in a direction that is not along the 2-D plane of the flat wire, tension is created, resulting in an uncontrolled rebound rapid correction of the system, which can potentially cause cardiac perforation. This rarely happens with manual manipulation of the catheter alone because the operator rotates the catheter appropriately to achieve the desired position.27,31
Although the robotic system affords greater stability at ablation targets, complications that occur with the manual approach can also occur with the robotic system. Given the stability of the system and also the stiffness and rigidity of the sheath, it is crucial that the operator understands the anatomy of the LA and adjacent structures. Even more so with the robotic navigation system, it is very important that the operator is cognizant of possible complications and is able to manage such complications effectively.27
Body Surface Potential Mapping
Fundamental Concepts
Although the conventional 12-lead ECG is extensively used, its limitations for optimal detection of cardiac abnormalities are widely appreciated. The main deficiency in the 12-lead approach is that only 6 chest electrodes are incorporated, and they cover a relatively constrained area of the precordium. The main reason for the choice of the location of the conventional precordial electrodes, suggested by Wilson in the 1940s, was the need to adopt some standard, which to this day has remained relatively unchallenged. In the years since then, the growing appreciation for the limitations of the conventional precordial electrode positions and the increase in understanding of the localization of various cardiac abnormalities on the body surface have led to the suggestion of various alternatives.32,33
One of the most widely studied alternatives to the 12-lead ECG in clinical and experimental electrocardiology has been body surface potential mapping (BSPM). In this approach, 32 to 219 electrodes are used in an attempt to sample all ECG information as projected onto the body’s surface. The merits of this enhanced spatial sampling are obvious, in that localized abnormalities that may be difficult to detect using the 12-lead approach can readily be picked up with the additional electrodes.32
BSPM is defined as the temporal sequence of potential distributions observed on the thorax throughout one or more electrical cardiac cycles. BSPM is an extension of conventional ECG aimed at refining the noninvasive characterization and use of cardiac-generated potentials. The improved characterization is accomplished by increased spatial sampling of the body surface ECG, recorded as tens or even hundreds of unipolar ECGs, simultaneously or individually, with subsequent time alignment.33
BSPMs provide much more electrical and diagnostic information than the 12-lead ECG. They contain all the electrical information that can be obtained from the surface of the body, and they reveal diagnostically significant electrical features in areas that are not sampled by the 12-lead ECG systems. In addition, BSPMs often show distinct electrical manifestations of two or more events simultaneously evolving in the heart; they make it possible to compute any ECG that would be obtained from any pair or combination of body surface electrodes (i.e., from any current or future lead system). In addition, the recorded data can be displayed as a sequence of contour maps, thus allowing isolation of significant ECG events in both space and time.32
BSPMs can be used to reconstruct epicardial and, in some cases, endocardial potential distributions, excitation times, and electrograms noninvasively, by means of inverse procedures, which help transform the ECG into an imaging method of electrical activity. This yields 3-D images that depict anatomical features with superimposed activation isochrones or excitation and recovery potentials, isochrones, and electrograms.33
In BSPM measurements, unipolar potentials of single heartbeats are acquired simultaneously at more than 60 locations covering the whole thorax. A Wilson central terminal is used as a reference for the unipolar leads. Lead sites in the array are arranged in columns and rows, and the electrodes are attached to flexible plastic strips, attached to dozens of thoracic sites vertically, with the highest electrode density at the left anterior thorax. Recordings are bandpass-filtered at 0.16 to 300 Hz, digitized with a sampling frequency of 1 kHz, and stored on a CD.33
BSPMs depict the spatial distribution of heart potentials on the surface of the torso. Initially, all lead tracings are visually screened to reject poor-quality signals. The amplitude of every electrogram is measured at a given time instant during the cardiac cycle and plotted on a chart representing the torso surface. Several analytical procedures are used to convert the grid of data points into map contours. The time interval between successive instantaneous maps (frames) is generally 1 to 2 milliseconds. A sequence of 400 to 800 frames shows the evolution of the potential pattern during the cardiac cycle. Often, 20 to 50 properly selected maps are sufficient to show the essential features of the time-varying surface field.33
Clinical Implications
BSPM has been used for patients with conditions such as pulmonary embolism, aortic dissection, and acute coronary syndromes. It has also been used for diagnosing an old myocardial infarction, localizing the BT in Wolff-Parkinson-White syndrome, recognizing ventricular hypertrophy, and ascertaining the location, size, and severity of myocardial infarction and the effects of different interventions designed to reduce the size of the infarct.33 From an EP standpoint, BSPM has been studied for the discrimination of clockwise and counterclockwise AFL, localization of the earliest retrograde atrial activation site in dogs with simulated Wolff-Parkinson-White syndrome and orthodromic AVRT, localization of the ventricular insertion site of BTs during preexcitation, localization of sites of origin of ATs and VTs, and localization of endocardial or epicardial pacing sites.
Although ongoing research continues to address the role of BSPM, and how BSPM addresses many of the inadequacies associated with the conventional 12-lead approach, the clinical effectiveness of this procedure has not been established. BSPM is mostly used as a research tool, rather than a routine diagnostic method because of significant limitations.32
Limitations
The main limitation of BSPM is the complexity of the recording, which requires many leads from each patient, sophisticated instrumentation, and dedicated personnel.32 Complexity of the interpretation is another limitation, because it is mostly based on pattern recognition and knowledge of variability in normal subjects and patients, features that are difficult to memorize. Therefore, visual inspection and measurement of BSPMs cannot result, per se, in direct localization of single or multiple electrical events as they occur in the heart. Furthermore, BSPMs do not offer a picture of the heart, but they show an attenuated and distorted projection of epicardial and intracardiac events on the body surface. Additionally, the method of interpolating maps from acquired data is vulnerable to the precision of localization of the electrode sites and to the assurance that each electrode is receiving a true signal.32
Electrocardiographic Imaging
Fundamental Concepts
ECGI has three main components: a multielectrode ECG vest, a multichannel mapping system for ECG signal acquisition, and an anatomical imaging modality to determine the heart-torso geometry. ECGI is a cardiac functional imaging modality that noninvasively reconstructs epicardial potentials, electrograms, and isochrones (activation maps) from multichannel body surface potential recordings by using geometrical information from CT and a mathematical algorithm.34,35
ECGI has two requirements: ECG unipolar potentials measured over the entire body surface and the heart-torso geometrical relationship relating the epicardial surface to the location of the recording ECG electrodes. The body surface ECG unipolar potentials are measured using a multielectrode ECG vest. The prototype ECG vest has 250 electrodes arranged in rows and columns on strips, with Velcro attachments at the sides to secure the vest to the torso (Fig. 6-19). The vest is connected to a multichannel mapping system, which measures ECG unipolar potentials over the entire body surface and facilitates simultaneous signal acquisition and amplification from all channels. Body surface potentials are monitored to ensure proper contact and gain adjustment, and then signals are recorded over several heartbeats.34–37
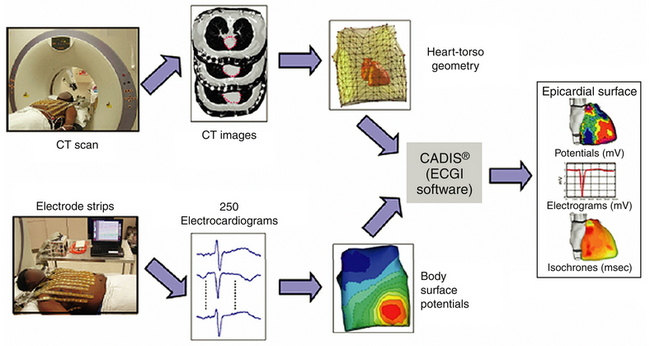
After signal acquisition, the exact geometry of the epicardial and torso surfaces and vest electrode positions is obtained by anatomical imaging modalities, such as thoracic CT or MRI. Scans are usually set to an axial resolution between 0.6 and 1 mm and are typically gated at the R wave of the ECG to obtain diastolic volume (geometry for reconstruction of activation). Systolic volume, gated during the T wave of the ECG, is also measured to obtain suitable geometry for reconstruction during the repolarization phase. The transverse slices are segmented slice by slice to obtain heart geometry (as epicardial contours on each slice) and torso geometry (described by body surface electrode positions, seen as bright dots on the images; see Fig. 6-19). The geometry of the heart and torso surfaces is then assembled in a common x-y-z coordinate system to provide the geometrical heart-torso relationship.34–37
ECGI noninvasively computes potentials on the heart surface by solving the Laplace equation within the torso volume, with torso surface potentials and the geometric relationship between the epicardial and torso surfaces as inputs. The potential and geometry data are processed through CADIS, the ECGI software package (see Fig. 6-19). The software has four modules. The pre-processing module pre-processes the acquired ECG signals by noise filtration, baseline correction, elimination of bad signals (poor contact), and interpolation of missing signals. The geometry module includes image segmentation algorithms for heart and body surface segmentation and meshing of heart and torso surfaces. The numerical module includes boundary element algorithms to derive the transfer matrix relating body surface potentials to epicardial potentials and epicardial potential reconstruction algorithms that use regularized inverse solutions such as Tikhonov zero-order or the generalized minimal residual methods to compute unipolar epicardial potentials from the transfer matrix and body surface potentials. Regularization is necessary because of the ill-posed nature of the inverse problem (i.e., large noise fluctuations in the input data [noise on the ECGs or inaccurate electrode locations] may precipitate large errors in the solution). The fourth module is the postprocessing module, which includes tools to analyze reconstructed epicardial data and formats for efficient visualization and analysis.36,37
Four modes of display are typically used. Epicardial potential maps depict the spatial distributions of potentials on the epicardium (see Fig. 6-19). Each map depicts one instant of time; maps are computed at 1-millisecond intervals during the entire cardiac cycle. The electrograms depict the variation of potential with respect to time at a single point on the epicardium. The electrograms are computed at many points (typically 400 to 900 sites) around the epicardium. Isochrone maps depict the sequence of epicardial activation based on local activation time, taken as the point of maximum negative derivative (−dV/dtmax) of the QRS segment in each electrogram (intrinsic deflection). Recovery times are assigned as the point of maximum derivative (dV/dtmax) of the T wave segment. Activation times are determined as the time of maximum negative derivative in the epicardial electrograms. Information from neighboring electrograms is used to edit activation times in electrograms with multiple large negative derivatives. Lines of block are drawn to separate sites with activation time differences more than 30 milliseconds.34,35
Clinical Implications
A noninvasive imaging modality for cardiac EP is much needed for risk stratification of patients with genetic predisposition or altered myocardial substrate (e.g., after infarction), for specific diagnosis of the arrhythmia mechanism to determine the most suitable intervention, for determination of cardiac location for optimal localized intervention, for evaluation of efficacy and guidance of therapy over time, and for studying the mechanisms and properties of cardiac arrhythmias in humans. Noninvasive diagnosis of arrhythmias is currently based on the standard 12-lead ECG, BSPMs, or paced body surface QRS integral mapping. Standard diagnostic techniques such as the ECG provide only low-resolution projections of cardiac electrical activity on the body surface and cannot provide detailed information on regional electrical activity in the heart, such as the origin of arrhythmogenic activity, sequence of arrhythmic activation, or existence and location of an abnormal EP substrate.
ECGI has been successfully applied and validated in human subjects, including comparison with intraoperative multielectrode mapping, determination of ECGI accuracy in locating focal sites of initial activation in humans by comparison with known locations of pacing electrodes in various RV and LV positions, comparison with catheter-based localization of focal VT, determination of the origin of human AT, and characterization of reentrant circuits.34,35,38 ECGI has been applied in humans to reconstruct epicardial activation and repolarization during normal sinus rhythm, right bundle branch block, ventricular pacing, ventricular preexcitation, focal tachycardias, and AFL, in open heart surgery patients, and in patients receiving devices for cardiac resynchronization therapy. Additionally, ECGI can image the reentry pathway and its key components in atrial and ventricular macroreentrant tachycardias, including the critical isthmus, its entry and exit sites, lines of block, and regions of slow and fast conduction. Although clinical reentry usually occurs in the endocardium, the subepicardium plays an important role in the maintenance of reentry in a small proportion of patients undergoing ablation therapy. Interpretation of intramural arrhythmogenic activity can be further enhanced by direct catheter mapping or noncontact catheter reconstruction of EP information on the endocardial surface simultaneously with noninvasive epicardial ECGI. The combination of epicardial and endocardial EP information, with knowledge of the intramural anatomical organization of the myocardium, can provide an unprecedented ability to localize arrhythmogenic activity within the myocardial depth by using only noninvasive or minimally invasive procedures.36–39
ECGI’s ability to image noninvasively regions of dispersion of repolarization in the form of QRST integral maps (or other metrics of repolarization dispersion) during a single beat provides a feasible and computationally efficient method for evaluating the severity of the substrate in patients at risk of developing arrhythmias. Noninvasive reconstruction of epicardial measures of repolarization dispersion can therefore provide a tool for rapid screening of patients at a high risk of life-threatening arrhythmias. After screening, prophylactic measures (e.g., implantable defibrillators, ablation, drug therapy, or genetic or molecular modification) can be instituted before sudden cardiac death occurs. The significance of applying ECGI for risk stratification is amplified by the lack of sensitivity of body surface measures (e.g., QT dispersion) at reflecting underlying dispersion of repolarization.36,37,39
Limitations
ECGI provides EP information about the heart’s epicardial surface; it does not directly reconstruct endocardial information in the 3-D myocardium. Computation of endocardial activation is not yet possible because the electrical signal amplitude from the mid-wall and endocardium is much smaller. Nevertheless, in contrast to BSPMs, epicardial potentials provide high-resolution reflection of underlying intramural activity.35 In addition, ECGI can have limited success in defining components of arrhythmia pathways that involve small volumes of tissue, such as microreentry. Furthermore, the need to use CT limits the clinical application of ECGI during intervention in the EP laboratory, where CT is not available. To render the ECGI procedure more practical for mainstream adoption, newer methods for obtaining patient-specific geometry using biplane fluoroscopy or pseudo–3-D ultrasound have been developed and successfully tested in the context of ECGI in the EP laboratory.39
Intracardiac Echocardiography
Catheter Design
Mechanical Ultrasound Catheter Radial Imaging System
In the mechanical ultrasound catheter (Ultra ICE) radial imaging system (EP Technologies, Boston Scientific), the ultrasound transducer is mounted at the end of a nonsteerable 9 Fr (110-cm length) catheter and has a single, rotating, crystal ultrasound transducer. An external motor drive unit rotates the crystal at 1800 rpm within the catheter to provide an imaging plane that is 360 degrees circumferential and perpendicular to the long axis of the catheter, with the catheter located centrally. Mechanical ICE uses imaging frequencies of 9 to 12 MHz, which provide near-field clarity (within 5 to 7 cm of the transducer) but poor tissue penetration and far-field resolution. As a result, these systems have not allowed clear imaging of the LA and PV, except when they are introduced directly into the LA (transseptally). This technology lacks Doppler capability, and the catheter is not freely deflectable.40
Electronic Phased-Array Catheter Sector Imaging System
In the electronic phased-array ultrasound catheter (AcuNav) sector imaging system (Acuson Corporation, Siemens Medical Solutions, Malvern, Pa.), the ultrasound transducer is mounted on the distal end of an 8 or 10 Fr (90-cm length) catheter and has a forward-facing 64-element vector phased-array transducer scanning in the longitudinal plane. The catheter has a four-way steerable tip (160 degrees anteroposterior and left-right deflections). The catheter images a sector (wedge-shaped) field in a plane in line with the catheter shaft and oriented in the plane of the catheter. Imaging capabilities include 90-degree sector 2-D, M-mode, and Doppler imaging (pulsed-wave, continuous-wave, color, and tissue Doppler), with tissue penetration up to 16 cm, and variable ultrasound frequency (5.5, 7.5, 8.5, and 10 MHz).40
Imaging Technique
Using The Mechanical Radial Intracardiac Echocardiographic Catheter
Initially, all air must be eliminated from the distal tip of the ICE catheter by flushing vigorously with 5 to 10 mL of sterile water to optimize the ultrasound image. The ICE catheter is introduced through a long femoral venous sheath. Because the catheter is not deflectable, preshaped angled long sheaths are preferred to allow some steerability.40 The mechanical radial ICE catheter generates a panoramic 360-degree image perpendicular to the catheter, with the tip as a central reference point. The catheter is connected to the ultrasound console and advanced until the tip of the rotary ICE catheter image is in the RA.
When the transducer is advanced into the SVC, the ascending aorta, the right pulmonary artery, and, occasionally, the right superior PV are viewed.41 Withdrawing the catheter into the mid-RA brings the fossa ovalis and LA in view; the crista terminalis and aortic valve are usually visible in this view (Fig. 6-20). The LA, left PV orifices, and aortic root are imaged by positioning the transducer at the fossa ovalis. However, visualization of the LA and PV ostia is limited because of limited penetration depth. Withdrawing the catheter to the low RA allows visualization of the eustachian valve, lateral crista terminalis, and CS ostium (see Fig. 6-20).41 When the transducer is placed in the RV through the tricuspid valve and further advanced into the RVOT, both ventricles and the pulmonary artery can be visualized.
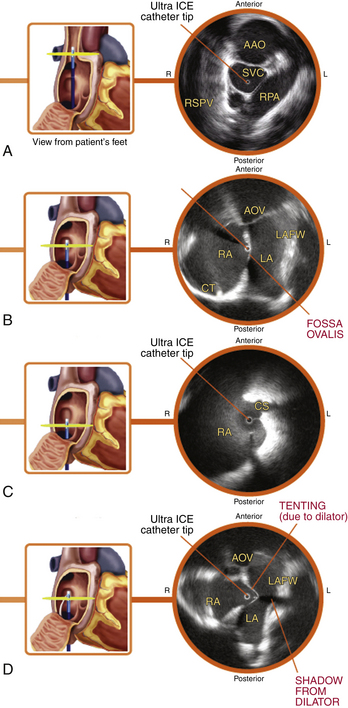
Using the Acunav Catheter
A femoral venous approach is used for the insertion of the ICE catheter. The catheter is advanced to the RA under fluoroscopy guidance. ICE 2-D 90-degree sector scanning demonstrates a cross-sectional anatomical view oriented from the tip to the shaft of the imaging catheter’s active face.40 The left-right (L-R) orientation marker indicates the catheter’s shaft side. When the L-R orientation marker is set to the operator’s right, the craniocaudal axis projects left to right from the image and the posterior to anterior axis projects from the image top to bottom. Changing the L-R marker to the left side inverts the image but does not change the top-to-bottom image orientation. Image orientation can be adjusted to visualize targeted structures by simple catheter advancement or withdrawal, by tip deflection in four directions (anteroposterior and left-right), or by catheter rotation.
The AcuNav ICE catheter includes variable ultrasound frequency (5.5, 7.5, 8.5, and 10 MHz). Increasing ultrasound frequency improves axial image resolution; however, tissue penetration decreases and reduces imaging depth. An ultrasound frequency of 7.5 MHz is useful for imaging most cardiac structures. Frequency can then be increased (to 8.5 or 10 MHz) for imaging near-field structures, or decreased (to 5.5 MHz) for imaging far-field structures.40
Right Atrial Targets
All RA targets are visualized by advancing or withdrawing the ICE catheter to an appropriate level within the RA and rotating the catheter to bring the target into view. The best resolution of near-field and midfield structures is obtained at an 8.5-MHz frequency. Once the catheter is advanced into the mid-RA with the catheter tension controls in neutral position (the ultrasound transducer oriented anteriorly and to the left), the RA, tricuspid valve, and RV are viewed. This is called the home view (see Fig. 4-13 and Video 5),  and it can serve as a starting point; whenever the operator gets lost, he or she can go back to the home view and start over. From the home view, counterclockwise rotation of the catheter brings the RA appendage into view, whereas anterior deflection of the catheter tip toward the RV allows visualization of the tricuspid valve and cavotricuspid isthmus (Fig. 6-21). The superior crista terminalis is visualized when the catheter is advanced to the RA-SVC junction in an anterior direction.41
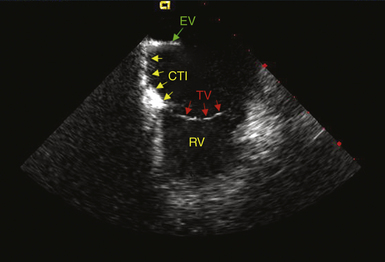
Interatrial Septum
Gradual clockwise rotation of a straight catheter from the home view allows sequential visualization of the aortic root and the pulmonary artery, followed by the CS, mitral valve, the LA appendage orifice, and a cross-sectional view of the fossa ovalis (see Fig. 4-13 and Video 5).  The mitral valve and interatrial septum are usually seen in the same plane as the LA appendage. Posterior deflection, right-left steering, or both, of the imaging tip in the RA is occasionally required to optimize visualization of the fossa ovalis; the tension knob (lock function) can then be used to hold the catheter tip in position. Further clockwise rotation beyond this location demonstrates images of the left PV ostia (see Fig. 4-13). The optimum ICE image to guide transseptal puncture demonstrates adequate space behind the interatrial septum on the LA side and clearly identifies adjacent structures (see Fig. 4-14 and Video 6)
  .
.
Left Atrial Structures
A 7.5- or 8.5-MHz imaging frequency optimizes visualization of LA structures and PVs beyond the interatrial septum. PV imaging is possible by first visualizing the membranous fossa from a mid-RA to low-RA catheter tip position. With clockwise catheter rotation, the LA appendage can be visualized, followed by long-axis views of the left superior and inferior PVs (Fig. 6-22; see also Fig. 4-13). Further clockwise rotation of the catheter brings the orifices of the right superior and inferior PVs into view. The ostia of these veins are typically viewed en face, yielding an owl’s eyes appearance at the vein’s orifice. The LA appendage can also be visualized with the transducer positioned in the CS.
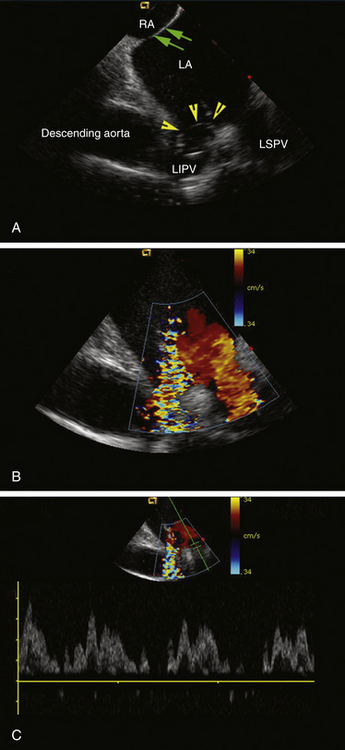
Left and Right Ventricular Targets
Imaging of each targeted LV structure at depths of 6 to 15 cm is accomplished with the catheter tip in a low-RA position. When the catheter transducer is placed near the fossa and oriented anteriorly and to the left, the LV outflow tract (LVOT) and truncated LV are imaged. With clockwise rotation and slight adjustment of the transducer level, the mitral valve and LV apex can be viewed. To image the mitral valve in a long-axis, two-chamber view (LA, mitral valve, and LV), a mild degree of apically directed catheter tip deflection can be required. The RVOT, LVOT, and aortic root with coronary artery ostia can be imaged by advancing the catheter in the RA to the level of the outflow tracts (mid-RA), with an appropriate deflection to the right. The aortic valve can also be imaged in its cross section from this region (Fig. 6-23). A long-axis view of the LV can also be visualized by advancing the catheter with its anteriorly deflected tip into the RV with clockwise rotation against the interventricular septum (Fig. 6-24). Further clockwise rotation or right-left steering of the catheter tip allows a short-axis view of the LV, as well as the mitral valve (see Fig. 6-24). Pericardial effusions usually can be readily identified from these views. Withdrawing the catheter back to the base of the RVOT and rotating the shaft allow the RVOT to be visualized in its long axis, with a cross-sectional view of the pulmonic valve.40
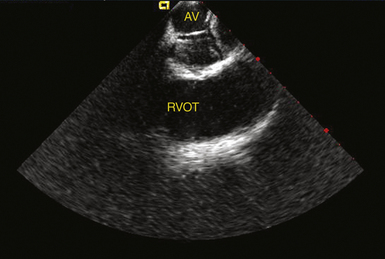
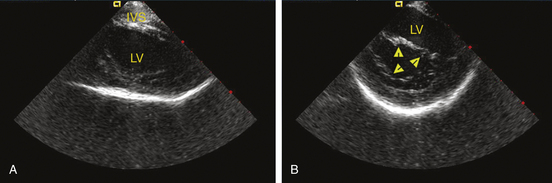
Clinical Implications
Previous human applications of ICE have been limited to those generated by the mechanical rotation of a single piezoelectric element in 6 to 10 Fr catheters. Miniaturization of these elements required the use of higher 10- to 20-MHz transducer frequencies, thus limiting ultrasound penetration to surrounding cardiac tissues. This technology has been applied to the imaging of RA structures in humans and animals, membranous fossa ovalis, crista terminalis, eustachian ridge, tricuspid annulus, and the SVC-RA junction in the region of the sinus node. However, visualization of the LA and PV ostia is limited using this system because of limited penetration depth, except when it is introduced directly into the LA (transseptally).
Several practical uses for ICE have emerged in the setting of EP procedures, including the following: (1) assessment of catheter contact with cardiac tissues; (2) determination of catheter location relative to cardiac structures (specifically useful in otherwise difficult to localize areas; e.g., the PVs); (3) guidance of transseptal puncture, particularly in the setting of complex or unusual anatomy; (4) facilitation of deployment of mapping or ablation systems (e.g., PV encircling devices, noncontact mapping systems, and basket technologies); (5) visualization of evolving lesions during RF energy delivery; both changing tissue echogenicity and microbubbles reflect tissue heating, with the latter providing a signal for energy termination; (6) evaluation of cardiac structures before and after intervention (e.g., cardiac valves and PVs); (7) assessment of PV anatomy, dimensions, and function via 2-D anatomical imaging and Doppler physiological measurements; (8) assessment of complications (e.g., tamponade, electromechanical dissociation, or thrombus formation; see Fig. 32-1)42; (9) identification of the anatomical origin of certain arrhythmias (e.g., ICE can facilitate ablation of inappropriate sinus tachycardia or sinus nodal reentrant tachycardia); and (10) definition of the proximity of the catheter tip and coronary arteries (during mapping and ablation of arrhythmias originating from the aortic cusp).
As mentioned previously, the CARTOSound Image Integration Module (Biosense Webster, Inc.) incorporates the electroanatomical map to an ICE volume map of the cardiac chamber derived from a phased-array transducer catheter incorporating a position sensor (SoundStar, Biosense Webster, Inc.), which may be used as a stand-alone tool to guide navigation and ablation or as a facilitator of CT/MRI image integration. This navigation approach has been successfully utilized for catheter ablation of AF. Additionally, 3-D ultrasound images can potentially yield anatomically accurate chamber geometries and identify scar in the LV (both by wall thickness and motion) to facilitate substrate mapping and ablation of ischemic VT.12,13
Computed Tomography and Magnetic Resonance Imaging
Fundamental Concepts
Image Acquisition
Cross-sectional or axial CT or MRI images are acquired at sufficient resolution to delineate cardiac structures less than 1 to 2 mm in thickness. Images at 0.625-mm thickness can be reconstructed from images obtained at 1.25-mm intervals with currently available multirow helical scanners. A simultaneous ECG is recorded to assign the source images retrospectively to the respective phases of the cardiac cycle. MRI images are similarly obtainable, although at a slightly lower spatial resolution. Reconstructing any cardiac chamber in 3-D from the axial images is performed using any one of various software packages.43
Image Segmentation
Image segmentation refers to the process of extracting the 3-D anatomy of individual cardiac structures from its surrounding structures. Methods of image segmentation include thresholding, boundary detection, and region identification. Thresholding involves assigning pixels with intensities lower than a threshold to one class and the remaining pixels to a different class. Connecting adjacent pixels of the same class then forms regions. Boundary differentiation methods use information about intensity differences between adjacent regions to separate the regions from each other. Region identification techniques then form regions by combining pixels of similar properties.43–45 For cardiac ablation procedures, the volume of cardiac structures is extracted from the whole-volume data set using a computerized algorithm that differentiates the boundary between the blood pool (which is high in contrast) and the endocardium (which is not contrast enhanced). This allows for clear differentiation between the chamber lumen and endocardial wall (Fig. 6-25). Subsequently, the volumes of individual cardiac structures are separated from each other with the use of another algorithm capable of detecting their boundaries. Using a third algorithm, the segmented volumes for individual cardiac structures are extracted as 3-D surface reconstructions. The segmented volumes can be viewed from an external perspective or from within the chamber using virtual endoscopic or cardioscopic displays. These images, in addition to providing a road map for ablation, can also be used for registration (see Fig. 6-25).
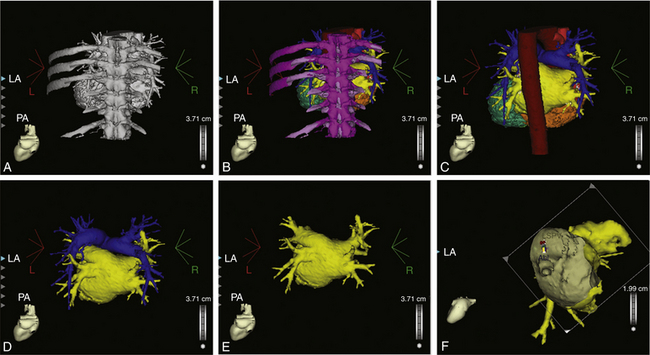
Image Registration
Although the segmented structures are highly useful for visualizing the cardiac structures and characteristics of the tissue forming that structure, they do not convey the physiology of an arrhythmia. Integrating that physiology, as captured by electroanatomical or noncontact mapping with the spatial information contained in the CT or MRI images, requires registration of activation or voltage data to an appropriate location on a 3-D representation of a chamber. This is of critical importance in that it establishes the relationship between anatomy and physiology as required for the structure- and activity-based understanding of arrhythmias and for enabling image-guided intervention. Image registration refers to superimposing the 3-D CT/MRI surface reconstruction onto the real-time electroanatomical maps yielded by the 3-D mapping system (see Fig. 6-10).
During registration, the assumption is made that the anatomy of the organ being registered has not changed. Two computerized algorithms are used to accomplish the image registration process: landmark registration and surface registration. Landmark registration aligns the 3-D CT/MRI image reconstruction with corresponding electroanatomical maps through linking two sets of corresponding fiducial points in each set of the images to be registered. Under the guidance of fluoroscopy or ICE, or both, at least three landmark pairs are created by real-time catheter tip locations on the interventional system being used for registration and then placed on their estimated locations on the 3-D CT/MRI image reconstructions. Using more landmark points increases the accuracy of the registration process. Surface registration is an algorithm that attaches the acquired endocardial points to the closest CT/MRI surface to compose the best fit of the two sets of images by minimizing the average distance between the landmarks, and the distance from multiple endocardial locations, to the surface of 3-D CT/MRI image reconstructions. Surface registration complements landmark registration to improve the registration accuracy. However, because of surface indentation and potentially missed areas during mapping, the acquired electroanatomical map does not represent the perfect anatomy of the cardiac chamber.43–45
Computed Tomography Overlay
A novel application (EP Navigator prototype, Philips Healthcare, Best, The Netherlands) has been developed to superimpose a preacquired segmented 3-D CT image of the LA over real-time fluoroscopy system (“CT overlay”) to help in guiding ablation of atrial arrhythmias, particularly AF. This application can be used on monoplane or biplane fluoroscopy. It permits fluoroscopy-directed guiding of an ablation catheter and diagnostic catheters in a virtual 3-D model of the LA, and subsequent tagging of ablation sites on the registered 3-D image without the simultaneous use of an electroanatomical mapping system, thus facilitating the creation of continuous lines and returning to critical ablation sites. Furthermore, it is feasible to identify and segment the esophagus on the CT scan, which can subsequently be overlaid on the fluoroscopic images along with the cardiac structures.46–48
Image Integration Procedure
Image Registration Using Cartomerge
The preacquired CT/MRI digital imaging data are imported by a CD into the CARTO XP system equipped with commercially available software (CARTOMerge Image Integration Software Module) that allows structures of interest to be easily and quickly segmented and reconstructed in 3-D. The segmented images are then imported into the real-time mapping system. Once created using the CARTO system (as described previously), the electroanatomical map of the cardiac chamber is “fused” to the CT/MRI. The most frequently used registration technique is a combination of landmark registration and surface registration. Landmark registration involves the 3-D orientation of the imported CT/MRI image on the x, y, and z axes and requires the acquisition of at least three noncollinear endocardial landmark points using the mapping-ablation catheter. The precise location of these on the 3-D image is a critical factor in this technique and remains challenging. Biplane fluoroscopy, angiography, and ICE can be used to facilitate identification of the landmark point. Catheter contact is ensured by fluoroscopy visualization of the catheter mobility in relation to the cardiac motion and by a discrete electrogram. The estimated corresponding locations of these endocardial landmark points are then marked on the imported 3-D CT/MRI image, thus creating a landmark pair, with one landmark point on the real-time electroanatomical map and the other on the 3-D CT/MRI image.
Landmark registration approximates the electroanatomical map to the 3-D CT/MRI surface reconstruction by matching the landmark pair. Surface registration fits the 3-D CT/MRI surface reconstruction with the electroanatomical map points by rendering the smallest average distance of the two datasets. Although the registration of surface points should improve alignment of the two images, registering points from the entire surface of the cardiac chamber involves the risk of incorporating errors related to potential indentation of the chamber wall and distortion of chamber geometry resulting from the pressure of the mapping catheter on the most mobile regions. The mapping system then provides an average tip-to-surface distance, which ideally should be less than 2 mm. While manipulating the catheter during ablation, the projected catheter distance to the surface is used as an additional guide to assess catheter contact. This can be complemented by information from electrograms recorded by the catheter, fluoroscopy, and ICE.16
Image Registration Using Cartosound
Registration is based on the best fit between the cardiac chamber surface reconstruction obtained with each ICE contour and the corresponding CT/MRI image, and it is not based on the LA volume obtained with ICE and the corresponding CT/MRI image.12 ICE-guided focused endocardial surface registration seems to be superior to landmark registration in achieving a better alignment between the CT/MRI image and the electroanatomical map. The 3-D ultrasound images can help create anatomically accurate, real-time chamber geometries and eliminate chamber deformity (as often happens with contact mapping), potentially to yield more accurate CT/MRI registration.12,13
Image Registration Using NavX Fusion
The cardiac chamber of interest is segmented and reconstructed in 3-D from CT/MRI slices using EnSite Verismo software. The 3-D virtual anatomical geometry of the cardiac chamber is created using NavX Fusion (as described previously). The CT/MRI reconstruction of the mapped cardiac chamber is displayed on a split screen and used to guide finer anatomical definition with the ablation catheter and help edit the virtual 3-D geometry to eliminate “false space.” Subsequently, “field scaling” is applied to the geometry to compensate for variations in impedance between the heart chambers and venous structures and render the geometry and navigational space more physiologically relevant and to more closely resemble the CT/MRI image. The field scaled geometry is fused to the CT/MRI in two stages, termed primary (rigid) fusion and secondary (dynamic) fusion. Primary fusion uses three fiducial (i.e., landmark) corresponding points on the created geometry and the CT/MRI image to superimpose, or lock together, both images (Fig. 6-26). These points are chosen to ensure reasonable 3-D anatomical separation and allow orientation of the CT/MRI, but the registration error is high. Therefore, secondary fusion points or fiducials are applied to the primary fused geometry at sites of local mismatch between the two superimposed geometries.
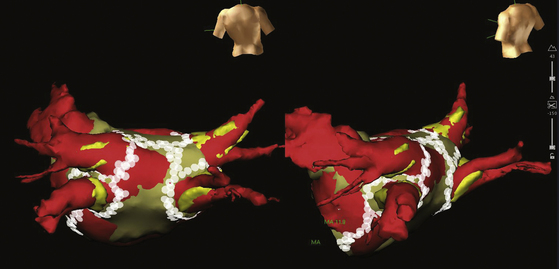
In this unique component of image fusion, the created geometry surface is molded to the CT/MRI surface while also “bending” the 3-D navigation space within the geometry. This process is continued, adding supplemental (usually more than 15) fiducial point pairs until good correspondence between the NavX geometry and CT/MRI models is achieved. For example, if the anterior wall of the geometry is fused anteriorly to the CT/MRI, the catheter location also will be moved so that, when the catheter is repositioned on the anterior wall after fusion, it should be visualized on the CT/MRI surface and not within the bounds of the original prefusion geometry. Although the principle of CT/MRI image integration is common to both the EnSite NavX Fusion and CARTOMerge systems, there is a significant difference in how registration is achieved.
As described previously, the EnSite system uses a dynamic registration process (with four or more fiducials) to optimize both rotation and stretching of the surface of the NavX geometry to match the CT/MRI. With the CARTOMerge system, the whole registration process is rigid with rotation of the CT/MRI to minimize the distance between the surface of the anatomical model generated and that of the CT, but no stretching of the model itself. Despite this difference, the registration error is similar with both techniques (CARTOMerge, 2.3 ± 1.8 mm, versus EnSite NavX Fusion, 3.2 ± 0.9 mm).19,49
Image Registration Using Fluoroscopy (CT Overlay)
After registration and locking, the 3-D CT image is always depicted at the same angle as the fluoroscopy (i.e., the CT-generated volume rotates on the screen following the rotation of the C-arm), thus allowing for constant visualization of the CT and fluoroscopic images under the same viewing angle. The transparency of the overlaid CT 3-D volume is adjustable, to allow visualization of the catheters in the fluoroscopic image. In addition, the 3-D image can be clipped with a customizable cutting plane, to permit internal (endoscopic) views. Moreover, tags can be placed on the surface of the registered 3-D image to mark ablation sites and other sites of interest.46–48
Clinical Implications
CT and MRI imaging approaches have already been of significant benefit in AF catheter ablation procedures. These approaches provide critical information regarding the number, location, and size of PVs, as needed for planning the ablation and selecting appropriately sized ablation devices.50 Resulting images also identify branching patterns of potentially arrhythmogenic PVs, disclose the presence of fused superior and inferior veins into antral structures, and clarify the potentially confounding origins of far-field electrograms that masquerade as PV potentials. CT has also been used for postablation evaluation for PV stenosis.
The 21st century has also seen the rapid development of integrated, anatomy-based mapping and ablation. This progress has been driven by a realization of both the critical coupling and dependence of arrhythmias on their underlying anatomy and the limitations of surrogate geometries of contemporary mapping systems for reflecting that anatomy. Over this same time frame, rapid CT and MRI imaging systems have emerged as the mainstays of imaging in the EP laboratory and have been used to plan or guide ablation. Each company is actively working on image incorporation into its system.11,47,51 Helical 16- to 64-row CT and MRI studies provide a broad anatomy library of an individual patient at one point in time. Segmented CT volumes can be downloaded on the CARTO and NavX platforms. These systems are able to register the surrogate map fully onto actual CT and MRI anatomy; they also enable integration of electroanatomical mapping with preacquired CT and MRI images and allow real-time visualization of the location and orientation of the catheter tip within the registered CT anatomical framework (see Figs. 6-10 and 6-25).4,16,43–45
 nonidiopathic VT ablation, and ablation of intraatrial reentrant tachycardias following corrective surgery for congenital heart diseases. Initial experience has shown that the registered CT and MRI of LA reconstructions can provide accurate information on the catheter tip location in relation to the important LA structures, such as the PV ostium and LA appendage. The real-time update of the catheter tip location and the marking of ablation lesions on the detailed 3-D image can potentially improve the quality of lesion sets, reduce complications, and shorten procedure and fluoroscopy times.
Registration of a preacquired 3-D CT image on fluoroscopy potentially combines the accuracy of CT with the real-time fluoroscopy to guide catheter ablation of AF. Compared with an established and widely used electroanatomical mapping technique for PV antrum isolation, procedural duration can be shortened significantly without a concomitant increase in radiation burden. An additional advantage to CT overlay is the ability to perform a quick repeat registration in case of major changes in a patient’s position. However, unlike the CARTO system, which provides notification for significant patient movements, the operator needs to be alert on discrepancies between catheters and anatomy and must check registration in case of suspected movement. Additionally, with the CARTO system, one can return to the catheter-based LA reconstruction without Merge, which may be more accurate than the CT image.46–48
Limitations
Although CT and MRI provide exquisite images of the underlying structures relevant in arrhythmogenesis, they are limited by the requirement of off-line generation of the CT and MRI libraries and the inability to reflect all phases of the cardiac cycle during an arrhythmia. Because CT and MRI is performed prior to the ablation procedure, registration error can arise from interval changes in the heart size because of differences in rhythm, rate, contractility, or fluid status. Performing image registration and ablation procedures within 24 hours after CT and MRI scans and CT and MRI image acquisition and image registration during the same rhythm may help limit interval changes. This situation is confounded by the inevitable imperfection of the created virtual geometry of the cardiac chamber. These factors can impede the clinical utility of image integration in approximately 25% of patients.52
Furthermore, the static images of the registered CT and MRI reconstructions provide little information on true catheter-tissue contact. In addition, because the initial landmark points are picked up by the operator using fluoroscopy, the exact location of these points in the 3-D space can be deceptive, and registration errors in the identification of these points are very common, even when angiography and ICE are used for guidance. In addition, because multiple points are needed for surface registration, the accuracy of chamber reconstruction is directly dependent on the number of points taken and the position of the catheter, thus adding a significant amount of time and a manual component to the process.4,43,47,53
To overcome some of these limitations, fusion of real-time ICE images with those generated by CT and MRI scans is becoming available and can provide a more real-time interactive display, as well as real-time information on catheter-tissue contact and RF lesion formation. In addition, it is highly likely that subsequent generations of CT or MRI scanners will be sufficiently fast to permit real-time or almost real-time imaging for interventional guidance. Studies have demonstrated the ability to merge the 3-D CT and MRI images with real-time 2-D fluoroscopy images for navigation on virtual anatomy, because the images can be corrected against the background of real-time fluoroscopy as needed.4,47,54
The accuracy of registration remains the subject of investigation. 3-D image integration aims at improving the operator’s perception of the catheter spatial location in relation to the patient’s cardiac structures. However, the success of this approach is primarily dependent on the accuracy of the image integration process. Even if the 3-D cardiac chamber image provides an accurate model of a matched phase of the chamber volume at the time of the procedure, it needs to be accurately registered to the procedural chamber orientation to provide reliable navigation. Current registration algorithms depend on accurate catheter geometry; this requires an accurate update of 3-D coordinates of the catheter tip, as recorded and displayed on the computer image. The exact location of the initial fiducial points picked by the operator using fluoroscopy in the 3-D space may be deceptive. Movement of the catheter tip is complex and is affected by wall motion and respiration. Point collection should therefore be gated to the same phase of the cardiac and respiratory cycle as the CT or MRI scan. Additionally, catheter tip pressure can cause tenting of the chamber wall, thereby distorting the chamber geometry. Stability of catheter contact with the endocardial wall should also be optimized. Catheter contact can vary with the type of ablation catheter and introducer sheath, as well as the degree of regional wall motion; for example, the mitral annulus and appendage are more dynamic than the posterior atrial wall. Ideally, geometry points should be collected from stable catheter positions. The operator can then accept good points or delete bad points. This process can be aided by fluoroscopy, electrogram morphology, and confirmation of the catheter tip location on ICE. However, the process still remains a subjective art.43,53
Several studies of AF catheter ablation have reported success using different integration modalities with CT or MRI, by using either noncontact mapping or fluoroscopy as a second integrated image. The registration technique has also varied, including three- or four-point registration or surface registration. Alternatively, a single point and the surface have been used as well (visual alignment). Different techniques for point localization have been reported, including fluoroscopy alone, angiography, or ICE for direct visualization of the catheter at the designated site. The mean error for surface registration in most studies varied between 1.8 and 2.7 mm; one study that compared the landmark registration with and without surface registration found that surface registration increases the accuracy of image integration. On the other hand, a more recent study found that the most accurate landmark registration is achieved when posterior points are acquired at the PV-LA junction, whereas points acquired on the anterior wall, LA appendage, or other structures outside the LA, such as the CS or SVC, afford less accuracy. In addition, surface registration usually results in shifting the landmark points away from the initially acquired position on the corresponding PVs using ICE.55 Furthermore, accurate surface registration does not guarantee accurate alignment with the important anatomical structures. Another report found that serious inaccuracies of the CARTOMerge image integration algorithms still exist, despite using the precautions discussed earlier.56 Importantly, registration quality has not yet been shown necessarily to correlate with ablation accuracy.12,56
It is important to recognize that the registered CT model still is prone to subjective inaccuracies and should remain only a guide, and a combination of fluoroscopy and the electrogram appearance must also be used in assessing contact with the endocardial surface and the true position of the catheter. Although 3-D mapping systems with image integration have been widely adopted for ablation procedures, many of their theoretical benefits remain unproven; therefore, these systems should remain just one type among the tools facilitating complex catheter ablation procedures and should not distract the electrophysiologist from established EP principles and endpoints.57
Three-Dimensional Rotational Angiography
Fundamental Concepts
3-D rotational angiography combines the accuracy of direct angiography with the benefits of computer animation and supplements conventional 2-D fluoroscopy to provide real-time representation of cardiac structures. Its feasibility and clinical utility in the setting of LA imaging and AF ablation have been described. This method provides rapid intraprocedural visualization of LA anatomy and of important nearby structures such as the esophagus. Prior studies have demonstrated that the diagnostic value of 3-D rotational angiography is comparable to that of CT imaging.58,59
The principle of 3-D rotational angiography is similar to the CT scan, in which images acquired from different angles are reconstructed to a 3-D image. The C-arc x-ray system is rotated around the patient over 240 degrees to create a circumferential run of many exposure images of the region of interest distributed over the 360-degree (or similar) trajectory. To improve differentiation of the cardiac structures, the cardiac chamber of interest can be opacified with a contrast medium injected either directly into the LA or indirectly into the right side of the heart, in which case rotation of the fluoroscopic system is started after passage of the contrast medium through the lungs. The esophagus can be opacified using a barium paste prior to the image acquisition. The rotational angiographic images of the LA, PVs, esophagus, and other surrounding structures can be segmented and registered with the fluoroscopy on a specialized computer system (EP Navigator, Philips Healthcare or similar system, such as DynaCT Cardiac, Siemens, Forchheim, Germany). The latest version of the software allows registration of the segmented 3-D volume on a live fluoroscopy screen.60,61
Imaging Technique
First, the patient must be properly positioned, and the structure of interest must be isocentered. The patient’s arms may be extended above the head to reduce mass artifact. Oral contrast (5 mL barium sulfate esophageal cream) is administered immediately prior to initiation of the rotational run, and once it is visualized in the esophagus, intravenous contrast may be injected into the main pulmonary artery, RV, RA, or IVC via a 6 Fr pigtail catheter to obtain adequate levophase opacification of the LA. In general, contrast injection at the IVC-RA junction results in adequate LA and PV opacification in most patients. In addition, this method is technically simpler and potentially safer than more downstream injections. Higher amounts of contrast and longer injection time are generally used with RA and IVC injections than with main pulmonary artery injection. Direct contrast injection into the LA was described and seemed to provide great detail of LA and PV anatomy, but it required a high-dose (30 to 50 mg) adenosine injection immediately prior to the rotational run. Transient cessation of contractions prevents anterograde washout of contrast from the PVs, thus keeping them opacified during the rotational run. Deep sedation, intubation, and RV pacing are usually needed to counteract apnea and asystole produced by adenosine. Additionally, high doses of adenosine are not tolerated by the conscious patient because of the induced flush and dyspnea. Given such complexities, this method may be more difficult to implement in clinical practice.58–61
The current software version allows for the inner surface of the LA and PVs to be visualized (endoscopic view), further aiding the physician when navigating around the LA. Ablation points can be marked on the overlaid 3-D rotational angiography model to track the completeness of lesions. LA proximity to the esophagus can be evaluated and catheter ablation modified as necessary to avoid ablation near the esophagus.62–64
Clinical Implications
One of the advantages of 3-D rotational angiography over conventional 2-D fluoroscopy is the capability of depth perception and volume appreciation. 3-D rotational angiography provides direct visualization of cardiac structures, whereas electroanatomical methods require either operator imagination or confirmation via other imaging modalities, such as CT. Although pre-procedure CT/MRI images provide visualization of the LA and the PVs and facilitate integration with the electroanatomical mapping systems, a significant drawback is the time lag to the actual procedure. Interval changes in volume status, respiratory phase, and cardiac rhythm can result in temporal changes in the size and location of the anatomical structures between the time of image acquisition and the registration process. These limitations may be overcome by intraprocedural acquisition of the LA volume and PV anatomy; 3-D rotational angiography can be performed immediately before ablation using the same fluoroscopic imaging system, thus providing realistic anatomical detail at the time of the intervention.58–60
Other advantages of 3-D rotational angiography technology include quick and accurate repeat registration of the 3-D volume in case of patient movement not requiring a new map, as is frequently the case with electroanatomical methods.61,62
Despite exclusively fluoroscopic guidance of the ablation catheter using the 3-D rotational angiography technology, total fluoroscopy time and fluoroscopy time for PV isolation have been comparable to reported times for AF ablation procedures performed with different nonfluoroscopic mapping systems. Additionally, 3-D rotational angiography has the potential to eliminate the need for pre-procedural CT/MRI imaging, and the radiation exposure is less than that of CT scanning (estimated at 2.2 ± 0.2 mSv exposure with one rotational angiography run).63,64
Limitations
One shortfall of 3-D rotational angiography is the absence of streaming electrogram data. Additionally, because of the lack of respiratory compensation in the 3-D rotational angiography-fluoroscopy fusion, the end-expiratory phase is used as reference for monitoring the position of the ablation catheter tip during RF application.58,59
Proper isocentering is important to obtain adequate 3-D rotational angiography. Concerns have been raised about the frequent difficulty in fitting the LA and PVs into one rotational run with the commonly used detector. However, with proper isocentering, even a dilated LA and the PV anatomy can be adequately imaged; truncation may occur more easily if the structures of interest are not at the center of rotation.58
3-D rotational angiography is quickly evolving into a true online imaging tool; however, further refinements are needed before it can be widely adopted. These include incorporation of respiratory and cardiac motion compensation and the ability to display electrogram data on the 3-D shell (activation timing, scar and voltage maps, and dominant frequency). Further development is likely to involve several aspects of the method: automation of the workflow, injection protocols, and software; imaging of cardiac structures other than the LA and development of methods to visualize highly mobile structures such as the ventricles; and integration of anatomical 3-D rotational angiography information with electrogram data.58–60
Conclusions
However, the use of fluoroscopy for these purposes can be problematic for several reasons, including the following: (1) intracardiac electrograms cannot be associated accurately with their precise location within the heart; (2) the endocardial surface is invisible using fluoroscopy, and target sites may be approximated only by their relationship with nearby structures, such as ribs, blood vessels, and the position of other catheters; (3) because of the limitations of 2-D fluoroscopy, navigation is not exact, it is time-consuming, and it requires multiple views to estimate the 3-D location of the catheter; (4) the catheter cannot accurately and precisely be returned to a previously mapped site; and (5) the patient and medical team are exposed to radiation.
1. Sanders P., Hocini M., Jais P., et al. Characterization of focal atrial tachycardia using high-density mapping. J Am Coll Cardiol. 2005;46:2088-2099.
2. Markides V., Koa-Wing M., Peters N. Mapping and imaging. In: Zipes DP, Jalife J., editors. Cardiac electrophysiology: from cell to bedside. ed 5. Philadelphia: Saunders; 2009:897-904.
3. Schilling R., Friedman P., Stanton M. Mathematical reconstruction of endocardial potentials with non-contact multielectrode array. In Field clinical training manual. St. Paul, Minn.: Endocardial Solutions; 2006.
4. Chinitz L.A., Sethi J.S. How to perform noncontact mapping. Heart Rhythm. 2006;3:120-123.
5. Tai C.T., Chen S.A. Noncontact mapping of the heart: how and when to use. J Cardiovasc Electrophysiol. 2009;20:123-126.
6. Huang J.L., Tai C.T., Lin Y.J., et al. Substrate mapping to detect abnormal atrial endocardium with slow conduction in patients with atypical right atrial flutter. J Am Coll Cardiol. 2006;48:492-498.
7. Sivagangabalan G., Pouliopoulos J., Huang K., et al. Comparison of electroanatomic contact and noncontact mapping of ventricular scar in a postinfarct ovine model with intramural needle electrode recording and histological validation. Circ Arrhythm Electrophysiol. 2008;1:363-369.
8. Packer D.L. Three-dimensional mapping in interventional electrophysiology: techniques and technology. J Cardiovasc Electrophysiol. 2005;16:1110-1116.
9. Markowitz S.M., Lerman B.B. How to interpret electroanatomic maps. Heart Rhythm. 2006;3:240-246.
10. Soejima K. How to troubleshoot the electroanatomic map. Heart Rhythm. 2010;7:999-1003.
11. Sra J., Krum D., Hare J., et al. Feasibility and validation of registration of three-dimensional left atrial models derived from computed tomography with a noncontact cardiac mapping system. Heart Rhythm. 2005;2:55-63.
12. Schwartzman D., Zhong H. On the use of CartoSound for left atrial navigation. J Cardiovasc Electrophysiol. 2010;21:656-664.
13. Bunch T.J., Weiss J.P., Crandall B.G., et al. Image integration using intracardiac ultrasound and 3D reconstruction for scar mapping and ablation of ventricular tachycardia. J Cardiovasc Electrophysiol. 2010;21:678-684.
14. Esato M., Hindricks G., Sommer P., et al. Color-coded three-dimensional entrainment mapping for analysis and treatment of atrial macroreentrant tachycardia. Heart Rhythm. 2009;6:349-358.
15. Santucci P.A., Varma N., Cytron J., et al. Electroanatomic mapping of postpacing intervals clarifies the complete active circuit and variants in atrial flutter. Heart Rhythm. 2009;6:1586-1595.
16. Della B.P., Fassini G., Cireddu M., et al. Image integration-guided catheter ablation of atrial fibrillation: a prospective randomized study. J Cardiovasc Electrophysiol. 2009;20:258-265.
17. Linton N.W., Koa-Wing M., Francis D.P., et al. Cardiac ripple mapping: a novel three-dimensional visualization method for use with electroanatomic mapping of cardiac arrhythmias. Heart Rhythm. 2009;6:1754-1762.
18. Earley M.J., Showkathali R., Alzetani M., et al. Radiofrequency ablation of arrhythmias guided by non-fluoroscopic catheter location: a prospective randomized trial. Eur Heart J. 2006;27:1223-1229.
19. Brooks A.G., Wilson L., Kuklik P., et al. Image integration using NavX Fusion: initial experience and validation. Heart Rhythm. 2008;5:526-535.
20. Pappone C., Vicedomini G., Manguso F., et al. Robotic magnetic navigation for atrial fibrillation ablation. J Am Coll Cardiol. 2006;47:1390-1400.
21. Schmidt B., Tilz R.R., Neven K., et al. Remote robotic navigation and electroanatomical mapping for ablation of atrial fibrillation: considerations for navigation and impact on procedural outcome. Circ Arrhythm Electrophysiol. 2009;2:120-128.
22. Haghjoo M., Hindricks G., Bode K., et al. Initial clinical experience with the new irrigated tip magnetic catheter for ablation of scar-related sustained ventricular tachycardia: a small case series. J Cardiovasc Electrophysiol. 2009;20:935-939.
23. Wood M.A., Orlov M., Ramaswamy K., et al. Remote magnetic versus manual catheter navigation for ablation of supraventricular tachycardias: a randomized, multicenter trial. Pacing Clin Electrophysiol. 2008;31:1313-1321.
24. Vollmann D., Luthje L., Seegers J., et al. Remote magnetic catheter navigation for cavotricuspid isthmus ablation in patients with common-type atrial flutter. Circ Arrhythm Electrophysiol. 2009;2:603-610.
25. Di B.L., Fahmy T.S., Patel D., et al. Remote magnetic navigation: human experience in pulmonary vein ablation. J Am Coll Cardiol. 2007;50:868-874.
26. Kim A.M., Turakhia M., Lu J., et al. Impact of remote magnetic catheter navigation on ablation fluoroscopy and procedure time. Pacing Clin Electrophysiol. 2008;31:1399-1404.
27. Wazni O.M., Barrett C., Martin D.O., et al. Experience with the Hansen robotic system for atrial fibrillation ablation: lessons learned and techniques modified: Hansen in the real world. J Cardiovasc Electrophysiol. 2009;20:1193-1196.
28. Saliba W., Reddy V.Y., Wazni O., et al. Atrial fibrillation ablation using a robotic catheter remote control system: initial human experience and long-term follow-up results. J Am Coll Cardiol. 2008;51:2407-2411.
29. Di B.L., Wang Y., Horton R., et al. Ablation of atrial fibrillation utilizing robotic catheter navigation in comparison to manual navigation and ablation: single-center experience. J Cardiovasc Electrophysiol. 2009;20:1328-1335.
30. Schmidt B., Chun K.R., Tilz R.R., et al. Remote navigation systems in electrophysiology. Europace. 2008;10(Suppl 3):iii57-iii61.
31. Di B.L., Natale A., Barrett C., et al. Relationship between catheter forces, lesion characteristics, “popping,” and char formation: experience with robotic navigation system. J Cardiovasc Electrophysiol. 2009;20:436-440.
32. Finlay D.D., Nugent C.D., McCullagh P.J., Black N.D. Mining for diagnostic information in body surface potential maps: a comparison of feature selection techniques. Biomed Eng Online. 2005;4:51.
33. Taccardi B., Punske B. Body surface potential mapping. In: Zipes D.P., Jalife J., editors. Cardiac electrophysiology: from cell to bedside. ed 5. Philadelphia: Saunders; 2009:803-811.
34. Ghanem R.N., Jia P., Ramanathan C., et al. Noninvasive electrocardiographic imaging (ECGI): comparison to intraoperative mapping in patients. Heart Rhythm. 2005;2:339-354.
35. Zhang X., Ramachandra I., Liu Z., et al. Noninvasive three-dimensional electrocardiographic imaging of ventricular activation sequence. Am J Physiol Heart Circ Physiol. 2005;289:H2724-H2732.
36. Ghosh S., Rhee E.K., Avari J.N., et al. Cardiac memory in patients with Wolff-Parkinson-White syndrome: noninvasive imaging of activation and repolarization before and after catheter ablation. Circulation. 2008;118:907-915.
37. Rudy Y. Cardiac repolarization: insights from mathematical modeling and electrocardiographic imaging (ECGI). Heart Rhythm. 2009;6(Suppl):S49-S55.
38. Wang Y., Schuessler R.B., Damiano R.J., et al. Noninvasive electrocardiographic imaging (ECGI) of scar-related atypical atrial flutter. Heart Rhythm. 2007;4:1565-1567.
39. Ghanem R.N. Noninvasive electrocardiographic imaging of arrhythmogenesis: insights from modeling and human studies. J Electrocardiol. 2007;40(Suppl):S169-S173.
40. Ren J., Marchlinski F. Intracardiac echocardiography: basic concepts. In: Ren JF, Marchlinski F.E., Callans D.J., Schwartsman S., editors. Practical intracardiac echocardiography in electrophysiology. Malden, Mass: Blackwell Futura; 2006:1-4.
41. Ren J., Weiss J. Imaging technique and cardiac structures. In: Ren J.F., Marchlinski F.E., Callans D.J., Schwartsman S., editors. Practical intracardiac echocardiography in electrophysiology. Malden, Mass: Blackwell Futura; 2006:18-40.
42. Ren J., Marchlinski F. Monitoring and early diagnosis of procedural complications. In: Ren J.F., Marchlinski F.E., Callans D.J., Schwartsman S., editors. Practical intracardiac echocardiography in electrophysiology. Malden, Mass.: Blackwell Futura; 2006:180-207.
43. Sra J., Ratnakumar S. Cardiac image registration of the left atrium and pulmonary veins. Heart Rhythm. 2008;5:609-617.
44. Dong J., Calkins H., Solomon S.B., et al. Integrated electroanatomic mapping with three-dimensional computed tomographic images for real-time guided ablations. Circulation. 2006;113:186-194.
45. Malchano Z.J., Neuzil P., Cury R.C., et al. Integration of cardiac CT/MR imaging with three-dimensional electroanatomical mapping to guide catheter manipulation in the left atrium: implications for catheter ablation of atrial fibrillation. J Cardiovasc Electrophysiol. 2006;17:1221-1229.
46. Ector J., De B.S., Adams J., et al. Cardiac three-dimensional magnetic resonance imaging and fluoroscopy merging: a new approach for electroanatomic mapping to assist catheter ablation. Circulation. 2005;112:3769-3776.
47. Sra J., Krum D., Malloy A., et al. Registration of three-dimensional left atrial computed tomographic images with projection images obtained using fluoroscopy. Circulation. 2005;112:3763-3768.
48. Stevenhagen J., Van Der Voort P.H., Dekker L.R., et al. Three-dimensional CT overlay in comparison to CartoMerge for pulmonary vein antrum isolation. J Cardiovasc Electrophysiol. 2010;21:634-639.
49. Richmond L., Rajappan K., Voth E., et al. Validation of computed tomography image integration into the EnSite NavX mapping system to perform catheter ablation of atrial fibrillation. J Cardiovasc Electrophysiol. 2008;19:821-827.
50. Kato R., Lickfett L., Meininger G., et al. Pulmonary vein anatomy in patients undergoing catheter ablation of atrial fibrillation: lessons learned by use of magnetic resonance imaging. Circulation. 2003;107:2004-2010.
51. Triedman J. Virtual reality in interventional electrophysiology. Circulation. 2005;112:3677-3679.
52. Bertaglia E., Brandolino G., Zoppo F., et al. Integration of three-dimensional left atrial magnetic resonance images into a real-time electroanatomic mapping system: validation of a registration method. Pacing Clin Electrophysiol. 2008;31:273-282.
53. Kistler P.M., Earley M.J., Harris S., et al. Validation of three-dimensional cardiac image integration: use of integrated CT image into electroanatomic mapping system to perform catheter ablation of atrial fibrillation. J Cardiovasc Electrophysiol. 2006;17:341-348.
54. Sra J., Narayan G., Krum D., et al. Computed tomography-fluoroscopy image integration-guided catheter ablation of atrial fibrillation. J Cardiovasc Electrophysiol. 2007;18:409-414.
55. Fahmy T.S., Mlcochova H., Wazni O.M., et al. Intracardiac echo-guided image integration: optimizing strategies for registration. J Cardiovasc Electrophysiol. 2007;18:276-282.
56. Zhong H., Lacomis J.M., Schwartzman D. On the accuracy of CartoMerge for guiding posterior left atrial ablation in man. Heart Rhythm. 2007;4:595-602.
57. Hsu L.F. Image integration for catheter ablation: searching for the perfect match. Heart Rhythm. 2008;5:536-537.
58. Orlov M.V. How to perform and interpret rotational angiography in the electrophysiology laboratory. Heart Rhythm. 2009;6:1830-1836.
59. Li J.H., Haim M., Movassaghi B., et al. Segmentation and registration of three-dimensional rotational angiogram on live fluoroscopy to guide atrial fibrillation ablation: a new online imaging tool. Heart Rhythm. 2009;6:231-237.
60. Knecht S., Wright M., Akrivakis S., et al. Prospective randomized comparison between the conventional electroanatomical system and three-dimensional rotational angiography during catheter ablation for atrial fibrillation. Heart Rhythm. 2010;7:459-465.
61. Kriatselis C., Tang M., Roser M., et al. A new approach for contrast-enhanced X-ray imaging of the left atrium and pulmonary veins for atrial fibrillation ablation: rotational angiography during adenosine-induced asystole. Europace. 2009;11:35-41.
62. Knecht S., Skali H., O’Neill M.D., et al. Computed tomography-fluoroscopy overlay evaluation during catheter ablation of left atrial arrhythmia. Europace. 2008;10:931-938.
63. Nolker G., Gutleben K.J., Marschang H., et al. Three-dimensional left atrial and esophagus reconstruction using cardiac C-arm computed tomography with image integration into fluoroscopic views for ablation of atrial fibrillation: accuracy of a novel modality in comparison with multislice computed tomography. Heart Rhythm. 2008;5:1651-1657.
64. Knecht S., Akrivakis S., Wright M., et al. Randomized prospective evaluation of 3D rotational atriography versus CARTO to guide AF ablation. Heart Rhythm 2009:. 2011:PO5-PO17.