[level-membership-for-endocrinology-diabetes-and-metabolism-category]Chapter 10
Adrenal Gland Imaging
Adrenal Gland Imaging
Contemporary methods for adrenal gland imaging are listed in Table 10-1. Both ultrasound and arteriography are readily available and have played an important role in the evaluation of adrenal dysfunction, but neither is considered routine for adrenal gland imaging at this time.
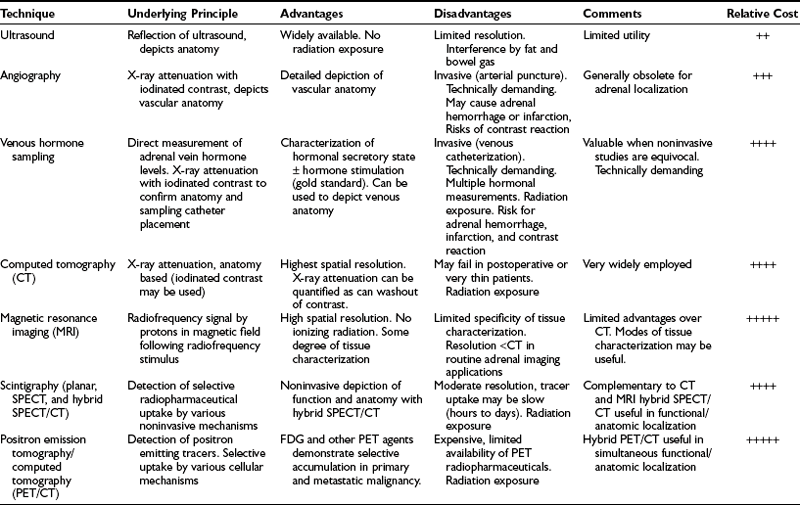
CT is currently the primary method of imaging the adrenal gland, both for evaluating patients with abnormal adrenal function and for demonstrating adrenal anatomy in patients with incidentally discovered adrenal masses. MRI can also detect the normal and abnormal adrenal gland with accuracy similar to CT, and frequently is used to help characterize many incidental adrenal masses as adenomas. Because CT is used much more often to evaluate the abdomen for a variety of known or suspected abnormalities unrelated to the adrenal glands, it is the imaging modality with which most incidental adrenal masses are first detected.1
Normal Adrenal Anatomy
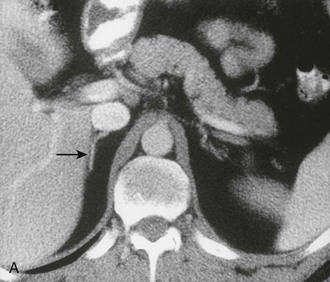
The cross-sectional anatomy of the normal adrenal gland is nearly identical on CT and MRI. The right adrenal lies higher in the abdomen than the left adrenal. It is superior to the upper pole of the right kidney, whereas the left adrenal is anteromedial to the upper pole of the left kidney. The basic morphology of the adrenal glands on transverse axial CT and MRI is that of an inverted V or an inverted Y. In the inverted Y configuration, the anterior limb is shorter and thicker than the posteromedial and posterolateral limbs and sometimes is undetectable, thus the inverted V appearance (Fig. 10-1).
Clinical Utility of CT and MRI
Most cases of Cushing’s syndrome (up to 85%) are due to excess ACTH production from a pituitary or ectopic source. The adrenals may be normal on CT or may show diffuse bilateral hyperplasia. A small percentage of patients (12% to 15%) with Cushing’s disease demonstrate multiple or, less commonly, single macronodules, varying in size from several millimeters to 7 cm. If macronodular adrenal hyperplasia is characterized by a single dominant nodule, this entity may be confused with a unilateral autonomous adrenal adenoma, leading to performance of an inappropriate unilateral adrenalectomy.2 Additional small nodules or diffuse overall enlargement of both glands usually is present, however, which together with the biochemical findings, allows the correct diagnosis to be made.
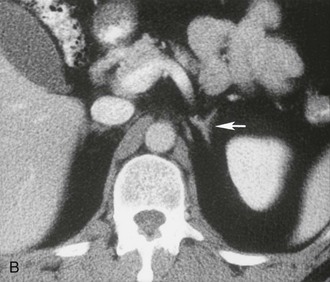
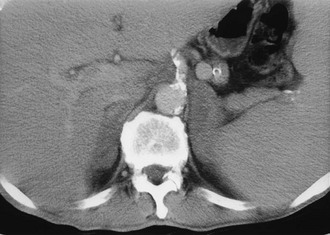
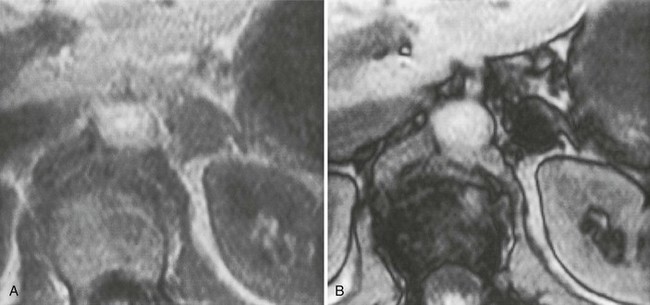
A much rarer form of macronodular adrenal hyperplasia is ACTH-independent disease. Two unique CT and MRI features of this disorder are the large mass of cortical tissue and the size of individual nodules (Fig. 10-2).3 The size of the nodules can suggest a diagnosis of bilateral metastases or bilateral adenomas, but, in the presence of Cushing’s syndrome, the appearance is practically pathognomonic of ACTH-independent macronodular adrenal hyperplasia, and bilateral adrenalectomy is indicated on the basis of clinical and CT findings.
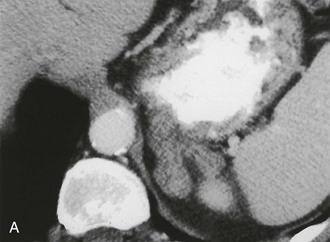
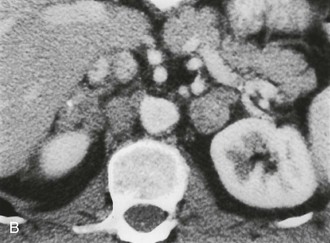
FIGURE 10-2 ACTH-independent macronodular adrenal hyperplasia. A and B show large nodules bilaterally superimposed on markedly thickened limbs. ACTH, Adrenocorticotropic hormone.
About 30% of cases of Cushing’s syndrome are due to an ACTH-independent adrenal cortical neoplasm; about two thirds of these are due to adrenal adenomas and the other one third to adrenal cortical carcinoma. These tumors are easily detectable on both CT and MRI. Adrenal cortical adenomas are nearly always less than 5 cm in diameter, typically 2 to 2.5 cm, and have a nonspecific morphologic appearance (Fig. 10-3). Adrenal cortical carcinomas are typically larger than 5 cm in diameter, often show evidence of necrosis on enhanced CT and MRI scans, and frequently present with spread to adrenal or renal veins or evidence of distant metastatic disease (Fig. 10-4). Carcinomas are usually hypointense relative to liver on T1-weighted images and hyperintense to liver on T2-weighted images.
Primary Aldosteronism
Primary aldosteronism is characterized by moderate to severe hypertension caused by unregulated secretion of aldosterone with elevated levels of serum and urinary aldosterone, hypokalemia, and suppressed plasma renin activity (see also Chapter 12). A solitary aldosterone-producing adenoma (APA) is present in about 70% of patients, and surgical or laparoscopic adrenalectomy corrects the hypertension and hypokalemia in about 75% to 90% of cases.4 Most of the remainder have idiopathic hyperaldosteronism (IHA) with bilateral adrenal hyperplasia. Unlike patients with unilateral APA, surgery rarely cures the hypertension and the biochemical abnormalities, and these patients usually are treated medically. It is essential, therefore, to distinguish APA from IHA in primary hyperaldosteronism.
CT is widely used to differentiate between APA and IHA, but the sensitivity and specificity for the diagnosis of an adenoma vary widely in the literature, ranging from 71% to 100% and from 33% to 100%, respectively.5 If the imaging results are equivocal, adrenal venous sampling is usually recommended. Sensitivity of CT for the diagnosis of APA is lower than for most other adrenal masses because they usually are smaller than 2 cm, and sometimes are smaller than 1 cm, in diameter (Fig. 10-5).
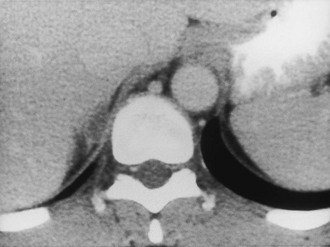
FIGURE 10-5 Computed tomography (CT) demonstration of a 1 cm aldosterone-producing right adrenal adenoma. (From Korobkin M, Francis IR: Adrenal imaging, Semin Ultrasound CT MR 16:317–330, 1995.)
CT evaluation is hampered by the fact that a unilateral aldosteronoma may be associated with non–aldosterone-secreting nodules in the ipsilateral or contralateral gland and can result in a false diagnosis of adrenal hyperplasia.6 In addition, bilateral hyperplasia may have a predominant unilateral macronodule and may cause an erroneous diagnosis of a unilateral aldosteronoma.
Doppman and colleagues7 demonstrated that CT cannot reliably differentiate APA from IHA whenever bilateral adrenal nodules are demonstrated. In their series, 6 of 21 patients with APA were incorrectly diagnosed on CT as having IHA. Non–aldosterone-secreting nodules were detected by CT, in addition to the aldosteronoma. Most patients with a unilateral adrenal mass can proceed to unilateral adrenalectomy. Patients with bilateral adrenal nodules, as well as those in whom CT and biochemical evaluations are discordant or equivocal, often undergo bilateral selective adrenal vein sampling for aldosterone levels.8
Although most cross-sectional studies of patients with primary aldosteronism have used CT, MRI also can accurately differentiate APA from IHA.9 Among the 20 patients studied, 10 (50%) had APA and 10 (50%) had IHA. In the detection of APA, MRI had sensitivity of 70%, specificity of 100%, and accuracy of 85%, which is comparable with values reported with CT.10–12 Traditionally, the diagnosis of IHA by CT or MRI has been made by excluding the presence of an adenoma. A recent study suggests that the diagnosis can be made more directly by measuring the limb size in patients with primary aldosteronism.5 This CT-based study showed that adrenals were significantly larger in patients with bilateral hyperplasia than in patients with APA or in healthy control subjects. Sensitivity of 100% was achieved when a mean limb width of greater than 3 mm was used to diagnose IHA, and specificity of 100% was achieved when the mean limb width was 5 mm or greater. Therefore, the use of adrenal venous sampling was recommended only when the mean adrenal limb width was between 3 and 5 mm. Even when the radiologist assessed limb thickness visually, the overall results were similar to quantitative measurements.
Pheochromocytoma
Pheochromocytoma (see also Chapter 14) is often called the “10%” tumor, because about 10% are extra-adrenal in location, multiple, inherited, or malignant. Most cases are sporadic, but some are associated with multiple endocrine neoplasia (MEN) syndromes, neurofibromatosis or von Hippel-Lindau disease, or familial pheochromocytoma. Pheochromocytomas secrete the neurotransmitter hormones epinephrine and norepinephrine, which often leads to hypertension, tachycardia, headaches, palpitations, diaphoresis, and chest pains. Some or all of these findings can be present, often in an episodic pattern, but can be absent in about 10% of patients. Diagnosis of pheochromocytoma can be suspected clinically and confirmed by elevated levels of these hormones, particularly their metabolites, in the blood or the urine. Localization of a pheochromocytoma is essential because surgical resection can be curative. CT, MRI, and 131I (and 123I)-meta-iodobenzylguanidine (MIBG) imaging all have been used to localize pheochromocytomas.
Most pheochromocytomas are readily detected on CT, because they typically measure 2 to 5 cm in diameter. Although some are small and homogeneous in attenuation, many have regions of necrosis or hemorrhage and can have a fluid density on unenhanced CT. For many years, intravenous ionic contrast material was avoided in patients with known or suspected pheochromocytoma because of an effect on catecholamine levels and the fear of inducing a hypertensive crisis.13 More recently, however, a study using nonionic IV contrast showed no significant increases in catecholamine levels in control subjects or in patients with pheochromocytomas.14
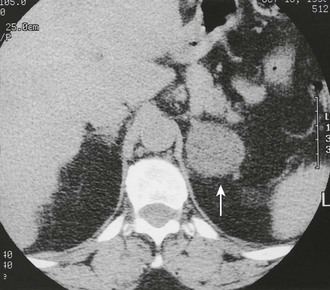
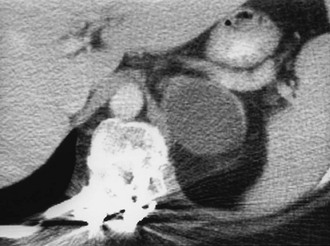
Contrast-enhanced CT of adrenal pheochromocytoma shows nonspecific homogeneous or, more commonly, inhomogeneous enhancement of a solid mass, similar to the finding in adrenal metastasis or adrenal cortical carcinoma (Fig. 10-6). Most pheochromocytomas have an unenhanced attenuation greater than 10 Hounsfield units (HU), although a recent report described a single case each of pheochromocytoma (9 HU) and medullary hyperplasia (2 HU) with lipid degeneration.15 Oral contrast opacification of the gastrointestinal tract is essential for the detection of para-aortic tumors in the retroperitoneum (Fig. 10-7), because unopacified bowel at times can simulate a “mass.” Although rare, intrapericardial paragangliomas can be detected by dynamic bolus contrast-enhanced CT of the mediastinum (Fig. 10-8). The inhomogeneous mass is usually located adjacent to or involving the left atrium.16
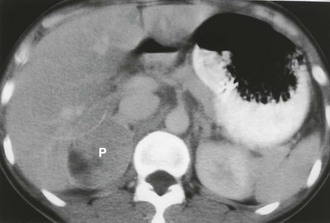
FIGURE 10-6 Intravenous contrast-enhanced computed tomography (CT) shows a right adrenal pheochromocytoma (P) with areas of necrosis. (From Korobkin M, Francis IR: Imaging of adrenal masses, Urol Clin North Am 24:603–622, 1997.)
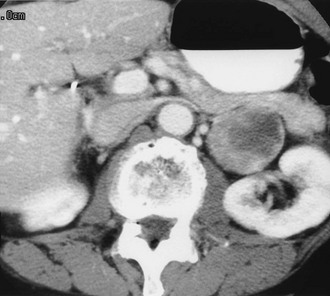
FIGURE 10-7 Retroperitoneal extra-adrenal pheochromocytoma. Enhanced computed tomography (CT) shows an inhomogeneous enhancing mass medial to the left kidney. A normal left adrenal was demonstrated on scans cephalad to this mass.
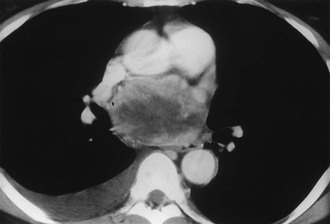
FIGURE 10-8 Intrapericardial extra-adrenal pheochromocytoma. Enhanced computed tomography (CT) shows an inhomogeneous mass in the expected location of the left atrium. MIBG scan was positive in this location. (From Hamilton BH, Francis IR, Gross BH, et al: Intrapericardial paragangliomas [pheochromocytomas]: Imaging features, Am J Roentgenol 168:109–113, 1997.)
On MRI, most pheochromocytomas are hypointense on T1-weighted images and markedly hyperintense on T2-weighted images. Initial reports of MRI of adrenal masses suggested that pheochromocytomas could be distinguished by their marked hyperintensity on T2-weighted images. Considerable overlap with other neoplasms, however, including adrenal cortical carcinomas, was demonstrated in up to 33% of cases.17 The cause of the high T2 signal intensity of pheochromocytomas remains controversial. Most of the initial reports were from mid and low field strength magnets, whereas currently, most MRI magnets have high field strength (1.5 T). The cause may be related to the necrotic or cystic areas so common within these tumors. MRI angiography is useful for demonstrating the presence or absence of intracaval extension of adrenal pheochromocytoma, and MRI is useful in the search for an extra-adrenal paraganglioma from the neck to the bladder.
Hypoadrenalism
Adrenal insufficiency, or hypoadrenalism, most often is due to autoimmune atrophy, and imaging usually is not useful for diagnosis. The glands are extremely small and may be difficult to identify on CT or MRI17 (Fig. 10-9). Atrophic glands may be due to chronic granulomatous disease, but these cases usually are associated with adrenal calcification. In patients with adrenal insufficiency due to granulomatous infection caused by tuberculosis, histoplasmosis, or blastomycosis, the acute and subacute phases are manifested as bilateral adrenal enlargement, although often some asymmetry is noted. Inhomogeneous low attenuation within the adrenal mass, best seen on enhanced CT or MRI, is due to caseous necrosis.18 Unlike patients with adrenal metastases, the enlarged glands in granulomatous adrenalitis typically retain their normal inverted Y contour.17 Percutaneous biopsy of the adrenals is often necessary to confirm the diagnosis of granulomatous adrenalitis and to identify the organism. Bilateral adrenal calcification from granulomatous disease can be seen in both adrenal hypofunction and normal adrenal function. Demonstration of uninvolved noncalcified adrenal tissue usually indicates normal function.
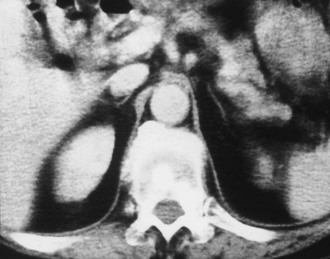
FIGURE 10-9 Computed tomography (CT) shows markedly atrophic adrenal glands in a patient with adrenal insufficiency secondary to idiopathic autoimmune atrophy. (From Korobkin M, Francis IR: Adrenal imaging, Semin Ultrasound CT MR 16:317–330, 1995.)
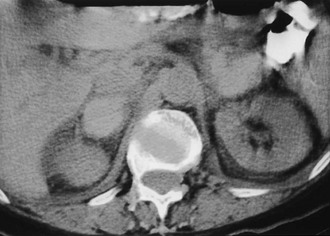
Bilateral adrenal hemorrhage often is accompanied by adrenal insufficiency, and the detection of bilateral hyperattenuating masses on unenhanced CT can sometimes be the first clue to a clinical diagnosis (Fig. 10-10). Although bilateral adrenal metastases are commonly seen, they usually do not lead to clinically apparent hypoadrenalism. Adrenal insufficiency can be caused by acquired immunodeficiency syndrome (AIDS) and the antiphospholipid antibody syndrome; however, the adrenal anatomy in these diseases can be variable.19,20
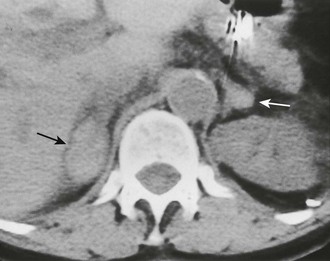
FIGURE 10-10 Adrenal insufficiency secondary to bilateral adrenal hemorrhage. Unenhanced computed tomography (CT) shows a high-attenuation mass in both adrenals (arrows) characteristic of acute or subacute hematoma. (From Korobkin M, Francis IR: Adrenal imaging, Semin Ultrasound CT MR 16:317–330, 1995.)
The Incidentally Discovered Adrenal Mass (Incidentaloma)
The more widespread application of high-resolution anatomic imaging to screen the abdomen for diseases or to stage diseases unrelated to the adrenal has identified a growing number of unexpected adrenal masses or “incidentalomas.”21–24 Given their prevalence in from 4% to 10% of patients studied with CT or MRI for indications other than suspected adrenal disease, novel adaptations to imaging have been made to distinguish frequent, nonhypersecretory, benign adrenal masses from adrenal metastases and adrenocortical carcinoma.22 The discovery of an adrenal mass presents a diagnostic and, at times, a therapeutic challenge. Because an overwhelming majority of incidentalomas are benign and nonhypersecretory, an aggressive approach to them is not indicated.21–23 Of course, a solitary adrenal metastasis or an incidentally discovered adrenal carcinoma treated earlier would have a more favorable result. Given the uncertainty in diagnosis of adrenal masses other than cysts and myelolipomas, many diagnostic algorithms and approaches have been offered, making the evaluation of adrenal incidentalomas controversial.21,25 A thoughtful approach to such patients must include a biochemical evaluation sufficient to exclude both cortical and medullary hyperfunction and an anatomic and/or functional imaging evaluation sufficient to exclude a malignancy.21,25–27 The continuing uncertainty about appropriate clinical and imaging management of adrenal incidentalomas was attested to at a National Institutes of Health Consensus Conference on this subject in February 2002.28
Specific Imaging Features of Incidentally Discovered Adrenal Masses
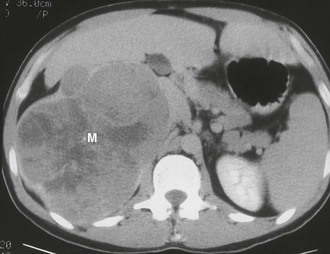
Myelolipoma: A myelolipoma is a benign tumor that comprises bone marrow elements. Myelolipomas do not produce hormones and most are detected as incidental findings. Occasionally, large tumors or those undergoing tumor necrosis or spontaneous hemorrhage may cause flank pain.29,30 Although most are adrenal in location, extra-adrenal myelolipomas have been reported.31,32 Because they include large amounts of mature fat, most myelolipomas are recognized easily on CT (Fig. 10-11). Elements of soft tissue density are found in varying amounts, and calcification is seen in up to 20% of cases.
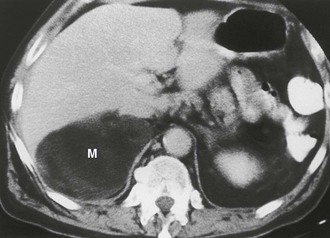
FIGURE 10-11 Myelolipoma. Large, fatty right adrenal mass (M) is seen on this contrast-enhanced computed tomography (CT) examination. (From Korobkin M, Francis IR, Kloos RT, Dunnick NR: The incidental adrenal mass, Radiol Clin North Am 34:1037–1054, 1996.)
The appearance of a myelolipoma on MRI reflects portions of fat and bone marrow elements in the tumor. Fat exhibits high-signal intensity on both T1- and T2-weighted sequences. The bone marrow elements have a low signal intensity on T1-weighted images and a moderate signal intensity on T2-weighted scans.33,34 Because a confident diagnosis of myelolipoma usually can be made with CT or MRI, most are treated conservatively.
Cyst: Adrenal cysts are uncommon lesions with infrequent reports of their CT appearance. A 3:1 female predilection has been noted, and four types of cysts have been identified on the basis of pathologic classification: endothelial, epithelial, parasitic, and posttraumatic pseudocysts.35 A recent report of 13 new cystic adrenal masses and review of 26 benign adrenal cysts from the literature included one cystic adrenal cortical carcinoma.36 Of 37 reviewed benign cysts, 19 had mural and 7 had central calcification, 28 were unilocular, and 7 had high attenuation values. Wall thickness was 3 mm or less in 31 lesions. The authors concluded that a CT finding of a nonenhancing mass with or without wall calcification allows differentiation of an adrenal cyst from an adenoma (Fig. 10-12). A small adrenal cyst with near-water attenuation and a thin (≤3 mm) wall is likely to be benign.
Hemorrhage: Adrenal hemorrhage can be bilateral or unilateral. When bilateral, the cause is usually associated with anticoagulation therapy or a blood dyscrasia; less commonly, it is associated with the stress of surgery, sepsis, or hypotension, and, rarely, it is caused by trauma.37 Unilateral adrenal hemorrhage usually is caused by blunt abdominal trauma and involves the right gland more often than the left.38 Adrenal vein thrombosis may cause unilateral adrenal hemorrhage. This may be caused by catheterization performed to collect blood samples from the adrenal vein in patients with suspected adrenal endocrine disease.39,40 In the absence of catheterization or blunt trauma, unilateral adrenal hemorrhage into a preexisting neoplasm may occur, necessitating surgical exploration if follow-up imaging does not show a nearly normal adrenal gland.
Acute or subacute adrenal hemorrhage typically has an unenhanced attenuation value of 55 to 90 HU (Fig. 10-13). Follow-up studies show diminution in size of the adrenal mass with a gradual decrease in attenuation value.41 The high attenuation value of a recent adrenal hemorrhage is usually readily apparent on unenhanced CT but is indistinguishable from a solid adrenal neoplasm on contrast-enhanced CT. An adrenal mass detected on contrast-enhanced CT after trauma usually is assumed to be due to a hematoma, but an unrelated adrenal neoplasm can be excluded only by unenhanced CT or serial follow-up CT. Similarly, MRI may indicate hemorrhage by the high signal intensity on T1-weighted scans, reflecting the presence of methemoglobin.42,43
Nonspecific Imaging Features of Incidentally Discovered Adrenal Masses
Granulomatous Disease: Tuberculosis, histoplasmosis, and other granulomatous diseases are usually bilateral but often asymmetrical. CT findings are nonspecific and can include soft tissue masses, cystic changes, and/or calcification44 (Fig. 10-14). Although these are uncommon adrenal lesions that rarely occur unilaterally, they should be considered in the differential diagnosis of incidental bilateral adrenal masses in the absence of a primary neoplasm or coagulation abnormality. Biopsy is needed to confirm the diagnosis and identify the responsible organism.
Hemangioma: An adrenal hemangioma is a rare benign tumor. Hemangiosarcomas occur but are even less common.45 Hemangiomas comprise closely adjacent vascular channels lined with a single layer of endothelium.46 They do not produce adrenal hormones, and most are quite large when found as an incidental finding. On CT, hemangiomas are seen as large, well-defined masses. They have a soft tissue density on unenhanced images and demonstrate inhomogeneous enhancement. Most hemangiomas are calcified as the result of phleboliths within the tumor or previous hemorrhage.47
MRI findings include a hypointense appearance relative to the liver on T1-weighted sequences.48 Central hyperintensity due to hemorrhage may be noted. On T2-weighted images, hemangiomas are hyperintense. Peripheral enhancement that persists on delayed images is characteristic. Tumors are usually removed because of the risk for hemorrhage and inability to exclude malignancy.
Ganglioneuroma: A ganglioneuroma is a benign tumor composed of Schwann cells and ganglion cells. These tumors occur anywhere along the paravertebral sympathetic plexus, and approximately 20% to 30% arise in the adrenal medulla.49 Because they do not secrete hormones, most ganglioneuromas are detected as an incidental finding.50 On CT, ganglioneuromas appear as a solid adrenal mass ranging up to 11 cm in diameter.49 Extra-adrenal retroperitoneal tumors may be even larger.
Neuroblastoma: Whereas neuroblastoma is the third most common malignant tumor of childhood, it is seen much less frequently in adults. It may occur anywhere along the parasympathetic plexus. Adults are more likely than children to present with disseminated disease.51 The imaging findings of neuroblastoma in adults are similar to those in children.
Pheochromocytoma: Although most patients with pheochromocytoma present with manifestations of excess catecholamine production, approximately 10% of tumors are silent and are detected by other means such as an imaging study.52,53 The CT and MRI appearance of pheochromocytomas was described earlier.
Adenoma: Adenoma, the most common adrenal tumor, is reported as occurring in 1.4% to 8.7% of postmortem examinations, depending on the criteria used.54–56 The incidence is even higher among patients with hypertension or diabetes mellitus.55–57 Adenomas large enough to be recognized on survey abdominal CT examinations are found in approximately 1% of patients, but identification may be increasing with improvements in CT technology.58 On CT, adenomas may have the same density as normal adrenal tissue. Because most adenomas contain large amounts of intracytoplasmic lipid, many have a low density, often near that of water on unenhanced examination59 (Fig. 10-15). Calcification is rare. Adenomas enhance significantly after the intravenous administration of iodinated contrast media (Fig. 10-16). Although the degree of enhancement is not significantly different from that of other adrenal tumors, adenomas show more rapid washout of contrast than do adrenal metastases.60–62
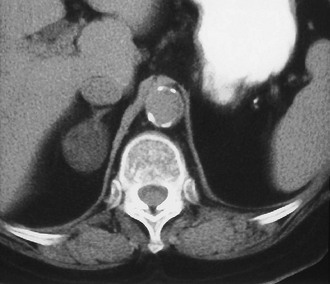
FIGURE 10-15 Lipid-rich adenoma. Right adrenal mass (3 cm) is shown on this unenhanced computed tomography (CT) scan. Attenuation value of −4 HU allows confident diagnosis of benign lesion, either cyst or lipid-rich adenoma. (From Dunnick NR, Korobkin M: Imaging of adrenal incidentalomas: current status, Am J Roentgenol 179:559–568, 2002.)
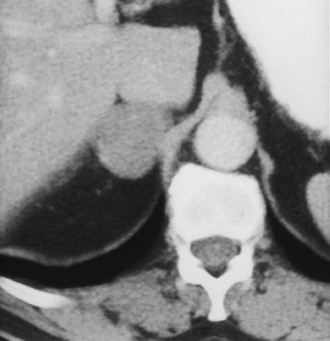
FIGURE 10-16 Adenoma. Right adrenal gland mass (4 cm) is shown on this contrast-enhanced computed tomography (CT) examination. Attenuation value on enhanced scans is not sufficiently characteristic to distinguish benign from malignant causes. (From Dunnick NR, Korobkin M: Imaging of adrenal incidentalomas: current status, Am J Roentgenol 179:559–568, 2002.)
The MRI signal characteristics of adenomas are similar to those of normal adrenal tissue. Although the signal intensity of an adenoma tends to be low on T2-weighted sequences, this is not a useful way to distinguish adenomas from metastases, because an overlap of 20% to 30% has been reported with metastases. Chemical shift imaging is used to identify the intracytoplasmic lipid and can distinguish many adenomas from metastases63,64 (Fig. 10-17).
Carcinoma: Adrenal carcinoma is a rare tumor, with a reported incidence of two cases per million.65 Patients may present with abdominal pain, a palpable mass, or Cushing’s syndrome, as about 50% of these tumors elaborate unregulated amounts of cortisol. Many of these elaborate insufficient amounts of hormone to produce obvious clinical manifestations. Other endocrine manifestations of adrenal carcinoma include Conn’s syndrome, virilization, and feminization, but these are very rare. Tumors tend to be very large at the time of presentation (see also Chapter 11).
The CT appearance of an adrenal carcinoma is a large mass. Central necrosis is common, and calcification is seen in 20% to 30% of cases66,67 (Fig. 10-18A). Enhancement is heterogeneous after intravenous contrast administration. Venous extension of tumor into the left renal vein or the inferior vena cava is common and usually can be identified on contrast-enhanced images66 (Fig. 10-18B). It is important to define precisely the cephalad extent of the intravenous tumor, as this defines the point where the surgeon can gain vascular control of the tumor.68 Although this often can be done with CT, MRI may be helpful in problem cases.69 On MRI, carcinomas are usually heterogeneously hyperintense on both T1- and T2-weighted images, reflecting frequent internal hemorrhage and central necrosis. Enhancement is also heterogeneous, revealing nodular areas of intense enhancement and other areas with no enhancement. Intravenous extension of tumor typically is well seen on MRI because of the multiple planes in which data sets can be projected.69,70
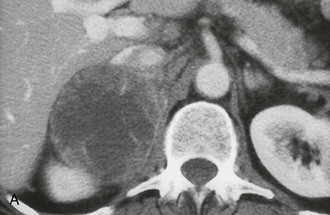
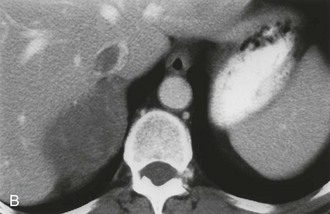
FIGURE 10-18 Adrenal cortical carcinoma. A, Contrast-enhanced computed tomography (CT) examination shows 9 cm right adrenal mass. Irregular wall and low-density center indicate necrosis. B, More cephalad image in same examination reveals tumor extension into inferior vena cava. (From Dunnick NR, Korobkin M: Imaging of adrenal incidentalomas: current status, Am J Roentgenol 179:559–568, 2002.)
Lymphoma: Primary lymphoma of the adrenal glands is rare,71 but secondary involvement when another retroperitoneal lymphoma is present is seen more commonly among patients with non-Hodgkin’s lymphoma than among those with Hodgkin’s disease.72 Involvement is often bilateral, and other retroperitoneal disease is usually present. On MRI, lymphoma has a signal intensity lower than that of the liver on T1-weighted images. Lymphoma is typically heterogeneously hyperintense on T2-weighted sequences.
Metastases: The adrenal glands are a common site of metastatic disease, which is found in about 27% of postmortem examinations of patients with malignant neoplasms of epithelial origin.73 The most common neoplasms with adrenal metastases are carcinomas of the lung and breast, and melanoma.73,74 Small metastases are often homogeneous on contrast-enhanced CT (Fig. 10-19) or MRI, whereas large metastases often have local regions of heterogeneous appearance due to necrosis or hemorrhage or both (Fig. 10-20). Calcification is rare in adrenal metastases.
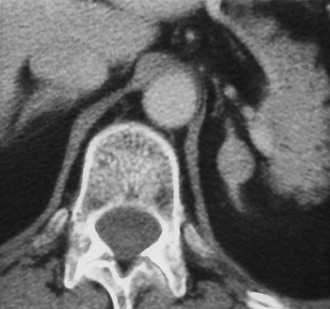
FIGURE 10-19 Metastasis from renal carcinoma in a 31-year-old woman. Small, homogeneous left adrenal mass is seen on this contrast-enhanced computed tomography (CT) examination. (From Dunnick NR, Korobkin M: Imaging of adrenal incidentalomas: current status, Am J Roentgenol 179:559–568, 2002.)
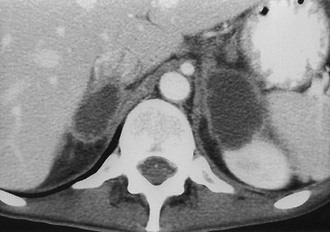
FIGURE 10-20 Necrotic metastasis from adenocarcinoma of the lung in a 34-year-old woman. Bilateral adrenal masses with areas of central necrosis are seen on this contrast-enhanced computed tomography (CT) examination. (From Dunnick NR, Korobkin M: Imaging of adrenal incidentalomas: current status, Am J Roentgenol 179:559–568, 2002.)
Adenoma or Metastasis
Evidence has accumulated that unenhanced CT densitometry can be used to accurately differentiate adrenal adenomas from metastases.75–77 Most adenomas have unenhanced CT attenuation values lower than those of metastases, and the scatterplot data from such studies were used to determine a threshold value that resulted in calculation of the optimal combination of sensitivity and specificity for the diagnosis of adenoma (Fig. 10-21). In an oncologic patient with an adrenal mass but no other evidence of distant metastatic disease, the goal of noninvasive diagnostic imaging is to characterize the adrenal mass as an adenoma with high specificity. With the use of pooled data from multiple published studies of calculated accuracies and corresponding threshold values of unenhanced attenuation values, it has been shown that the most optimal sensitivity (71%) and specificity (98%) for the diagnosis of adrenal adenoma results when a threshold attenuation value of 10 HU is chosen on unenhanced CT.77 Unlike unenhanced attenuation values, however, intravenous contrast-enhanced CT values show too much overlap between adenomas and metastases to allow accurate differentiation between them.76
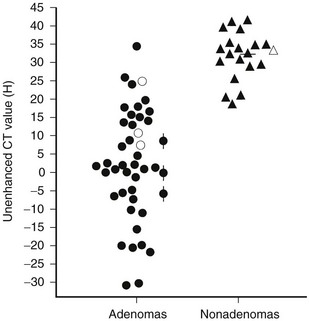
FIGURE 10-21 Scattergram of attenuation values on unenhanced CT of adrenal adenomas and nonadenomas. All masses with H values of less than 18 were adenomas. •, Nonhyperfunctioning adenomas;  , Cushing adenomas;
  , primary aldosterionism adenomas;
  , metastases;
  , pheochromocytomas;
  , cortical carcinomas. (From Korobkin M, Brodeur FJ, Yutzy GG, et al: Differentiation of adrenal adenomas from nonadenomas using CT attenuation values, Am J Roentgenol 166:531–536, 1996.)
Evidence has accumulated that chemical shift MRI can also be used to differentiate adrenal adenomas from metastases. Taking advantage of the different resonant frequency peaks for the hydrogen atom in water and triglyceride (lipid) molecules, chemical shift MRI results in a decrease in the signal intensity of tissue containing both lipid and water in comparison with tissue containing no lipid.78 When a breath-hold gradient-echo technique is used, signal intensity loss on opposed-phase versus in-phase images indicates a mixture of lipid and nonlipid tissue that is often present in adrenal adenomas and absent in metastases. Assessment of the chemical shift change can be made via simple visual analysis or by quantitative methods using standard region-of-interest cursor measurements of the mass, and often of an adjacent reference tissue, on in-phase and opposed-phase images. Several different formulas have been proposed to measure the amount of chemical shift change and to determine optimal threshold values by analysis of scatterplot data.79
Although some investigators have used these quantitative measurements and formulas to detect the presence of lipid within adrenal adenomas, others have emphasized the advantages of simple visual analysis in detecting relative signal intensity loss on opposed-phase images of adrenal adenomas. The ability to subjectively compensate for motion and other artifacts that are superimposed over an adrenal mass and the identification of local rather than diffuse lipid are two of the advantages cited in favor of visual rather than quantitative analysis of chemical shift changes.80 Several studies have shown a similar accuracy for detecting intratumoral lipid in adrenal masses when both visual analysis and quantitative methods are used in the same patients,79–81 but recent observation suggests that quantitative methods may be more sensitive for detecting lipid in an adenoma.82 The most rigorous assessment of visual analysis of in-phase and opposed-phase imaging of adrenal masses showed a sensitivity of 78% for the detection of lipid within adrenal adenomas with a corresponding specificity of 87%.80
Two studies have suggested that unenhanced CT densitometry and chemical shift MRI both detect the presence and amount of lipid within adrenal adenomas. In one study of 47 adrenal masses, which all were imaged with both techniques, good inverse linear correlation was noted on MRI between the CT attenuation value and the amount of chemical shift change.83 In a histologic/radiologic study of a small number of resected adrenal adenomas that had undergone presurgical CT, chemical shift MRI, or both, good inverse linear correlation was seen between the estimated number of lipid-rich cells and the unenhanced CT attenuation value, and good linear correlation was noted with the relative change in signal intensity on opposed-phase MRI59 (Figs. 10-22 and 10-23).
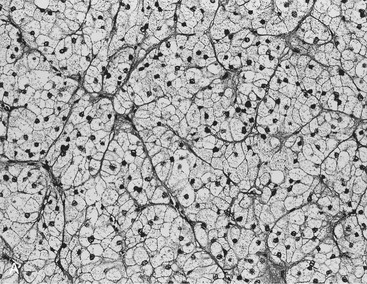
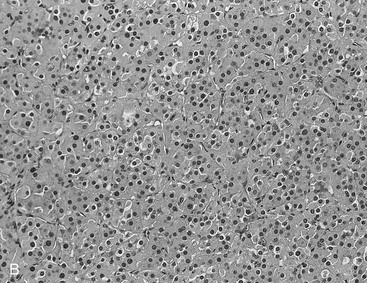
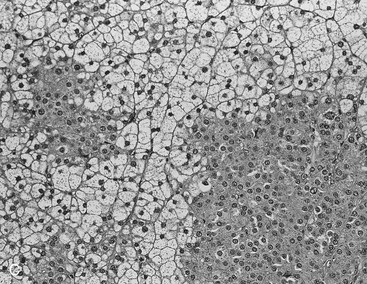
FIGURE 10-22 Histologic specimens from resected adrenal adenomas: A, Primarily of lipid-rich clear cells. B, Primarily of lipid-poor clear cells. C, Of an admixture of clear and compact cortical cells. (Hematoxylin-eosin stain, original magnification, ×200.) (From Korobkin M, Giordano TJ, Brodeur FJ, et al: Adrenal adenomas: relationship between histologic lipid and CT and MR findings, Radiology 200:743–747, 1996.)
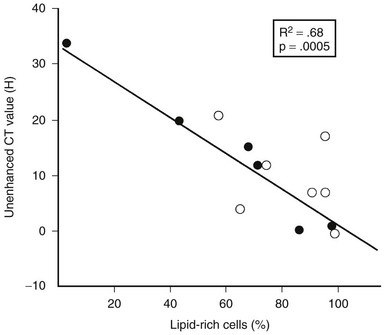
FIGURE 10-23 Plot of unenhanced computed tomography (CT) attenuation number versus the percentage of lipid-rich cells in 13 surgically resected adrenal adenomas. HU, Hounsfield units. (From Korobkin M, Giordano TJ, Brodeur FJ, et al: Adrenal adenomas: Relationship between histologic lipid and CT and MR findings, Radiology 200:743–747, 1996.)
However, two more recent publications indicate that chemical shift MRI is more sensitive in detecting sufficient lipid in adenomas with unenhanced CT values between 10 and 30 HU.82,84
Standard contrast-enhanced CT images of the adrenal glands are obtained about 60 seconds after bolus intravenous injection of contrast material is begun. Studies suggest that this is the only time when the attenuation values of adenomas and metastases are nearly identical. Adenomas have a much more rapid loss of enhancement, as early as 5 minutes after contrast injection, and attenuation values at 10 or 15 minutes after contrast administration can be used to differentiate adenomas from other masses62,85 (Fig. 10-24). Although the threshold attenuation value for the diagnosis of an adenoma has varied among series, masses with an attenuation value less than 30 to 40 HU on 15-minute delayed contrast-enhanced CT are almost always adenomas.
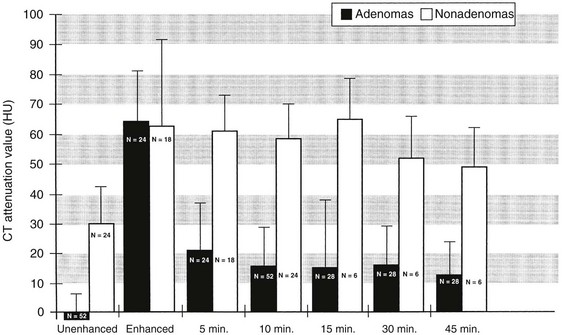
FIGURE 10-24 Bar graph shows mean computed tomography (CT) attenuation value plus 1 standard deviation for adrenal adenomas (black) and nonadenomas (white) on unenhanced, enhanced, and delayed enhanced scans. (From Korobkin M, Brodeur FJ, Francis IR, et al: CT-time-attenuation washout curves of adrenal adenomas and nonadenomas, Am J Roentgenol 170:747–752, 1998.)
Previous reports indicated that the more rapid washout of gadolinium enhancement on MRI of adrenal adenomas could differentiate them from metastases.91 Subsequent reports could not confirm these results, however, and dynamic gadolinium-enhanced MRI is not used widely for this purpose.81,86,87
In addition to the delayed CT attenuation value itself, it is possible to calculate the percentage washout of initial enhancement, which is probably independent of type, amount, and injection rates of contrast administration.62,88 The optimal threshold enhancement washout at 15 minutes is 60%, resulting in a sensitivity of 88% and a specificity of 96% for the diagnosis of adenoma.62 Of particular interest is the apparent independence of this rapid enhancement washout from the lipid content of an adenoma. Lipid-poor adenomas, those with unenhanced attenuation values greater than 10 HU on unenhanced CT, have enhancement washout features nearly identical to those of lipid-rich adenomas.89
It is easy to calculate the enhancement washout of adrenal masses:

where E is the enhanced attenuation value, D is the delayed enhanced value, and U is the unenhanced value. For example, if the unenhanced attenuation is 20 HU, the enhanced attenuation is 100 HU, and the 15 minute delayed enhanced attenuation is 40 HU, the percent washout is:


In our department, the optimal threshold value for the relative enhancement washout calculation is 40%, resulting in a sensitivity of 96% and a specificity of 100% for the diagnosis of adenoma. Another study of the accuracy of relative enhancement washout in characterizing adrenal masses reported an optimal threshold of 50%,90 resulting in a sensitivity and specificity of 100%.
In the previous example, the calculation for relative enhancement washout is as follows:

Combining the two independent CT properties of adrenal adenomas—rapid contrast enhancement washout and a propensity for intratumoral lipid—leads to a protocol that spares most adenomas from contrast enhancement. We reported the accuracy of combined unenhanced and delayed enhanced CT densitometry for characterization of adrenal masses.91 We prospectively studied 166 adrenal masses with unenhanced CT; those with attenuation values greater than 10 HU underwent contrast-enhanced and 15-minute delayed enhanced CT. This protocol correctly characterized 160 of the 166 masses (96%). When the five nonadenomas that were not metastases were excluded, the sensitivity and specificity for characterizing a mass as adenoma versus metastasis were 98% (124/127) and 97% (33/34), respectively. Similar results were subsequently reported with the use of a very similar protocol.92
Adenoma or Carcinoma
In patients without a primary extra-adrenal neoplasm, an adrenal mass without specific morphologic features is almost always an adenoma, especially if less than 3 cm in diameter. To obviate the common practice of serial CT imaging over several years to assure a benign lesion in order to show stability in size, we often use the imaging techniques described previously to confirm the findings characteristic of an adenoma. If these features are present, we make a diagnosis of adenoma and do not suggest follow-up imaging. In a recent study of incidentally detected indeterminate, but benign appearing, adrenal masses with no known primary maligancy, all of the 321 lesions studied were confirmed to be benign. Follow-up imaging appears to have a limited role in this common patient cohort.93
A unilateral adrenal mass larger than 5 or 6 cm in diameter is considered suspicious for adrenocortical carcinoma, and many show evidence of metastatic disease. It is important to remember that a large nonhyperfunctioning pheochromocytoma and a large adrenal metastasis can have a CT and MRI appearance identical to that of a carcinoma. In the absence of metastases, the differential diagnosis is usually that of carcinoma versus adenoma. The larger the mass, the greater is the likelihood of carcinoma, although on rare occasions, adenomas can be larger than 5 cm and can have large regions of hemorrhage, necrosis, and calcification.94 The size criteria for resection of adrenal incidentaloma varies widely, but almost all adrenal masses greater than 6 cm are resected for fear of possible adrenal carcinoma.
Very little is known about chemical shift MRI and CT densitometry of adrenocortical carcinoma. Of the reported series of delayed enhanced CT attenuation values and enhancement washout curves, only one included three cases of adrenal carcinoma, but the carcinomas were included in the data set for nonadenomas, and their locations in the scatterplots of the individual cases were not provided.85 Adrenal carcinomas greater than 6 cm often have large regions of central necrosis or hemorrhage, invalidating attempts to assess contrast enhancement washout. It is not yet established whether chemical shift MRI, unenhanced CT, or delayed enhanced CT can reliably differentiate adenoma from carcinoma. The answer may depend on the histologic grade of malignancy involved. In one series that included 11 adrenal cortical carcinomas, the absolute and relative enhancement loss on 10 minute delayed imaging of the carcinomas was significantly smaller than for the adenomas and was similar to that for the metastases and the pheochomocytomas.95 In another series of seven patients with adrenocortical carcinomas, delayed enhanced images at approximately 20 minutes showed a relative percentage of enhancement washout of less than 40%, consistent with malignancy.96
Arteriography and Adrenal Vein
If imaging studies are inconclusive, adrenal vein hormone sampling can be performed to distinguish hypersecretory unilateral adenoma from bilateral hyperplasia.12,16,97–99 Arteriography is used only in a very few selected cases with adrenal lesions or extra-adrenal pheochromocytoma, when additional information about tumor resectability and vascular anatomy is needed. Adrenal venous hormone sampling remains the “gold standard” method for distinguishing unilateral aldosterone-producing adenoma from bilateral adrenal hyperplasia. Transcatheter ethanol injection may be used to treat aldosteronomas and other hypersecretory adrenal adenomas as an alternative to surgery.
Technique
Adrenal Vein Catheterization
Potential complications of adrenal vein catheterization include intra-adrenal extravasation of contrast, bleeding, and adrenal vein thrombosis. Adrenal hemorrhage can cause severe pain and fever, as well as destruction of adrenal glandular function and hypoadrenalism if both adrenal glands are damaged. Adrenal venography is performed to confirm the catheter position in the adrenal vein after blood has been collected for hormone sampling, and not for the depiction of adrenal anatomy (Fig. 10-25).
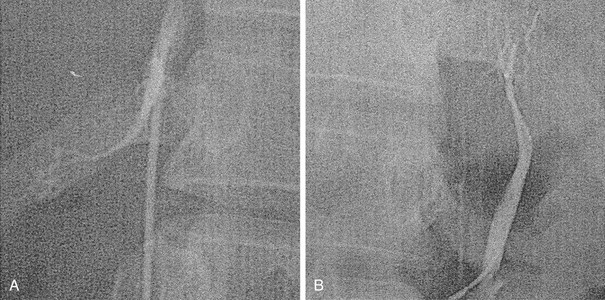
FIGURE 10-25 Bilateral adrenal venograms in a patient with primary hyperaldosteronism. A, Right adrenal venogram in the left anterior oblique projection. The intrarenal branches are filled poorly. The main vein enters the posterolateral aspect of the inferior vena cava. B, Left adrenal venogram in the anteroposterior projection with the injection of contrast medium via the 3F microcatheter introduced through the 5F reverse hook catheter positioned near the junction of the main adrenal vein and the left renal vein.
Adrenal Vein Hormone Sampling
Primary Aldosteronism
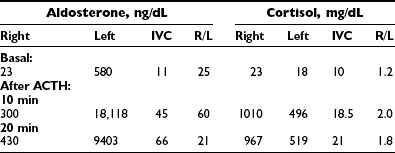
Analysis of the adrenal venous sampling should include calculation of aldosterone ratio, aldosterone/cortisol ratio (A/C ratio), and ratio of the A/C ratios. The A/C ratio is calculated to correct for dilution of samples from the adrenal veins. In unilateral adenoma, differences in concentration of aldosterone are very large because of increased hormone production from the adenoma associated with suppression of the contralateral adrenal gland (Table 10-2). Therefore, the aldosterone ratio is usually greater than 3.0 and the ratio of the A/C ratio is greater than 6.0. In the presence of unilateral disease, the A/C ratio in the normal gland is similar to and often is lower than the IVC A/C ratio. In bilateral adrenal hyperplasia, aldosterone levels and A/C ratios in both adrenal glands are higher than in the IVC before and after ACTH (Table 10-3). In the presence of bilateral adrenal hyperplasia with a dominant nodule, in which CT often depicts a unilateral mass, samples from both adrenal veins demonstrate aldosterone levels and A/C ratios higher than the IVC A/C ratio (Table 10-4).
Catheter-Directed Ablation Therapy for Adrenal Adenomas
Nonsurgical methods of treating aldosteronoma include the percutaneous injection of ethanol or acetic acid and the transcatheter arterial infusion of ethanol. Rossi and colleagues100 injected a mixture of ethanol and iodinated contrast material into a left adrenal adenoma using CT guidance. The patient remained hypertensive despite significant biochemical improvement. Liang and coworkers used a CT-guided percutaneous injection of acetic acid into the adrenal adenomas in two patients with aldosterone-secreting adrenal adenomas and one patient with Cushing’s syndrome.101 Symptoms resolved and subsequent laboratory studies were normal in all patients. Hokotate and colleagues102 selectively infused ethanol through a microcatheter into the feeding artery of an aldosteronoma. This method was successful in 82% (27/33) of patients. Repeat embolization was performed successfully in one recurrent tumor. No complications were encountered.
Adrenal Scintigraphy
Radiopharmaceuticals for adrenocortical imaging have been available for more than 30 years.103 Originally based on precursors of cholesterol analogues, newer radiopharmaceutical inhibitors of 11β-hydroxylase, include the positron emission tomography (PET) agents 11C-etiomidate and 11C-, 18F-, and more recently 123I-labeled metomidate, allowing single photon emission tomography (SPECT), have been used to image the normal adrenal cortex and a variety of adrenocortical neoplasms.104 Other PET agents, such as 11C-acetate, an intermediate of aerobic metabolism and 11C-, and 18F-choline, a precursor component of cell membranes and the glucose analogue, 18F-fluorodeoxyglucose (FDG), have been reportedly used to image the normal adrenal cortex, as well as benign, and, in the case of FDG, malignant adrenal masses.105–107 At the present time, the radiocholesterol analogue, 131I-6β-iodomethlynorcholesterol (NP-59), is not available in North America, although it is produced in Europe and Asia, and recent publications have reviewed its use in depicting disorders of the adrenal cortex.108,109
Clinical Applications of Adrenocortical Scintigraphy
Anatomic imaging and selective intracranial venous sampling have been especially useful in evaluating the central causes of ACTH-dependent Cushing’s syndrome; excessive ACTH secretion from pituitary or ectopic source(s) is the most common cause of Cushing’s syndrome, and scintigraphy of the adrenal cortex would not be indicated, in that the cause of glucocorticoid excess is extra-adrenal. The recent introduction of PET with 11C-metomidate (11C-MTO) provides an alternative approach to adrenocortical scintigraphy, and 11C-MTO can be used to differentiate neoplasms of adrenocortical origin (including nonhypersecreting and hypersecreting cortical adenomas, adrenocortical carcinomas, and macronodular hyperplasia) from nonadrenocortical tumors (benign and malignant pheochromocytoma, and metastases to the adrenal) with high specificity and sensitivity; however, 11C-MTO PET does not distinguish benign adrenal neoplasms from adrenocortical carcinomas.110–114 Maximal adrenal accumulation of 11C-MTO expressed as a weight- and decay-corrected standardized uptake value (SUV) was higher in hypersecreting adrenal adenomas and adrenocortical carcinomas than in normal adrenal cortex, suggesting relative “suppression” of contralateral adrenal 11β-hydroxylase activity. This is the result of uncontrolled adrenal hyperfunction upon hypothalamic and pituitary secretogogues, with a pattern of imaging that is akin to the suppression of radiocholesterol uptake by the normal contralateral adrenal cortex in ACTH-independent Cushing’s syndrome from a hypersecreting adrenal adenoma.111 Alternatively, the glucose analogue, 18F-FDG, has been reported to image both primary and metastatic adrenocortical carcinomas, as well as some adrenocortical adenomas and bilateral adrenal hyperplasia.112,115–118
Primary Aldosteronism
The efficacy of adrenal scintigraphy with NP-59 in the evaluation of primary aldosteronism (PA) has been well established, and, with the addition of dexamethasone suppression (DS) of pituitary ACTH secretion and accumulation of radiocholesterol by the inner adrenal cortex, scintigraphy is an accurate means of distinguishing adrenal adenoma from bilateral adrenal hyperplasia.107
More recently, PET with 11C-MTO has been used to depict primary aldosteronism due to adrenal adenoma in a small series.112 Standardized uptake values in adrenal adenomas did not differ greatly from those in the normal adrenal cortex; adenoma/normal cortex SUV ratios ranged from 0.9 to 1.7, with a mean of 1.2, reflecting lack of suppression of 11β-hydroxylase enzyme activity in PA that differs from adenoma/normal adrenal SUV ratios described in Cushing’s adenomas and hypersecreting adrenocortical carcinoma, suggesting a role for DS in studies of PA with 11C-MTO.112
Incidentally Discovered Adrenal Masses
Functional adrenal imaging using iodocholesterol, metaiodobenzylguanidine (MIBG), or FDG has been demonstrated to have high sensitivity and specificity for characterization of incidentally discovered adrenal masses. As a result of their differing mechanisms of adrenal gland uptake, NP-59, MIBG, and FDG target different physiologic processes, and as a result, each can be used to functionally characterize nonhypersecretory adrenal tumors.119,120 Maurea et al.119 demonstrated that iodocholesterol imaging had a positive predictive value of 89% and a negative predictive value of 100% in patients with adrenal adenomas, and that MIBG had positive and negative predictive values of 83% and 100% for confirming an adrenal mass as neuroendocrine, respectively, and FDG differentiated benign from malignant adrenal lesions with 100% sensitivity and specificity. Thus, in using scintigraphy to distinguish nonhyperfunctioning adrenal masses in patients without a history of cancer, iodocholesterol would be the initial radiopharmaceutical of choice, because benign adenomas are the most common incidentally discovered adrenal masses. Should iodocholesterol imaging be normal, MIBG would be used next to identify a nonhypersecreting pheochromocytoma, and if MIBG is nonlocalizing, FDG should follow. In patients with a prior history of malignancy, FDG should be the initial study of choice, followed in sequence by iodocholesterol and MIBG imaging.119,120
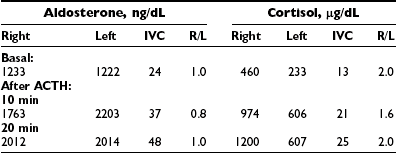
Fluorodeoxyglucose PET (FDG-PET) can be used to identify adrenocortical carcinomas and metastases to the adrenals from benign adrenal masses (Figs. 10-26 and 10-27). In 50 patients with known or suspected malignancy, FDG-PET had a sensitivity of 100%, a specificity of 94%, and an accuracy of 96% for characterization of adrenal lesions.121 In another study of 105 patients with adrenal masses, Metser et al.122 reported that FDG-PET had a sensitivity of 98.5% and a specificity of 92% at a cutoff SUV of 3.1, while the addition of CT to PET resulted in increased specificity to 98%, with all lesions correctly categorized as benign or malignant.
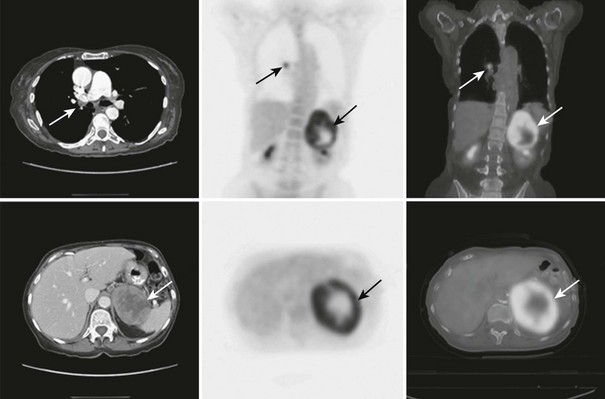
FIGURE 10-26 FDG-PET/CT scan in a 74-year-old woman with non–small cell lung cancer after a right lower lobe resection and chemotherapy. A follow-up PET/CT scan demonstrates metaststic right hilar lymphadenopathy and a large left adrenal metastasis. The adrenal lesion displays intense FDG activity peripherally with a central photopenic area consistent with a metabolically active rim and central tumor necrosis. CT, Computed tomography; FDG, fluorodeoxyglucose; PET, positron emission tomography. (From Gross MD, Avram A, Fig LM, Rubello D: Contemporary adrenal scintigraphy, Eur J Nucl Med Mol Imaging 34:547–557, 2007.)
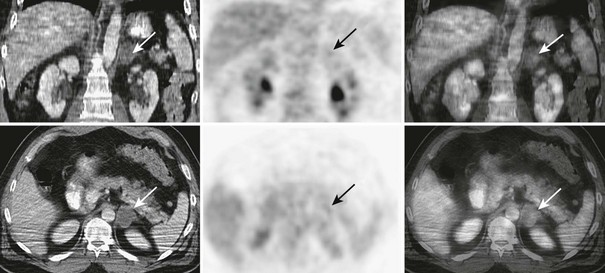
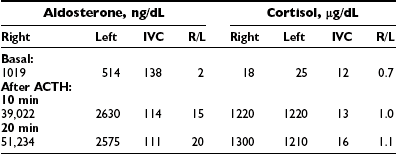
FIGURE 10-27 FDG-PET/CT in a 46-year-old man with a squamous cell carcinoma of the neck after external beam radiation therapy. Restaging PET/CT demonstrates a low-attenuation, non–FDG-avid, 3.7 cm diameter left adrenal nodule consistent with a benign adrenal adenoma. CT, Computed tomography; FDG, fluorodeoxyglucose; PET, positron emission tomography. (From Gross MD, Avram A, Fig LM, Rubello D: Contemporary adrenal scintigraphy, Eur J Nucl Med Mol Imaging 34:547–557, 2007.)
In a study of 21 patients with incidentally discovered hypersecretory and nonhypersecretory masses, 11C-MTO PET identified all lesions of adrenocortical origin, with the highest SUV in adrenocortical carcinomas (SUV 28), followed by hypersecretory adrenal cortical adenomas (SUV 12.7) and nonsecretory adenomas (SUV 12.2); noncortical tumors demonstrated an SUV of 5.7. Fluorodeoxyglucose PET depicted pheochromocytomas and adrenocortical carcinomas, but all nonhypersecreting and most hypersecreting adenomas demonstrated minimal or no appreciable FDG accumulation.112 Recently, 18F-labeled MTO has been used to image the normal adrenal cortex, and 123I-labeled MTO has shown adrenal accumulation sufficient for SPECT/CT imaging of the adrenal cortex.123,124
Adrenal Medulla/Adrenergic Tumor Scintigraphy
Although radiolabeled catecholamines and analogues were the first compounds evaluated as potential agents for imaging the adrenal medulla, successful imaging did not occur until neuronal blocking agents were considered.125 The iodobenzylguanidines exhibited avid medulla concentration in experimental animals, and MIBG demonstrated significantly earlier accumulation and favorable target-to-nontarget imaging ratios when compared with other analogues.125–131 MIBG, labeled with 123I or 131I, has been used to localize tumors of neuroendocrine origin.114,115,121,145 Various radioisotopes (e.g., 124I, 18F) and modifications of the parent compound (i.e., aminobenzylguanidine) have been met with success in imaging adrenergic neoplasms.103
The mechanism of accumulation of MIBG and analogues by neuroendocrine tissues involves norepinephrine reuptake mechanisms into catecholamine storage vesicles of adrenergic nerve endings and adrenomedullary cells.132 Uptake of MIBG can be blocked by reserpine, tricyclic antidepressants, and other drugs that affect MIBG accumulation by neuroendocrine tissues, and these must be excluded before MIBG scintigraphy is performed.127,128 Neither α- nor β-adrenergic blockade interferes with MIBG uptake, and, with the exception of labetolol, which has an inhibitory action on amine uptake, MIBG imaging can be performed during treatment for hypercatecholaminemia.128,132,133,134
Hydroxyephedrine (HED), an analogue of norepinephrine, is concentrated into adrenergic nerve terminals by the norepinephrine uptake pathway and may be labeled with 11C for use in PET.135–137 Other positron-emitting radiopharmaceuticals, such as 11C-epinephrine, the 18F-labeled glucose analogue 18F-fluorodeoxyglucose (FDG), 18F-6-fluorodopamine (18F-DA), and 18F-fluorodihydroxyphenylalanine (18F-DOPA), can be used for adrenal medulla/adrenergic tumor imaging.103,138–143
Alternative agents for imaging sympathomedullary neoplasms take advantage of the widespread distribution of somatostatin receptors and the availability of somatostatin analogues with avidity for them.154,155 123I-labeled octreotide and 111In-octreotide with the use of diethylenetriaminepentaacetate (DTPA) or tetra-aza-cyclododecane-N,N′,N″, N-tetra-acetate (DOTA) and a 68Ga-labeled derivate for PET imaging have been used to image a broad spectrum of somatostatin receptor-expressing neoplasms, including neuroendocrine tumors and pheochromocytomas.129,143–145 The radiopharmaceutical in most frequent clinical use is the eight amino acid analogue octreotide, which exhibits particular affinity for somatostatin receptor subtypes II and VI.129,144
For studies using MIBG, the entire body is imaged with anterior and posterior views from the base of the skull to the bladder. Imaging is performed routinely at 24, 48, and 72 hours after injection with 131I-MIBG.146 Metaiodobenzylguanidine labeled with 123I provides excellent images as early as 6 hours post injection, and later, 24 hour images.129 Octreotide imaging requires no prior patient preparation other than discontinuation of other long-acting somatostatin analogues. Imaging usually is performed at 6 and 24 hours post injection with both planar imaging and SPECT (and more recently, hybrid SPECT/CT) of the chest and abdomen.147 Positron emission tomography with 11C-HED, 11C-epinephrine, 18F-FDG, and 18F-fluorodopamine and 18F-DOPA affords much earlier imaging of pheochromocytomas and other neuroendocrine tumors, within minutes post injection.129,139,141,142
Clinical Applications of Adrenomedulla Scintigraphy
Most pheochromocytomas are sporadic and are found within the adrenal gland.129,148 MIBG accurately depicts the majority of lesions and, because of the added benefit of whole-body screening afforded by scintigraphy, can identify the not infrequent occurrence of multifocal and/or remote metastatic disease (Fig. 10-28).132,146,148 MIBG scintigraphy is clinically useful in depicting extra-adrenal pheochromocytomas, because of their small size or close relationship to other structures and potential remote locations from the base of the skull to the pelvis149,150 (Fig. 10-29). Total body scintigraphy is also valuable in suspected recurrent pheochromocytomas, distant metastases, and in locally recurrent tumor(s). Anatomic imaging procedures may fail to depict recurrence because of distorted anatomy or, in the case of CT, metal clip imaging artifacts. Neither MIBG nor 111In-octreotide is affected by these factors.108,151 In malignant pheochromocytoma studied with MIBG, the most common sites of metastatic disease are the skeleton, lymph nodes, lung, and peritoneum, and MIBG scintigraphy has been shown to be a sensitive technique for simultaneously evaluating all of these sites; however, more recent studies have suggested that the PET agents 18F-DA and 18F-DOPA may be more sensitive than MIBG in depiciting small and remote metastatic disease (Fig. 10-30).110,139,141,152
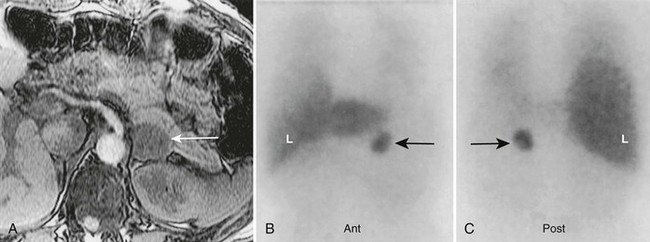
FIGURE 10-28 Left adrenal pheochromocytoma demonstrated by 123I-MIBG and magnetic resonance imaging (MRI). A 50-year-old female with hypertension, a history of neurofibromatosis, elevated plasma catecholamines, and a 3 cm left adrenal mass on MRI. A, Abdominal MRI, transverse section, with left adrenal pheochromocytoma (white arrow). B, Anterior abdominal 123I-MIBG scan with normal liver (L) uptake. The black arrow indicates intense, focal tracer uptake in the region of the left adrenal gland. C, Posterior abdominal 123I-MIBG scan. The black arrow indicates left adrenal pheochromocytoma. MIBG, Meta-iodobenzylguanidine. (From Rubello D, Bui C, Casara D, et al: Functional scintigraphy of the adrenal gland, Eur J Endocrinol 147:13–28, 2002.)
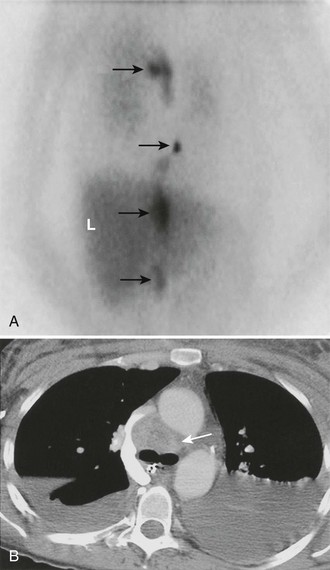
FIGURE 10-29 Malignant, metastatic pheochromocytoma demonstrated by 123I-MIBG and computed tomography (CT) in a 31-year-old woman after bilateral adrenalectomy and persistent hypertension complicated by renal insufficiency and recent development of superior vena cava (SVC) obstruction. A, Anterior chest and abdomen scan with normal liver (L) uptake. Black arrows depict multiple, abnormal foci of 123I-MIBG in metastatic pheochromocytoma deposits in the mediastinal and para-aortic regions. B, Chest CT identifies the superior mediastinal mass responsible for SVC obstruction (white arrow). MIBG, Meta-iodobenzylguanidine. (From Rubello D, Bui C, Casara D, et al: Functional scintigraphy of the adrenal gland, Eur J Endocrinol 147:13–28, 2002.)
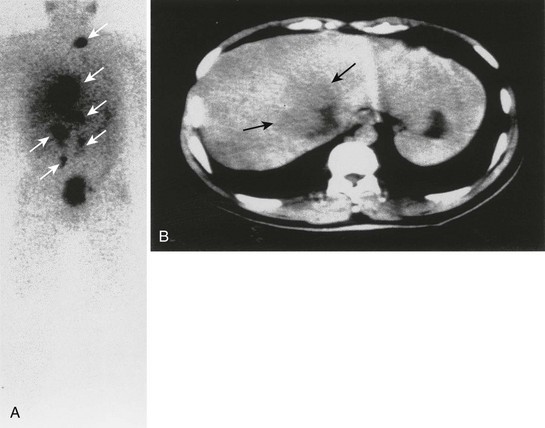
FIGURE 10-30 Anterior whole-body 111In-octreotide (A) and transverse abdominal computed tomography (B) scans in a patient with metastatic pheochromocytoma. The liver metastasis was the only metastatic deposit (black arrows) suspected before the 111In-octreotide scan, which depicted widespread metastatic disease (white arrows). (From Gross MD, Shapiro B: Adrenal scintigraphy. In Khalkhali I, Maublant J, Goldsmith S [eds]: Nuclear Oncology. Philadelphia, Lippincott, Williams & Wilkins, 2000, p 472.)
111In-octreotide has been shown to have high sensitivity in the evaluation of extra-adrenal pheochromocytoma; however, as a result of the distribution of somatostatin receptors, specificity is limited in malignant and benign neoplasms, as many nonendocrine tumors (e.g., breast cancer, meningioma, Hodgkin’s and non-Hodgkin’s lymphoma), granulomatous and inflammatory diseases (e.g., sarcoidosis, tuberculosis), and autoimmune diseases (Graves’ eye disease, rheumatoid arthritis) express somatostatin receptors and image with octreotide153,154 (Fig. 10-31). 111In-octreotide imaging is useful when MIBG is negative in metastatic pheochromocytoma and with a high clinical suspicion of metastases, or when other neuroendocrine neoplasms are suspected.129,147,153–156
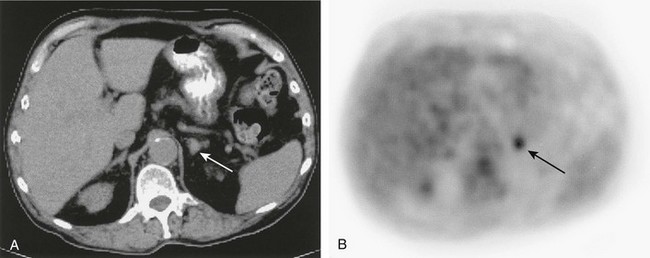
FIGURE 10-31 Abdominal computed tomography (A) depicts a <2 cm diameter left adrenal mass (white arrow) in a patient with lymphoma in the chest. A corresponding 18F-FDG positron emission tomography (PET) scan (B) demonstrates that the mass (black arrow) avidly accumulated 18F-FDG, which is compatible with an adrenal metastasis. The PET findings are important as the disease was upstaged from IIA to IIIB. 18F-FDG, 18F-fluorodeoxyglucose.
Most pheochromocytomas can be imaged with 18F-FDG PET. Shulkin et al.139 identified 22 of 29 patients with pheochromocytomas with 18F-FDG, and reported that MIBG-negative pheochromocytomas were depicted with FDG, a finding that has been confirmed by others. Discordant results comparing FDG, MIBG, and 18F-DA imaging, were seen in five patients with metastatic pheochromocytoma, and both 123I MIBG and 18F-DA underestimated the extent of disease when compared with CT and MRI. Fluorodeoxyglucose PET depicted lesions not identified by 123I-MIBG or 18F-DA.158 Fluorodopamine correctly identified 16 patients with metastatic pheochromocytomas in which some metastases did not image with planar 131I-MIBG scans.159 18F-DOPA demonstrated better imaging than MIBG in 17 patients with pheochromocytoma, and in a companion study, the combination of MRI and 18F-DOPA PET identified additional lesions that were not appreciated on MRI alone.142,143 Hydroxyephedrine labeled with 11C has been used with success to image pheochromocytomas. Rapid and early imaging approximately 10 minutes post injection was seen in nine of ten patients.160 Trampal et al.161 reported 13 pheochromocytomas that were depicted in 12 patients (sensitivity 92%), with one false-negative and seven true-negative studies (specificity 100%) in patients without pheochromocytomas.
Recommendations for the scintigraphic imaging of pheochromocytomas include consideration of the difficulty involved in predicting the malignant potential of a lesion; thus, localization should include two different imaging modalities: anatomic imaging to assess structural detail (tumor size, vascular and organ invasion) and scintigraphy to survey for metastases. At present, the initial imaging agent of choice is 123I-MIBG (or 131I MIBG, if 123I-MIBG is not available). Should 123I-MIBG be nonlocalizing, if available, PET using 18F-DA or 18F-DOPA should be considered.157,159,161 In the event that PET radiopharmaceuticals are negative, the tumor may have undergone malignant dedifferentiation with loss of specific uptake transporters. In these instances, imaging with 18F-FDG or 111In-octreotide can be used to identify metastases and guide subsequent therapy.157,162,163
Other Clinical Applications
In multiple endocrine neoplasia (MEN) type 2, MIBG has been particularly useful. This autosomal dominant disorder is characterized by parathyroid hyperplasia, medullary carcinoma of the thyroid and adrenal medullary hyperplasia or pheochromocytoma (MEN2A), or medullary carcinoma of thyroid, mucosal ganglioneuromata, and adrenal medullary hyperplasia or pheochromocytoma (MEN2B). MIBG has been used to follow the course of development of disease of the adrenal medulla in this disorder and may facilitate the proper timing of surgical intervention, bilateral adrenalectomy, by functionally characterizing the progression of adrenal medulla hyperplasia to bilateral pheochromocytomas.164
Neurofibromatosis is associated with an increased incidence of pheochromocytoma, and because of the difficulty involved in differentiating pheochromocytoma from retroperitoneal neurofibroma, functional imaging with MIBG has utility and efficacy in these patients.165,167 The role of 123I-MIBG imaging in the detection, staging, and monitoring of responses to therapy, and in the distinction of residual tumor from scar in the management of neuroblastoma, is well established.173–175 Both 131I and 123I-MIBG scintigraphy are superior to bone scintigraphy for the detection of skeletal involvement in neuroblastoma.168,169
Carbon-11–labeled HED, 11C-epinephrine, 18F-FDG, and 18F-fluorodopamine have been used to localize neuroblastoma.138,170 High-quality PET images of these tumors can be obtained as early as 10 minutes after injection and are comparable to SPECT images obtained 24 hours after 123I-MIBG (Fig. 10-32).
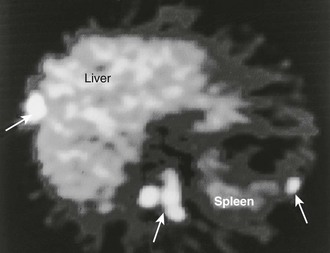
FIGURE 10-32 11C-Hydroxyephedrine (11C-HED) positron emission tomography (PET) scan in a patient with malignant pheochromocytoma. Multiple areas of increased uptake are seen in the liver, abdomen, and spleen (arrows). (From Gross MD, Shapiro B: Adrenal scintigraphy. In Khalkhali I, Maublant J, Goldsmith S [eds]: Nuclear Oncology. Philadelphia, Lippincott, Williams & Wilkins, 2000, p 472.)
Intense uptake and prolonged retention of tracer doses of 131I-MIBG observed in metastatic pheochromocytoma and neuroblastoma have raised the possibility of therapy with this and other related radiopharmaceuticals, which in the case of neuroblastoma has become a therapeutic alternative with excellent results.171–178 In addition, some somatostatin analogues, such as 90Y-DOTA-octreotide, have been used as radiotherapeutic agents for somatostatin receptor-expressing malignant neuroendocrine tumors, including pheochromocytoma.179
References
1. Francis, IR, Korobkin, M, Quint, L, et al. Integrated imaging of adrenal disease. Radiology. 1992;182:1–13.
2. Doppman, JL, Miller, DL, Dwyer, AJ, et al. Macronodular adrenal hyperplasia in Cushing disease. Radiology. 1988;166:347–352.
3. Doppman, JL, Chrousos, GP, Papanicolaou, DA, et al. Adrenocorticotropin-independent macronodular adrenal hyperplasia: an uncommon cause of primary adrenal hypercortisolism. Radiology. 2000;216:797–1411.
4. Korobkin, M, Francis, IR. Adrenal imaging. Semin Ultrasound CT MR. 1995;16:317–330.
5. Lingam, RK, Sohaib, SA, Vlahos, I, et al. CT of primary hyperaldosteronism (Conn syndrome): the value of measuring the adrenal gland. Am J Roentgenol. 2003;181:843–849.
6. Hollack, CEM, Prummel, MF, Tiel-Van Buul, MMC. Bilateral adrenal tumors in primary aldosteronism: localization of a unilateral aldosteronoma by dexamethasone suppression scan. J Intern Med. 1991;119:545–548.
7. Doppman, JL, Gill, JR, Miller, DL, et al. Distinction between hyperaldosteronism due to bilateral hyperplasia and unilateral aldosteronoma: reliability of CT. Radiology. 1992;184:677–682.
8. Blevins, LS, Jr., Wand, GS. Primary aldosteronism: an endocrine perspective. Radiology. 1992;184:599–600.
9. Sohaib, SA, Peppercorn, PD, Allan, C, et al. Primary hyperaldosteronism (Conn syndrome): MR imaging findings. Radiology. 2000;214:527–531.
10. Sheaves, R, Goldin, J, Reznek, RH, et al. Relative value of computed tomography scanning and venous sampling in establishing the cause of primary hyperaldosteronism. Eur J Endocrinol. 1996;134:308–313.
11. Dunnick, NR, Leight, GS, Jr., Roubidoux, MA, et al. CT in the diagnosis of primary aldosteronism: sensitivity in 29 patients. Am J Roentgenol. 1993;160:321–324.
12. Ikeda, DM, Francis, IR, Glazer, GM, et al. The detection of adrenal tumors and hyperplasia in patients with primary aldosteronism: comparison of scintigraphy, CT, and MR imaging. Am J Roentgenol. 1989;153:301–306.
13. Raisanen, J, Shapiro, B, Glazer, GM, et al. Plasma catecholamines in pheochromocytoma: effect of urographic contrast media. Am J Roentgenol. 1984;143:43–46.
14. Mukherjee, JJ, Peppercorn, PD, Reznek, RH, et al. Pheochromocytoma: effect of nonionic contrast medium in CT on circulating catecholamine levels. Radiology. 1997;202:227–231.
15. Blake, MA, Krishnamoorthy, SK, Boland, GW, et al. Low-density pheochromocytoma on CT: A mimicker of adrenal adenoma. Am J Roentgenol. 2003;181:1663–1668.
16. Hamilton, BH, Francis, IR, Gross, BH, et al. Intrapericardial paragangliomas (pheochromocytomas): imaging features. Am J Roentgenol. 1997;168:109–113.
17. Francis, IR, Korobkin, M. Pheochromocytoma. Radiol Clin North Am. 1996;34:1101–1112.
18. McMurry, JF, Jr., Long, D, McClure, R, et al. Addison’s disease with adrenal enlargement on computed tomographic scans: report of two cases of tuberculosis and review of the literature. Am J Med. 1984;77:365–368.
19. Pedrola, G, Casado, JL, Lopez, E, et al. Clinical features of adrenal insufficiency in patients with acquired immunodeficiency syndrome. Clin Endocrinol (Oxf). 1996;45:97–101.
20. Caron, P, Shabbonier, MH, Cambus, J-P, et al. Definitive adrenal insufficiency due to bilateral adrenal hemorrhage and primary antiphospholipid syndrome. J Clin Endocrinol Metab. 1998;83:1437–1439.
21. Kloos, RT, Gross, MD, Francis, IR, et al. Incidentally discovered adrenal masses. Endocr Rev. 1995;16:460–484.
22. Barzon, L, Boscaro, M. Diagnosis and management of adrenal incidentalomas. J Urol. 2000;163:398–407.
23. Bardet, S, Rohmer, V, Murat, A, et al. 131I-6β-Iodomethylnorcholesterol scintigraphy: an assessment of its role in the investigation of adrenocortical incidentalomas. Clin Endocrinol. 1996;44:587–596.
24. Korobkin, M, Francis, IR, Kloos, RT, et al. The incidental adrenal mass. Radiol Clin North Am. 1996;34:1037–1054.
25. Gross, MD, Shapiro, B. Clinically silent adrenal masses. J Clin Endocrinol Metab. 1993;77:885–888.
26. Osella, G, Terzolo, M, Borretta, G, et al. Endocrine evaluation of incidentally discovered adrenal masses (incidentalomas). J Clin Endocrinol Metab. 1994;79:1532–1539.
27. Dunnick, NR, Korobkin, M. Imaging of adrenal incidentalomas: current status. Am J Roentgenol. 2002;179:559–568.
28. Incidentally discovered adrenal mass: National Institutes of Health (NIH) Consensus Conference, Bethesda, MD, February 4–6, 2002.
29. Goldman, HB, Howard, RC, Patterson, AL. Spontaneous retroperitoneal hemorrhage from a giant adrenal myelolipoma. J Urol. 1996;155:639.
30. Russell, C, Goodacre, BW, van Sonnenberg, E, et al. Spontaneous rupture of adrenal myelolipoma: spiral CT appearance. Abdom Imaging. 2000;25:431–434.
31. Sneiders, A, Zhang, G, Gordon, BE. Extra-adrenal perirenal myelolipoma. J Urol. 1993;150:1496–1497.
32. Kammen, BF, Elder, DE, Fraker, DL, et al. Extraadrenal myelolipoma: MR imaging findings. Am J Roentgenol. 1998;171:721–723.
33. Cyran, KM, Kenney, PJ, Memel, DS, et al. Adrenal myelolipoma. Am J Roentgenol. 1996;166:395–400.
34. Rao, P, Kenney, PJ, Wagner, BJ, et al. Imaging and pathologic features of myelolipoma. Radiographics. 1997;17:1373–1385.
35. Cheema, P, Cartegena, R, Staubitz, W. Adrenal cysts: diagnosis and treatment. J Urol. 1981;126:396–399.
36. Rozenblit, A, Morehouse, HT, Amis, SE, Jr. Cystic adrenal lesions: CT features. Radiology. 1996;201:541–548.
37. Xarli, VP, Steale, AA, Davis, PJ, et al. Adrenal hemorrhage in the adult. Medicine. 1978;57:211–221.
38. Burks, DW, Mirvis, SE, Shanmuganathan, K. Acute adrenal injury after blunt abdominal trauma: CT findings. Am J Roentgenol. 1992;158:503–507.
39. Bookstein, JJ, Conn, J, Reuter, SR. Intra-adrenal hemorrhage as a complication of adrenal venography in primary aldosteronism. Radiology. 1968;90:778–779.
40. Bayliss, RIS, Edwards, OM, Starer, F. Complications of adrenal venography. Br J Radiol. 1970;43:531–533.
41. Ling, D, Korobkin, M, Silverman, PM, et al. CT demonstration of bilateral adrenal hemorrhage. Am J Roentgenol. 1983;141:307–308.
42. Roubidoux, MA. MR imaging of hemorrhage and iron deposition in the kidney. Radiographics. 1994;14:1033–1044.
43. Kawashima, A, Sandler, CM, Ernst, RD, et al. Imaging of nontraumatic hemorrhage of the adrenal gland. Radiographics. 1999;19:949–963.
44. Wilson, DA, Muchmore, HG, Tisdal, RG, et al. Histoplasmosis of the adrenal gland studied by CT. Radiology. 1984;150:779–783.
45. Ferrozzi, F, Tognini, G, Bova, D, et al. Hemangiosarcoma of the adrenal glands: CT findings in two cases. Abdom Imaging. 2001;26:336–339.
46. Honig, SC, Klavans, MS, Hyde, C, et al. Adrenal hemangioma: an unusual adrenal mass delineated with magnetic resonance imaging. J Urol. 1991;146:400–402.
47. Kawashima, A, Sandler, CM, Fishman, EK, et al. Spectrum of CT findings in nonmalignant disease of the adrenal gland. Radiographics. 1998;18:393–412.
48. Krebs, TL, Wagner, BJ. MR imaging of the adrenal gland: Radiologic-pathologic correlation. Radiographics. 1998;18:1425–1440.
49. Radin, R, David, CL, Goldfarb, H, et al. Adrenal and extra-adrenal retroperitoneal ganglioneuroma: Imaging findings in 13 adults. Radiology. 1997;202:703–707.
50. Johnson, GL, Hruban, RH, Marshall, FF, et al. Primary adrenal ganglioneuroma: CT findings in four patients. Am J Roentgenol. 1997;169:169–171.
51. Feinstein, RS, Gatewood, OMB, Fishman, EK, et al. Computed tomography of adult neuroblastoma. J Comput Assist Tomogr. 1984;8:720–726.
52. St. John Sutton, MG, Sheps, SG, Lie, JT. Prevalence of clinically unsuspected pheochromocytoma: review of a 50-year autopsy series. Mayo Clin Proc. 1981;56:354–360.
53. Lucon, AM, Pereira, MAA, Mendonca, BB, et al. Pheochromocytoma: study of 50 cases. J Urol. 1997;157:1208–1212.
54. Commons, RR, Callaway, CP. Adenomas of the adrenal cortex. Arch Intern Med. 1948;81:37–41.
55. Kokko, JP, Brown, TC, Berman, MM. Adrenal adenoma and hypertension. Lancet. 1967;1:468–470.
56. Hedeland, H, Östberg, G, Hökfelt, B. On the prevalence of adrenocortical adenomas in an autopsy material in relation to hypertension and diabetes. Acta Med Scand. 1968;184:211–214.
57. Russi, S, Blumenthal, HT, Gray, SH. Small adenomas of the adrenal cortex in hypertension and diabetes. Arch Intern Med. 1945;76:284–291.
58. Aso, Y, Homma, Y. A survey on incidental adrenal tumors in Japan. J Urol. 1992;147:1478–1481.
59. Korobkin, M, Giordano, TJ, Brodeur, FJ, et al. Adrenal adenomas: relationship between histologic lipid and CT and MR findings. Radiology. 1996;200:743–747.
60. Krestin, GP, Friedmann, G, Fischbach, R, et al. Evaluation of adrenal masses in oncologic patients: dynamic contrast-enhanced MR vs CT. J Comput Assist Tomogr. 1991;15:104–110.
61. Dunnick, NR, Korobkin, M, Francis, I. Adrenal radiology: distinguishing benign from malignant adrenal masses. Am J Roentgenol. 1996;167:861–867.
62. Korobkin, M, Brodeur, FJ, Francis, IR, et al. CT time-attenuation washout curves of adrenal adenomas and nonadenomas. Am J Roentgenol. 1998;170:747–752.
63. Reinig, JW, Doppman, JL, Dwyer, AJ, et al. Adrenal masses differentiated by MR. Radiology. 1986;158:81–84.
64. Outwater, EK, Siegelman, ES, Radecki, PD, et al. Distinction between benign and malignant adrenal masses: Value of T1-weighted chemical-shift MR imaging. Am J Roentgenol. 1995;165:579–583.
65. Hedican, SP, Marshall, FF. Adrenocortical carcinoma with intracaval extension. J Urol. 1997;158:2056–2061.
66. Dunnick, NR, Heaston, D, Halvorsen, R, et al. CT appearance of adrenal cortical carcinoma. J Comput Assist Tomogr. 1982;6:978–982.
67. Fishman, EK, Deutch, BM, Hartman, DS, et al. Primary adrenocortical carcinoma: CT evaluation with clinical correlation. Am J Roentgenol. 1987;148:531–535.
68. Dunnick, NR, Doppman, JL, Geelhoed, GW. Intravenous extension of endocrine tumors. Am J Roentgenol. 1980;135:471–476.
69. Lee, MJ, Mayo-Smith, WW, Hahn, PF, et al. State-of-the-art MR imaging of the adrenal gland. Radiographics. 1994;14:1015–1029.
70. Schlund, JF, Kenney, PJ, Brown, ED, et al. Adrenocortical carcinoma: MR imaging appearance with current techniques. J Magn Reson Imaging. 1995;5:171–174.
71. Falchook, FS, Allard, JC. CT of primary adrenal lymphoma. J Comput Assist Tomogr. 1991;15:1048–1050.
72. Paling, MR, Williamson, BRJ. Adrenal involvement in non-Hodgkin lymphoma. Am J Roentgenol. 1983;141:303–305.
73. Abrams, HL, Spiro, R, Goldstein, N. Metastases in carcinoma: analysis of 1000 autopsied cases. Cancer. 1950;3:74–85.
74. Zornoza, J, Bracken, R, Wallace, S. Radiologic features of adrenal metastases. Urology. 1976;8:295–299.
75. Lee, MJ, Hahn, PF, Papanicolau, N, et al. Benign and malignant adrenal masses: CT distinction with attenuation coefficients, size, and observer analysis. Radiology. 1991;179:415–418.
76. Korobkin, M, Brodeur, FJ, Yutzy, GG, et al. Differentiation of adrenal adenomas from nonadenomas using CT attenuation values. Am J Roentgenol. 1996;166:531–536.
77. Boland, GW, Lee, MJ, Gazelle, GS, et al. Characterization of adrenal masses using unenhanced CT: an analysis of the CT literature. Am J Roentgenol. 1998;171:201–204.
78. Mitchell, DG, Crovello, M, Matteucci, T, et al. Benign adrenocortical masses: diagnosis with chemical shift MR imaging. Radiology. 1992;185:345–351.
79. Mayo-Smith, WW, Lee, MJ, McNicholas, MMJ, et al. Characterization of adrenal masses (<5 cm) by use of chemical shift MR imaging: observer performance versus quantitative measures. Am J Roentgenol. 1995;165:91–95.
80. Outwater, EK, Siegelman, ES, Radecki, PD, et al. Distinction between benign and malignant adrenal masses: value of T1-weighted chemical-shift MR imaging. Am J Roentgenol. 1995;165:579–583.
81. Korobkin, M, Lombardi, TJ, Aisen, AM, et al. Characterization of adrenal masses with chemical shift and gadolinium-enhanced MR imaging. Radiology. 1995;197:411–418.
82. Israel, GM, Korobkin, M, Wang, C, et al. Comparison of unenhanced CT and chemical shift MR imaging in evaluating lipid rich adrenal adenomas. Am J Roentgenol. 2004;83:215–219.
83. Outwater, EK, Siegelman, ES, Huang, AB, et al. Adrenal masses: correlation between CT attenuation value and chemical shift ratio at MR imaging with in-phase and opposed-phase sequences. Radiology. 1996;200:749–752.
84. Haider, MA, Ghai, S, Jhaveri, K, et al. Chemical shift MR imaging of hyperattenuating (>10 HU) adrenal masses: Does it still have a role? Radiology. 2004;231:711–716.
85. Szolar, DH, Kammerhuber, F. Quantitative CT evaluation of adrenal gland masses: a step forward in the differentiation between adenomas and nonadenomas? Radiology. 1997;202:517–521.
86. Krestin, GP, Steinbrich, W, Friedmann, G. Adrenal masses: evaluation with fast gradient-echo MR imaging and Gd-DTPA-enhanced dynamic studies. Radiology. 1989;171:675–680.
87. Reinig, JW, Stutley, JE, Leonhardt, CM, et al. Differentiation of adrenal masses with imaging: comparison of techniques. Radiology. 1994;192:41–46.
88. Szolar, DH, Kammerhuber, FH. Adrenal adenomas and nonadenomas: assessment of washout at delayed contrast-enhanced CT. Radiology. 1998;207:369–375.
89. Caoili, EM, Korobkin, M, Francis, IR, et al. Delayed enhanced CT of lipid-poor adrenal adenomas. Am J Roentgenol. 2000;175:1411–1415.
90. Peña, CS, Boland, GWL, Hahn, PF, et al. Characterization of indeterminate (lipid-poor) adrenal masses: Use of washout characteristics at contrast-enhanced CT. Radiology. 2000;217:798–802.
91. Caoili, EM, Korobkin, M, Francis, IR, et al. Combined unenhanced and delayed enhanced CT for characterization of adrenal masses. Radiology. 2002;222:629–633.
92. Blake, MA, Kalra, MK, Sweeney, AT, et al. Distinguishing benig from maligant adrenal masses: Multidetector row CT protocal with 10 minutes delay. Radiology. 2006;238:578–585.
93. Song, JH, Chaudhry, FS, Mayo-Smith, WW. The incidental indeterminate adrenal mass on CT (>10 HU) in patients without cancer. Is further imaging necessary: follow up of 321 consecutive indeterminate adrenal masses. Am J Roentgenol. 2007;189:1119–1123.
94. Newhouse, JH, Heffess, CS, Wagner, GJ, et al. Large degenerated adrenal adenomas: radiologic-pathologic correlation. Radiology. 1999;210:385–391.
95. Szolar, DH, Korobkin, M, Reittner, P, et al. Adrenocortical carconomas and adrenal pheochromocytomas: mass and enhancement loss evaluation at delayed contrast-enhanced CT. Radiology. 2005;234:479–485.
96. Slattery, JM, Blake, MA, Kalra, MK, et al. Adrenocortical carcinoma: contrast washout characteristics on CT. Am J Roetgenol. 2006;187:W21–W24.
97. Geisinger, MA, Zelch, MG, Bravo, EL, et al. Primary hyperaldosteronism: Comparison of CT, adrenal venography, and venous sampling. Am J Roentgenol. 1983;141:299–302.
98. Young, WF, Jr., Stanson, AW, Grant, CS, et al. Primary aldosteronism: adrenal venous sampling. Surgery. 1996;120:913–919.
99. Thakkar, RB, Oparil, S. Primary aldosteronism: a practical approach to diagnosis and treatment. J Clin Hypertens. 2001;3:189–195.
100. Rossi, R, Savastano, S, Tommaselli, AP, et al. Percutaneous computed tomography–guided ethanol injection in aldosterone-producing adrenocortical adenoma. Eur J Endocrinol. 1995;132:302–305.
101. Liang, HL, Pan, HB, Lee, YH, et al. Small functional adrenal adenoma: treatment with CT-guided percutaneous acetic acid injection: report of three cases. Radiology. 1999;213:612–615.
102. Hokotate, H, Inoue, H, Baba, Y, et al. Aldosteronomas: experience with superselective adrenal arterial embolization in 33 cases. Radiology. 2003;227:401–406.
103. Gross, MD, Rubello, D, Shapiro, B. Is there a future for adrenal scintigraphy? Nucl Med Commun. 2002;23:197–202.
104. Eriksson, B, Bergström, M, Sundin, A, et al. The role of PET in the localization of neuroendocrine and adrenocortical tumors. Ann NY Acad Sci. 2002;970:159–169.
105. Bergström, M, Bonasma, TA, Bergström, E, et al. In vitro and in vivo primate evaluation of carbon-11 etiomidate and carbon-11 metiomidate as potential tracers for PET imaging of the adrenal cortex and its tumors. J Nucl Med. 1998;39:982–987.
106. Shreve, P, Kloos, RT, Shapiro, B, et al. Non-hypersecretory adrenal adenomas show marked uptake and retention of C-11 acetate. J Nucl Med. 1996;37:15.
107. Gross, MD, Avram, A, Fig, LM, et al. Positron emission tomography in the diagnostic evaluation of adrenal tumors. Q J Nucl Med Mol Imaging. 2007;51:260–271.
108. Gross, MS, Avram, A, Fig, LM, et al. Contemporary adrenal scintigraphy. Eur J Nucl Med Mol Imaging. 2007;34:547–557.
109. Avram, A, Fig, LM, Gross, MD. Nuclear imaging of the adrenal gland. Semin Nucl Med. 2006;36:212–227.
110. Pacak, K, Eisenhofer, G, Goldstein, DS. Functional imaging of endocrine tumors: role of positron emission tomography. Endocr Rev. 2004;25:568–580.
111. Minn, H, Salonen, A, Friberg, J, et al. Imaging of adrenal incidentalomas with PET using (11)C-metomidate and (18)F-FDG. J Nucl Med. 2004;45:972–979.
112. Zettinig, G, Mitterhauser, M, Wadsak, W, et al. Positron emission tomography imaging of adrenal masses: 18F-fluorodeoxyglucose and the 11β-hydroxylase tracer 11C-metomidate. Eur J Nucl Med Mol Imaging. 2004;31:1224–1230.
113. Khan, TS, Sundin, A, Juhlin, C, et al. 11C-metomidate imaging of adrenocortical cancer. Eur J Nucl Med Mol Imaging. 2003;30:403–410.
114. Hennings, J, Lindhe, Ö, Bergström, M, et al. [11C]Metomidate positron emission tomography of adrenocortical tumors in correlation with histopathological findings. J Clin Endocrinol Metab. 2006;91:1410–1414.
115. Tenenbaum, F, Groussin, L, Foehrenbach, H, et al. 18F-fluorodeoxyglucose positron emission tomography as a diagnostic tool for malignancy of adrenocortical tumors? Preliminary results in 13 consecutive patients. Eur J Endocrinol. 2004;150:789–792.
116. Fassnacht, M, Kenn, W, Allolio, B. Adrenal tumors: how to establish malignancy? J Endocrinol Invest. 2004;27:387–399.
117. Rao, SK, Caride, VJ, Ponn, R, et al. F-18 fluorodeoxyglucose positron emission tomography-positive benign adrenal cortical adenoma: Imaging features and pathologic correlation. Clin Nucl Med. 2004;29:300–302.
118. Shimizu, A, Oriuchi, N, Tsushima, Y. High [18F] 2-fluoro-2-deoxy-D-glucose (FDG) uptake of adrenocortical adenoma showing subclinical Cushing’s syndrome. Ann Nucl Med. 2003;17:403–406.
119. Maurea, S, Klain, M, Mainolfi, C, et al. The diagnostic role of radionuclide imaging in evaluation of patients with nonhypersecreting adrenal masses. J Nucl Med. 2001;42:884–892.
120. Maurea, S, Caraco, C, Klain, M, et al. Imaging characterization of non-hypersecreting adrenal masses. Comparison between MR and radionuclide techniques. Q J Nucl Med Mol Imaging. 2004;48:188–197.
121. Ilias, I, Pacak, K. Anatomical and functional imaging of metastatic pheochromocytoma. Ann New York Acad Sci. 2004;1018:495–504.
122. Metser, U, Miller, E, Lerman, H, et al. 18F-FDG PET/CT in the evaluation of adrenal masses. J Nucl Med. 2006;47:32–37.
123. Wadsak, W, Mitterhauser, M, Rendl, G, et al. [18F]FETO for adrenocortical PET imaging: a pilot study in healthy volunteers. Eur J Nucl Med Mol Imaging. 2006;33:669–672.
124. Hahner, S, Stuermer, A, Kressl, M, et al. [123I]Iodometomidate for molecular imaging of adrenocortical cytochrome P450 family 11β enzymes. J Clin Endocrinol Metab. 2008;93:2358–2365.
125. Korn, N, Buswink, A, Yu, T, et al. Aradioiodinated bretylium analog as a potential agent for scanning the adrenal medulla. J Nucl Med. 1977;18:87–89.
126. Boland, GW, Goldberg, MA, Lee, MJ, et al. Indeterminate adrenal mass in patients with cancer: Evaluation at PET with 2[F-18]fluoro-2-deoxy-D-glucose. Radiology. 1995;194:131–136.
127. Wieland, DM, Wu, JL, Brown, LE, et al. Radiolabeled adrenergic neuron blocking agents: adrenal medulla imaging with (131I) iodobenzylguanidine. J Nucl Med. 1980;21:349–353.
128. Wieland, DM, Brown, LE, Tobes, MC, et al. Imaging the primate adrenal medulla with (123I) and (131I) metaiodobenzylguanidine. J Nucl Med. 1981;22:358–364.
129. Rubello, D, Bui, C, Casara, D, et al. Functional scintigraphy of the adrenal gland. Eur J Endocrinol. 2003;147:13–28.
130. Kurtaran, A, Traub, T, Shapiro, B. Scintigraphic imaging of the adrenal glands. Eur J Radiol. 2002;41:123–130.
131. Gross, MD, Shapiro, B. Radionuclide imaging of the adrenal cortex. Q J Nucl Med. 1999;43:224–232.
132. Sisson, JC, Frager, MS, Valk, TW, et al. Scintigraphic localization of pheochromocytoma. N Engl J Med. 1981;305:12–17.
133. Shapiro, B, Wieland, DM, Brown, LE, et al. 131I-meta-iodobenzylguaindine (MIBG) adrenal medullary scintigraphy: interventional studies. In: Spencer RP, ed. Interventional Nuclear Medicine. New York: Grune & Stratton; 1983:451–481.
134. Khafagi, FA, Shapiro, B, Fig, LM, et al. Labetalol reduces iodine-131 MIBG uptake by pheochromocytoma and normal tissues. J Nucl Med. 1989;30:481–489.
135. Rosenspire, KC, Haka, MS, Jewett, DM, et al. Synthesis and preliminary evaluation of (11C) metahydroxyephedrine: a false neurotransmitter agent for heart neuronal imaging. J Nucl Med. 1990;31:1328–1334.
136. Schwaiger, M, Kalff, V, Rosenspire, KC, et al. The noninvasive evaluation of the sympathetic nervous system in the human heart by PET. Circulation. 1990;82:457–464.
137. Shulkin, BL, Wieland, DM, Schwaiger, M, et al. PET scanning with hydroxyepinephrine: an approach to the localization of pheochromocytoma. J Nucl Med. 1992;33:1125–1131.
138. Shulkin, BL. PET epinephrine studies of pheochromocytoma. J Nucl Med. 1995;36:22P–23P.
139. Shulkin, BL, Koeppe, RA, Francis, IR, et al. Pheochromocytomas that do not accumulate metaiodobenzylguanidine: Localization with PET and administration of FDG. Radiology. 1993;186:711–715.
140. Pacak, K, Eisenhofer, G, Carrasquillo, JA, et al. 6-[18F]Fluorodopamine positron emission tomographic (PET) scanning for diagnostic localization of pheochromocytoma. Hypertension. 2001;38:6–8.
141. Jajer, PL, Chirakal, R, Marriott, CJ, et al. 6-L-18F-fluorodihydroxyphenylalanine PET in neuroendocrine tumors: basic aspects and emerging clinical applications. J Nucl Med. 2008;49:573–586.
142. Hoegerle, S, Nitzsche, E, Altehoefer, C, et al. Pheochromocytomas: detection with 18F-DOPA whole-body PET—initial results. Radiology. 2002;222:507–512.
143. Hoegerle, S, Ghanem, N, Altehoefer, C, et al. 18F-DOPA positron emission tomography for the detection of glomus tumors. Eur J Nucl Med Mol Imaging. 2003;230:689–694.
144. Krenning, EP, Kwekkeboom, DJ, Bakker, WH, et al. Somatostatin receptor scintigraphy with [111In-DTPA-D-phe1] and [123I-Tyr3]-octreotide: the Rotterdam experience with more than 1000 patients. Eur J Nucl Med. 1993;20:716–731.
145. Win, Z, Al-Nahhas, A, Rubello, D, et al. Somatostatin receptor positron emission tomographic imaging with Gallium-68 labeled peptides. Q J Nucl Med Mol Imaging. 2007;51:244–250.
146. Nakajo, M, Shapiro, B, Copp, J, et al. The normal and abnormal distribution of the adrenomedullary imaging agent I-131-metaiodobenzylguanidine (I-MIBG) in man: evaluation by scintigraphy. J Nucl Med. 1983;24:672–682.
147. Gibril, P, Reynolds, JC, Doppman, JL, et al. Somatostatin receptor scintigraphy: Its sensitivity compared with that of other imaging methods in detecting primary and metastatic gastrinomas: a prospective study. Ann Intern Med. 1996;125:26–34.
148. Shapiro, B, Wieland, DM, Brown, LE, et al. 131I-meta-iodobenzylguaindine (MIBG) adrenal medullary scintigraphy: Interventional studies. In: Spencer RP, ed. interventional Nuclear Medicine. New York: Grune & Stratton; 1983:451–481.
149. Laursen, K, Damgaard-Pedersen, K. CT for pheochromocytoma diagnosis. Am J Roentgenol. 1980;134:277–280.
150. Shapiro, B, Sisson, JC, Kalff, V, et al. The location of middle mediastinal pheochromocytomas. J Thorac Cardiovasc Surg. 1984;87:814–820.
151. Krenning, EP, Bakker, WH, Kooij, PPM, et al. Somatostatin receptor scintigraphy with 111In-DTPA-D-Phe1-octreotide in man: metabolism, dosimetry and comparison with 123I-Tyr3-octreotide. J Nucl Med. 1992;33:652–658.
152. Ilias, I, Jorge, JY, Carrasquillo, JA, et al. Superiority of 6-[18F]-Fluorodopamine positron emission tomography versus [131I]-metaiodobenzylguanidine scintigraphy in the localization of metastatic pheochromocytoma. J Clin Endocrinol Metab. 2003;88:4083–4087.
153. Hoefnagel, CA. Metaiodobenzylguanidine and somatostatin in oncology. Eur J Nucl Med. 1994;21:568–581.
154. Reubi, JC. Peptide receptors as molecular targets for cancer diagnosis and therapy. Endocr Rev. 2003;24:389–427.
155. Van der Harst, E, de Herder, WW, Bruining, HA, et al. 123(I)Metaiodobenzylguanidine and 111(In)octreotide uptake in benign and malignant pheochromocytoma. J Clin Endocrinol Metab. 2000;86:685–693.
156. Tenenbaum, F, Lumbroso, J, Schlumberger, M, et al. Comparison of radiolabeled octreotide and meta-iodobenzylguanidine (MIBG) scintigraphy in malignant pheochromocytoma. J Nucl Med. 1995;36:1–6.
157. Ilias, I, Pacak, K. Diagnosis and management of tumors of the adrenal medulla. Horm Metab Res. 2005;37:717–721.
158. Mamede, M, Carrasquillo, JA, Chen, CC, et al. Discordant localization of 2-[18F]-fluoro-2-deoxy-D-glucose in 6-[18F]-fluorodopamine- and [123I]-metaiodobenzylguanidine-negative metastatic pheochromocytoma sites. Nucl Med Commun. 2006;27:31–36.
159. Ilias, I, Shulkin, B, Pacak, K. New functional imaging modalities for chromaffin tumors, neuroblastoma and ganglioneuromas. Trends Endocrinol Metab. 2005;16:66–72.
160. Hay, RV, Gross, MD. Scintigraphic imaging of the adrenals and neuroectodermal tumors. Chapter 51. In: Henkin RE, Bova D, Karesh SM, et al, eds. Nuclear Medicine. ed 2. Philadelphia: Mosby; 2006:820–844.
161. Trampal, C, Engler, H, Juhlin, C, et al. Pheochromocytomas: detection with 11C hydroxyephedrine PET. Radiology. 2004;230:423–428.
162. Eriksson, B, Bergström, M, Sundin, A, et al. The role of PET in the localization of neuroendocrine and adrenocortical tumors. Ann N Y Acad Sci. 2002;970:159–169.
163. Ilias, I, Yu, J, Carrasquillo, JA, et al. Superiority of 6-[18F]-Fluorodopamine positron emission tomography versus [131I]-metaiodobenzylguanidine scintigraphy in the localization of metastatic pheochromocytoma. J Clin Endocrinol Metab. 2003;88:4083–4087.
164. Valk, TW, Frager, MS, Gross, MD, et al. Spectrum of pheochromocytoma in multiple endocrine neoplasia: a scintigraphic portrayal using 131-I-metaiodobenzylguanidine. Ann Intern Med. 1981;94:762–767.
165. Kalff, V, Shapiro, B, Lloyd, R, et al. The spectrum of pheochromocytoma in hypertensive patients with neurofibromatosis. Arch Intern Med. 1982;142:2092–2097.
166. Shulkin, BL, Shapiro, B. Radioiodinated meta-iodobenzylguanidine in the management of neuroblastoma. In: Pochedly C, ed. Neuroblastoma. Boca Raton, FL: CRC; 1990:171–198.
167. Gelfand, MJ. Metaiodobenzylguanidine in children. Semin Nucl Med. 1993;23:231–242.
168. Gordon, I, Peters, AM, Gutman, A, et al. Tc-99m bone scans are more sensitive than I-123 MIBG scans for bone imaging in neuroblastoma. J Nucl Med. 1990;31:129–134.
169. Shulkin, BL, Shapiro, B, Hutchinson, RJ. 131I-MIBG and bone scintigraphy for the detection of neuroblastoma. J Nucl Med. 1992;33:1735–1740.
170. Shulkin, BL, Wieland, DM, Baro, ME, et al. PET studies of neuroblastoma with carbon 11-hydroxyephedrine. J Nucl Med. 1993;33:220.
171. Sisson, JC, Shapiro, B, Beierwaltes, WH, et al. Radiopharmaceutical treatment of malignant pheochromocytoma. J Nucl Med. 1984;25:197–206.
172. Shapiro, B, Sisson, JC, Lloyd, RV, et al. Malignant pheochromocytoma: clinical, biochemical and scintigraphic characterization. Clin Endocrinol (Oxf). 1984;20:189–203.
173. Shapiro, B, Copp, JE, Sisson, JC, et al. 131-I-metaiodobenzylguanidine for the locating of suspected pheochromocytoma: experience in 400 cases (441 studies). J Nucl Med. 1985;26:576–585.
174. Sisson, JC, Shapiro, B, Beierwaltes, WH, et al. Treatment of malignant pheochromocytomas with a new radiopharmaceutical. Trans Assoc Am Physicians. 1983;96:209–217.
175. Shapiro, B, Fig, LM, Gross, MD, et al. Radiochemical diagnosis of adrenal disease. Crit Rev Clin Lab Sci. 1989;27:265–298.
176. Shapiro, B, Fig, LM. General principles and perspectives of cancer therapy with radiopharmaceuticals. J Nucl Med Allied Sci. 1990;34:260–264.
177. Bravo, EL, Tagle, R. Pheochromocytoma: state-of-the-art and future prospects. Endocr Rev. 2003;24:539–553.
178. Shapiro, B, Fig, LM. Medical therapy of pheochromocytoma. Endocrinol Metab Clin North Am. 1989;18:443–481.
179. Pacak, K, Linehan, WM, Eisenhofer, G, et al. Recent advances in genetics, diagnosis, localization and treatment of pheochromocytoma. Ann Intern Med. 2001;134:319–329.
[/level-membership-for-endocrinology-diabetes-and-metabolism-category][not-level-membership-for-endocrinology-diabetes-and-metabolism-category]Chapter 10
Adrenal Gland Imaging
Adrenal Gland Imaging
Contemporary methods for adrenal gland imaging are listed in Table 10-1. Both ultrasound and arteriography are readily available and have played an important role in the evaluation of adrenal dysfunction, but neither is considered routine for adrenal gland imaging at this time.
CT is currently the primary method of imaging the adrenal gland, both for evaluating patients with abnormal adrenal function and for demonstrating adrenal anatomy in patients with incidentally discovered adrenal masses. MRI can also detect the normal and abnormal adrenal gland with accuracy similar to CT, and frequently is used to help characterize many incidental adrenal masses as adenomas. Because CT is used much more often to evaluate the abdomen for a variety of known or suspected abnormalities unrelated to the adrenal glands, it is the imaging modality with which most incidental adrenal masses are first detected.1
Normal Adrenal Anatomy
The cross-sectional anatomy of the normal adrenal gland is nearly identical on CT and MRI. The right adrenal lies higher in the abdomen than the left adrenal. It is superior to the upper pole of the right kidney, whereas the left adrenal is anteromedial to the upper pole of the left kidney. The basic morphology of the adrenal glands on transverse axial CT and MRI is that of an inverted V or an inverted Y. In the inverted Y configuration, the anterior limb is shorter and thicker than the posteromedial and posterolateral limbs and sometimes is undetectable, thus the inverted V appearance (Fig. 10-1).
Clinical Utility of CT and MRI
Most cases of Cushing’s syndrome (up to 85%) are due to excess ACTH production from a pituitary or ectopic source. The adrenals may be normal on CT or may show diffuse bilateral hyperplasia. A small percentage of patients (12% to 15%) with Cushing’s disease demonstrate multiple or, less commonly, single macronodules, varying in size from several millimeters to 7 cm. If macronodular adrenal hyperplasia is characterized by a single dominant nodule, this entity may be confused with a unilateral autonomous adrenal adenoma, leading to performance of an inappropriate unilateral adrenalectomy.2 Additional small nodules or diffuse overall enlargement of both glands usually is present, however, which together with the biochemical findings, allows the correct diagnosis to be made.
A much rarer form of macronodular adrenal hyperplasia is ACTH-independent disease. Two unique CT and MRI features of this disorder are the large mass of cortical tissue and the size of individual nodules (Fig. 10-2).3 The size of the nodules can suggest a diagnosis of bilateral metastases or bilateral adenomas, but, in the presence of Cushing’s syndrome, the appearance is practically pathognomonic of ACTH-independent macronodular adrenal hyperplasia, and bilateral adrenalectomy is indicated on the basis of clinical and CT findings.
FIGURE 10-2 ACTH-independent macronodular adrenal hyperplasia. A and B show large nodules bilaterally superimposed on markedly thickened limbs. ACTH, Adrenocorticotropic hormone.
About 30% of cases of Cushing’s syndrome are due to an ACTH-independent adrenal cortical neoplasm; about two thirds of these are due to adrenal adenomas and the other one third to adrenal cortical carcinoma. These tumors are easily detectable on both CT and MRI. Adrenal cortical adenomas are nearly always less than 5 cm in diameter, typically 2 to 2.5 cm, and have a nonspecific morphologic appearance (Fig. 10-3). Adrenal cortical carcinomas are typically larger than 5 cm in diameter, often show evidence of necrosis on enhanced CT and MRI scans, and frequently present with spread to adrenal or renal veins or evidence of distant metastatic disease (Fig. 10-4). Carcinomas are usually hypointense relative to liver on T1-weighted images and hyperintense to liver on T2-weighted images.
Primary Aldosteronism
Primary aldosteronism is characterized by moderate to severe hypertension caused by unregulated secretion of aldosterone with elevated levels of serum and urinary aldosterone, hypokalemia, and suppressed plasma renin activity (see also Chapter 12). A solitary aldosterone-producing adenoma (APA) is present in about 70% of patients, and surgical or laparoscopic adrenalectomy corrects the hypertension and hypokalemia in about 75% to 90% of cases.4 Most of the remainder have idiopathic hyperaldosteronism (IHA) with bilateral adrenal hyperplasia. Unlike patients with unilateral APA, surgery rarely cures the hypertension and the biochemical abnormalities, and these patients usually are treated medically. It is essential, therefore, to distinguish APA from IHA in primary hyperaldosteronism.
CT is widely used to differentiate between APA and IHA, but the sensitivity and specificity for the diagnosis of an adenoma vary widely in the literature, ranging from 71% to 100% and from 33% to 100%, respectively.5 If the imaging results are equivocal, adrenal venous sampling is usually recommended. Sensitivity of CT for the diagnosis of APA is lower than for most other adrenal masses because they usually are smaller than 2 cm, and sometimes are smaller than 1 cm, in diameter (Fig. 10-5).
FIGURE 10-5 Computed tomography (CT) demonstration of a 1 cm aldosterone-producing right adrenal adenoma. (From Korobkin M, Francis IR: Adrenal imaging, Semin Ultrasound CT MR 16:317–330, 1995.)
CT evaluation is hampered by the fact that a unilateral aldosteronoma may be associated with non–aldosterone-secreting nodules in the ipsilateral or contralateral gland and can result in a false diagnosis of adrenal hyperplasia.6 In addition, bilateral hyperplasia may have a predominant unilateral macronodule and may cause an erroneous diagnosis of a unilateral aldosteronoma.
Doppman and colleagues7 demonstrated that CT cannot reliably differentiate APA from IHA whenever bilateral adrenal nodules are demonstrated. In their series, 6 of 21 patients with APA were incorrectly diagnosed on CT as having IHA. Non–aldosterone-secreting nodules were detected by CT, in addition to the aldosteronoma. Most patients with a unilateral adrenal mass can proceed to unilateral adrenalectomy. Patients with bilateral adrenal nodules, as well as those in whom CT and biochemical evaluations are discordant or equivocal, often undergo bilateral selective adrenal vein sampling for aldosterone levels.8
Although most cross-sectional studies of patients with primary aldosteronism have used CT, MRI also can accurately differentiate APA from IHA.9 Among the 20 patients studied, 10 (50%) had APA and 10 (50%) had IHA. In the detection of APA, MRI had sensitivity of 70%, specificity of 100%, and accuracy of 85%, which is comparable with values reported with CT.10–12 Traditionally, the diagnosis of IHA by CT or MRI has been made by excluding the presence of an adenoma. A recent study suggests that the diagnosis can be made more directly by measuring the limb size in patients with primary aldosteronism.5 This CT-based study showed that adrenals were significantly larger in patients with bilateral hyperplasia than in patients with APA or in healthy control subjects. Sensitivity of 100% was achieved when a mean limb width of greater than 3 mm was used to diagnose IHA, and specificity of 100% was achieved when the mean limb width was 5 mm or greater. Therefore, the use of adrenal venous sampling was recommended only when the mean adrenal limb width was between 3 and 5 mm. Even when the radiologist assessed limb thickness visually, the overall results were similar to quantitative measurements.
Pheochromocytoma
Pheochromocytoma (see also Chapter 14) is often called the “10%” tumor, because about 10% are extra-adrenal in location, multiple, inherited, or malignant. Most cases are sporadic, but some are associated with multiple endocrine neoplasia (MEN) syndromes, neurofibromatosis or von Hippel-Lindau disease, or familial pheochromocytoma. Pheochromocytomas secrete the neurotransmitter hormones epinephrine and norepinephrine, which often leads to hypertension, tachycardia, headaches, palpitations, diaphoresis, and chest pains. Some or all of these findings can be present, often in an episodic pattern, but can be absent in about 10% of patients. Diagnosis of pheochromocytoma can be suspected clinically and confirmed by elevated levels of these hormones, particularly their metabolites, in the blood or the urine. Localization of a pheochromocytoma is essential because surgical resection can be curative. CT, MRI, and 131I (and 123I)-meta-iodobenzylguanidine (MIBG) imaging all have been used to localize pheochromocytomas.
Most pheochromocytomas are readily detected on CT, because they typically measure 2 to 5 cm in diameter. Although some are small and homogeneous in attenuation, many have regions of necrosis or hemorrhage and can have a fluid density on unenhanced CT. For many years, intravenous ionic contrast material was avoided in patients with known or suspected pheochromocytoma because of an effect on catecholamine levels and the fear of inducing a hypertensive crisis.13 More recently, however, a study using nonionic IV contrast showed no significant increases in catecholamine levels in control subjects or in patients with pheochromocytomas.14
Contrast-enhanced CT of adrenal pheochromocytoma shows nonspecific homogeneous or, more commonly, inhomogeneous enhancement of a solid mass, similar to the finding in adrenal metastasis or adrenal cortical carcinoma (Fig. 10-6). Most pheochromocytomas have an unenhanced attenuation greater than 10 Hounsfield units (HU), although a recent report described a single case each of pheochromocytoma (9 HU) and medullary hyperplasia (2 HU) with lipid degeneration.15 Oral contrast opacification of the gastrointestinal tract is essential for the detection of para-aortic tumors in the retroperitoneum (Fig. 10-7), because unopacified bowel at times can simulate a “mass.” Although rare, intrapericardial paragangliomas can be detected by dynamic bolus contrast-enhanced CT of the mediastinum (Fig. 10-8). The inhomogeneous mass is usually located adjacent to or involving the left atrium.16
FIGURE 10-6 Intravenous contrast-enhanced computed tomography (CT) shows a right adrenal pheochromocytoma (P) with areas of necrosis. (From Korobkin M, Francis IR: Imaging of adrenal masses, Urol Clin North Am 24:603–622, 1997.)
FIGURE 10-7 Retroperitoneal extra-adrenal pheochromocytoma. Enhanced computed tomography (CT) shows an inhomogeneous enhancing mass medial to the left kidney. A normal left adrenal was demonstrated on scans cephalad to this mass.
FIGURE 10-8 Intrapericardial extra-adrenal pheochromocytoma. Enhanced computed tomography (CT) shows an inhomogeneous mass in the expected location of the left atrium. MIBG scan was positive in this location. (From Hamilton BH, Francis IR, Gross BH, et al: Intrapericardial paragangliomas [pheochromocytomas]: Imaging features, Am J Roentgenol 168:109–113, 1997.)
On MRI, most pheochromocytomas are hypointense on T1-weighted images and markedly hyperintense on T2-weighted images. Initial reports of MRI of adrenal masses suggested that pheochromocytomas could be distinguished by their marked hyperintensity on T2-weighted images. Considerable overlap with other neoplasms, however, including adrenal cortical carcinomas, was demonstrated in up to 33% of cases.17 The cause of the high T2 signal intensity of pheochromocytomas remains controversial. Most of the initial reports were from mid and low field strength magnets, whereas currently, most MRI magnets have high field strength (1.5 T). The cause may be related to the necrotic or cystic areas so common within these tumors. MRI angiography is useful for demonstrating the presence or absence of intracaval extension of adrenal pheochromocytoma, and MRI is useful in the search for an extra-adrenal paraganglioma from the neck to the bladder.
Hypoadrenalism
Adrenal insufficiency, or hypoadrenalism, most often is due to autoimmune atrophy, and imaging usually is not useful for diagnosis. The glands are extremely small and may be difficult to identify on CT or MRI17 (Fig. 10-9). Atrophic glands may be due to chronic granulomatous disease, but these cases usually are associated with adrenal calcification. In patients with adrenal insufficiency due to granulomatous infection caused by tuberculosis, histoplasmosis, or blastomycosis, the acute and subacute phases are manifested as bilateral adrenal enlargement, although often some asymmetry is noted. Inhomogeneous low attenuation within the adrenal mass, best seen on enhanced CT or MRI, is due to caseous necrosis.18 Unlike patients with adrenal metastases, the enlarged glands in granulomatous adrenalitis typically retain their normal inverted Y contour.17 Percutaneous biopsy of the adrenals is often necessary to confirm the diagnosis of granulomatous adrenalitis and to identify the organism. Bilateral adrenal calcification from granulomatous disease can be seen in both adrenal hypofunction and normal adrenal function. Demonstration of uninvolved noncalcified adrenal tissue usually indicates normal function.
FIGURE 10-9 Computed tomography (CT) shows markedly atrophic adrenal glands in a patient with adrenal insufficiency secondary to idiopathic autoimmune atrophy. (From Korobkin M, Francis IR: Adrenal imaging, Semin Ultrasound CT MR 16:317–330, 1995.)
Bilateral adrenal hemorrhage often is accompanied by adrenal insufficiency, and the detection of bilateral hyperattenuating masses on unenhanced CT can sometimes be the first clue to a clinical diagnosis (Fig. 10-10). Although bilateral adrenal metastases are commonly seen, they usually do not lead to clinically apparent hypoadrenalism. Adrenal insufficiency can be caused by acquired immunodeficiency syndrome (AIDS) and the antiphospholipid antibody syndrome; however, the adrenal anatomy in these diseases can be variable.19,20
FIGURE 10-10 Adrenal insufficiency secondary to bilateral adrenal hemorrhage. Unenhanced computed tomography (CT) shows a high-attenuation mass in both adrenals (arrows) characteristic of acute or subacute hematoma. (From Korobkin M, Francis IR: Adrenal imaging, Semin Ultrasound CT MR 16:317–330, 1995.)
The Incidentally Discovered Adrenal Mass (Incidentaloma)
The more widespread application of high-resolution anatomic imaging to screen the abdomen for diseases or to stage diseases unrelated to the adrenal has identified a growing number of unexpected adrenal masses or “incidentalomas.”21–24 Given their prevalence in from 4% to 10% of patients studied with CT or MRI for indications other than suspected adrenal disease, novel adaptations to imaging have been made to distinguish frequent, nonhypersecretory, benign adrenal masses from adrenal metastases and adrenocortical carcinoma.22 The discovery of an adrenal mass presents a diagnostic and, at times, a therapeutic challenge. Because an overwhelming majority of incidentalomas are benign and nonhypersecretory, an aggressive approach to them is not indicated.21–23 Of course, a solitary adrenal metastasis or an incidentally discovered adrenal carcinoma treated earlier would have a more favorable result. Given the uncertainty in diagnosis of adrenal masses other than cysts and myelolipomas, many diagnostic algorithms and approaches have been offered, making the evaluation of adrenal incidentalomas controversial.21,25 A thoughtful approach to such patients must include a biochemical evaluation sufficient to exclude both cortical and medullary hyperfunction and an anatomic and/or functional imaging evaluation sufficient to exclude a malignancy.21,25–27 The continuing uncertainty about appropriate clinical and imaging management of adrenal incidentalomas was attested to at a National Institutes of Health Consensus Conference on this subject in February 2002.28
Specific Imaging Features of Incidentally Discovered Adrenal Masses
Myelolipoma: A myelolipoma is a benign tumor that comprises bone marrow elements. Myelolipomas do not produce hormones and most are detected as incidental findings. Occasionally, large tumors or those undergoing tumor necrosis or spontaneous hemorrhage may cause flank pain.29,30 Although most are adrenal in location, extra-adrenal myelolipomas have been reported.31,32 Because they include large amounts of mature fat, most myelolipomas are recognized easily on CT (Fig. 10-11). Elements of soft tissue density are found in varying amounts, and calcification is seen in up to 20% of cases.
FIGURE 10-11 Myelolipoma. Large, fatty right adrenal mass (M) is seen on this contrast-enhanced computed tomography (CT) examination. (From Korobkin M, Francis IR, Kloos RT, Dunnick NR: The incidental adrenal mass, Radiol Clin North Am 34:1037–1054, 1996.)
The appearance of a myelolipoma on MRI reflects portions of fat and bone marrow elements in the tumor. Fat exhibits high-signal intensity on both T1- and T2-weighted sequences. The bone marrow elements have a low signal intensity on T1-weighted images and a moderate signal intensity on T2-weighted scans.33,34 Because a confident diagnosis of myelolipoma usually can be made with CT or MRI, most are treated conservatively.
Cyst: Adrenal cysts are uncommon lesions with infrequent reports of their CT appearance. A 3:1 female predilection has been noted, and four types of cysts have been identified on the basis of pathologic classification: endothelial, epithelial, parasitic, and posttraumatic pseudocysts.35 A recent report of 13 new cystic adrenal masses and review of 26 benign adrenal cysts from the literature included one cystic adrenal cortical carcinoma.36 Of 37 reviewed benign cysts, 19 had mural and 7 had central calcification, 28 were unilocular, and 7 had high attenuation values. Wall thickness was 3 mm or less in 31 lesions. The authors concluded that a CT finding of a nonenhancing mass with or without wall calcification allows differentiation of an adrenal cyst from an adenoma (Fig. 10-12). A small adrenal cyst with near-water attenuation and a thin (≤3 mm) wall is likely to be benign.
Hemorrhage: Adrenal hemorrhage can be bilateral or unilateral. When bilateral, the cause is usually associated with anticoagulation therapy or a blood dyscrasia; less commonly, it is associated with the stress of surgery, sepsis, or hypotension, and, rarely, it is caused by trauma.37 Unilateral adrenal hemorrhage usually is caused by blunt abdominal trauma and involves the right gland more often than the left.38 Adrenal vein thrombosis may cause unilateral adrenal hemorrhage. This may be caused by catheterization performed to collect blood samples from the adrenal vein in patients with suspected adrenal endocrine disease.39,40 In the absence of catheterization or blunt trauma, unilateral adrenal hemorrhage into a preexisting neoplasm may occur, necessitating surgical exploration if follow-up imaging does not show a nearly normal adrenal gland.
Acute or subacute adrenal hemorrhage typically has an unenhanced attenuation value of 55 to 90 HU (Fig. 10-13). Follow-up studies show diminution in size of the adrenal mass with a gradual decrease in attenuation value.41 The high attenuation value of a recent adrenal hemorrhage is usually readily apparent on unenhanced CT but is indistinguishable from a solid adrenal neoplasm on contrast-enhanced CT. An adrenal mass detected on contrast-enhanced CT after trauma usually is assumed to be due to a hematoma, but an unrelated adrenal neoplasm can be excluded only by unenhanced CT or serial follow-up CT. Similarly, MRI may indicate hemorrhage by the high signal intensity on T1-weighted scans, reflecting the presence of methemoglobin.42,43
Nonspecific Imaging Features of Incidentally Discovered Adrenal Masses
Granulomatous Disease: Tuberculosis, histoplasmosis, and other granulomatous diseases are usually bilateral but often asymmetrical. CT findings are nonspecific and can include soft tissue masses, cystic changes, and/or calcification44 (Fig. 10-14). Although these are uncommon adrenal lesions that rarely occur unilaterally, they should be considered in the differential diagnosis of incidental bilateral adrenal masses in the absence of a primary neoplasm or coagulation abnormality. Biopsy is needed to confirm the diagnosis and identify the responsible organism.
Hemangioma: An adrenal hemangioma is a rare benign tumor. Hemangiosarcomas occur but are even less common.45 Hemangiomas comprise closely adjacent vascular channels lined with a single layer of endothelium.46 They do not produce adrenal hormones, and most are quite large when found as an incidental finding. On CT, hemangiomas are seen as large, well-defined masses. They have a soft tissue density on unenhanced images and demonstrate inhomogeneous enhancement. Most hemangiomas are calcified as the result of phleboliths within the tumor or previous hemorrhage.47
MRI findings include a hypointense appearance relative to the liver on T1-weighted sequences.48 Central hyperintensity due to hemorrhage may be noted. On T2-weighted images, hemangiomas are hyperintense. Peripheral enhancement that persists on delayed images is characteristic. Tumors are usually removed because of the risk for hemorrhage and inability to exclude malignancy.
Ganglioneuroma: A ganglioneuroma is a benign tumor composed of Schwann cells and ganglion cells. These tumors occur anywhere along the paravertebral sympathetic plexus, and approximately 20% to 30% arise in the adrenal medulla.49 Because they do not secrete hormones, most ganglioneuromas are detected as an incidental finding.50 On CT, ganglioneuromas appear as a solid adrenal mass ranging up to 11 cm in diameter.49 Extra-adrenal retroperitoneal tumors may be even larger.
Neuroblastoma: Whereas neuroblastoma is the third most common malignant tumor of childhood, it is seen much less frequently in adults. It may occur anywhere along the parasympathetic plexus. Adults are more likely than children to present with disseminated disease.51 The imaging findings of neuroblastoma in adults are similar to those in children.
Pheochromocytoma: Although most patients with pheochromocytoma present with manifestations of excess catecholamine production, approximately 10% of tumors are silent and are detected by other means such as an imaging study.52,53 The CT and MRI appearance of pheochromocytomas was described earlier.
Adenoma: Adenoma, the most common adrenal tumor, is reported as occurring in 1.4% to 8.7% of postmortem examinations, depending on the criteria used.54–56 The incidence is even higher among patients with hypertension or diabetes mellitus.55–57 Adenomas large enough to be recognized on survey abdominal CT examinations are found in approximately 1% of patients, but identification may be increasing with improvements in CT technology.58 On CT, adenomas may have the same density as normal adrenal tissue. Because most adenomas contain large amounts of intracytoplasmic lipid, many have a low density, often near that of water on unenhanced examination59 (Fig. 10-15). Calcification is rare. Adenomas enhance significantly after the intravenous administration of iodinated contrast media (Fig. 10-16). Although the degree of enhancement is not significantly different from that of other adrenal tumors, adenomas show more rapid washout of contrast than do adrenal metastases.60–62
FIGURE 10-15 Lipid-rich adenoma. Right adrenal mass (3 cm) is shown on this unenhanced computed tomography (CT) scan. Attenuation value of −4 HU allows confident diagnosis of benign lesion, either cyst or lipid-rich adenoma. (From Dunnick NR, Korobkin M: Imaging of adrenal incidentalomas: current status, Am J Roentgenol 179:559–568, 2002.)
FIGURE 10-16 Adenoma. Right adrenal gland mass (4 cm) is shown on this contrast-enhanced computed tomography (CT) examination. Attenuation value on enhanced scans is not sufficiently characteristic to distinguish benign from malignant causes. (From Dunnick NR, Korobkin M: Imaging of adrenal incidentalomas: current status, Am J Roentgenol 179:559–568, 2002.)
The MRI signal characteristics of adenomas are similar to those of normal adrenal tissue. Although the signal intensity of an adenoma tends to be low on T2-weighted sequences, this is not a useful way to distinguish adenomas from metastases, because an overlap of 20% to 30% has been reported with metastases. Chemical shift imaging is used to identify the intracytoplasmic lipid and can distinguish many adenomas from metastases63,64 (Fig. 10-17).
Carcinoma: Adrenal carcinoma is a rare tumor, with a reported incidence of two cases per million.65 Patients may present with abdominal pain, a palpable mass, or Cushing’s syndrome, as about 50% of these tumors elaborate unregulated amounts of cortisol. Many of these elaborate insufficient amounts of hormone to produce obvious clinical manifestations. Other endocrine manifestations of adrenal carcinoma include Conn’s syndrome, virilization, and feminization, but these are very rare. Tumors tend to be very large at the time of presentation (see also Chapter 11).
The CT appearance of an adrenal carcinoma is a large mass. Central necrosis is common, and calcification is seen in 20% to 30% of cases66,67 (Fig. 10-18A). Enhancement is heterogeneous after intravenous contrast administration. Venous extension of tumor into the left renal vein or the inferior vena cava is common and usually can be identified on contrast-enhanced images66 (Fig. 10-18B). It is important to define precisely the cephalad extent of the intravenous tumor, as this defines the point where the surgeon can gain vascular control of the tumor.68 Although this often can be done with CT, MRI may be helpful in problem cases.69 On MRI, carcinomas are usually heterogeneously hyperintense on both T1- and T2-weighted images, reflecting frequent internal hemorrhage and central necrosis. Enhancement is also heterogeneous, revealing nodular areas of intense enhancement and other areas with no enhancement. Intravenous extension of tumor typically is well seen on MRI because of the multiple planes in which data sets can be projected.69,70
FIGURE 10-18 Adrenal cortical carcinoma. A, Contrast-enhanced computed tomography (CT) examination shows 9 cm right adrenal mass. Irregular wall and low-density center indicate necrosis. B, More cephalad image in same examination reveals tumor extension into inferior vena cava. (From Dunnick NR, Korobkin M: Imaging of adrenal incidentalomas: current status, Am J Roentgenol 179:559–568, 2002.)
Lymphoma: Primary lymphoma of the adrenal glands is rare,71 but secondary involvement when another retroperitoneal lymphoma is present is seen more commonly among patients with non-Hodgkin’s lymphoma than among those with Hodgkin’s disease.72 Involvement is often bilateral, and other retroperitoneal disease is usually present. On MRI, lymphoma has a signal intensity lower than that of the liver on T1-weighted images. Lymphoma is typically heterogeneously hyperintense on T2-weighted sequences.
Metastases: The adrenal glands are a common site of metastatic disease, which is found in about 27% of postmortem examinations of patients with malignant neoplasms of epithelial origin.73 The most common neoplasms with adrenal metastases are carcinomas of the lung and breast, and melanoma.73,74 Small metastases are often homogeneous on contrast-enhanced CT (Fig. 10-19) or MRI, whereas large metastases often have local regions of heterogeneous appearance due to necrosis or hemorrhage or both (Fig. 10-20). Calcification is rare in adrenal metastases.
FIGURE 10-19 Metastasis from renal carcinoma in a 31-year-old woman. Small, homogeneous left adrenal mass is seen on this contrast-enhanced computed tomography (CT) examination. (From Dunnick NR, Korobkin M: Imaging of adrenal incidentalomas: current status, Am J Roentgenol 179:559–568, 2002.)
FIGURE 10-20 Necrotic metastasis from adenocarcinoma of the lung in a 34-year-old woman. Bilateral adrenal masses with areas of central necrosis are seen on this contrast-enhanced computed tomography (CT) examination. (From Dunnick NR, Korobkin M: Imaging of adrenal incidentalomas: current status, Am J Roentgenol 179:559–568, 2002.)
