[level-membership-for-cardiovascular-category]
Chapter 23 Adenosine-Sensitive (Outflow Tract) Ventricular Tachycardia
Classification
Ventricular tachycardia (VT) is usually associated with structural heart disease, with coronary artery disease and cardiomyopathy (CMP) being the most common causes. However, about 10% of patients who present with VT have no obvious structural heart disease (idiopathic VT).1 Absence of structural heart disease is usually suggested if the electrocardiogram (ECG) (except in Brugada syndrome and long QT syndrome), echocardiogram, and coronary arteriogram collectively are normal. Nevertheless, magnetic resonance (MR) imaging may demonstrate mild structural abnormalities and subtle areas of diminished wall motion in some patients with idiopathic VT, even if all other test results are normal. In addition, focal dysautonomia in the form of localized sympathetic denervation has been reported in patients with VT and no other obvious structural heart disease. Of note, idiopathic VT occasionally occurs in patients with structural heart disease, in whom the structural heart disease is not related to the VT. Furthermore, frequent or incessant idiopathic VT can be a cause of tachycardia-induced CMP.2
Several distinct types of idiopathic VT have been recognized and classified with respect to the origin of VT (right ventricle [RV] versus left ventricle [LV]), VT morphology (left bundle branch block [LBBB] versus right bundle branch block [RBBB] pattern), response to exercise testing, response to pharmacological agents (adenosine-sensitive versus verapamil-sensitive versus propranolol-sensitive VT), and behavior of VT (repetitive salvos versus sustained).3
Pathophysiology
Mechanism of Adenosine-Sensitive Ventricular Tachycardia
Most forms of outflow tract VTs are adenosine-sensitive and are thought to be caused by catecholamine-induced, cyclic adenosine monophosphate (cAMP)–mediated delayed afterdepolarizations (DADs) and triggered activity, which is supported by several tachycardia features (see Chap. 4).4 Heart rate acceleration facilitates VT initiation. This can be achieved by programmed stimulation, rapid pacing from either the ventricle or the atrium, or infusion of a catecholamine alone or during concurrent rapid pacing. Additionally, termination of the VT is dependent on direct blockade of the dihydropyridine receptor by calcium channel blockers or by agents or maneuvers that lower cAMP levels (e.g., by activation of the M2 muscarinic receptor with edrophonium or vagal maneuvers, inhibition of the beta-adrenergic receptor with beta blockers, or activation of the A1 adenosine receptor with adenosine). Furthermore, a direct relationship exists between the coupling interval of the initiating ventricular extrastimulus (VES) or ventricular pacing cycle length (CL) and the coupling interval of the first VT beat. Additionally, VT initiation is CL-dependent; pacing CLs longer or shorter than a critical CL window fail to induce VT. This critical window can shift with changing autonomic tone.1,5,6
Types of Adenosine-Sensitive Ventricular Tachycardia
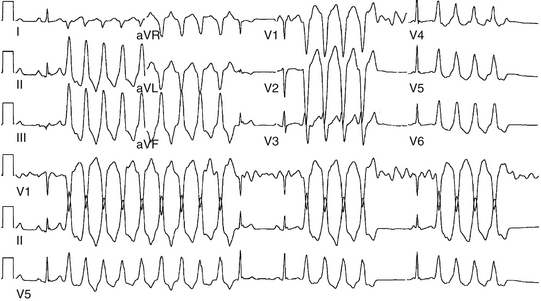
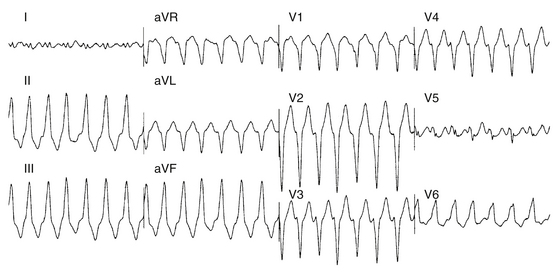
Approximately 90% of idiopathic VTs are caused by one of two phenotypic forms of adenosine-sensitive VT. Repetitive monomorphic VT is the most common form (60% to 90%) and is characterized by frequent premature ventricular complexes (PVCs), couplets, and salvos of nonsustained VT, interrupted by brief periods of normal sinus rhythm (NSR; Fig. 23-1). This form of VT usually occurs at rest or following a period of exercise, and typically decreases during exercise, but can be incessant.1 On the other hand, paroxysmal exercise-induced VT is characterized by sustained episodes of VT precipitated by exercise or emotional stress, separated by long intervals of NSR with infrequent PVCs (Fig. 23-2).1 Evidence has suggested that both types represent polar ends of the spectrum of idiopathic VT caused by cAMP-mediated triggered activity, and there is considerable overlap between the two types. Furthermore, this subtype classification, although useful, is not necessarily precise and depends on the means and duration of rhythm recordings. Patients are typically categorized based on their presenting or index arrhythmia. Prolonged telemetry and long-term ambulatory ECG recordings have demonstrated that most patients with one subtype of outflow tract VT show evidence for at least one other subtype with an identical morphology. Almost all patients with nonsustained VT have high-density repetitive runs and frequent PVCs. In patients who present with repetitive PVCs, nonsustained VT can also be observed in approximately 70%; however, only 20% of these patients develop runs of more than five beats.7
Anatomical Considerations
Adenosine-sensitive idiopathic VT usually arises from outflow tracts (most frequently from the RV outflow tract [RVOT]). Other variants of outflow tract VT (with similar underlying electrophysiological [EP] mechanism) include ventricular arrhythmias arising from the aortic cusps, pulmonary artery, mitral or tricuspid inflow tracts, papillary muscles, and epicardial foci in close proximity to the coronary venous system.3 Understanding the unique and complex anatomical relationships of the outflow tracts is critical for analyzing the ECG and mapping findings during outflow tract VT as well as for safe catheter maneuvering and ablation.
Right Ventricular Outflow Tract
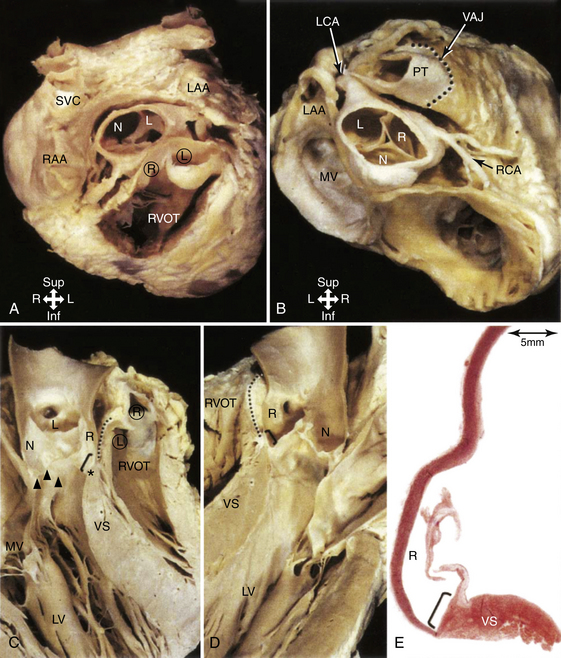
The RVOT is the tubelike portion of the RV cavity above the supraventricular crest, and is defined superiorly by the pulmonic valve and inferiorly by the RV inflow tract and the top of the tricuspid annulus (the region of the His bundle [HB] and proximal right bundle branch). The lateral aspect of the RVOT region is the RV free wall. The RVOT passes cephalad in a posterior and slightly leftward direction. The medial aspect is formed by the anterior interventricular septum at the base of the RVOT and RV musculature opposite to the anterior LV outflow region (LVOT) (as a cephalad continuation of the interventricular septum) and the root of the aorta (immediately adjacent to the right coronary cusp) at the region just inferior to the pulmonic valve (Fig. 23-3).8
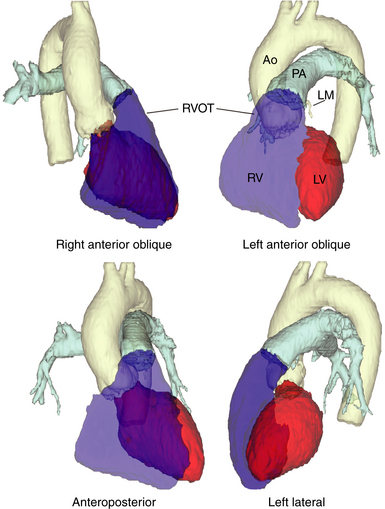
Although the medial aspect of the RVOT is frequently referred to as the “septal” wall, it should be noted that the outflow tract per se is not part of the interventricular septum, and the septum is a component only of the most proximal part of the RVOT at the branch point of the septomarginal trabeculation. Above this area, the RVOT curves to pass anterior and cephalad to the LVOT, and, therefore, any perforation in the septal part is more likely to go outside the heart than into the LV (Fig. 23-4).
From the coronal view above the pulmonic valve, the RVOT region is seen wrapping around the LVOT and the root of the aorta and extending leftward (see Fig. 23-3). Whereas the inflow portion of the RV lies to the right and anterior to the inflow portion of the LV, the RVOT courses anterior to the LVOT such that the distal RVOT and pulmonic valve are located to the left side of the body in relationship to the aortic valve and the distal LVOT. The pulmonic valve is typically placed approximately 5 to 10 mm cephalad and to the left of the aortic valve such that the supravalvular portion of the aorta lies in immediate proximity to the portions of the pulmonic valve; immediately anterior to the aortic valve is the posterior muscular infundibular portion of the RVOT.8,9
The top of the RVOT can be convex or crescent-shaped, with the posteromedial region directed rightward and the anterolateral region directed leftward. The anteromedial aspect of the RVOT actually is located in close proximity to the LV epicardium, adjacent to the anterior interventricular vein and in proximity to the left anterior descending coronary artery. The aortic valve cusps sit squarely within the crescent-shaped posterior region of the RVOT and are inferior to the pulmonic valve (see Fig. 23-3). The most posterior aspect of the RVOT is adjacent to the region of the right coronary cusp, and the posteromedial (leftward) surface is adjacent to the anterior margin of the right coronary cusp or the medial aspect of the left coronary cusp.10 The thickness of the RVOT wall is variable, ranging from approximately 3 to 6 mm, and is thinnest in the rightward, anterior, and subpulmonic valve portions, and thickest in the posterior infundibular part that is adherent to the anterior LVOT as a cephalad continuation of the interventricular septum.8
Left Ventricular Outflow Region
Unlike the RV, the inflow and outflow tracts of the LV are at an acute angle to one another. The central location of the aortic valve places the LVOT between the mitral valve and the ventricular septum. In turn, approximately half of the aortic outlet is muscular and the other half (being the area of valvular continuity between the mitral and aortic valves) is fibrous. The curvature of the ventricular septum continuing into the free wall forms the anterosuperior wall of the LVOT. It is the deep anterior (aortic) leaflet of the mitral valve that forms the aortic-mitral curtain. The extremities of the fibrous continuity are the left and right fibrous trigones, the right trigone forming the central fibrous body. The LVOT passes underneath the RVOT in a rightward and cephalad direction pointing toward the right shoulder (see Fig. 23-4).11
Aortic Cusps
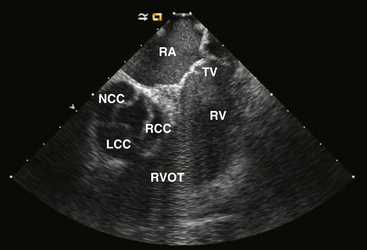
The aortic root is defined as the interface between the LV and the ascending aorta, extending from the sinotubular junction in the aorta to the basal valvular leaflets with their attachment within the LV (see Fig. 23-3). Approximately two-thirds of the circumference of the lower part of the aortic root is connected to the muscular ventricular septum, with the remaining one-third in fibrous continuity with the aortic leaflet of the mitral valve. Its components are the sinuses of Valsalva, the fibrous interleaflet triangles, and the valvular leaflets themselves. The aortic valve is composed of three symmetric, semilunar-shaped cusps. The recess of each cusp is called the “sinus of Valsalva.” The aortic (coronary) cusps are firmly anchored to the fibrous skeleton within the root of the aorta. A circular ridge on the innermost aspect of the aortic wall, at the upper margin of each sinus, is the sinotubular ridge—the junction of the sinuses and the aorta. The aortic cusps are named according to their orientation in the body—left and right (both facing the pulmonic valve anteriorly) and posterior. The left aortic sinus gives rise to the left coronary artery, and the right aortic sinus gives rise to the right coronary artery. Usually, no vessels arise from the posterior aortic sinus, which is therefore known as the noncoronary sinus. Three equally spaced sites of minimal tethering within the aortic root mark the junctions of the sinuses of Valsalva. Each sinus is associated with a leaflet of the aortic valve, whereas the junctions between the adjacent sinuses are aligned with the commissures between the aortic valve leaflets.12–14
The aortic valve is the cardiac centerpiece; it lies in contact or continuity with all four cardiac chambers and shares important proximate relationships with each of the other cardiac valves (Video 20  ). It comes into contact with the right atrium (RA), left atrium (LA), interatrial septum, RVOT, mitral valve (aortomitral continuity), pulmonic valve, tricuspid valve, and conduction system (see Fig. 23-3).8,9
The aortic root is inferior, posterior, and somewhat rightward compared with the RVOT. As noted, the posterior subpulmonic valve portions of the RVOT are immediately anterior and more proximally continuous with the anterior myocardial subaortic LVOT and more distally to the right coronary cusp. The lateral and more distal portions of the left coronary cusp lie immediately subjacent to the peripulmonic valve portions of the RVOT. In some instances, the supravalvular myocardial fibers of one outflow tract may be continuous with the other outflow tract’s infravalvular myocardium, thus forming a functional syncytium.8
The left coronary cusp lies to the left of the right coronary cusp and is related to the posterior wall of the RVOT (Fig. 23-5). The commissure between the right and left coronary cusps is just posterior to the distal RVOT and is close but caudal to the posterior pulmonic valve annulus. More leftward and posteriorly, the left coronary cusp lies in continuity with the anterior leaflet of the mitral valve (aortomitral continuity). Adjacent to this site lies the peripulmonic valve myocardium and, more laterally, the posterior lobe of the LA appendage (when present).8,9
The right coronary cusp lies immediately posterior to the relatively thick posterior infundibular portion of the RVOT. Caudally, there is continuity with the anterior LVOT, and at the level of valve insertion there is either physical continuity or very close proximity between myocardium that extends above this valve cusp, the LVOT, and the posterior RVOT. The posterior part of the right coronary cusp is adjacent to the central fibrous body, which carries within it the penetrating portion of the HB. Anteriorly, the right coronary cusp is related to the bifurcating atrioventricular (AV) bundle and the origin of the left bundle branch. The right coronary cusp does not have a direct relationship with either atrium, but lateral to the commissure with the noncoronary cusp lies the RA appendage, trunk of the right coronary artery, and a variable amount of fat.8,9
The noncoronary cusp is the most posterior of the aortic cusps, and lies immediately anterior to the interatrial septum and superior to the central fibrous body, and has the RA and LA as the posterior right and left relations, respectively (see Fig. 23-5). In fact, atrial tachycardias have reportedly been ablated from within the noncoronary cusp because of its close relationship to the atria. Caudally, like the other cusps, the noncoronary cusp is in continuity with the LVOT myocardium. Other than this site, however, it has no anatomical relationship with any other ventricular myocardium. The triangle between the noncoronary and the right coronary sinuses incorporates within it the membranous part of the septum (the location of the penetrating HB). This fibrous part of the septum is crossed on its right side by the hinge of the tricuspid valve, which divides the septum into atrioventricular and interventricular components.8,9,12,13
Because of the semilunar nature of the attachments of the aortic valvular leaflets, there are three triangular extensions of the LVOT that reach to the level of the sinotubular junction. These triangles, however, are formed not of ventricular myocardium but of the thinned fibrous walls of the aorta between the expanded sinuses of Valsalva.14
For the greater part, the aortic sinuses are made up of the wall of the aorta. However, sleeves of ventricular myocardium extend beyond the aortic valve attachments for variable distances (analogous to atrial myocardial extensions in the pulmonary veins). Whereas the right coronary cusp and the anterior portions of the left coronary cusp frequently exhibit these myocardial sleeves, the posterior portions of the left coronary cusp and the noncoronary cusp, particularly in relation to the fibrous continuity with the anterior leaflet of the mitral valve (the aortomitral continuity), are exclusively fibrous and usually devoid of myocardium.8,9,15 The noncoronary cusp at its junction of the right coronary cusp may have sleeves of ventricular myocardium and, at present, it is not clearly known whether myocardial extensions into the noncoronary cusp represent atrial or ventricular myocardium.8
Idiopathic VT can originate from the right or, more commonly, left coronary cusp, as well as from the junction of the left and right coronary cusps. The substrate of this VT likely originates from the strands of ventricular myocardium present at the bases of those cusps. In contrast, the base of the noncoronary cusp is composed of fibrous tissue and, thus, is an extremely rare site of origin of VT.16,17 However, the nature of the actual substrate being ablated has not been clearly defined. For example, the ablation electrode placed in the depth of the right coronary cusp may be mapping and ablating a focus arising from the supravalvular extension into the cusp, LVOT myocardium, or a deeper posterior RVOT myocardium.9
Pulmonary Artery
The pulmonary sinuses are not as prominent as the aortic sinuses. Nevertheless, owing to the semilunar configuration of the valvular leaflets, the hinge line of each leaflet crosses the ventriculoarterial junction at two points. Consequently, there are always small segments of myocardium of the infundibulum at the nadirs of the three sinuses. Between adjacent sinuses, the wall comprises small triangles of fibrous tissue that become incorporated into the RV when the valve closes. On the epicardial aspect, the ventriculoarterial junction is not always a sharply defined line. Extensions of ventricular myocardium into the adventitia occur in approximately 20% of individuals and have been traced to a maximal distance of 6 mm beyond the junction.11
As noted, the pulmonic and aortic valves are not at the same level (see Fig. 23-3). The pulmonic valve, the most superiorly situated of the cardiac valves, lies at the level corresponding to the third left costal cartilage at its junction with the sternum. The transverse plane of the aortic valve slopes inferiorly, away from the plane of the pulmonic valve, such that the orifice of the aortic valve faces rightward at an angle of at least 45 degrees from the median plane.11
Because of its anterior and leftward location, only the posterior and rightward parts of the pulmonary artery have important relations with other cardiac structures. Of the three cusps of the pulmonic valve, the septal (right) pulmonic cusp lies at variable distances from and sometimes adjacent to the distal portions of the RA appendage. The left pulmonic cusp, being the most superficial, lies immediately beneath the pericardium and has no other cardiac structures related to it. The posterior pulmonary cusp externally lies in the proximal portion of the left main coronary artery and the distal portions in the LA appendage. The supravalvular portion of the aorta lies close to and in some cases adjacent to the junction and surrounding parts of the right and posterior pulmonic cusps.8,9
The pulmonic valve and supravalvular portion of the pulmonary artery are well-established locations of origin for ventricular arrhythmias. As noted, ventricular myocardial sleeves extend above the semilunar valves for a variable distance (a few millimeters and up to more than 2 centimeters). Whereas the myocardial sleeves typically extend circumferentially around the pulmonic valve between and above all three cusps just above the annulus, more distally the extension is patchy and generally asymmetrical. Myocardial extensions also occur in the intercuspal clefts in addition to within the cusps.8
Clinical Considerations
Epidemiology
Approximately 60% to 80% of idiopathic VTs arise from the RV (most commonly the RVOT). RVOT VT comprises 10% of all VTs referred to an electrophysiologist. Age at presentation is usually 30 to 50 years (range, 6 to 80 years). Women are more commonly affected.1,5
Clinical Presentation
Very frequent idiopathic nonsustained VT, PVCs, or both can precipitate a reversible form of LV systolic dysfunction, similar to tachycardia-induced dilated CMP. The relationship between the LV dysfunction and VT may not be initially recognized, and those patients can present with heart failure symptoms and become diagnosed with nonischemic dilated CMP and may even undergo prophylactic implantation of a defibrillator, which unfortunately often results in delivery of inappropriate shocks triggered by frequent nonsustained episodes of idiopathic VT.2 Interpolation of the PVCs appears to predict an increased risk of PVC-induced CMP.18 Notably, in a recent report, 20% of patients with PVC-induced CMP had the PVC focus in one of the aortic cusps.19
Initial Evaluation
The diagnosis of ARVD should be carefully considered. Signal-averaged ECG, MR imaging of the RV, RV biopsy, and RV angiography are all unremarkable in idiopathic RVOT VT and help exclude ARVD. An invasive EP study is usually not necessary to establish a diagnosis, although it can occasionally help exclude other forms of tachyarrhythmias (see later).2
It is important to recognize that, in some patients, idiopathic VT can coexist with structural heart disease, including CMP, in which setting the VT is not related to the cardiac disease. On the other hand, very frequent idiopathic nonsustained VT, PVCs, or both can precipitate dilated CMP. The responsible ectopy can arise from any ventricular site, but the RVOT, being the most common type of idiopathic ventricular ectopy, is more commonly associated with ectopy-related CMP. Therefore, in patients who present with a dilated CMP of unclear etiology and who have frequent PVCs or nonsustained VT, it is important to assess the contribution of PVCs or VT to LV systolic dysfunction. A reversible form of dilated nonischemic CMP precipitated by idiopathic VT should be suspected when very frequent PVCs, nonsustained VT, or both are observed on a 24-hour Holter recording, especially when the QRS morphology is monomorphic and is suggestive of origin from the outflow tract. A PVC burden of more than 20% is present in most of those patients with tachycardia-induced CMP, but some patients have as few as 5% PVCs. In a recent report, a cutoff PVC burden of more than 24% was strongly associated with the presence of CMP. However, this cutoff value failed to identify every patient at risk of CMP, and for individual patients, the critical PVC burden can be lower. A cutoff PVC burden of more than 16% would result in a sensitivity of 90% for CMP, but the specificity would be reduced to 58%.20 Although pharmacological suppression of the PVCs, such as by amiodarone therapy, may help evaluate the relationship between the arrhythmia and CMP, the usefulness of this approach and duration of therapy required have not been defined. Often, elimination of the PVCs by catheter ablation results in improvement and resolution of LV dysfunction within a few months. Therefore, catheter ablation of the PVCs is appropriate prior to implantable cardioverter-defibrillator (ICD) implantation for primary prevention of SCD; successful elimination of the PVCs may result in improvement in LV function such that the patient no longer qualifies for an ICD.2,21
Principles of Management
Chronic Management
Long-term treatment options for outflow tract VT include medical therapy and catheter ablation. Medical therapy may be indicated in patients with mild to moderate symptoms. For patients with symptomatic, drug-refractory VT or those who are drug intolerant or who do not desire long-term drug therapy, catheter ablation is the treatment of choice. Catheter ablation is also recommended for patients with frequent PVCs or nonsustained VT when they are presumed to cause LV dysfunction, even in otherwise asymptomatic patients.2
Electrocardiographic Features
Surface Electrocardiogram
Ecg During Ventricular Tachycardia
Repetitive monomorphic VT is characterized by frequent PVCs, couplets, and salvos of nonsustained VT, interrupted by brief periods of NSR (see Fig. 23-1). Paroxysmal exercise-induced VT is characterized by sustained episodes of VT precipitated by exercise or emotional stress (see Fig. 23-2). Both types characteristically have an LBBB pattern with a right inferior (more common) or left inferior axis. The tachycardia rate is frequently rapid (CL < 300 milliseconds), but can be highly variable. A single morphology for the VT or PVCs is characteristic.1,6
Ambulatory Monitoring
Several VT characteristics can be observed on ambulatory monitoring recordings. Ventricular ectopy typically occurs at a critical range of heart rates (CL dependence). The coupling interval of the first PVC is relatively long (approximately 60% of the baseline sinus CL). A positive correlation exists between the sinus rate preceding the VT and the VT duration. Additionally, the VT occurs in clusters, and is most prevalent on waking and during the morning and later afternoon hours. The VT is extremely sensitive to autonomic influences, resulting in poor day-to-day reproducibility.1,6
Electrocardiographic Localization of Outflow Tract Ventricular Tachycardia
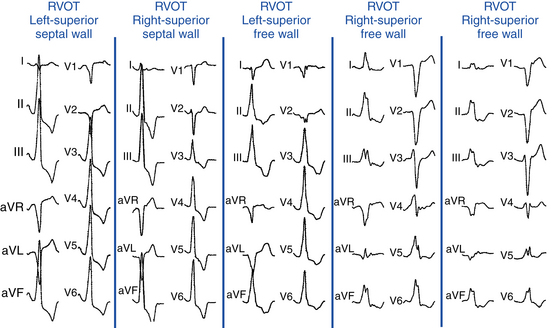
VTs originating from the RVOT typically display LBBB morphology with a precordial QRS transition (first precordial lead with R/S ratio >1) that begins no earlier than lead V3 and more typically occurs in lead V4. The frontal plane axis, precordial R/S transition, QRS width, and complexity of the QRS morphology in the inferior leads can more precisely indicate the origin of VT within the RVOT. Most RVOT VTs originate from the anterosuperior aspect of the leftward (“septal”) aspects, just under the pulmonic valve. These tachycardias produce a characteristic 12-lead ECG appearance with tall positive QRS complexes in leads II, III, and aVF and large negative complexes in leads aVR and aVL. The QRS morphology in lead I typically is multiphasic and has a net QRS vector of zero or is only modestly positive (see Fig. 23-2).
However, not all VTs with a QRS morphology of LBBB and inferior or normal axis can be ablated successfully from the RVOT. Some VTs originate in the subaortic LV (LVOT, 10% to 15% of adenosine-sensitive VTs), above the pulmonic valve (i.e., from muscle tracts in the pulmonary artery), and occasionally in the aortic root. Idiopathic RV VTs with a superior QRS axis generally originate in the body of the RV on the anterior free wall, or in the mid- and distal septum (Table 23-1).
TABLE 23-1 Estimation Indexes of Right Ventricular Outflow Tract Ventricular Tachycardia Origins by 12-Lead ECG*
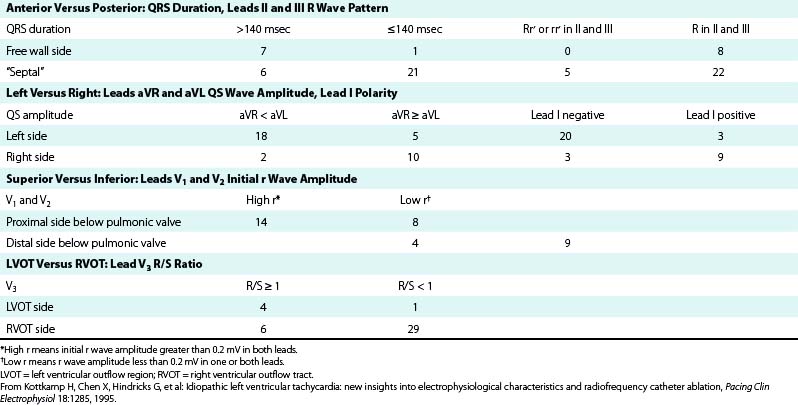
It is important to recognize that the prediction of the precise origin of outflow tract VT can still be challenging because of the close anatomical relationship of the different anatomical compartments of the outflow tract area. For example, an R/S transition zone in precordial lead V3 is common in patients with idiopathic outflow tract VT, with a prevalence of up to 58%. The prevalence of R/S transition in lead V3 in RVOT VT is not statistically different from VT originating outside the RVOT; therefore, the predictive value for this ECG criterion is low. Approximately 50% of outflow tract tachycardias with an R/S transition in V3 could be successfully ablated from the RVOT; however, one study has shown that a significant proportion of patients need different anatomical approaches for successful RF catheter ablation using up to six different anatomical accesses, including the LV, the aortic sinus of Valsalva, the coronary sinus (CS), the pulmonary artery, and the epicardium via a percutaneous pericardial puncture.22
Right Ventricular Outflow Tract Versus Left Ventricular Outflow Region
The absence of an R wave in lead V1 and precordial transition zone in lead V4, V5, or V6 predicts an RVOT origin. On the other hand, the presence of an R wave in leads V1 and V2 and RS transition in leads V1 or V2 are characteristic of an LVOT origin (Figs. 23-6 and 23-7). Because of the continuity between the posterior RVOT and the anterior LVOT, a very similar R wave in lead V3 may be seen with arrhythmia that originates in either structure, and R/S transition in lead V3 is not specific. In the latter setting, a precordial R/S transition during VT that is earlier than that during NSR argues against an LVOT origin. Additionally, comparing the R wave amplitude divided by total QRS amplitude (i.e., R/[R + S]) in lead V2 during VT with that during NSR can help distinguish between LVOT and RVOT origins in patients with lead V3 precordial transition. A transition ratio (R/[R + S]VT ÷ R/[R + S]NSR) of at least 0.60 is highly suggestive of an LVOT origin.23 Furthermore, a QS complex in lead I is also suggestive of subaortic LV origin.8,22
“Septal” Versus Free Wall Right Ventricular Outflow Tract
QRS duration less than 140 milliseconds, monophasic R wave without notching (i.e., no RR′ or Rr′) in leads II and III, and early precordial transition (by lead V4) suggest a septal origin. On the other hand, the triphasic RR′ or Rr′ waves in VT of free wall origin probably reflect the longer QRS duration and the phased excitation from the RV free wall to the LV (see Fig. 23-6).
Left (Anteromedial Attachment) Versus Right (Posterolateral Attachment) Side of The Right Ventricular Outflow Tract
In general, a QS complex in lead I is generated from sites at or near the anterior medial aspect of the RVOT (the most leftward portion of the RVOT in the supine anteroposterior orientation). As the site of origin moves rightward, on either the posterior or the anterior wall, R waves appear in lead I and become progressively dominant and the QRS axis becomes more leftward. Similarly, a QS amplitude in aVL greater than that in aVR suggests an origin in the left side of the RVOT; a QS amplitude in aVR greater than that in aVL suggests an origin in the right side (see Fig. 23-6).
Superior Versus Inferior Right Ventricular Outflow Tract
The R wave amplitude tends to be larger in leads V1 and V2 at superior and leftward sites; as the site of origin shifts to the right or inferiorly, there is a trend toward lower right precordial R wave amplitude and a shift in the precordial transition zone to the left. Furthermore, R wave amplitude in lead V2 or “r” wave amplitude in leads V1 and V2 greater than 0.2 mV suggests a superior origin. Additionally, the closer the origin to the pulmonic valve, the more rightward and inferior the axis (i.e., R wave taller in lead III than in lead II) because of the anatomical leftward location of the pulmonic valve and lead III being an inferior and rightward lead; the more posterior and inferior the origin, the more leftward the axis (see Fig. 23-6). Also, lead aVL (being a left-sided lead) becomes isoelectric or slightly positive as the site of origin moves inferiorly (close to the HB region), whereas aVR (being a right-sided lead) remains negative.8
Ventricular Tachycardias Arising above the Pulmonic Valve
Because of the superior and leftward location of these sites, VTs arising above the pulmonic valve are associated with a small but definite vector toward the right, resulting in a small initial R wave in lead V1. Additionally, suprapulmonic origins exhibit a strong right inferior frontal plane axis (a QS or rS wave in lead I, large R waves in II, III, aVF, and deep QS complexes in aVR and aVL, with the R wave being taller in lead III than in lead II and the S wave being deeper in aVL than in aVR). Those VTs also tend to display an R/S ratio in lead V2 and R wave amplitude in inferior leads that are significantly larger than those in RVOT VT.8,9,24 However, moderate overlap exists between VTs originating above the pulmonic valve and RVOT VTs, and because the RVOT is the exit site of VT arising from the pulmonary artery, discriminating between the two groups using ECG parameters can be difficult.25
Ventricular Tachycardias Arising from the Tricuspid Annulus
VTs arising from the tricuspid annulus demonstrate LBBB morphology and positive QRS polarity in leads I, V5, and V6. In contrast to VTs arising from the RVOT, no positive QRS polarities in any of the inferior leads characterize VTs arising from the tricuspid annulus. No negative component of the QRS complex is found in lead I, and the R wave magnitude in lead I is typically greater in VTs arising from the tricuspid annulus than those arising from the RVOT.26 Additionally, VTs arising from the tricuspid annulus have an rS or QS pattern in lead aVR, just as those arising from the RVOT; however, in lead aVL, a QS or rS pattern is rare (8%), and the QRS polarity in lead aVL is positive in almost all VTs arising from the annulus (89%), in contrast to those arising from the RVOT.26
Ventricular Tachycardias Arising from the Right Ventricular Papillary Muscles
RV papillary muscle VTs display LBBB morphology with a QS or rS pattern in lead V1 and a wider QRS complex and more prevalent notching than in RVOT VT. VTs arising from the anterior and posterior papillary muscles are frequently associated with a superior axis and a late R wave transition in the precordial leads (later than lead V4), whereas septal papillary muscle VTs more often display an earlier precordial transition (in lead V4 or earlier) and an inferior axis (due to the more basal insertion of the septal compared with the anterior and posterior papillary muscles). More than one PVC or VT morphology can be present in a significant proportion of patients with papillary muscle VTs.27 Compared with origins from the septum, VTs from the free wall exhibit longer QRS duration and deeper S waves in leads V2 and V3.28
Ventricular Tachycardias Arising from the Left Ventricular Papillary Muscles
VT can also arise from posterior or anterior papillary muscles. The QRS morphology during VT has an RBBB pattern with either left superior (posterior papillary muscle) or rightward inferior (anterior papillary muscle) axis.29,30 The ECG features are very similar in the LV papillary muscle and fascicular VTs; nonetheless, in contrast to fascicular VT, papillary muscle VT has a broader QRS complex (150 ± 15 milliseconds versus 127 ± 11 milliseconds). Additionally, all fascicular VTs, versus none of papillary muscle VTs, had an rsR′ pattern in lead V1. An R/S ratio not exceeding 1 in lead V6 for VTs in the LV anterolateral region also suggests papillary muscle VT.31 Furthermore, spontaneous variations in QRS morphology occur relatively frequently during VTs originating from the LV papillary muscles, a feature that can help distinguish these VTs from LV fascicular VT, the latter being a reentrant tachycardia with a consistent QRS morphology.32
Other Left Ventricular Sites of Origin
VT can originate from multiple LV sites, including the subaortic LV, the superior basal region of the left interventricular septum, papillary muscle, aortomitral continuity, mitral annulus, aortic cusps, and epicardial sites in the region of the great cardiac and anterior interventricular veins. Most of these sites of origin are associated with an LBBB pattern and inferior axis. A basal LV septal origin is suggested by LBBB morphology associated with an early precordial transition in lead V1 or V2. An origin from the aortomitral continuity is associated with RBBB morphology and broad monophasic R waves across the precordial leads. As the origin moves laterally along the mitral annulus, the R wave in lead I and in the inferior leads decreases in amplitude. LVOT free-wall VTs have an early transition and persistent dominant R wave across the precordium, with a small or absent S wave out to the apex (see Fig. 23-7). The R wave in V2 is broad and occupies a greater percentage of the QRS width than RVOT VTs. LVOT VT can occasionally have an epicardial site of origin. This form is associated with an R wave in lead V1, S wave in lead V2, precordial transition in leads V2 to V4, deep QS in lead aVL, and tall R wave in the inferior leads. Contrariwise, an R wave in lead V2 taller than in leads V1 or V3 suggests an origin in the so-called crux of the heart, near the posterior descending artery.1,33
Ventricular Tachycardias Arising from the Aortic Cusps
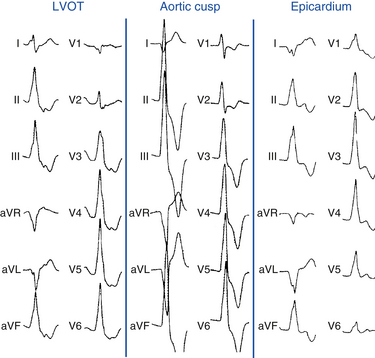
For LVOT VT, the absence of an S wave in leads V5 or V6 suggests a supravalvular origin, whereas the presence of such waves is consistent with an infravalvular origin (see Fig. 23-7). An R wave in lead aVL may exclude an origin in the left or right aortic cusp.16
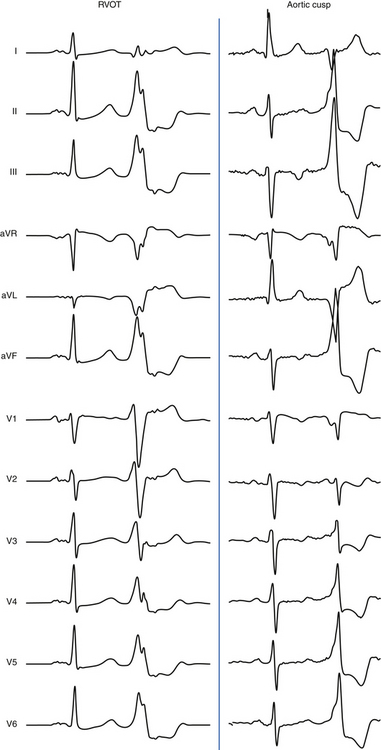
Origin from the aortic cusp is also strongly suggested by a longer duration and greater amplitude of the R wave in leads V1 and V2 (R/QRS duration >50% and R/S amplitude >30%) as compared with VT originating from the RVOT, because the aortic valve lies to the right and posterior to the RVOT. Correction of the transitional zone to cardiac rotation (i.e., comparing the R/S transitional zone in precordial leads during VT with that during NSR) can be a useful marker for differentiating an RVOT origin from an aortic cusp origin. When the transitional zone during VT occurs in one or more precordial leads earlier than during NSR, an aortic cusp origin is favored, even when the transitional zone during VT occurs later than lead V2 (Fig. 23-8).34
Left aortic cusp VTs initially depolarize the LV and typically have a multiphasic QRS complex such as an M or W pattern in lead V1, suggesting transseptal activation (see Fig. 23-7). A simple qR complex or a monophasic R wave suggests an origin near the aortomitral continuity.15 The R wave is positive by lead V2 or V3 with VT from the right aortic cusp and by lead V1 or V2 from the left aortic cusp.10 Additionally, left aortic cusp VTs tend to have a QS or rS complex in lead I, whereas right aortic cusp VTs have a greater R wave amplitude in lead I based on how posterior and rightward the right aortic cusp is positioned. In young patients with a vertical heart, the QRS complex in lead I can be negative in and around both the left and right aortic cusp regions. In patients with a horizontal heart, the area surrounding the aortic valve will be directed rightward relative to the LV apex–lateral wall, and a positive QRS complex in lead I can be seen.10
When comparing origins from the right versus the left aortic cusps, RBBB morphology may exclude origins from the right coronary cusp. Additionally, the ratio of the R wave amplitude in leads II and III (III/II ratio) is significantly greater (>0.9) for VTs with a left coronary cusp origin than for those with a right coronary cusp origin.16
A common site of origin is just between the right and left commissures. This site is often recognized by a notch on the downstroke in V1 with an intermediate (relative to the right and left cusps) precordial transition. A qrS pattern in leads V1 to V3 is very helpful for predicting an origin in the junction between the right and left coronary cusps.35
VTs originating from the aortic cusp often (25%) show preferential conduction to the RVOT, which can render some algorithms using the ECG characteristics less reliable. In fact, 20% of the VTs with an aortic cusp origin in that report showed a late QRS transition after V3. In some of those cases, an insulated myocardial fiber across the ventricular outflow septum may exist.36
Epicardial Ventricular Tachycardia
Several QRS characteristics suggest an epicardial VT origin of LV VTs, including the presence of a very slurred upstroke (pseudo-delta wave ≥34 milliseconds), long R-wave peak time (i.e., the interval from the beginning of the QRS complex to the time of initial downstroke of the R wave after it has peaked [previously known as the intrinsicoid deflection] ≥85 milliseconds) in lead V2, and shortest precordial RS complex of at least 121 milliseconds (see Fig. 23-7).
These criteria, however, do not seem to apply uniformly to all LV regions or to VTs originating from the RV. Other site-specific criteria have been suggested for identifying an epicardial origin for LV VTs: the presence of a Q wave in lead I for basal superior and apical superior VTs; the absence of a Q wave in any of the inferior leads for basal superior VTs; and the presence of a Q wave in the inferior leads for basal inferior and apical inferior VTs.37 Also, measurement of the maximal deflection index (defined as the product of the time to maximal deflection in precordial leads divided by the QRS duration) can help identify epicardial LVOT VT. A delayed shortest precordial maximal deflection index (≥0.55) identifies epicardial VT remote from the aortic sinus of Valsalva with high sensitivity and specificity. This observation is consistent with slower spread of activation from a focus on the epicardial surface relative to the endocardium and delayed global ventricular activation resulting from later engagement of the His-Purkinje network.3,38
Epicardial VTs originating close to the proximal segment of the great cardiac vein typically display RBBB morphology, whereas VTs originating close to the distal segment have LBBB morphology. This can be explained by a location within the basal-lateral myocardium for the former and a more anterobasal location for the latter arrhythmias. If the site of origin is in the proximal segment of the great cardiac vein, the initial vector is directed toward lead V1, accounting for the RBBB morphology. As the site of origin moves toward the distal part of the great cardiac vein, closer to the anteroseptal myocardium, the initial vector is directed away from V1, resulting in LBBB morphology. An R-wave width greater than 75 milliseconds in lead V1 is useful for differentiating epicardial idiopathic VTs from endocardial arrhythmias. The broader R wave is explained by a more posterior position relative to lead V1 compared with the RVOT. However, because of a more anterior position relative to lead V1, the epicardial arrhythmias that are located within the distal part of the great cardiac vein have a narrow R wave in lead V1, making them impossible to distinguish from RVOT VT.38,39 Epicardial VTs that appear to follow the anterior interventricular vein often have a characteristic loss of R wave from leads V1 and V2, with broad R waves in leads V3 through V6.
For VTs originating from the RV, the presence of an initial Q wave in lead I and QS in lead V2 for anterior sites in the RV strongly predicts an epicardial origin. Similarly, an initial Q wave in leads II, III, and aVF is observed with pace mapping from the inferior epicardial locations in the RV.40
Electrophysiological Testing
Induction of Tachycardia
Frequently, VT foci can become inactive in the EP laboratory environment, caused by sedative medications or deviation from daily activities (e.g., exercise or caffeine intake) that can affect VT activity. Thus, in preparation for a VT ablation procedure, antiarrhythmic drugs should be withheld for at least five half-lives before the EP study and minimal sedation should be used throughout the procedure if possible. Additionally, it may be appropriate to monitor the patient in the EP laboratory initially without sedation. If no spontaneous tachycardia is observed, isoproterenol is administered. If no VT can be induced, a single quadripolar catheter is placed in the RV, and programmed electrical stimulation is performed. If VT focus remains quiescent, the procedure may be aborted and retried at a future date. If VT is inducible at any step, the full EP catheter arrangement and EP study are undertaken.6
The programmed electrical stimulation protocol usually includes incremental ventricular burst pacing from the RV apex and RVOT (until 1:1 capture is lost or a pacing CL of 220 milliseconds is reached) and single, double, and triple VESs at multiple CLs (600 and 400 milliseconds) from the RV apex and RVOT. Additionally, VT inducibility can be facilitated by catecholamines.1,6 Isoproterenol infusion (up to 4 µg/min, or 30% increase in heart rate) is frequently used. If VT is not induced with isoproterenol, rapid ventricular pacing and VES should be repeated. If VT is still noninducible, isoproterenol is discontinued because VT can develop during the washout phase, analogous to VT occurring during the recovery phase post-exercise. If VT is still not inducible, isoproterenol is restarted and atropine (0.04 µg/kg) and aminophylline (2.8 mg/kg) may be sequentially administered (with and without programmed electrical stimulation) to attenuate the potential antiarrhythmic effects of endogenous acetylcholine and adenosine, which inhibit cAMP.6
Ventricular stimulation can initiate the VT in less than 65% of patients and, in contrast to reentrant VT, rapid ventricular pacing is usually more effective than VES. Induction of sustained VT is less common in patients with repetitive monomorphic VT than in those with paroxysmal sustained VT. In one report, sustained VT was inducible during EP testing in 78% of patients who presented clinically with sustained VT, in 48% of patients who presented with nonsustained VT, and in 4% of those with PVCs only.7 Most episodes of triggered activity VT induced by ventricular stimulation are usually nonsustained. Reproducibility of VT induction using all methods is less than 50%, whereas reproducibility of induction with single or double VESs is approximately 25%. Induction with atrial pacing is not uncommon. Of note, in contrast to reentrant VT, initiation of outflow tract VT does not require associated ventricular conduction delay or block for initiation.6
Typically, the initial cycle of the VT bears a direct relationship to the pacing CL (whether or not VESs are delivered following the pacing drive). Thus, the shorter the initiating pacing CL, the shorter the interval to the first VT beat and the shorter the initial VT CL. Similarly, the initial cycle of the VT bears a direct relationship to the coupling interval of the VES initiating the VT.1,6 Occasionally, with the addition of very early VESs or with very rapid ventricular pacing (CL <300 milliseconds), a sudden jump in the interval to the first VT complex may be observed, such that it is approximately twice the interval to the onset of the VT initiated by later coupled VESs. This can be caused by failure of the initial DAD to reach threshold, whereas the second DAD reaches threshold. Thus, in triggered activity VTs caused by DADs, the coupling interval of the initial VT complex either shortens or suddenly increases in response to progressively premature VES; it usually does not demonstrate an inverse or gradually increasing relationship (in contrast to reentrant VT).6
Ventricular pacing CLs longer or shorter than the critical CL window may fail to induce VT. This critical window can shift with changing autonomic tone. The site of ventricular stimulation has no effect on the initiation of triggered activity VT as long as the paced impulse reaches the focus of the VT (in contrast to reentrant VT).6
VT induction can be inconsistent. Induction is exquisitely sensitive to the immediate autonomic status of the patient. Therefore, noninducibility during a single EP study is not enough evidence to attribute the arrhythmia to a nontriggered activity mechanism.1,6
Tachycardia Features
As noted, the VT can be sustained or in the form of frequent monomorphic PVCs, couplets, and salvos of nonsustained VT. QRS morphology has an LBBB pattern with a right inferior or left inferior axis. The VT rate is frequently rapid (CL <300 milliseconds) but can be highly variable.1,6
During VT, the His potential follows the onset of the QRS (i.e., negative His bundle–ventricular [HV] interval) and is usually buried inside the local ventricular electrogram. Ventriculoatrial (VA) conduction may or may not be present. The VT is very sensitive to adenosine, Valsalva maneuvers, carotid sinus massage, edrophonium, verapamil, and beta blockers.1
Diagnostic Maneuvers during Tachycardia
Response to Ventricular Extrastimulation
VES results in a decreasing resetting response curve characteristic of DAD-related triggered activity.6
Response to Overdrive Pacing
The VT cannot be entrained by ventricular pacing (i.e., no fusion demonstrable). Rapid ventricular pacing during the VT can result in acceleration in the VT. There is a direct relationship between the overdrive pacing CL and the coupling interval and CL of the VT resuming after cessation of pacing.1
Exclusion of Other Arrhythmia Mechanisms
Although the VT in ARVD can have morphological features similar to RVOT VT (LBBB with inferior axis), several ECG criteria during VT can help distinguish between the two arrhythmias. Longer QRS duration (≥120 milliseconds), precordial transition at lead V6, and the presence of notching in the QRS in one or more leads all favor ARVD over RVOT VT. Additionally, the presence of an LBBB morphology with a superior axis is very unlikely in idiopathic RVOT VT. Also, VTs in ARVD patients generally have lower QRS amplitude and more fragmentation, but these are qualitative differences and not always present.41
In ARVD, the resting 12-lead ECG in NSR typically shows inverted T waves in the right precordial leads. When present, RV conduction delay with an epsilon wave (best seen in leads V1 and V2) is helpful in the diagnosis of ARVD. The resting surface ECG in NSR is typically normal in patients with idiopathic VT, with no epsilon wave, QRS widening or fragmentation, or other markers of delayed activation of the RV. Nevertheless, the ECG can also be normal in up to 40% to 50% of patients with ARVD at presentation, but in almost no patient after 6 years. Furthermore, approximately 10% of patients with idiopathic VT can have complete or incomplete RBBB during NSR.2,42
The response of VT during EP testing is also helpful in distinguishing idiopathic RVOT VT from ARVD. The repetitive initiation of these VTs by programmed ventricular stimulation suggests a reentrant mechanism, and is much more common in ARVD than idiopathic outflow tract VT (93% versus 3%).42 Additionally, recording fractionated diastolic electrograms during VT or NSR at the site of origin of VT or other RV sites is inconsistent with idiopathic RVOT VT, but is typical for ARVD. As noted, the induction of VTs with different QRS morphologies is common in ARVD (observed in 73% of patients in one report) and is inconsistent with RVOT VT. Although isoproterenol infusion can induce VT in patients with idiopathic RVOT VT, it has a similar effect in ARVD and therefore does not help distinguish between these disorders. Reentry is the mechanism of VT in the majority of the ARVD patients, whereas RVOT VT almost always displays features of triggered activity. The VT in ARVD does not terminate with adenosine.
Additionally, electroanatomical voltage mapping can help distinguish early or concealed ARVD from idiopathic VT by detecting RV electroanatomical scars that correlate with the histopathological features pathognomonic of ARVD.43
Malignant ventricular arrhythmias (VF or polymorphic VT) are sometimes associated with idiopathic VT or PVCs originating from the outflow tract, even in patients with no established diagnosis of ARVD. It is of particular importance to distinguish the malignant form from the benign form of idiopathic outflow tract VT, because the malignant form of idiopathic VT or PVCs often leads to unexpected SCD. Data suggest that a shorter CL during monomorphic VT, when present, as well as a history of syncope with malignant characteristics, may be a predictor of the coexistence of VF or polymorphic VT in patients with idiopathic VT originating from RVOT. Holter monitoring to record spontaneous episodes of RVOT VT and obtaining detailed previous history of syncope with malignant characteristics are useful to differentiate the malignant form from the benign form of RVOT VT.42
Mapping
VT origins in the RVOT are anatomically classified into three-dimensional (3-D) directions: anterior and posterior, right and left, and superior and inferior. The anterior half of the RVOT by fluoroscopy in the 60-degree left anterior oblique (LAO) projection is defined as the anterior side (or free wall side) and the posterior half is defined as the posterior side (or “septal” side; see Fig. 23-4). When viewed by fluoroscopy in the 30-degree right anterior oblique (RAO) projection, the posterior half of the outflow is defined as the right (or posterolateral) side, and the anterior half is defined as the left (or anterolateral) side. The area within 1 cm just below the pulmonic valve is defined as the superior (or distal) side, and the area more than 1 cm away is defined as the inferior (or proximal) side.
The prediction of the precise origin of outflow tract tachycardias can be challenging because of the close anatomical relationship of the different anatomical compartments of the outflow tract area. Therefore, a stepwise mapping procedure has been proposed, especially when the ECG does not provide clear criteria to guide localization of the VT site of origin.22 Because most VTs originate from the RVOT, mapping is started there and, if that fails to identify the origin of the VT, mapping is extended to involve the pulmonary artery, although this site of origin is rare, because no additional anatomical access is required.24 If activation mapping and pace mapping suggest a focus outside the RVOT and pulmonary artery, mapping of the CS can add useful information as to whether a left-sided epicardial origin is present.22 If a transvenous access is not successful, mapping the LVOT and aortic cusps via a retrograde arterial access is usually the next step.
Activation Mapping
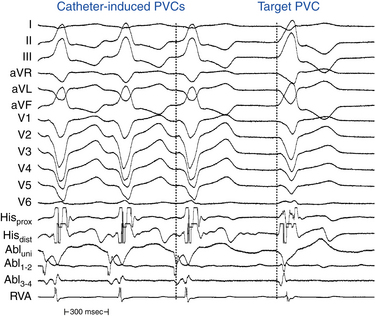
Endocardial activation mapping is performed during VT or PVCs to identify the site of earliest activation relative to the onset of the QRS. It is important to record examples of VT or PVCs prior to inserting catheters, because the catheters can cause ectopic complexes that resemble the target VT or PVCs (Fig. 23-9). The site of origin of the VT is defined as the site with the earliest bipolar recording in which the distal tip shows the earliest intrinsic deflection and QS unipolar electrogram configuration.
Bipolar electrograms at the site of origin are modestly early (preceding the surface QRS by 10 to 45 milliseconds) and have high-amplitude and rapid slew rates. Fractionated complex electrograms and mid-diastolic potentials are rarely, if ever, seen and should raise suspicion of underlying heart disease.1
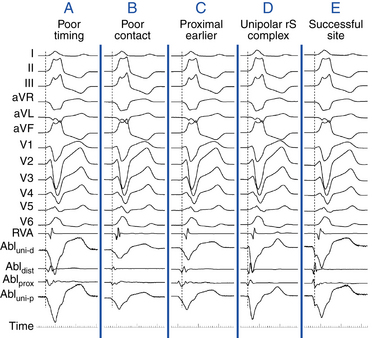
Once the site with the earliest bipolar signal is identified, the unipolar signal from the distal ablation electrode should be used to supplement conventional bipolar mapping (Fig. 23-10). The unfiltered (0.05 to >300 Hz) unipolar signal morphology should show a monophasic QS complex with a rapid negative deflection. Although this electrogram configuration is very sensitive for successful ablation sites, it is not specific (70% of unsuccessful ablation sites also manifest a QS complex). The size of the area with a QS complex can be larger than the VT site of origin, exceeding 1 cm or more in diameter. Additionally, because the entirety of the heart is directed away from most positions in the RVOT, a QS can be observed with unipolar recordings from most locations in the outflow tract. The timing of the unipolar electrograms recorded at sites distant from the VT focus, however, does not precede the onset of the VT QRS.44 Thus, a QS complex should not be the only mapping finding used to guide ablation (see Fig. 23-10). Nonetheless, successful ablation is unusual at sites with an RS complex, because these are generally distant from the VT focus. Concordance of the timing of the onset of the bipolar electrogram with that of the filtered or unfiltered unipolar electrogram, with the rapid downslope of the S wave of the unipolar QS complex coinciding with the initial peak of the bipolar signal, helps ensure that the tip electrode, which is the ablation electrode, is responsible for the early component of the bipolar electrogram (see Fig. 23-10).6 Additionally, the presence of slight ST elevation on the unipolar recording and the ability to capture the site with unipolar pacing are used to indicate good electrode contact.
It is important to recognize that some myocardial fibers in the RVOT can potentially be in continuity with those in the LVOT. As a consequence, what mapping defines as the earliest site of activation relative to neighboring myocardium can be misleading. For example, if the true origin of an arrhythmia in the supravalvular aortic cusps then exits both to the infravalvular LVOT myocardium and to the posterolateral subpulmonic RVOT, an early site relative to all neighboring RVOT myocardium may be found in the RVOT.44
When mapping above the aortic or pulmonic valve, near- and far-field potentials are typically recorded. The exact nature and cause of these spikes are unknown but are thought to be analogous to PV potentials, that is, they represent electrical activation of myocardial sleeves distal to valve attachment. Because of the overlapping nature of the outflow tract and supravalvular region, when two potentials are seen, only the near-field potential should be used for activation timing. In addition to noting the actual timing of activation, the timing of the near-field electrogram relative to the far-field electrogram should be evaluated.9 Typically, in sinus rhythm, the near-field potential (representing local supravalvular myocardial activation) is seen after the far-field ventricular electrogram (likely representing outflow tract activation) separated by an isoelectric period (presumably from conduction delay across the site of valve insertion). If during VT or PVC, the sequence of activation is reversed, that is, the near-field electrogram precedes the far-field electrogram by a similar or greater isoelectric period duration, an etiological role for the supravalvular myocardium can be inferred. This finding alone, however, does not suggest that ablation at this particular site will be successful because (as with PV phenomena) other supravalvular locations may show earlier activation than the site being mapped. On the other hand, if the near-field electrogram still succeeds the far-field ventricular electrogram during VT or PVC, then the supravalvular tissue, although present, is a bystander being passively activated during arrhythmia originating in the outflow tract myocardium below the valve. In some cases, the near-field electrogram is fused with the far-field electrogram during tachycardia. This suggests an origin of arrhythmia exactly at the cusp or passive activation from a true distant site of origin to both the supravalvular and infravalvular myocardium.8
Pace Mapping
Pace mapping is pacing during or in the absence of tachycardia to assess the possible relation of the pacing site to a tachycardia focus or a reentry circuit. Pace mapping is used to confirm the results of activation mapping and can be of great value, especially when the VT is scarcely inducible. Although there are some limitations to this technique, several studies have demonstrated efficacy using pace mapping to choose ablation target sites for idiopathic VT.45
Technique
Pace mapping during VT (at pacing CL 20 to 40 milliseconds shorter than the tachycardia CL) is preferable whenever possible, because it facilitates rapid comparison of VT and paced QRS complexes at the end of a pacing train in simultaneously displayed 12-lead ECGs. If sustained VT cannot be induced, mapping is performed during spontaneous nonsustained VT or PVCs. In this setting, the pacing CL and coupling intervals of the VES should match those of spontaneous ectopy. Pace mapping is preferably performed with unipolar stimuli (≤10 mA, 2 milliseconds) from the distal electrode of the mapping catheter (cathode) and an electrode in the inferior vena cava (IVC) (anode). Unipolar pacing, however, causes a large stimulus artifact in the surface ECG. Bipolar pacing from the closely spaced distal electrodes of the mapping catheter is more commonly used. Although the possibility for capture at either the distal or proximal bipolar electrodes can reduce spatial accuracy, this does not appear to be a major limitation. Use of current strengths near threshold should improve accuracy by limiting the size of the virtual electrode in the tissue and preventing capture of myocardium distant from the pacing site. Pacing thresholds of at least 5 to 10 mA typically indicate insufficient electrode-tissue contact or inexcitable areas.3
Interpretation
Pace maps with identical or near-identical matches of VT morphology in all 12 surface ECG leads can be indicative of the site of origin of VT (see Fig. 5-22). ECG recordings should be reviewed at the same gain and filter settings and at a paper-sweep speed of 100 mm/sec. It is often helpful to have a split-screen display of the target VT in one panel, comparing this with all 12 leads of the paced QRS complexes brought into another panel, as well as with printed regular 12-lead ECGs for side-by-side comparison on paper. Differences in the QRS morphology between pacing and spontaneous VT in a single lead can be critical. Pacing at a site 5 mm from the index pacing site can result in minor differences in QRS configuration (notching, new small component, change in amplitude of individual component, or overall change in QRS shape) in at least one lead in most patients. In contrast, if only major changes in QRS morphology are considered, pacing sites separated by as much as 15 mm can appear similar.
Although qualitative comparison of the 12-lead ECG morphology between a pace map and VT is frequently performed, there are few objective criteria for quantifying the similarity between two 12-lead ECG waveform morphologies. Such comparisons are frequently completely subjective or semiquantitative, such as a “10/12 lead match.” Discrepancies in ablation outcome can result, in part, from subjective differences in opinion regarding the closeness of a pace map match to the clinical VT. On the other hand, automated objective interpretation can offer some advantage to human interpretation. Template matching processes digital images to match the target QRS complex (template signal) and the paced QRS complex (test signal), and provides a score according to the similarity between the two QRS morphologies.46 The most common human error in analyzing a pace map is not appreciating subtle amplitude or precordial lead transition differences between two ECG patterns, and such subtle differences can be reflected in a single quantitative number calculated by an automated metric.
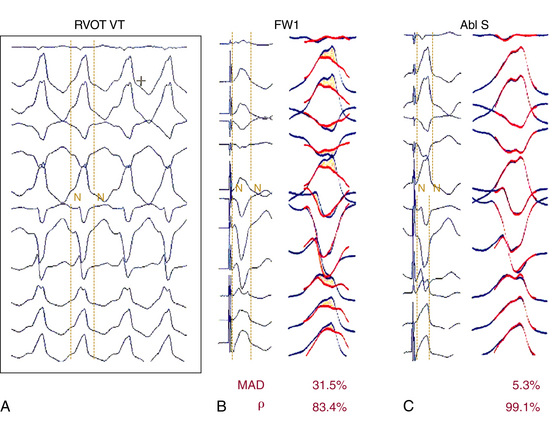
Two waveform comparison metrics, the correlation coefficient (CORR) and the mean absolute deviation (MAD), have been evaluated to calculate the template-matching score. Although both metrics quantitatively compare the waveforms, MAD tends to be more sensitive to differences in waveform amplitude than CORR. Successful ablation sites were associated with significantly lower MAD score than were unsuccessful sites, but only a trend toward a higher CORR at the successful ablation sites was observed. The MAD score grades 12-lead ECG waveform similarity as a single number, ranging from 0% (identical) to 100% (completely different). An MAD score less than or equal to 12% was found to be 93% sensitive and 75% specific for a successful ablation site (Fig. 23-11). It is not surprising that the MAD score is more sensitive than specific; characteristics other than a 12-lead ECG match are necessary for a successful ablation, including catheter-tissue contact, catheter orientation, and tissue heating. An MAD score greater than 12%, and certainly greater than 15% (100% negative predictive value), suggests sufficient dissimilarity between pace map and clinical tachycardia to dissuade ablation at that site. An MAD score less than or equal to 12% is considered an excellent match, and ablation at these sites is warranted if catheter contact and stability are adequate (see Fig. 23-11). The MAD score is computationally simple and should be easy to incorporate into current EP recording systems, allowing feedback to the physician of pace map comparison before turning on the RF energy. The MAD score can also be used to standardize 12-lead ECG waveform morphology comparisons among different laboratories, and can be useful for guiding ablation of RVOT VT.46
Studies using the CORR have found that the spatial resolution of a good pace map for targeting RVOT VT was 1.8 cm2 in diameter and therefore was inferior to the spatial resolution of activation mapping. Of note, in almost 20% of patients in this report, pace maps failed to reproduce adequate correlation coefficients to identify the site of origin of all PVCs/VT. Nonetheless, the effective ablation sites had a high degree of correlation with pace mapping at effective ablation sites. Another metric, root-mean-square error, also was found to be a better discriminator of differences among individual lead waveforms than CORR.46
Pitfalls
Pace mapping can be difficult to perform above the semilunar valves (in the aortic cusps or pulmonary artery) and can require high pacing current strengths. Because of the close anatomical proximity of the various structures in the supravalvular outflow tract region, high-output pacing may reproduce the ECG or clinical arrhythmia even when the origin is in a different cardiac chamber. For example, high-output pace mapping from the right coronary cusp may reproduce the ECG even when the origin is in the posterior RVOT or subvalvular anterior LVOT.9 Additionally, supravalvular arrhythmia origin may exit to the ventricular myocardium below the valve. Thus, pace mapping above the valve and at the exit site may be similar. For example, if pace mapping is performed during aortic cusp VT at a breakthrough site on the posterior RVOT, a perfect result (despite supraaortic origin) will be obtained. Yet, ablation energy delivered there typically fails in terminating the arrhythmia and may result in a change in VT morphology resulting now from a different exit of the cuspal arrhythmogenic focus.8
Electroanatomical Mapping
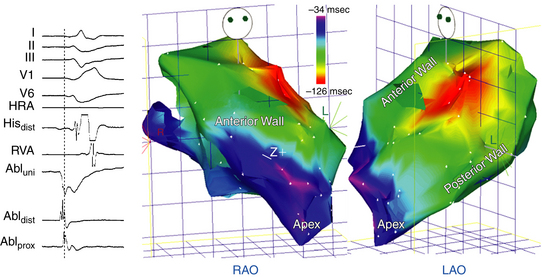
Propagation of activation during RVOT VT is so rapid that minor differences between adjacent sites become difficult to detect, leading to a large number of sites with clinically indistinguishable activation times when examined on a site-by-site basis. However, when displayed simultaneously on a spatially precise electroanatomical reconstruction, the centers of the early activation area and the presumed site of VT origin become easy to identify (Fig. 23-12).45 Electroanatomical 3-D mapping (CARTO mapping system [Biosense Webster, Diamond Bar, Calif.] or EnSite NavX system [St. Jude Medical, St. Paul, Minn.]) uses a single mapping catheter attached to a system that can precisely localize the catheter tip in 3-D space and store activation time on a 3-D anatomical reconstruction.1,45 Electroanatomical mapping permits spatial discrimination between sites separated by less than 1 mm.
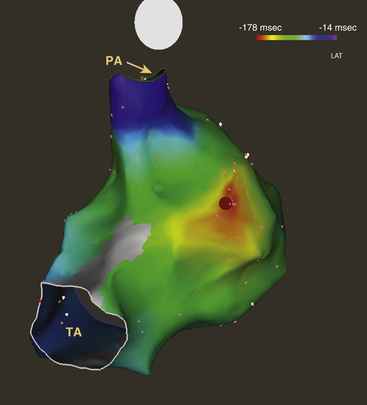
At the outset, the plane of the HB location and pulmonic valve are defined and tagged to outline the superior and inferior limits of the RVOT. The mapping catheter is advanced superiorly in the RVOT until no discrete bipolar electrograms are seen in the distal electrode pair. The catheter then is retracted until electrograms in the distal electrode pair reappear and pacing results in capture of the RVOT endocardium. This marks the level of the pulmonic valve. At least three points are acquired and tagged to construct the pulmonic valve.22 Next, a detailed electroanatomical activation map of the RVOT is constructed by acquiring multiple points during PVCs or VT. The local activation time at each site is determined from the intracardiac bipolar electrogram and is measured in relation to the fixed reference electrogram (surface QRS or intracardiac electrogram). Points are added to the map only if stability criteria in space and local activation time are met. The end-diastolic location stability criterion is less than 2 mm and the local activation time stability criterion is less than 2 milliseconds. Activation maps display the local activation time by a color-coded overlay on the reconstructed 3-D geometry (see Fig. 23-12). The electroanatomical maps of focal VT demonstrate radial spreading of activation, from the earliest local activation site (red in CARTO, white in NavX) in all directions (a well-defined early activation site surrounded by later activation sites).
Noncontact Mapping
The spatial and temporal resolution of point-by-point activation mapping is limited by the number of contact electrodes and the time required. When VT is hard to induce or of short duration, simultaneous multisite data acquisition can help map the VT focus. The biggest advantage of noncontact endocardial mapping is its ability to recreate the endocardial activation sequence from simultaneously acquired multiple data points over a few (theoretically one) tachycardia beats, without requiring sequential point-to-point acquisitions. More detailed mapping, however, is necessary to find the precise site to ablate.3,47
The EnSite 3000 noncontact mapping system (St. Jude Medical, St. Paul, Minn.) consists of a noncontact catheter (9 Fr) with a multielectrode array (MEA) surrounding a 7.5-mL balloon mounted at the distal end. To create a map, the balloon catheter is advanced over a 0.035-inch guidewire under fluoroscopic guidance and positioned in the RVOT. The balloon is then deployed; it may be filled with contrast dye, permitting it to be visualized fluoroscopically (Fig. 23-13). The balloon is positioned in the center of the RVOT and does not come in contact with the endocardial walls being mapped. Systemic anticoagulation is critical to prevent thromboembolic complications; intravenous heparin is usually administered to maintain the activated clotting time (ACT) at 250 to 300 seconds.3
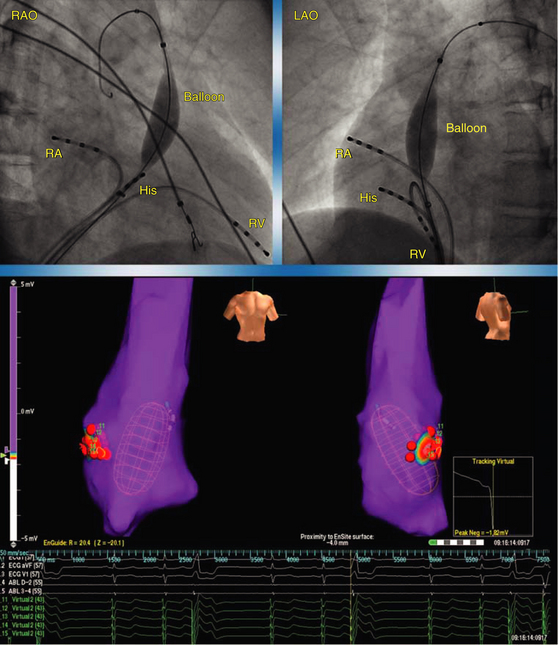
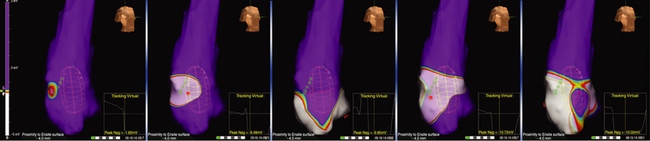
The MEA simultaneously acquires multiple data points over a few tachycardia beats or PVCs. The system then reconstructs over 3360 unipolar electrograms simultaneously and superimposes them onto the computer-generated model of the RVOT, producing isopotential maps with a color range representing voltage amplitude. The highest chamber voltage is at the site of origin of the electrical impulse (see Video 8  ). Color settings are adjusted so that the color range matches 1 to 1 with the millivolt range of the electrogram deflection of interest. The color scale for each isopotential map is set so that white indicates the most negative potential and blue indicates the least negative potential. Activation can be tracked on the isopotential map throughout the cycle to the onset of the tachycardia beat. Wavefront propagation can be displayed as a user-controlled 3-D movie (Fig. 23-14).3,47
Basket Catheter Mapping
Basket catheters have been used successfully to guide ablation of idiopathic VT arising from the RVOT, and are of particular interest in patients with infrequent arrhythmia that limits mapping. This mapping catheter consists of an open-lumen catheter shaft with a collapsible, basket-shaped distal end, which is composed of 64 electrodes mounted on eight flexible, self-expanding, equidistant metallic splines (each spline carrying eight ring electrodes; see Fig. 4-4). The electrodes are equally spaced 4 or 5 mm apart, depending on the size of the basket catheter used (with diameters of 48 or 60 mm, respectively). Each spline is identified by a letter (from A to H) and each electrode by a number (from 1 to 8), with electrode 1 having the distal position on the splines.3
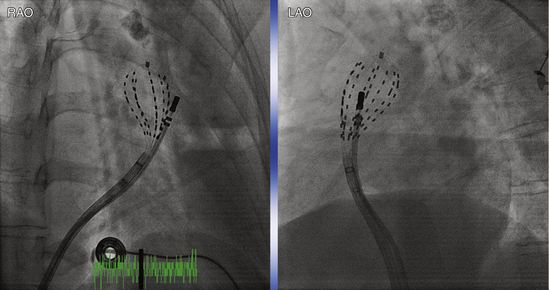
The size of the RV is initially evaluated (usually with echocardiography) to help select the appropriate size of the basket catheter. The collapsed basket catheter is advanced under fluoroscopic guidance through an 11 Fr long sheath into the RV; the basket is then expanded. After basket catheter deployment, the conventional catheters are introduced and positioned in standard positions (Fig. 23-15). Several observations can help determine electrical-anatomical relations of the basket catheter electrodes, including fluoroscopically identifiable markers (spline A has one marker and spline B has two markers located near the shaft of the basket catheter) and electrical signals recorded from certain electrodes (e.g., ventricular, atrial, or HB electrograms), which can help identify the location of those particular splines.
Basket catheter mapping is not commonly used because of several limitations. Most basket catheters are difficult, if not impossible, to steer; thus, positioning in the RVOT can be challenging. In addition, firm contact with the tip of the basket and RVOT myocardium can induce ectopic complexes that mimic spontaneous VT or PVCs. Spatial sampling is limited by the interspline and interelectrode distances, and endocardial contact is often limited because of the complex geometry of the ventricles. A second catheter is still required to be manipulated to the site identified for more precise localization of the target for ablation as well as RF energy delivery.3
Ablation
Target of Ablation
The ablation target site is defined as the site where the earliest endocardial activation time during VT or PVCs and exact or best pace map matches can be obtained. Activation mapping and pace mapping are highly correlated techniques and both methods are typically used to select ablation sites—the more confirmatory information, the more likely the site of origin will fall within the range of the RF lesion produced (see Fig. 23-10). There is little objective evidence to support the widely held notion that pace mapping provides superior spatial resolution for localizing idiopathic outflow tract VT, compared with activation mapping.3,45
Ventricular Tachycardias Originating in the Right Ventricular Outflow Tract
To map the RVOT via the femoral vein, the mapping catheter is advanced into the mid-RV. From there, a sharp clockwise torque directs the catheter toward the anterior portion of the RVOT. The mapping catheter is then advanced into the proximal pulmonary artery and slowly withdrawn into the RVOT until the first local endocardial electrogram is recorded. This site is just below the pulmonic valve, and is at the level where most RVOT VTs originate.1,6 It is important to avoid trying to advance the catheter when its tip is perpendicular to the RVOT, because this can result in perforation and cardiac tamponade. Torque is applied to the catheter for circumferential mapping of the RVOT within 1 cm of the pulmonic valve. The plane of the septum in the LAO view is nearly perpendicular to the imaging plane. Delineating the boundaries within which mapping will be carried out is useful, rather than discovering after several minutes of mapping that more tissue lies in one direction or another from where efforts had previously been concentrated. A second catheter positioned at the proximal HB, midanterior septum, or both helps in accurate localization, because “septal” sites are almost always within the same vertical plane or further rightward relative to these catheter positions in the LAO view.
For mapping of the posterior portion of the RVOT, the catheter needs to be flexed posteriorly and counterclockwise torque applied. Such application of counterclockwise torque, however, will tend to pull the electrodes back into the RV inflow portion. Using a long guiding sheath in the RV may offer adequate catheter stability. Additionally, mapping of the posterior RVOT wall can be facilitated by advancing the mapping catheter retrogradely into the right aortic sinus (see below), which lies immediately anterior to the RVOT (see Fig. 23-3).8,9 Also, it is important to carefully analyze the electrogram at the site of early activation on the RVOT to see if a far-field pattern is seen. Mapping the supravalvular aortic cusp can be necessary if the earliest signal is far field in character near the posterior portion of the pulmonic valve.8
Based on the results of activation and pace mapping at these initial sites, and guided by surface QRS morphology, attention is then directed to sites of early activation and best pace map matches. If very thorough mapping in the RVOT fails to localize the VT site of origin, mapping is extended into the pulmonary artery. It is important to resist the temptation to ablate the earliest site in a given chamber unless all of the different chambers have been mapped or unless the unipolar electrogram displays a QS morphology concordant with the earliest bipolar electrogram and the pace map at the site of earliest activation matches perfectly.44
Ventricular Tachycardias Originating in the Left Ventricular Outflow Region
If very thorough mapping and ablation in the RVOT and pulmonary artery fail to localize or terminate the tachycardia, and recordings from distal CS or great cardiac or anterior interventricular veins suggest LV origin, the femoral artery is cannulated. The catheter is advanced to the descending aorta and, in this position, a tight J curve is formed with the catheter tip before passage to the aortic root to minimize catheter manipulation in the arch. In a 30-degree RAO view, the curved catheter is advanced through the aortic valve with the J curve opening to the right, so the catheter passes into the LV oriented anterolaterally (see Fig. 4-9). The straight catheter tip must never be used to cross the aortic valve because of the risk of leaflet damage or perforation, and also because the catheter tip can slip into the left or right coronary artery or a coronary bypass graft, mimicking entry to the LV and causing damage to these structures. A long vascular sheath can provide added catheter stability. Anticoagulation should be started once the LV is accessed (intravenous heparin, 5000-unit bolus followed by a 1000-unit infusion is usually used), to maintain the ACT between 250 and 300 seconds.3
The catheter is carefully manipulated in the LVOT until an early ventricular electrogram is recorded and pace mapping shows a QRS identical to the clinical VT morphology. Pace mapping at these sites often requires high output pacing. Other parts of the LV can occasionally harbor the focus of the VT (Fig. 23-16).
Ventricular Tachycardias Originating in the Aortic Cusps
When mapping the sinuses of Valsalva, it is important to consider the entire surface of each of the cusps as well as the corresponding area just beneath the valve, as distinct activation times and pace maps are obtained from each point. Additionally, myocardial extensions can exist between the right and left cusps, and mapping and ablation of these sites usually require the catheter prolapsed below the valve and flexed onto the great arterial wall for contact and then gently pulled up into this intercuspal region.8,44
Fluoroscopy alone or in combination with a 3-D electroanatomical mapping system may not be sufficient to facilitate comprehensive mapping of the supravalvular region, and intracardiac echocardiographic (ICE) imaging or contrast aortography is typically used. ICE imaging can be particularly useful in identifying mapping-ablation catheter location (see Video 20). Longitudinal views are best to appreciate the relationship of the RVOT and LVOT and for identifying the ostia of the coronary arteries. A cross-sectional view is of most value in identifying the cusps themselves (Fig. 23-17). Once the three cusps are visualized, the interatrial septum will be seen in immediate relationship to the noncoronary cusp. Rightward and anterior to the noncoronary cusp and immediately behind the RVOT lies the right coronary cusp. Another landmark for the right coronary cusp is that the septal and anterior leaflets of the tricuspid valve will meet at the junction between the right and noncoronary cusps. The left coronary cusp is identified as being leftward and anterior to the noncoronary cusp and in close relation to the anterior leaflet of the mitral valve.8,44
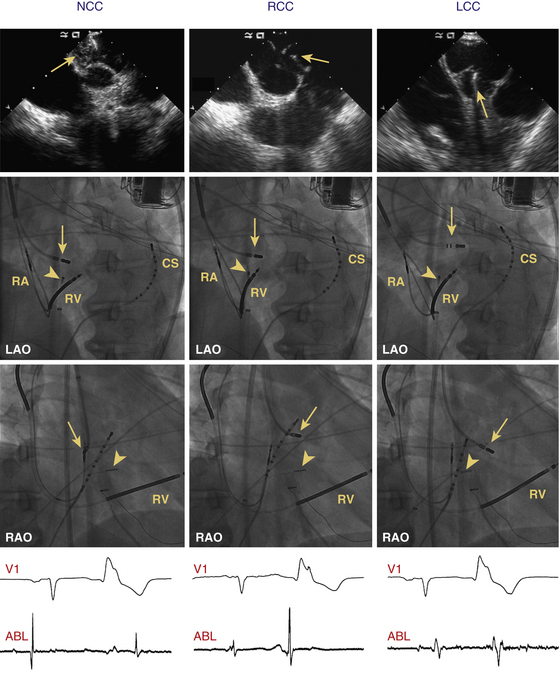
In some VTs originating from the aortic cusps, a preferential conduction to the RVOT may render pace mapping less reliable. Therefore, when the local ventricular activation does not precede the QRS onset of the VT or PVCs adequately or RF ablation is not effective in the RVOT, despite obtaining a good pace map, mapping of the aortic cusp should be considered. On the other hand, in one report, 27% of patients with VTs with an aortic cusp origin had the local ventricular activation in the RVOT preceding the QRS onset of the VT or PVCs. Therefore, when a good pace map is not obtained or RF ablation is not effective in the RVOT, despite the fact that local ventricular activation adequately precedes the QRS onset of the VT or PVCs, mapping of the aortic cusp should be considered.36
A catheter positioned at the RV HB region can be very useful in catheter ablation of aortic cusp VTs. It can be used as a landmark for mapping within the noncoronary and right coronary cusps, where the proximity of the to the HB should be kept in mind to avoid inadvertent damage to the AV conduction system. Additionally, the local ventricular activation time relative to the QRS onset at the HB region in the RV can be an electrophysiological clue for differentiating VT origins in the aortic root. The activation time in the HB region is usually significantly earlier during PVCs originating from the right versus the left coronary cusp, suggesting that the activation from the right coronary cusp may propagate to the ventricular septum and RV before the LV free wall, whereas that from the left coronary cusp may do so after part of the LV free wall activates (Fig. 23-18). The local ventricular activation time relative to the QRS onset at the RV HB region is typically significantly greater for the VTs with origins from left coronary cusp and the junction of the right and left coronary cusps than for those from the noncoronary and right coronary cusps.16
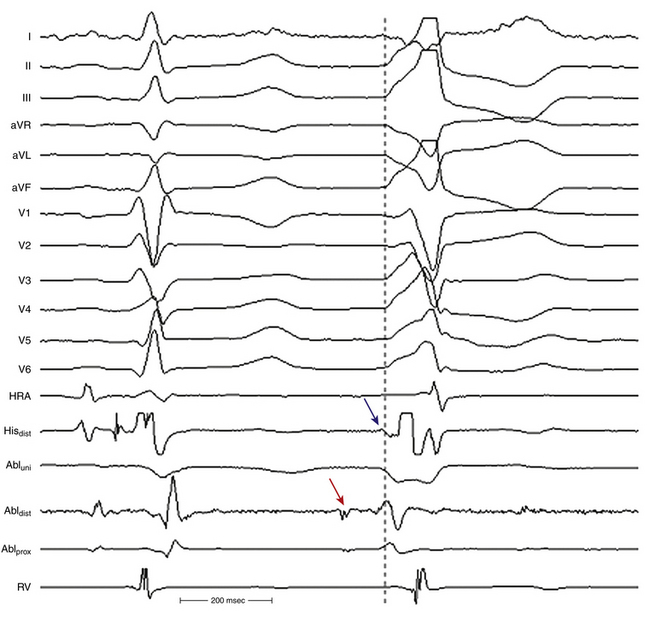
When the left coronary cusp site appears early but ablation is unsuccessful, the posterior supravalvular pulmonary artery region and the anterior interventricular ring and branches should be mapped. Sometimes the LA appendage, which lies close to the posterior pulmonary artery laterally, can be mapped and in rare instances ablated for supravalvular tachycardia. Similarly, the superior vena cava medially lies close to the supravalvular portions of the ascending aorta above the right coronary cusp.9
When the earliest ventricular activation is identified in an aortic cusp, it is preferable to insert a 5 Fr pigtail catheter into the aortic root through the left femoral artery. The aortic root and the ostia of the right coronary artery and left main coronary artery are visualized by aortic root angiography.9,22 Selective angiography of the coronary arteries may also be performed with the ablation catheter positioned at the desired location so as to assess the anatomical relationships between these structures and the location of the ablation catheter. If the origin of VT is in the left coronary cusp, it is preferable to cannulate the left main coronary artery with a 5 Fr left Judkin catheter, which serves as a marker and for protection of the left main coronary artery in case of ablation catheter dislodgment during RF application.48 Alternatively, a combination of electroanatomical mapping and ICE imaging (usually appreciated in the longitudinal view of the LVOT) may be used to confirm anatomical location, catheter tip position and contact, and distance to coronary vasculature and to monitor RF delivery.35,44
Right Coronary Cusp
The recorded electrogram from the right coronary cusp typically shows a large ventricular electrogram, which represents activation of the overlying relatively thick posterior wall of the RVOT infundibulum (see Fig. 23-17). Because this tissue is immediately adjacent to the anterior portion of the right coronary cusp, the electrogram may appear near field, and the site of early activation can be difficult to distinguish between arrhythmia origination from the myocardium extending above this cusp.8 Nonetheless, during PVCs originating from the right coronary cusp itself, a smaller and relatively fragmented but near-field electrogram will be observed to precede the large ventricular electrogram and results from activation of the small myocardial sleeve extending into the cusp.
A far-field atrial electrogram may also be recorded in the right coronary cusp, particularly at more posterior locations (closer to the noncoronary cusp), and represents atrial activation of the anteroseptal tricuspid annulus, the RA appendage, or both.8,49
On fluoroscopy, a catheter positioned in the right coronary cusp (using the retrograde approach) will point rightward in the LAO projection and anterior in the RAO projection. When the fluoroscopic view appears to suggest right cusp position but a large atrial electrogram is noted, the catheter should be manipulated with clockwise torque to see whether the atrial electrogram becomes larger. If so, the catheter is likely to be in the noncoronary cusp and the fluoroscopic images are misleading, perhaps because of atrial enlargement or counterclockwise rotation of the heart. In this setting, withdrawal of the catheter followed by application of counterclockwise torque and then advancing the catheter again will move the catheter from the noncoronary cusp to the right coronary cusp.8
Left Coronary Cusp
Electrograms obtained in the left coronary cusp are the most variable of the aortic cusps, but typically the ventricular electrogram amplitude is larger than that of the atrial electrogram. More anteriorly close to the commissure with the right coronary cusp, a large ventricular electrogram, again originating in the posterior RVOT, can be recorded (see Fig. 23-17). More leftward and posteriorly, however, because of the aortomitral continuity, recorded ventricular electrograms are small and far field in nature. In the RAO fluoroscopic view, as the catheter is rotated counterclockwise in the left coronary cusp, a relatively larger but usually far-field atrial electrogram is located representing LA activation close to the anteroseptal mitral annulus.49
Noncoronary Cusp
A large near-field atrial electrogram is typically recorded in the noncoronary cusp, which represents activation of the thick myocardium of the interatrial septum located immediately posterior to the midportion of the noncoronary cusp (see Fig. 23-17).49 When the catheter is rotated leftward and rightward from the interatrial septum, electrograms from the LA and RA, respectively, are recorded. A far-field ventricular electrogram may also be recorded from the noncoronary cusp and, depending on the exact catheter location, this smaller electrogram may reflect ventricular activation of the posterior LVOT, anteroseptal tricuspid annulus, or supravalvular myocardial activation.8
On fluoroscopy, a catheter positioned in the noncoronary cusp will point posteriorly in the RAO projection. In the LAO projection, however, the noncoronary cusp can be difficult to distinguish from the left coronary cusp because both appear to be somewhat leftward. When counterclockwise torque is applied and a large near-field atrial electrogram is seen, catheter location in the noncoronary cusp is verified. As discussed previously, ICE imaging can also help to clarify catheter location. The probe should be placed close to the tricuspid annulus and directed leftward. If the catheter tip is located in a cusp and the interatrial septum can be visualized in the same plane, noncoronary cusp location can be determined. If the tricuspid valve anterior leaflet is visualized along with the RVOT, then the catheter tip is probably in the right coronary cusp and simply directed posteriorly. Again, a simple maneuver of counterclockwise torque on the catheter while visualizing fluoroscopically and with ICE will result in a large ventricular electrogram being recorded and thus identifying catheter location in the right coronary cusp.9
Ventricular Tachycardias Originating from the Left Ventricular Papillary Muscles
RF catheter ablation of these VTs is particularly challenging, likely secondary to the complex structure of the papillary muscles as well as the relatively deep VT origins within the thick muscle.32
Generally, large-tip (8-mm) or irrigated-tip ablation catheters and RF lesions in a relatively wide area and, not infrequently, on both sides of the papillary muscle are required to completely eliminate the VT. This is likely related to either poor catheter contact with the tissue or a relatively deep focus of the VT. ICE can be helpful in these cases and can facilitate catheter navigation and positioning.32
Sites with the earliest endocardial activation and matching pace maps are targeted by ablation. Purkinje potentials often (in 40% of patients) can be observed at successful ablation sites. However, pace mapping alone is usually insufficient to guide successful ablation. The site of origin of VT can be located deep within the papillary muscle and away from the breakout site; although the latter site can be recognized as the site with the best pace map, ablation there may not eliminate the VT.31,32,50
In up to 50% of patients, LV papillary muscle VTs exhibit variable QRS morphologies spontaneously, after the initial RF ablation lesions, or both, likely related to different directions of propagation of the wavefront exiting the papillary muscle.32
Epicardial Idiopathic Ventricular Tachycardias
The anterior and lateral portions of the RVOT are fairly thin. Thus, ablation from the endocardium is usually effective, even when VT foci occur on the epicardial surface. The posterior RVOT (infundibulum) is much thicker, but the epicardial surface of the posterior infundibulum is the LVOT, and thus ablation may be effective from either the LVOT or the RVOT for arrhythmias arising deep in the myocardium of the posterior RVOT.15
For the supravalvular aortic region there is no true epicardial location because the RVOT lies anterior to the right and left coronary cusps and the atria lie posterior to the noncoronary cusp.15
On the other hand, idiopathic VTs can originate from the LV epicardium in up to 14% of patients with idiopathic VT. Epicardial idiopathic VTs typically arise in close proximity to the coronary venous system, including the anterior interventricular vein (which runs in the anterior interventricular sulcus parallel to the left anterior descending coronary artery), the great cardiac vein (which runs in the left AV groove parallel to the left circumflex coronary artery and forms the CS once it is joined by the left atrial oblique vein of Marshall and the posterolateral vein of the LV), the junction of the anterior interventricular and great cardiac veins (near the bifurcation of the left coronary artery), and less commonly the middle cardiac vein (which runs with the posterior descending coronary artery in the posterior interventricular groove).3,39
The region of the epicardial surface of the LV near the bifurcation of the left main coronary artery that is bounded by an arc from the left anterior descending coronary artery (superior to the first septal perforating branch) and the left circumflex coronary artery occupies the most superior portion of the LV and has been termed the LV summit (Fig. 23-19). This region is the most common site of idiopathic epicardial LV VT origins. The LV summit is bisected by the great cardiac vein into an inferior portion, lateral to this structure (which is accessible to epicardial catheter ablation) and a superior region that is inaccessible to catheter ablation because of the close proximity of the coronary arteries and the thick layer of epicardial fat that overlies the proximal portion of these vessels.51
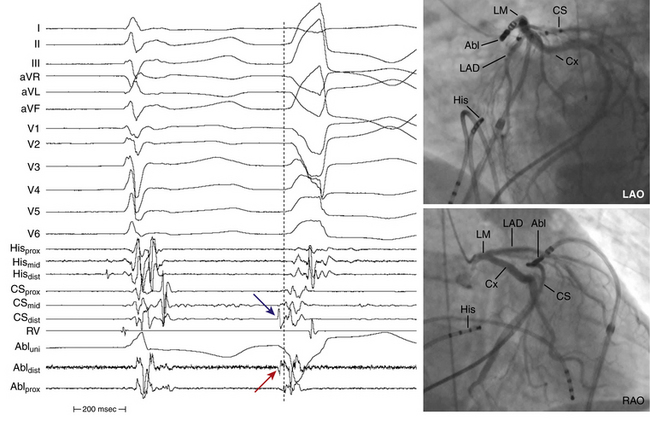
LV summit VTs are most commonly ablated within the great cardiac or anterior interventricular veins.8 Epicardial mapping via the coronary venous system can be achieved with small (2.5 Fr), flexible, multipolar electrode catheters introduced through a guiding catheter positioned at the CS ostium. CS venography is typically required to help delineate its anatomy and to visualize the great cardiac and anterior interventricular veins. Once the catheter is positioned at the target site, and before RF energy delivery, coronary arteriography should be performed to outline the spatial relationship between the target vein and the adjacent coronary artery (see Fig. 23-19). After ablation, coronary arteriography should be performed to rule out damage to coronary arteries. Additionally, pacing from the distal ablation electrode should be performed at an output of 20 mA. If diaphragmatic capture can be demonstrated, then ablation should not be attempted to avoid phrenic nerve injury.38,39
However, epicardial mapping and ablation via the coronary venous system can be challenging. Currently available ablation catheters often are difficult to advance beyond the distal great cardiac vein or the proximal portions of the middle cardiac vein because of the tortuosity, sharp angulation, and small caliber of the distal veins. Additionally, with conventional 4-mm electrodes, delivery of more than 10 to 15 W seldom is possible because of limited electrode cooling, leading to a rapid rise in electrode temperature, although even low power often is sufficient. Given those difficulties, the percutaneous epicardial approach may offer potential advantages for mapping and ablation of those VTs. The latter approach provides access to the entire epicardial surface and the deployment of a greater range of ablation catheters and energy sources, although technical challenges related to access and the insulating effects of epicardial fat remain.38,39 Nonetheless, despite these technical challenges, ablation of idiopathic VT via the coronary venous system appears to be at least as effective as with a percutaneous transthoracic approach, which has a reported success rate of approximately 70%. Using the coronary venous system for mapping and ablation may result in a lower complication rate because damage to the RV or extracardiac structures is less likely to occur. Percutaneous epicardial mapping and ablation may be considered in patients with epicardial VTs when ablation from within the coronary venous system in not feasible (see Chap. 27 for detailed discussion).
Radiofrequency Energy Delivery
Because outflow tract VTs are focal in nature and the target tissue consists of structurally nondiseased myocardium, extensive tissue injury is usually not necessary for successful ablation. Steerable catheters with 4- or 5-mm-tip electrodes and conventional nonirrigated energy application are generally used. RF applications at moderate temperatures (target temperature, 55°C) and a maximal power output of 30 to 40 W seem to be safe and effective. Duration of energy application should not exceed 30 to 60 seconds.13 Rarely, if ever, does one need more than 50 W or use of irrigated or large-tip electrodes to ablate outflow tract VTs successfully, and it is preferable to avoid those ablation approaches to prevent cardiac perforation. Some investigators recommend the use of lower target temperatures and irrigated electrodes for left-sided idiopathic focal VT, assuming a higher risk of coagulum formation and thromboembolic complications compared with ablation in the RV.3,44
Several measures must be taken to avoid injuring the coronary arteries during ablation of VTs arising from the coronary cusps. RF energy delivery in the aortic sinuses is preferably started at a low power output (15 W) and then increased to no more than 30 W to achieve a target temperature of approximately 50°C. Ablation should also be performed during continuous fluoroscopy to observe for catheter dislodgment, and energy delivery should be discontinued in case of even minimal dislodgment from the site showing the best mapping findings. RF application should also be stopped if the repetitive or sustained VT cannot be terminated after 10 seconds. Coronary angiography is often performed immediately after the ablative procedure to exclude coronary artery spasm, dissection, or thrombus.
RF delivery at successful ablation sites often can result in a rapid ventricular response (identical QRS morphology to that of VT), followed by gradual slowing and complete resolution (Fig. 23-20). This finding has a high specificity, but low sensitivity, for successful ablation sites.1 When RF is delivered during VT, termination of VT at successful sites usually occurs within 10 seconds.
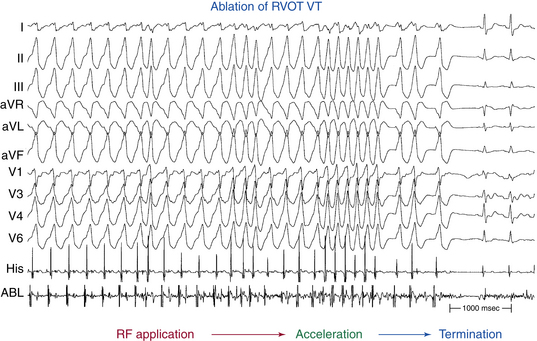
Typically, a few (range, 2 to 11; mean, 5) RF applications are required. Occasionally, following several RF applications, the first VT morphology is no longer seen but a second, similar one is now observed. This can be caused by an actual second focus near the first or modification of the exit site from the first focus (Fig. 23-21). In this situation, ablation within 1 to 2 cm of the first site eliminates the second VT morphology.
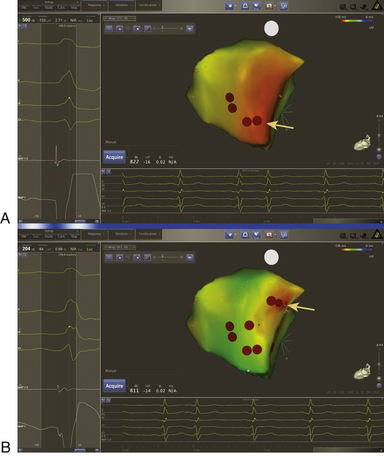
Outcome
Complications are rare. RBBB develops in 2% and cardiac tamponade is rare. Systemic thromboembolism and damage to the aortic valve can occur during ablation of LVOT or aortic cusp VTs.3
The potential for acute coronary artery occlusion is a major risk consideration with catheter manipulation within the aortic cusps. Damage to the coronary arteries can result from catheter manipulation and ablation in the aortic root, secondary to RF energy delivery in close proximity to the ostia of the right or left coronary arteries as well as inadvertent catheter engagement of the left main coronary artery when ablating in the left coronary cusp. It is also important to recognize the potential risk of coronary artery damage when ablating in the RVOT and pulmonary artery. The right coronary artery is typically 4 to 5 mm away from the proximal part of the RVOT near the free wall, and is separated by a variable amount of fat. Additionally, the cephalocaudal separation of the pulmonic and aortic valve results in close proximity of the pulmonic valve to the origin of the right coronary artery, and the left main coronary artery lies in immediate posterior proximity to the subvalvular RVOT near the pulmonic valve as well as the supravalvular pulmonary artery. Thus, when concern exists about possibly damaging the artery, the ablation catheter should be kept where energy delivery is to be given, and either a root aortogram, coronary angiography, or careful ICE imaging should be performed.9
The penetrating HB lies at the membranous septum formed in part by the commissure between the right coronary and noncoronary cusps. Ablation at this site could potentially damage the HB. The HB electrogram can be obtained at several supravalvular locations including the right coronary cusp posteriorly, the noncoronary cusp anteriorly, and when the electrode has been prolapsed below the plane of the semilunar valve in between these two cusps. During VT, however, the His potential can be inscribed within the ventricular electrogram as a result of retrograde activation to the HB.9 Therefore, when ablating in the depths of the noncoronary cusp, particularly toward the junction with the right coronary cusp, monitoring for fast pathway damage (AH interval prolongation, junctional beats) is advisable.
Cryoablation
Initial experience suggests cryocatheter techniques to be a potent tool in treating idiopathic RVOT VT.52 A major advantage of cryoablation is the virtual absence of pain, which makes the use of analgesia unnecessary. Moreover, reasonable fluoroscopy and procedure times can be achieved by an experienced investigator. Stability of the catheter during cryoablation can be advantageous because monitoring of catheter position by fluoroscopy is not necessary. Adhesion of the catheter, however, requires precise positioning before the start of cryoablation. Slight dislocations, as may easily occur with breathing, can delay ablation success. Furthermore, brushing of the catheter within a small, defined area, as often observed with RF ablations, cannot occur; therefore, repositioning of the catheter to adjust for a dislocation is not possible during cryoablation. The cryocatheter differs substantially in size and rigidity from standard RF catheters and requires some experience in handling.
Given the high success rate and low risk of RF ablation of outflow tract VT, it may be difficult to demonstrate a clinical advantage of cryoablation over RF ablation. Cryoablation can be useful in difficult or atypical sites when a maximal stability of the catheter is necessary—for example, to avoid dislodgment of the catheter into the coronary arteries during ablation of idiopathic VT originating from the aortic cusps. Additionally, cryoablation may be considered for elimination of epicardial VTs from within the coronary venous system, when RF energy delivery is limited. Also, the absence of pain during ablation may render the procedure more comfortable for the patient, especially when the use of sedative medications suppresses inducibility of the VT.38,39
1. Lerman B.B. Ventricular tachycardia in patients with structurally normal hearts. In: Zipes D.P., Jalife J., editors. Cardiac electrophysiology: from cell to bedside. ed 5. Philadelphia: WB Saunders; 2009:657-668.
2. Aliot E.M., Stevenson W.G., Mendral-Garrote J.M., et al. EHRA/HRS Expert Consensus on Catheter Ablation of Ventricular Arrhythmias: developed in a partnership with the European HeartRhythm Association (EHRA), a Registered Branch of the European Society of Cardiology (ESC), and the HeartRhythm Society (HRS); in collaboration with the American College of Cardiology (ACC) and the American Heart Association (AHA). Heart Rhythm. 2009;6:886-933.
3. Natale A., Raviele A., Al-Ahmad A., et al. Venice Chart International Consensus document on ventricular tachycardia/ventricular fibrillation ablation. J Cardiovasc Electrophysiol. 2010;21:339-379.
4. Markowitz S.M., Lerman B.B. Mechanisms of focal ventricular tachycardia in humans. Heart Rhythm. 2009;6(Suppl 8):S81-S85.
5. Iwai S., Cantillon D.J., Kim R.J., et al. Right and left ventricular outflow tract tachycardias: evidence for a common electrophysiologic mechanism. J Cardiovasc Electrophysiol. 2006;17:1052-1058.
6. Josephson M.E. Recurrent ventricular tachycardia. In: Josephson M.E., editor. Clinical cardiac electrophysiology. ed 4. Philadelphia: Lippincott Williams & Wilkins; 2008:446-642.
7. Kim R.J., Iwai S., Markowitz S.M., et al. Clinical and electrophysiological spectrum of idiopathic ventricular outflow tract arrhythmias. J Am Coll Cardiol. 2007;49:2035-2043.
8. Asirvatham S.J. Correlative anatomy for the invasive electrophysiologist: outflow tract and supravalvar arrhythmia. J Cardiovasc Electrophysiol. 2009;20:955-968.
9. Tabatabaei N., Asirvatham S.J. Supravalvular arrhythmia: identifying and ablating the substrate. Circ Arrhythm Electrophysiol. 2009;2:316-326.
10. Bala R., Marchlinski F.E. Electrocardiographic recognition and ablation of outflow tract ventricular tachycardia. Heart Rhythm. 2007;4:366-370.
11. Ho S.Y. Anatomic insights for catheter ablation of ventricular tachycardia. Heart Rhythm. 2009;6(Suppl 8):S77-S80.
12. Anderson R.H. Clinical anatomy of the aortic root. Heart. 2000;84:670-673.
13. Rillig A., Meyerfeldt U., Birkemeyer R., et al. Catheter ablation within the sinus of Valsalva—a safe and effective approach for treatment of atrial and ventricular tachycardias. Heart Rhythm. 2008;5:1265-1272.
14. Piazza N., de Jaegere.P., Schultz C., et al. Anatomy of the aortic valvar complex and its implications for transcatheter implantation of the aortic valve. Circ Cardiovasc Interv. 2008;1:74-81.
15. Suleiman M., Asirvatham S.J. Ablation above the semilunar valves: when, why, and how? Part I. Heart Rhythm. 2008;5:1485-1492.
16. Yamada T., McElderry H.T., Doppalapudi H., et al. Idiopathic ventricular arrhythmias originating from the aortic root prevalence, electrocardiographic and electrophysiologic characteristics, and results of radiofrequency catheter ablation. J Am Coll Cardiol. 2008;52:139-147.
17. Alasady M., Singleton C.B., McGavigan A.D. Left ventricular outflow tract ventricular tachycardia originating from the noncoronary cusp: electrocardiographic and electrophysiological characterization and radiofrequency ablation. J Cardiovasc Electrophysiol. 2009;20:1287-1290.
18. Olgun H., Yokokawa M., Baman T., et al. The role of interpolation in PVC-induced cardiomyopathy. Heart Rhythm. 2011;8:1046-1049.
19. Yokokawa M., Good E., Crawford T., et al. Ventricular tachycardia originating from the aortic sinus cusp in patients with idiopathic dilated cardiomyopathy. Heart Rhythm. 2011;8:357-360.
20. Baman T.S., Lange D.C., Ilg K.J., et al. Relationship between burden of premature ventricular complexes and left ventricular function. Heart Rhythm. 2010;7:865-869.
21. Bogun F., Morady F. Ablation of ventricular tachycardia in patients with nonischemic cardiomyopathy. J Cardiovasc Electrophysiol. 2008;19:1227-1230.
22. Tanner H., Hindricks G., Schirdewahn P., et al. Outflow tract tachycardia with R/S transition in lead V3: six different anatomic approaches for successful ablation. J Am Coll Cardiol. 2005;45:418-423.
23. Betensky B.P., Park R.E., Marchlinski F.E., et al. The V2 transition ratio: a new electrocardiographic criterion for distinguishing left from right ventricular outflow tract tachycardia origin. J Am Coll Cardiol. 2011;57:2255-2262.
24. Sekiguchi Y., Aonuma K., Takahashi A., et al. Electrocardiographic and electrophysiologic characteristics of ventricular tachycardia originating within the pulmonary artery. J Am Coll Cardiol. 2005;45:887-895.
25. Tada H., Tadokoro K., Miyaji K., et al. Idiopathic ventricular arrhythmias arising from the pulmonary artery: prevalence, characteristics, and topography of the arrhythmia origin. Heart Rhythm. 2008;5:419-426.
26. Tada H., Tadokoro K., Ito S., et al. Idiopathic ventricular arrhythmias originating from the tricuspid annulus: prevalence, electrocardiographic characteristics, and results of radiofrequency catheter ablation. Heart Rhythm. 2007;4:7-16.
27. Crawford T., Mueller G., Good E., et al. Ventricular arrhythmias originating from papillary muscles in the right ventricle. Heart Rhythm. 2010;7:725-730.
28. Van H.H., Garcia F., Lin D., et al. Idiopathic right ventricular arrhythmias not arising from the outflow tract: prevalence, electrocardiographic characteristics, and outcome of catheter ablation. Heart Rhythm. 2011;8:511-518.
29. Doppalapudi H., Yamada T., McElderry H.T., et al. Ventricular tachycardia originating from the posterior papillary muscle in the left ventricle: a distinct clinical syndrome. Circ Arrhythm Electrophysiol. 2008;1:23-29.
30. Yamada T., McElderry H.T., Okada T., et al. Idiopathic focal ventricular arrhythmias originating from the anterior papillary muscle in the left ventricle. J Cardiovasc Electrophysiol. 2009;20:866-872.
31. Yamada T., Doppalapudi H., McElderry H.T., et al. Idiopathic ventricular arrhythmias originating from the papillary muscles in the left ventricle: prevalence, electrocardiographic and electrophysiological characteristics, and results of the radiofrequency catheter ablation. J Cardiovasc Electrophysiol. 2010;21:62-69.
32. Yamada T., Doppalapudi H., McElderry H.T., et al. Electrocardiographic and electrophysiological characteristics in idiopathic ventricular arrhythmias originating from the papillary muscles in the left ventricle: relevance for catheter ablation. Circ Arrhythm Electrophysiol. 2010;3:324-331.
33. Tada H., Ito S., Naito S., et al. Idiopathic ventricular arrhythmia arising from the mitral annulus: a distinct subgroup of idiopathic ventricular arrhythmias. J Am Coll Cardiol. 2005;45:877-886.
34. Yoshida N., Inden Y., Uchikawa T., et al. Novel transitional zone index allows more accurate differentiation between idiopathic right ventricular outflow tract and aortic sinus cusp ventricular arrhythmias. Heart Rhythm. 2011;8:349-356.
35. Bala R., Garcia F.C., Hutchinson M.D., et al. Electrocardiographic and electrophysiologic features of ventricular arrhythmias originating from the right/left coronary cusp commissure. Heart Rhythm. 2010;7:312-322.
36. Yamada T., Murakami Y., Yoshida N., et al. Preferential conduction across the ventricular outflow septum in ventricular arrhythmias originating from the aortic sinus cusp. J Am Coll Cardiol. 2007;50:884-891.
37. Bazan V., Gerstenfeld E.P., Garcia F.C., et al. Site-specific twelve-lead ECG features to identify an epicardial origin for left ventricular tachycardia in the absence of myocardial infarction. Heart Rhythm. 2007;4:1403-1410.
38. Daniels D.V., Lu Y.Y., Morton J.B., et al. Idiopathic epicardial left ventricular tachycardia originating remote from the sinus of Valsalva: electrophysiological characteristics, catheter ablation, and identification from the 12-lead electrocardiogram. Circulation. 2006;113:1659-1666.
39. Baman T.S., Ilg K.J., Gupta S.K., et al. Mapping and ablation of epicardial idiopathic ventricular arrhythmias from within the coronary venous system. Circ Arrhythm Electrophysiol. 2010;3:274-279.
40. Bazan V., Bala R., Garcia F.C., et al. Twelve-lead ECG features to identify ventricular tachycardia arising from the epicardial right ventricle. Heart Rhythm. 2006;3:1132-1139.
41. Hoffmayer K.S., Machado O.N., Marcus G.M., et al. Electrocardiographic comparison of ventricular arrhythmias in patients with arrhythmogenic right ventricular cardiomyopathy and right ventricular outflow tract tachycardia. J Am Coll Cardiol. 2011;58:831-838.
42. Shimizu W. Arrhythmias originating from the right ventricular outflow tract: how to distinguish “malignant” from “benign”? Heart Rhythm. 2009;6:1507-1511.
43. Corrado D., Basso C., Leoni L., et al. Three-dimensional electroanatomical voltage mapping and histologic evaluation of myocardial substrate in right ventricular outflow tract tachycardia. J Am Coll Cardiol. 2008;51:731-739.
44. Callans D.J. Catheter ablation of idiopathic ventricular tachycardia arising from the aortic root. J Cardiovasc Electrophysiol. 2009;20:969-972.
45. Azegami K., Wilber D.J., Arruda M., et al. Spatial resolution of pacemapping and activation mapping in patients with idiopathic right ventricular outflow tract tachycardia. J Cardiovasc Electrophysiol. 2005;16:823-829.
46. Kurosaki K., Nogami A., Sakamaki M., et al. Automated template matching to pinpoint the origin of right ventricular outflow tract tachycardia. Pacing Clin Electrophysiol. 2009;32(Suppl 1):S47-S51.
47. Bai R., Napolitano C., Bloise R., et al. Yield of genetic screening in inherited cardiac channelopathies: how to prioritize access to genetic testing. Circ Arrhythm Electrophysiol. 2009;2:6-15.
48. Yamada T., McElderry H.T., Okada T., et al. Idiopathic left ventricular arrhythmias originating adjacent to the left aortic sinus of valsalva: electrophysiological rationale for the surface electrocardiogram. J Cardiovasc Electrophysiol. 2010;21:170-176.
49. Sasaki T., Hachiya H., Hirao K., et al. Utility of distinctive local electrogram pattern and aortographic anatomical position in catheter manipulation at coronary cusps. J Cardiovasc Electrophysiol. 2011;22:521-529.
50. Yokokawa M., Good E., Desjardins B., et al. Predictors of successful catheter ablation of ventricular arrhythmias arising from the papillary muscles. Heart Rhythm. 2010;7:1654-1659.
51. Yamada T., McElderry H.T., Doppalapudi H., et al. Idiopathic ventricular arrhythmias originating from the left ventricular summit: anatomical concepts relevant to ablation. Circ Arrhythm Electrophysiol. 2010;3:616-623.
52. Kurzidim K., Schneider H.J., Kuniss M., et al. Cryocatheter ablation of right ventricular outflow tract tachycardia. J Cardiovasc Electrophysiol. 2005;16:366-369.
[/level-membership-for-cardiovascular-category][not-level-membership-for-cardiovascular-category]
Chapter 23 Adenosine-Sensitive (Outflow Tract) Ventricular Tachycardia
Classification
Ventricular tachycardia (VT) is usually associated with structural heart disease, with coronary artery disease and cardiomyopathy (CMP) being the most common causes. However, about 10% of patients who present with VT have no obvious structural heart disease (idiopathic VT).1 Absence of structural heart disease is usually suggested if the electrocardiogram (ECG) (except in Brugada syndrome and long QT syndrome), echocardiogram, and coronary arteriogram collectively are normal. Nevertheless, magnetic resonance (MR) imaging may demonstrate mild structural abnormalities and subtle areas of diminished wall motion in some patients with idiopathic VT, even if all other test results are normal. In addition, focal dysautonomia in the form of localized sympathetic denervation has been reported in patients with VT and no other obvious structural heart disease. Of note, idiopathic VT occasionally occurs in patients with structural heart disease, in whom the structural heart disease is not related to the VT. Furthermore, frequent or incessant idiopathic VT can be a cause of tachycardia-induced CMP.2
Several distinct types of idiopathic VT have been recognized and classified with respect to the origin of VT (right ventricle [RV] versus left ventricle [LV]), VT morphology (left bundle branch block [LBBB] versus right bundle branch block [RBBB] pattern), response to exercise testing, response to pharmacological agents (adenosine-sensitive versus verapamil-sensitive versus propranolol-sensitive VT), and behavior of VT (repetitive salvos versus sustained).3
Pathophysiology
Mechanism of Adenosine-Sensitive Ventricular Tachycardia
Most forms of outflow tract VTs are adenosine-sensitive and are thought to be caused by catecholamine-induced, cyclic adenosine monophosphate (cAMP)–mediated delayed afterdepolarizations (DADs) and triggered activity, which is supported by several tachycardia features (see Chap. 4).4 Heart rate acceleration facilitates VT initiation. This can be achieved by programmed stimulation, rapid pacing from either the ventricle or the atrium, or infusion of a catecholamine alone or during concurrent rapid pacing. Additionally, termination of the VT is dependent on direct blockade of the dihydropyridine receptor by calcium channel blockers or by agents or maneuvers that lower cAMP levels (e.g., by activation of the M2 muscarinic receptor with edrophonium or vagal maneuvers, inhibition of the beta-adrenergic receptor with beta blockers, or activation of the A1 adenosine receptor with adenosine). Furthermore, a direct relationship exists between the coupling interval of the initiating ventricular extrastimulus (VES) or ventricular pacing cycle length (CL) and the coupling interval of the first VT beat. Additionally, VT initiation is CL-dependent; pacing CLs longer or shorter than a critical CL window fail to induce VT. This critical window can shift with changing autonomic tone.1,5,6
Types of Adenosine-Sensitive Ventricular Tachycardia
Approximately 90% of idiopathic VTs are caused by one of two phenotypic forms of adenosine-sensitive VT. Repetitive monomorphic VT is the most common form (60% to 90%) and is characterized by frequent premature ventricular complexes (PVCs), couplets, and salvos of nonsustained VT, interrupted by brief periods of normal sinus rhythm (NSR; Fig. 23-1). This form of VT usually occurs at rest or following a period of exercise, and typically decreases during exercise, but can be incessant.1 On the other hand, paroxysmal exercise-induced VT is characterized by sustained episodes of VT precipitated by exercise or emotional stress, separated by long intervals of NSR with infrequent PVCs (Fig. 23-2).1 Evidence has suggested that both types represent polar ends of the spectrum of idiopathic VT caused by cAMP-mediated triggered activity, and there is considerable overlap between the two types. Furthermore, this subtype classification, although useful, is not necessarily precise and depends on the means and duration of rhythm recordings. Patients are typically categorized based on their presenting or index arrhythmia. Prolonged telemetry and long-term ambulatory ECG recordings have demonstrated that most patients with one subtype of outflow tract VT show evidence for at least one other subtype with an identical morphology. Almost all patients with nonsustained VT have high-density repetitive runs and frequent PVCs. In patients who present with repetitive PVCs, nonsustained VT can also be observed in approximately 70%; however, only 20% of these patients develop runs of more than five beats.7
Anatomical Considerations
Adenosine-sensitive idiopathic VT usually arises from outflow tracts (most frequently from the RV outflow tract [RVOT]). Other variants of outflow tract VT (with similar underlying electrophysiological [EP] mechanism) include ventricular arrhythmias arising from the aortic cusps, pulmonary artery, mitral or tricuspid inflow tracts, papillary muscles, and epicardial foci in close proximity to the coronary venous system.3 Understanding the unique and complex anatomical relationships of the outflow tracts is critical for analyzing the ECG and mapping findings during outflow tract VT as well as for safe catheter maneuvering and ablation.
Right Ventricular Outflow Tract
The RVOT is the tubelike portion of the RV cavity above the supraventricular crest, and is defined superiorly by the pulmonic valve and inferiorly by the RV inflow tract and the top of the tricuspid annulus (the region of the His bundle [HB] and proximal right bundle branch). The lateral aspect of the RVOT region is the RV free wall. The RVOT passes cephalad in a posterior and slightly leftward direction. The medial aspect is formed by the anterior interventricular septum at the base of the RVOT and RV musculature opposite to the anterior LV outflow region (LVOT) (as a cephalad continuation of the interventricular septum) and the root of the aorta (immediately adjacent to the right coronary cusp) at the region just inferior to the pulmonic valve (Fig. 23-3).8
Although the medial aspect of the RVOT is frequently referred to as the “septal” wall, it should be noted that the outflow tract per se is not part of the interventricular septum, and the septum is a component only of the most proximal part of the RVOT at the branch point of the septomarginal trabeculation. Above this area, the RVOT curves to pass anterior and cephalad to the LVOT, and, therefore, any perforation in the septal part is more likely to go outside the heart than into the LV (Fig. 23-4).
From the coronal view above the pulmonic valve, the RVOT region is seen wrapping around the LVOT and the root of the aorta and extending leftward (see Fig. 23-3). Whereas the inflow portion of the RV lies to the right and anterior to the inflow portion of the LV, the RVOT courses anterior to the LVOT such that the distal RVOT and pulmonic valve are located to the left side of the body in relationship to the aortic valve and the distal LVOT. The pulmonic valve is typically placed approximately 5 to 10 mm cephalad and to the left of the aortic valve such that the supravalvular portion of the aorta lies in immediate proximity to the portions of the pulmonic valve; immediately anterior to the aortic valve is the posterior muscular infundibular portion of the RVOT.8,9
The top of the RVOT can be convex or crescent-shaped, with the posteromedial region directed rightward and the anterolateral region directed leftward. The anteromedial aspect of the RVOT actually is located in close proximity to the LV epicardium, adjacent to the anterior interventricular vein and in proximity to the left anterior descending coronary artery. The aortic valve cusps sit squarely within the crescent-shaped posterior region of the RVOT and are inferior to the pulmonic valve (see Fig. 23-3). The most posterior aspect of the RVOT is adjacent to the region of the right coronary cusp, and the posteromedial (leftward) surface is adjacent to the anterior margin of the right coronary cusp or the medial aspect of the left coronary cusp.10 The thickness of the RVOT wall is variable, ranging from approximately 3 to 6 mm, and is thinnest in the rightward, anterior, and subpulmonic valve portions, and thickest in the posterior infundibular part that is adherent to the anterior LVOT as a cephalad continuation of the interventricular septum.8
Left Ventricular Outflow Region
Unlike the RV, the inflow and outflow tracts of the LV are at an acute angle to one another. The central location of the aortic valve places the LVOT between the mitral valve and the ventricular septum. In turn, approximately half of the aortic outlet is muscular and the other half (being the area of valvular continuity between the mitral and aortic valves) is fibrous. The curvature of the ventricular septum continuing into the free wall forms the anterosuperior wall of the LVOT. It is the deep anterior (aortic) leaflet of the mitral valve that forms the aortic-mitral curtain. The extremities of the fibrous continuity are the left and right fibrous trigones, the right trigone forming the central fibrous body. The LVOT passes underneath the RVOT in a rightward and cephalad direction pointing toward the right shoulder (see Fig. 23-4).11
Aortic Cusps
The aortic root is defined as the interface between the LV and the ascending aorta, extending from the sinotubular junction in the aorta to the basal valvular leaflets with their attachment within the LV (see Fig. 23-3). Approximately two-thirds of the circumference of the lower part of the aortic root is connected to the muscular ventricular septum, with the remaining one-third in fibrous continuity with the aortic leaflet of the mitral valve. Its components are the sinuses of Valsalva, the fibrous interleaflet triangles, and the valvular leaflets themselves. The aortic valve is composed of three symmetric, semilunar-shaped cusps. The recess of each cusp is called the “sinus of Valsalva.” The aortic (coronary) cusps are firmly anchored to the fibrous skeleton within the root of the aorta. A circular ridge on the innermost aspect of the aortic wall, at the upper margin of each sinus, is the sinotubular ridge—the junction of the sinuses and the aorta. The aortic cusps are named according to their orientation in the body—left and right (both facing the pulmonic valve anteriorly) and posterior. The left aortic sinus gives rise to the left coronary artery, and the right aortic sinus gives rise to the right coronary artery. Usually, no vessels arise from the posterior aortic sinus, which is therefore known as the noncoronary sinus. Three equally spaced sites of minimal tethering within the aortic root mark the junctions of the sinuses of Valsalva. Each sinus is associated with a leaflet of the aortic valve, whereas the junctions between the adjacent sinuses are aligned with the commissures between the aortic valve leaflets.12–14
The aortic valve is the cardiac centerpiece; it lies in contact or continuity with all four cardiac chambers and shares important proximate relationships with each of the other cardiac valves (Video 20 ). It comes into contact with the right atrium (RA), left atrium (LA), interatrial septum, RVOT, mitral valve (aortomitral continuity), pulmonic valve, tricuspid valve, and conduction system (see Fig. 23-3).8,9
The aortic root is inferior, posterior, and somewhat rightward compared with the RVOT. As noted, the posterior subpulmonic valve portions of the RVOT are immediately anterior and more proximally continuous with the anterior myocardial subaortic LVOT and more distally to the right coronary cusp. The lateral and more distal portions of the left coronary cusp lie immediately subjacent to the peripulmonic valve portions of the RVOT. In some instances, the supravalvular myocardial fibers of one outflow tract may be continuous with the other outflow tract’s infravalvular myocardium, thus forming a functional syncytium.8
The left coronary cusp lies to the left of the right coronary cusp and is related to the posterior wall of the RVOT (Fig. 23-5). The commissure between the right and left coronary cusps is just posterior to the distal RVOT and is close but caudal to the posterior pulmonic valve annulus. More leftward and posteriorly, the left coronary cusp lies in continuity with the anterior leaflet of the mitral valve (aortomitral continuity). Adjacent to this site lies the peripulmonic valve myocardium and, more laterally, the posterior lobe of the LA appendage (when present).8,9
The right coronary cusp lies immediately posterior to the relatively thick posterior infundibular portion of the RVOT. Caudally, there is continuity with the anterior LVOT, and at the level of valve insertion there is either physical continuity or very close proximity between myocardium that extends above this valve cusp, the LVOT, and the posterior RVOT. The posterior part of the right coronary cusp is adjacent to the central fibrous body, which carries within it the penetrating portion of the HB. Anteriorly, the right coronary cusp is related to the bifurcating atrioventricular (AV) bundle and the origin of the left bundle branch. The right coronary cusp does not have a direct relationship with either atrium, but lateral to the commissure with the noncoronary cusp lies the RA appendage, trunk of the right coronary artery, and a variable amount of fat.8,9
The noncoronary cusp is the most posterior of the aortic cusps, and lies immediately anterior to the interatrial septum and superior to the central fibrous body, and has the RA and LA as the posterior right and left relations, respectively (see Fig. 23-5). In fact, atrial tachycardias have reportedly been ablated from within the noncoronary cusp because of its close relationship to the atria. Caudally, like the other cusps, the noncoronary cusp is in continuity with the LVOT myocardium. Other than this site, however, it has no anatomical relationship with any other ventricular myocardium. The triangle between the noncoronary and the right coronary sinuses incorporates within it the membranous part of the septum (the location of the penetrating HB). This fibrous part of the septum is crossed on its right side by the hinge of the tricuspid valve, which divides the septum into atrioventricular and interventricular components.8,9,12,13
Because of the semilunar nature of the attachments of the aortic valvular leaflets, there are three triangular extensions of the LVOT that reach to the level of the sinotubular junction. These triangles, however, are formed not of ventricular myocardium but of the thinned fibrous walls of the aorta between the expanded sinuses of Valsalva.14
For the greater part, the aortic sinuses are made up of the wall of the aorta. However, sleeves of ventricular myocardium extend beyond the aortic valve attachments for variable distances (analogous to atrial myocardial extensions in the pulmonary veins). Whereas the right coronary cusp and the anterior portions of the left coronary cusp frequently exhibit these myocardial sleeves, the posterior portions of the left coronary cusp and the noncoronary cusp, particularly in relation to the fibrous continuity with the anterior leaflet of the mitral valve (the aortomitral continuity), are exclusively fibrous and usually devoid of myocardium.8,9,15 The noncoronary cusp at its junction of the right coronary cusp may have sleeves of ventricular myocardium and, at present, it is not clearly known whether myocardial extensions into the noncoronary cusp represent atrial or ventricular myocardium.8
Idiopathic VT can originate from the right or, more commonly, left coronary cusp, as well as from the junction of the left and right coronary cusps. The substrate of this VT likely originates from the strands of ventricular myocardium present at the bases of those cusps. In contrast, the base of the noncoronary cusp is composed of fibrous tissue and, thus, is an extremely rare site of origin of VT.16,17 However, the nature of the actual substrate being ablated has not been clearly defined. For example, the ablation electrode placed in the depth of the right coronary cusp may be mapping and ablating a focus arising from the supravalvular extension into the cusp, LVOT myocardium, or a deeper posterior RVOT myocardium.9
Pulmonary Artery
The pulmonary sinuses are not as prominent as the aortic sinuses. Nevertheless, owing to the semilunar configuration of the valvular leaflets, the hinge line of each leaflet crosses the ventriculoarterial junction at two points. Consequently, there are always small segments of myocardium of the infundibulum at the nadirs of the three sinuses. Between adjacent sinuses, the wall comprises small triangles of fibrous tissue that become incorporated into the RV when the valve closes. On the epicardial aspect, the ventriculoarterial junction is not always a sharply defined line. Extensions of ventricular myocardium into the adventitia occur in approximately 20% of individuals and have been traced to a maximal distance of 6 mm beyond the junction.11
As noted, the pulmonic and aortic valves are not at the same level (see Fig. 23-3). The pulmonic valve, the most superiorly situated of the cardiac valves, lies at the level corresponding to the third left costal cartilage at its junction with the sternum. The transverse plane of the aortic valve slopes inferiorly, away from the plane of the pulmonic valve, such that the orifice of the aortic valve faces rightward at an angle of at least 45 degrees from the median plane.11
Because of its anterior and leftward location, only the posterior and rightward parts of the pulmonary artery have important relations with other cardiac structures. Of the three cusps of the pulmonic valve, the septal (right) pulmonic cusp lies at variable distances from and sometimes adjacent to the distal portions of the RA appendage. The left pulmonic cusp, being the most superficial, lies immediately beneath the pericardium and has no other cardiac structures related to it. The posterior pulmonary cusp externally lies in the proximal portion of the left main coronary artery and the distal portions in the LA appendage. The supravalvular portion of the aorta lies close to and in some cases adjacent to the junction and surrounding parts of the right and posterior pulmonic cusps.8,9
The pulmonic valve and supravalvular portion of the pulmonary artery are well-established locations of origin for ventricular arrhythmias. As noted, ventricular myocardial sleeves extend above the semilunar valves for a variable distance (a few millimeters and up to more than 2 centimeters). Whereas the myocardial sleeves typically extend circumferentially around the pulmonic valve between and above all three cusps just above the annulus, more distally the extension is patchy and generally asymmetrical. Myocardial extensions also occur in the intercuspal clefts in addition to within the cusps.8
Clinical Considerations
Epidemiology
Approximately 60% to 80% of idiopathic VTs arise from the RV (most commonly the RVOT). RVOT VT comprises 10% of all VTs referred to an electrophysiologist. Age at presentation is usually 30 to 50 years (range, 6 to 80 years). Women are more commonly affected.1,5
Clinical Presentation
Very frequent idiopathic nonsustained VT, PVCs, or both can precipitate a reversible form of LV systolic dysfunction, similar to tachycardia-induced dilated CMP. The relationship between the LV dysfunction and VT may not be initially recognized, and those patients can present with heart failure symptoms and become diagnosed with nonischemic dilated CMP and may even undergo prophylactic implantation of a defibrillator, which unfortunately often results in delivery of inappropriate shocks triggered by frequent nonsustained episodes of idiopathic VT.2 Interpolation of the PVCs appears to predict an increased risk of PVC-induced CMP.18 Notably, in a recent report, 20% of patients with PVC-induced CMP had the PVC focus in one of the aortic cusps.19
Initial Evaluation
The diagnosis of ARVD should be carefully considered. Signal-averaged ECG, MR imaging of the RV, RV biopsy, and RV angiography are all unremarkable in idiopathic RVOT VT and help exclude ARVD. An invasive EP study is usually not necessary to establish a diagnosis, although it can occasionally help exclude other forms of tachyarrhythmias (see later).2
It is important to recognize that, in some patients, idiopathic VT can coexist with structural heart disease, including CMP, in which setting the VT is not related to the cardiac disease. On the other hand, very frequent idiopathic nonsustained VT, PVCs, or both can precipitate dilated CMP. The responsible ectopy can arise from any ventricular site, but the RVOT, being the most common type of idiopathic ventricular ectopy, is more commonly associated with ectopy-related CMP. Therefore, in patients who present with a dilated CMP of unclear etiology and who have frequent PVCs or nonsustained VT, it is important to assess the contribution of PVCs or VT to LV systolic dysfunction. A reversible form of dilated nonischemic CMP precipitated by idiopathic VT should be suspected when very frequent PVCs, nonsustained VT, or both are observed on a 24-hour Holter recording, especially when the QRS morphology is monomorphic and is suggestive of origin from the outflow tract. A PVC burden of more than 20% is present in most of those patients with tachycardia-induced CMP, but some patients have as few as 5% PVCs. In a recent report, a cutoff PVC burden of more than 24% was strongly associated with the presence of CMP. However, this cutoff value failed to identify every patient at risk of CMP, and for individual patients, the critical PVC burden can be lower. A cutoff PVC burden of more than 16% would result in a sensitivity of 90% for CMP, but the specificity would be reduced to 58%.20 Although pharmacological suppression of the PVCs, such as by amiodarone therapy, may help evaluate the relationship between the arrhythmia and CMP, the usefulness of this approach and duration of therapy required have not been defined. Often, elimination of the PVCs by catheter ablation results in improvement and resolution of LV dysfunction within a few months. Therefore, catheter ablation of the PVCs is appropriate prior to implantable cardioverter-defibrillator (ICD) implantation for primary prevention of SCD; successful elimination of the PVCs may result in improvement in LV function such that the patient no longer qualifies for an ICD.2,21
Principles of Management
Chronic Management
Long-term treatment options for outflow tract VT include medical therapy and catheter ablation. Medical therapy may be indicated in patients with mild to moderate symptoms. For patients with symptomatic, drug-refractory VT or those who are drug intolerant or who do not desire long-term drug therapy, catheter ablation is the treatment of choice. Catheter ablation is also recommended for patients with frequent PVCs or nonsustained VT when they are presumed to cause LV dysfunction, even in otherwise asymptomatic patients.2
Electrocardiographic Features
Surface Electrocardiogram
Ecg During Ventricular Tachycardia
Repetitive monomorphic VT is characterized by frequent PVCs, couplets, and salvos of nonsustained VT, interrupted by brief periods of NSR (see Fig. 23-1). Paroxysmal exercise-induced VT is characterized by sustained episodes of VT precipitated by exercise or emotional stress (see Fig. 23-2). Both types characteristically have an LBBB pattern with a right inferior (more common) or left inferior axis. The tachycardia rate is frequently rapid (CL < 300 milliseconds), but can be highly variable. A single morphology for the VT or PVCs is characteristic.1,6
Ambulatory Monitoring
Several VT characteristics can be observed on ambulatory monitoring recordings. Ventricular ectopy typically occurs at a critical range of heart rates (CL dependence). The coupling interval of the first PVC is relatively long (approximately 60% of the baseline sinus CL). A positive correlation exists between the sinus rate preceding the VT and the VT duration. Additionally, the VT occurs in clusters, and is most prevalent on waking and during the morning and later afternoon hours. The VT is extremely sensitive to autonomic influences, resulting in poor day-to-day reproducibility.1,6
Electrocardiographic Localization of Outflow Tract Ventricular Tachycardia
VTs originating from the RVOT typically display LBBB morphology with a precordial QRS transition (first precordial lead with R/S ratio >1) that begins no earlier than lead V3 and more typically occurs in lead V4. The frontal plane axis, precordial R/S transition, QRS width, and complexity of the QRS morphology in the inferior leads can more precisely indicate the origin of VT within the RVOT. Most RVOT VTs originate from the anterosuperior aspect of the leftward (“septal”) aspects, just under the pulmonic valve. These tachycardias produce a characteristic 12-lead ECG appearance with tall positive QRS complexes in leads II, III, and aVF and large negative complexes in leads aVR and aVL. The QRS morphology in lead I typically is multiphasic and has a net QRS vector of zero or is only modestly positive (see Fig. 23-2).
However, not all VTs with a QRS morphology of LBBB and inferior or normal axis can be ablated successfully from the RVOT. Some VTs originate in the subaortic LV (LVOT, 10% to 15% of adenosine-sensitive VTs), above the pulmonic valve (i.e., from muscle tracts in the pulmonary artery), and occasionally in the aortic root. Idiopathic RV VTs with a superior QRS axis generally originate in the body of the RV on the anterior free wall, or in the mid- and distal septum (Table 23-1).
TABLE 23-1 Estimation Indexes of Right Ventricular Outflow Tract Ventricular Tachycardia Origins by 12-Lead ECG*
It is important to recognize that the prediction of the precise origin of outflow tract VT can still be challenging because of the close anatomical relationship of the different anatomical compartments of the outflow tract area. For example, an R/S transition zone in precordial lead V3 is common in patients with idiopathic outflow tract VT, with a prevalence of up to 58%. The prevalence of R/S transition in lead V3 in RVOT VT is not statistically different from VT originating outside the RVOT; therefore, the predictive value for this ECG criterion is low. Approximately 50% of outflow tract tachycardias with an R/S transition in V3 could be successfully ablated from the RVOT; however, one study has shown that a significant proportion of patients need different anatomical approaches for successful RF catheter ablation using up to six different anatomical accesses, including the LV, the aortic sinus of Valsalva, the coronary sinus (CS), the pulmonary artery, and the epicardium via a percutaneous pericardial puncture.22
Right Ventricular Outflow Tract Versus Left Ventricular Outflow Region
The absence of an R wave in lead V1 and precordial transition zone in lead V4, V5, or V6 predicts an RVOT origin. On the other hand, the presence of an R wave in leads V1 and V2 and RS transition in leads V1 or V2 are characteristic of an LVOT origin (Figs. 23-6 and 23-7). Because of the continuity between the posterior RVOT and the anterior LVOT, a very similar R wave in lead V3 may be seen with arrhythmia that originates in either structure, and R/S transition in lead V3 is not specific. In the latter setting, a precordial R/S transition during VT that is earlier than that during NSR argues against an LVOT origin. Additionally, comparing the R wave amplitude divided by total QRS amplitude (i.e., R/[R + S]) in lead V2 during VT with that during NSR can help distinguish between LVOT and RVOT origins in patients with lead V3 precordial transition. A transition ratio (R/[R + S]VT ÷ R/[R + S]NSR) of at least 0.60 is highly suggestive of an LVOT origin.23 Furthermore, a QS complex in lead I is also suggestive of subaortic LV origin.8,22
“Septal” Versus Free Wall Right Ventricular Outflow Tract
QRS duration less than 140 milliseconds, monophasic R wave without notching (i.e., no RR′ or Rr′) in leads II and III, and early precordial transition (by lead V4) suggest a septal origin. On the other hand, the triphasic RR′ or Rr′ waves in VT of free wall origin probably reflect the longer QRS duration and the phased excitation from the RV free wall to the LV (see Fig. 23-6).
Left (Anteromedial Attachment) Versus Right (Posterolateral Attachment) Side of The Right Ventricular Outflow Tract
In general, a QS complex in lead I is generated from sites at or near the anterior medial aspect of the RVOT (the most leftward portion of the RVOT in the supine anteroposterior orientation). As the site of origin moves rightward, on either the posterior or the anterior wall, R waves appear in lead I and become progressively dominant and the QRS axis becomes more leftward. Similarly, a QS amplitude in aVL greater than that in aVR suggests an origin in the left side of the RVOT; a QS amplitude in aVR greater than that in aVL suggests an origin in the right side (see Fig. 23-6).
Superior Versus Inferior Right Ventricular Outflow Tract
The R wave amplitude tends to be larger in leads V1 and V2 at superior and leftward sites; as the site of origin shifts to the right or inferiorly, there is a trend toward lower right precordial R wave amplitude and a shift in the precordial transition zone to the left. Furthermore, R wave amplitude in lead V2 or “r” wave amplitude in leads V1 and V2 greater than 0.2 mV suggests a superior origin. Additionally, the closer the origin to the pulmonic valve, the more rightward and inferior the axis (i.e., R wave taller in lead III than in lead II) because of the anatomical leftward location of the pulmonic valve and lead III being an inferior and rightward lead; the more posterior and inferior the origin, the more leftward the axis (see Fig. 23-6). Also, lead aVL (being a left-sided lead) becomes isoelectric or slightly positive as the site of origin moves inferiorly (close to the HB region), whereas aVR (being a right-sided lead) remains negative.8
Ventricular Tachycardias Arising above the Pulmonic Valve
Because of the superior and leftward location of these sites, VTs arising above the pulmonic valve are associated with a small but definite vector toward the right, resulting in a small initial R wave in lead V1. Additionally, suprapulmonic origins exhibit a strong right inferior frontal plane axis (a QS or rS wave in lead I, large R waves in II, III, aVF, and deep QS complexes in aVR and aVL, with the R wave being taller in lead III than in lead II and the S wave being deeper in aVL than in aVR). Those VTs also tend to display an R/S ratio in lead V2 and R wave amplitude in inferior leads that are significantly larger than those in RVOT VT.8,9,24 However, moderate overlap exists between VTs originating above the pulmonic valve and RVOT VTs, and because the RVOT is the exit site of VT arising from the pulmonary artery, discriminating between the two groups using ECG parameters can be difficult.25
Ventricular Tachycardias Arising from the Tricuspid Annulus
VTs arising from the tricuspid annulus demonstrate LBBB morphology and positive QRS polarity in leads I, V5, and V6. In contrast to VTs arising from the RVOT, no positive QRS polarities in any of the inferior leads characterize VTs arising from the tricuspid annulus. No negative component of the QRS complex is found in lead I, and the R wave magnitude in lead I is typically greater in VTs arising from the tricuspid annulus than those arising from the RVOT.26 Additionally, VTs arising from the tricuspid annulus have an rS or QS pattern in lead aVR, just as those arising from the RVOT; however, in lead aVL, a QS or rS pattern is rare (8%), and the QRS polarity in lead aVL is positive in almost all VTs arising from the annulus (89%), in contrast to those arising from the RVOT.26
Ventricular Tachycardias Arising from the Right Ventricular Papillary Muscles
RV papillary muscle VTs display LBBB morphology with a QS or rS pattern in lead V1 and a wider QRS complex and more prevalent notching than in RVOT VT. VTs arising from the anterior and posterior papillary muscles are frequently associated with a superior axis and a late R wave transition in the precordial leads (later than lead V4), whereas septal papillary muscle VTs more often display an earlier precordial transition (in lead V4 or earlier) and an inferior axis (due to the more basal insertion of the septal compared with the anterior and posterior papillary muscles). More than one PVC or VT morphology can be present in a significant proportion of patients with papillary muscle VTs.27 Compared with origins from the septum, VTs from the free wall exhibit longer QRS duration and deeper S waves in leads V2 and V3.28
Ventricular Tachycardias Arising from the Left Ventricular Papillary Muscles
VT can also arise from posterior or anterior papillary muscles. The QRS morphology during VT has an RBBB pattern with either left superior (posterior papillary muscle) or rightward inferior (anterior papillary muscle) axis.29,30 The ECG features are very similar in the LV papillary muscle and fascicular VTs; nonetheless, in contrast to fascicular VT, papillary muscle VT has a broader QRS complex (150 ± 15 milliseconds versus 127 ± 11 milliseconds). Additionally, all fascicular VTs, versus none of papillary muscle VTs, had an rsR′ pattern in lead V1. An R/S ratio not exceeding 1 in lead V6 for VTs in the LV anterolateral region also suggests papillary muscle VT.31 Furthermore, spontaneous variations in QRS morphology occur relatively frequently during VTs originating from the LV papillary muscles, a feature that can help distinguish these VTs from LV fascicular VT, the latter being a reentrant tachycardia with a consistent QRS morphology.32
Other Left Ventricular Sites of Origin
VT can originate from multiple LV sites, including the subaortic LV, the superior basal region of the left interventricular septum, papillary muscle, aortomitral continuity, mitral annulus, aortic cusps, and epicardial sites in the region of the great cardiac and anterior interventricular veins. Most of these sites of origin are associated with an LBBB pattern and inferior axis. A basal LV septal origin is suggested by LBBB morphology associated with an early precordial transition in lead V1 or V2. An origin from the aortomitral continuity is associated with RBBB morphology and broad monophasic R waves across the precordial leads. As the origin moves laterally along the mitral annulus, the R wave in lead I and in the inferior leads decreases in amplitude. LVOT free-wall VTs have an early transition and persistent dominant R wave across the precordium, with a small or absent S wave out to the apex (see Fig. 23-7). The R wave in V2 is broad and occupies a greater percentage of the QRS width than RVOT VTs. LVOT VT can occasionally have an epicardial site of origin. This form is associated with an R wave in lead V1, S wave in lead V2, precordial transition in leads V2 to V4, deep QS in lead aVL, and tall R wave in the inferior leads. Contrariwise, an R wave in lead V2 taller than in leads V1 or V3 suggests an origin in the so-called crux of the heart, near the posterior descending artery.1,33
Ventricular Tachycardias Arising from the Aortic Cusps
For LVOT VT, the absence of an S wave in leads V5 or V6 suggests a supravalvular origin, whereas the presence of such waves is consistent with an infravalvular origin (see Fig. 23-7). An R wave in lead aVL may exclude an origin in the left or right aortic cusp.16
[/not-level-membership-for-cardiovascular-category]
